Magnetic accretion flow explains the hysteresis q-diagram seen in outbursts of black hole low-mass X-ray binaries
Abstract
Black hole low-mass X-ray binaries undergo quiescence-outburst cycles. During the outbursts, they typically go through a q-shaped pattern in the hardness-intensity diagram (HID), known as the hysteresis q-diagram, while the physical nature is still unknown. We argue that the hysteresis q-diagram can be well explained with a recently proposed magnetized accretion disk model. The model takes into account the saturated magnetic pressure and predicts that the standard Shakura-Sunyaev disk (SSD) has an inner truncation at relatively low accretion rates, filled with an advection-dominated accretion flow (ADAF) inside. Given a perturbation of accretion rate, the variation of the truncation radius can be derived as a result of thermal equilibrium by comparing the heating and cooling rates. We show that the truncation radius displays a hysteresis effect in response to the variation of mass accretion rate. As a result, the spectral hardness due to competition of the soft SSD and hard ADAF components is also hysteresis along with the rise and decay of the mass accretion rate or source intensity, leading to a q-shaped diagram in the HID.
1 Introduction
Black hole low-mass X-ray binaries (BH-LMXBs) are powered by accretion onto stellar mass black holes from a stellar companion (Frank et al., 2002). They mostly stay in the quiescent state with very low luminosities, but some of them may exhibit major outbursts, during which the luminosity can increase by orders of magnitude. In the outburst, BH-LMXBs display complex spectral and timing behaviors in the X-ray band, with correlated multi-wavelength properties, classified into different emission states (Fender & Belloni, 2004; Homan & Belloni, 2005; Remillard & McClintock, 2006; Done et al., 2007; Corral-Santana et al., 2016).
Despite complicated state transitions in the outburst, their spectral evolution may trace a common pattern in the X-ray hardness-intensity diagram (HID; Homan & Belloni, 2005). If one extracts the source count rate in the soft and hard bands, respectively, one may calculate the hard-to-soft flux ratio (hardness) and determine the source status in the HID along with the source count rate (intensity). The boundary between the soft and hard bands can be chosen around a few keV (Homan & Belloni, 2005), such that the hard flux represents emission from the hot corona, while the soft band contains a significant fraction of flux from the cool accretion disk. In major outbursts, BH-LMXBs typically follow a q-shaped pattern in the HID, also referred to as the hysteresis q-diagram, e.g., seen in GX 339–4 (Zdziarski et al., 2004), GRS 1915+105 (Fender & Belloni, 2004), MAXI J1820+070 (Kara et al., 2019), and MAXI J1348–630 (Tominaga et al., 2020). This suggests that the spectral properties of BH-LMXBs are not a monotonic function of the mass accretion rate, and the soft to hard transition usually happens at a much lower luminosity than the hard to soft transition (Maccarone, 2003).
To the first order of approximation, the emission state of BH-LMXBs can be understood as competition between two emission components: a soft thermal component from an optically thick, geometrically thin accretion disk, or the so-called the Shakura-Sunyaev disk (SSD; Shakura & Sunyaev, 1973), and a hard Comptonization component from the corona or advection-dominated accretion flow (ADAF; Narayan & Yi, 1994, 1995). In the hard state, many observations have revealed a disk inner radius larger than the innermost stable circular orbit (ISCO) predicted by the theory of general relativity, suggesting that the SSD may have an inner truncation (Esin et al., 2001; Zdziarski et al., 2004; Tomsick et al., 2009; García et al., 2015). Some models for disk evaporation may explain the inner disk truncation (Liu et al., 2006; Meyer et al., 2007; Qiao & Liu, 2010). A manually connected inner ADAF plus outer SSD model was proposed to reconcile with the observations (Esin et al., 1997). However, this classical view cannot naturally explain the hysteresis effect seen in the HID. There is at least another parameter besides the accretion rate responsible for the hysteresis effect (Homan et al., 2001). Weng et al. (2021) found that, after correcting for the time lag between the soft disk component with respect to the hard Comptonization component in MAXI J1348–630, the hysteresis effect disappears and the fluxes from the two components are correlated. However, it is unknown if this also occurs in other BH-LMXBs.
In this Letter, we argue that a recently proposed accretion disk model that takes into account the magnetic pressure (Huang et al., 2023a) can naturally explain the hysteresis effect seen in the outburst of BH-LMXBs.
2 Model
Here we briefly review the model of Huang et al. (2023a). Numerical simulations reveal that the magnetic pressure is the dominant component in supporting the disk vertically when the mass accretion rate is in the range of 0.01–1 times the critical mass accretion rate, which is the rate just needed to power the Eddington limit (Lančová et al., 2019; Jiang et al., 2019; Huang et al., 2023b). In the accretion process, the toroidal magnetic fields will be amplified due to dynamo of the magneto-rotational instability (MRI; Balbus & Hawley, 1991, 1998), and saturates at a pressure, , when the Alfvén velocity approaches (Pessah & Psaltis, 2005), where is the gas density, is the local Keplerian velocity, and is the gas sound speed. The saturated magnetic pressure gives a reasonable fit to the simulation results (Huang et al., 2023b).
Inspired by the simulation results, Huang et al. (2023a) proposed a new accretion disk model that takes into account the saturated magnetic pressure in addition to the gas and radiation pressures, and also outflows. The model yields a solution that the inner SSD can no longer reach thermal equilibrium at relatively low accretion rates due to insufficient radiative cooling. Instead, an ADAF solution is found at small radii. Such an outer SSD and inner ADAF configuration is no longer an assumption, but a result of global solutions of the model, and can naturally explain the observed disk truncation mentioned above.
Given a mass accretion rate, the model predicts three types of solutions at each radius, reminiscent of the canonical SSD, ADAF, and slim disk solutions (Shakura & Sunyaev, 1973; Abramowicz et al., 1988; Narayan & Yi, 1994, 1995), respectively. A solution diagram as a function of mass accretion rate and radius is shown in Figure 1, in which the pink area labeled with “SSD/ADAF” indicates that either solution may exist in this parameter space. For continuity, the connection radius between the outer SSD and inner ADAF, i.e., the truncation radius, must fall into this region. Such an alternative solution is confirmed by recent numerical simulations of a magnetically arrested disk (Scepi et al., 2024).

3 Evolution of truncation radius
In the very beginning of the outburst when the accretion rate is low, the whole accretion flow is in an ADAF mode. With the increase of mass accretion rate, the innermost region remains in ADAF while the outermost region becomes SSD. This suggests that the truncation radius falls into the SSD/ADAF (pink) region in Figure 1. Supposing that the accretion flow starts to evolve from an arbitrary location I in Figure 1, we argue that, along with the variation of mass accretion rate in a major outburst, the truncation radius shows a hysteresis effect and may follow a closed cycle in the diagram indicated by the green arrows (I II III IV I) in Figure 1.
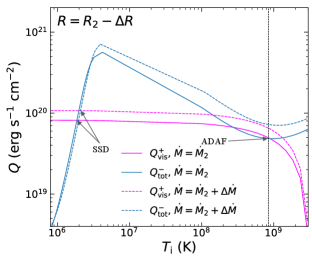
A) I–II. Given an initial truncation radius and mass accretion rate along the track I–II (marked in Figure 1), we assume a perturbation of mass accretion rate to , and examine the total heating and cooling curves as a function of ion temperature at two radii, , around the truncation radius, shown in Figure 2. At each radius, there are three interception points between the heating and cooling curves, representing three thermal equilibrium solutions, i.e., the SSD, Shapiro-Lightman-Eardley (Shapiro et al., 1976), and ADAF solutions, respectively from left to right (Huang et al., 2023a). At , the disk is in the form of ADAF before perturbation and the rightmost intersection point is the valid solution (marked by a vertical dashed line). After the perturbation, the disk is still at thermal equilibrium () at the similar ion temperature, suggesting that the disk at will remain in ADAF. At , the disk is in the form of SSD before perturbation, corresponding to the leftmost interception point, also marked by a vertical dashed line. After the perturbation, the increase of heating rate is higher than the increase of cooling rate, resulting in a higher ion temperature for thermal equilibrium, but the disk is still in SSD. Thus, the truncation radius will move along a vertical line (along I–II) in Figure 1 in response to variations of mass accretion rate.


B) II–III. When the mass accretion rate is high enough and the system moves to location II in Figure 1, i.e., the upper boundary of the ADAF/SSD region, a further tiny increase of mass accretion rate will make the truncation radius move inward along the boundary, as the truncation cannot occur in the SSD & slim (red) region. Along II-III, again, we assume an arbitrary accretion rate with a tiny increase to (marked in Figure 1). Similar to the discussions above, we also plot the heating and cooling curves at two radii just inside and outside the truncation radius (shown in Figure 3). At , the increase of cooling rate exceeds the increase of heating rate after perturbation. However, the only thermal equilibrium solution becomes the leftmost interception point, corresponding to the SSD solution. The ADAF to the left the truncation radius can no longer sustain a thermal equilibrium, and the extra radiative cooling over viscous heating causes the hot flow to condense into an SSD. Thus, the truncation radius moves inward.

C) III—IV. If the mass accretion rate starts to decrease, e.g., at location III in Figure 1, the same argument for the track I–II works here, and the truncation radius remains constant with decreasing accretion rate (along III–IV).
D) IV–I. Similarly, a further decrease of mass accretion rate at the location IV will cause the truncation radius to move outward along the lower boundary of the ADAF/SSD region (along IV–I), as the truncation cannot occur in the ADAF region.
The location III represent the highest mass accretion rate during the outburst. A higher maximum mass accretion rate leads to a smaller truncation radius toward the ISCO radius. For a failed outburst, the maximum mass accretion rate is not high enough, such that the SSD cannot grow all the way to ISCO. This has been observed in the BH-LMXB GX 339–4, which shows a large truncation radius during the decay of a failed outburst (Wang-Ji et al., 2018).
4 formation of q-diagram
It is straightforward to relate the truncation radius with spectral hardness. As mentioned above, soft X-rays originate from the SSD while hard X-rays are from the ADAF. An increasing truncation radius leads to a strengthened ADAF and weakened SSD and subsequently a harder spectrum, and vice versa. Therefore, the I–II track in Figure 1 represents a hard spectrum and III–IV corresponds to a soft spectrum. The source intensity is determined by the mass accretion rate. Therefore, the evolution of a BH-LMXB during an outburst in the HID can be summarized as follows. In the rising phase, the source enters the outburst via the low-hard state (I) and goes for the high-hard state (II), and then transitions to the high soft state (III). In the decay, the source will remain in the soft state until a relatively low luminosity (IV), before transition back to the low-hard state (I).
5 Discussion
In this Letter, we demonstrate that the recently proposed magnetic accretion disk model (Huang et al., 2023a) can naturally explain the hysteresis q-diagram seen in the outbursts of BH-LMXBs. The key or basis for the model to work is that it can predict an accretion flow comprising an inner ADAF plus an outer SSD from a global solution.
Observations show that the hysteresis effect appears only in the HID, but not in the hardness-rms diagram (Belloni, 2010; Motta et al., 2011), where the fractional rms variability is correlated with hardness. As the variability mainly originates from the ADAF component, the relative contribution of ADAF/SSD determines the fractional rms variability. Therefore, the source at the top branch (hard-to-soft transition) and the bottom branch (soft-to-hard transition) in the q-diagram shows similar fractional rms variability if the truncation radius is the same, leading to a simple correlation without hysteresis effect.
The hard-to-soft state transitions of BH-LMXBs may have different dependence on flux. The source count rate may increase (e.g. XTE 1550-564 (Dunn et al., 2010)), keep constant (e.g. GX 339-4 in the 2002/2003 outburst (Zdziarski et al., 2004), XTE J1908-094 in the 2002/2003 outburst (Göǧüş et al., 2004)), or decrease (e.g. XTE J1650-500 in the 2001/2002 outburst(Homan & Belloni, 2005)) during the hard-to-soft state transition. Our model can naturally explain the increasing flux during the hard-to-soft transition, but has difficulties in explaining the other two types. We should note that the HID intensity is represented by the count rate, but not the accretion rate that we use in our model. The accretion rate may still increase due to spectral changes or variations in different energy bands for the decreasing or constant flux cases.
Our model also implies that, during the decay in the soft thermal state, one expects a constant inner disk radius, which, however, is not necessarily the ISCO radius, if the maximum accretion rate is not high enough to push the SSD all the way into ISCO. If this is true, estimation of black hole spin based on the assumption that the disk extends all the way to ISCO in the thermal state will be problematic. We mention that this could be a caveat for a simplified 1D model.
To conclude, we find that the magnetic accretion disk model provides a reasonable explanation for the hysteresis q-diagram to the first order of approximation.
References
- Abramowicz et al. (1988) Abramowicz, M. A., Czerny, B., Lasota, J. P., & Szuszkiewicz, E. 1988, ApJ, 332, 646, doi: 10.1086/166683
- Balbus & Hawley (1991) Balbus, S. A., & Hawley, J. F. 1991, ApJ, 376, 214, doi: 10.1086/170270
- Balbus & Hawley (1998) —. 1998, Reviews of Modern Physics, 70, 1, doi: 10.1103/RevModPhys.70.1
- Belloni (2010) Belloni, T. M. 2010, in Lecture Notes in Physics, Berlin Springer Verlag, ed. T. Belloni, Vol. 794, 53, doi: 10.1007/978-3-540-76937-8_3
- Corral-Santana et al. (2016) Corral-Santana, J. M., Casares, J., Muñoz-Darias, T., et al. 2016, A&A, 587, A61, doi: 10.1051/0004-6361/201527130
- Done et al. (2007) Done, C., Gierliński, M., & Kubota, A. 2007, A&A Rev., 15, 1, doi: 10.1007/s00159-007-0006-1
- Dunn et al. (2010) Dunn, R. J. H., Fender, R. P., Körding, E. G., Belloni, T., & Cabanac, C. 2010, MNRAS, 403, 61, doi: 10.1111/j.1365-2966.2010.16114.x
- Esin et al. (2001) Esin, A. A., McClintock, J. E., Drake, J. J., et al. 2001, ApJ, 555, 483, doi: 10.1086/321450
- Esin et al. (1997) Esin, A. A., McClintock, J. E., & Narayan, R. 1997, ApJ, 489, 865, doi: 10.1086/304829
- Fender & Belloni (2004) Fender, R., & Belloni, T. 2004, ARA&A, 42, 317, doi: 10.1146/annurev.astro.42.053102.134031
- Frank et al. (2002) Frank, J., King, A., & Raine, D. J. 2002, Accretion Power in Astrophysics: Third Edition
- García et al. (2015) García, J. A., Steiner, J. F., McClintock, J. E., et al. 2015, ApJ, 813, 84, doi: 10.1088/0004-637X/813/2/84
- Göǧüş et al. (2004) Göǧüş, E., Finger, M. H., Kouveliotou, C., et al. 2004, ApJ, 609, 977, doi: 10.1086/421255
- Homan & Belloni (2005) Homan, J., & Belloni, T. 2005, Ap&SS, 300, 107, doi: 10.1007/s10509-005-1197-4
- Homan et al. (2001) Homan, J., Wijnands, R., van der Klis, M., et al. 2001, ApJS, 132, 377, doi: 10.1086/318954
- Huang et al. (2023a) Huang, J., Feng, H., Gu, W.-M., & Wu, W.-B. 2023a, ApJ, 954, 150, doi: 10.3847/1538-4357/ace71e
- Huang et al. (2023b) Huang, J., Jiang, Y.-F., Feng, H., et al. 2023b, ApJ, 945, 57, doi: 10.3847/1538-4357/acb6fc
- Jiang et al. (2019) Jiang, Y.-F., Blaes, O., Stone, J. M., & Davis, S. W. 2019, ApJ, 885, 144, doi: 10.3847/1538-4357/ab4a00
- Kara et al. (2019) Kara, E., Steiner, J. F., Fabian, A. C., et al. 2019, Nature, 565, 198, doi: 10.1038/s41586-018-0803-x
- Lančová et al. (2019) Lančová, D., Abarca, D., Kluźniak, W., et al. 2019, ApJ, 884, L37, doi: 10.3847/2041-8213/ab48f5
- Liu et al. (2006) Liu, B. F., Meyer, F., & Meyer-Hofmeister, E. 2006, A&A, 454, L9, doi: 10.1051/0004-6361:20065430
- Maccarone (2003) Maccarone, T. J. 2003, A&A, 409, 697, doi: 10.1051/0004-6361:20031146
- Meyer et al. (2007) Meyer, F., Liu, B. F., & Meyer-Hofmeister, E. 2007, A&A, 463, 1, doi: 10.1051/0004-6361:20066203
- Motta et al. (2011) Motta, S., Muñoz-Darias, T., Casella, P., Belloni, T., & Homan, J. 2011, MNRAS, 418, 2292, doi: 10.1111/j.1365-2966.2011.19566.x
- Narayan & Yi (1994) Narayan, R., & Yi, I. 1994, ApJ, 428, L13, doi: 10.1086/187381
- Narayan & Yi (1995) —. 1995, ApJ, 452, 710, doi: 10.1086/176343
- Pessah & Psaltis (2005) Pessah, M. E., & Psaltis, D. 2005, ApJ, 628, 879, doi: 10.1086/430940
- Qiao & Liu (2010) Qiao, E., & Liu, B. F. 2010, PASJ, 62, 661, doi: 10.1093/pasj/62.3.661
- Remillard & McClintock (2006) Remillard, R. A., & McClintock, J. E. 2006, ARA&A, 44, 49, doi: 10.1146/annurev.astro.44.051905.092532
- Scepi et al. (2024) Scepi, N., Dexter, J., Begelman, M. C., et al. 2024, arXiv e-prints, arXiv:2410.12920. https://arxiv.org/abs/2410.12920
- Shakura & Sunyaev (1973) Shakura, N. I., & Sunyaev, R. A. 1973, A&A, 24, 337
- Shapiro et al. (1976) Shapiro, S. L., Lightman, A. P., & Eardley, D. M. 1976, ApJ, 204, 187, doi: 10.1086/154162
- Tominaga et al. (2020) Tominaga, M., Nakahira, S., Shidatsu, M., et al. 2020, ApJ, 899, L20, doi: 10.3847/2041-8213/abaaaa
- Tomsick et al. (2009) Tomsick, J. A., Yamaoka, K., Corbel, S., et al. 2009, ApJ, 707, L87, doi: 10.1088/0004-637X/707/1/L87
- Wang-Ji et al. (2018) Wang-Ji, J., García, J. A., Steiner, J. F., et al. 2018, ApJ, 855, 61, doi: 10.3847/1538-4357/aaa974
- Weng et al. (2021) Weng, S.-S., Cai, Z.-Y., Zhang, S.-N., et al. 2021, ApJ, 915, L15, doi: 10.3847/2041-8213/ac0a7b
- Zdziarski et al. (2004) Zdziarski, A. A., Gierliński, M., Mikołajewska, J., et al. 2004, MNRAS, 351, 791, doi: 10.1111/j.1365-2966.2004.07830.x