Current address: ]Centre for Science at Extreme Conditions, University of Edinburgh, Peter Guthrie Tait Rd, Edinburgh EH9 3FD, United Kingdom
Magnetic structure and spin wave excitations in the multiferroic magnetic metal-organic framework (CD3)2ND2[Mn(DCO2)3]
Abstract
We report the magnetic diffraction pattern and spin wave excitations in (CD3)2ND2[Mn(DCO2)3] measured using elastic and inelastic neutron scattering. The magnetic structure is shown to be a G-type antiferromagnet with moments pointing along the axis. By comparison with simulations based on linear spin wave theory, we have developed a model for the magnetic interactions in this multiferroic metal-organic framework material. The interactions form a three-dimensional network with antiferromagnetic nearest-neighbour interactions along three directions of meV, meV and meV.
I Introduction
For the past ten years there has been considerable interest in magnetoelectric multiferroics, both from the fundamental viewpoint and driven by the desire to create functional systems for modern technologies, such as multiferroic data storage Scott (2007). The search for optimal systems has revealed that traditional magnetic compounds are currently unable to provide the flexibility and complex functionality required. This has resulted in attention being turned to dense metal organic frameworks (MOFs), which present a versatile platform for the realization of complex magnets due to the high tailorability and tunability arising from their discrete molecular building-block nature Kurmoo (2009). However, the magnetic properties of such materials depend on their precise magnetic interactions, which are often poorly understood. In particular, while bulk magnetometry is routinely performed on newly reported materials, magnetic diffraction measurements are far less often reported Lawler et al. (2015), and magnetic spectroscopy is rarer still. If we are to develop magnetic MOFs for future applications it is vital that we rectify this situation, and obtain a greater understanding of the origin of their properties.
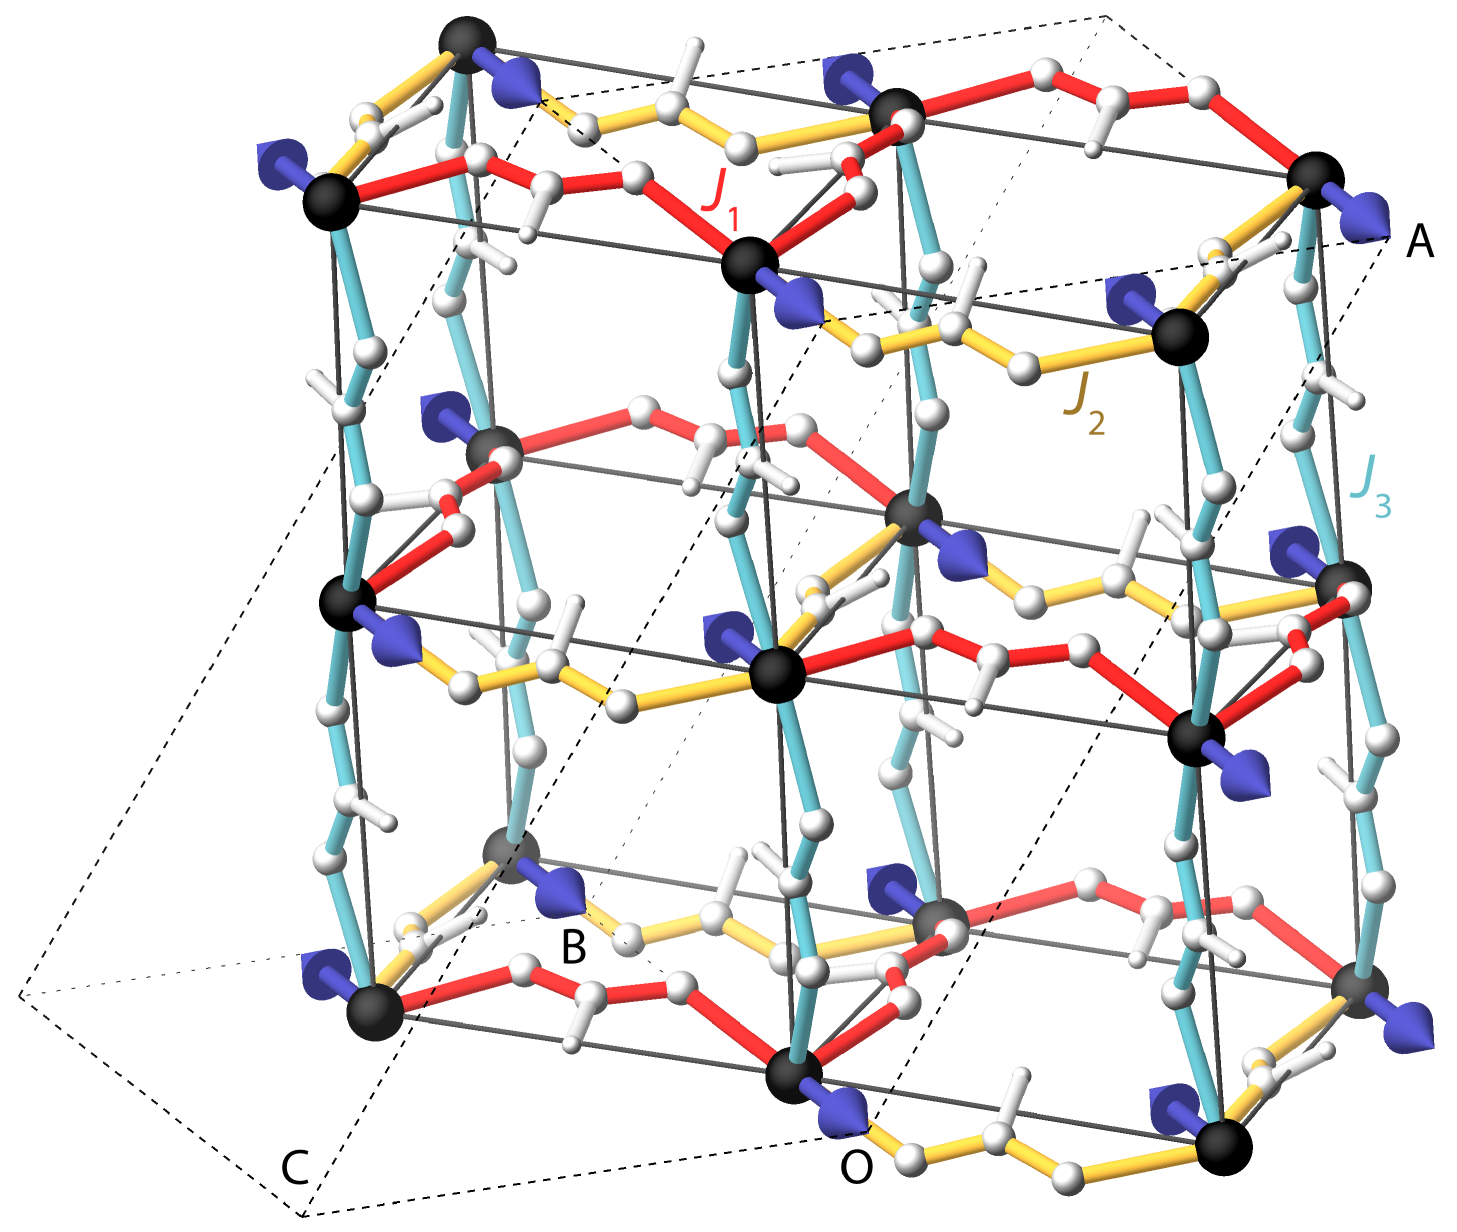
The dimethylammonium transition metal formates (DMF) are one such family of magnetic MOFs displaying intriguing magnetic properties Wang et al. (2004); Jain et al. (2008); Baker et al. (2010); Wang et al. (2013a); Yadav et al. (2016). They have a three-dimensional perovskite structure, with the dimethylammonium sitting in the pore between the formate linked oxygen octahedra coordinating the metal ions (Figure 1). Like their inorganic analogues, these materials may exhibit both electric and magnetic ordering, and their properties can be tuned by preparing solid solutions with substitution of either the metal Maczka et al. (2015, 2016) or the organic cation Kieslich et al. (2016). Understanding the origins of these materials’ electric and magnetic properties would allow this tunability to be exploited to design materials with targeted functionalities.
Transition metal ions can be linked via a variety of different bridging modes by carboxylate ions, of which formate is the smallest. The metal-carboxylate bonds are conventionally described as syn if the M–O–C–O dihedral angle is closer to zero, and anti if this angle is near to . Using this nomenclature, syn-anti geometries tend to display ferromagnetic coupling, while syn-syn and anti-anti geometries are antiferromagnetic Colacio et al. (2000). Depending on the carboxylate bridge, this can lead to 0, 1, 2 or 3 dimensional complexesWang et al. (2004). In DMF, for Mn, Co, Fe and Ni, the transition metals are connected to the six nearest neighbours via identically sized anti-anti formate bridges. The nearest neighbour coupling is therefore predicted to be antiferromagnetic and they are reported to form canted antiferromagnets below K, K, K and K respectively, resulting in weak ferromagnetism. For Co and Ni there is an additional spin reorientation at K and K respectivelyWang et al. (2004).
DMMnF is the first reported perovskite metal-organic multiferroic Jain et al. (2009). It is a type-I multiferroic, since the origin of the magnetic and electric ordering differs: the former comes from the interactions of the Mn2+ ions mediated by the formate linkers, while the latter comes from rotation of the (CH3)2NH ions within the framework. A Curie-Weiss fit to the inverse magnetic susceptibility gives an effective paramagnetic moment of consistent with that expected for Mn2+ and a negative Curie-Weiss constant of K, confirming the presence of antiferromagnetic interactions Wang et al. (2004). Based on molecular field theory, this temperature can be converted into an estimate for the exchange interaction of meV. A small hysteresis loop is observed in the isothermal magnetisation, indicating that DMMnF is a weak ferromagnet, with an estimated spin canting angle of Wang et al. (2004). The ferroelectricity is driven by hydrogen bonds forming between the dimethylammonium protons and formate group oxygens at 183 K as they undergo a structural transition from to Sánchez-Andújar et al. (2014), when the dimethylammonium cation orders into one of three sitesDuncan et al. (2016). Since the ferroelectricity is unrelated to the magnetic order, in contrast to improper ferroelectric multiferroics like TbMnO3Kimura et al. (2003); Cheong and Mostovoy (2007), and given the disparity in the two ordering temperatures, any magnetoelectric coupling is likely to be weak, and its presence or absence has been the subject of some debate Wang et al. (2013b); Abhyankar et al. (2015). It appears that there is little to no magnetoelastic effect Abhyankar et al. (2015); Thomson et al. (2012).
In this article we report the results of our powder elastic and inelastic neutron scattering study of perdeuterated dimethylammonium manganese formate. The results are compared with simulations for different exchange interaction models. Powder inelastic neutron scattering has proven to be a highly effective technique to probe magnetism in the inorganic perovskites McQueeney et al. (2008); Holbein et al. (2015), but has only rarely been used to study magnetism in formate frameworksStride et al. (2006). We show here that this technique is equally effective at revealing the behaviour of their metal-organic analogues.
II Experimental Details
A g powder sample of perdeuterated DMMnF was synthesized according to the published solvothermal methodWang et al. (2004), by heating a D2O/CDON(CD)3 solution of MnClH2O in a pressure vessel. Deuteration was necessary in order to avoid the large incoherent cross section of 1H nuclei.
Neutron diffraction measurements were performed using the GEM diffractometerHannon (2005) at the ISIS facility of the Rutherford Appleton Laboratory. The sample was contained in a thin vanadium can of diameter mm and height mm and cooled in a closed-cycle refrigerator. Data were collected at 7 and 20 K, respectively below and above the magnetic phase transition, for hours each. The raw data were reduced using MantidArnold et al. (2014) and the structural model refined from the published structure using the EXPGUI interfaceToby (2001) to GSASLarson and Von Dreele (2004).
Inelastic neutron scattering measurements were performed on the LET time-of-flight direct geometry spectrometerBewley et al. (2011), also at ISIS. The sample was contained in a thin aluminium can of diameter mm and height mm and cooled in a helium cryostat. The data were collected at a series of temperatures between and 70 K, well below the structural phase transition, for approximately 2 hr each with meV using the rep-rate multiplication methodRussina and Mezei (2009, 2010); Nakamura et al. (2009). The data were reduced using the Mantid-Plot software packageArnold et al. (2014). The raw data were corrected for detector efficiency and time independent background following standard proceduresWindsor (1981).
III Results and Discussion
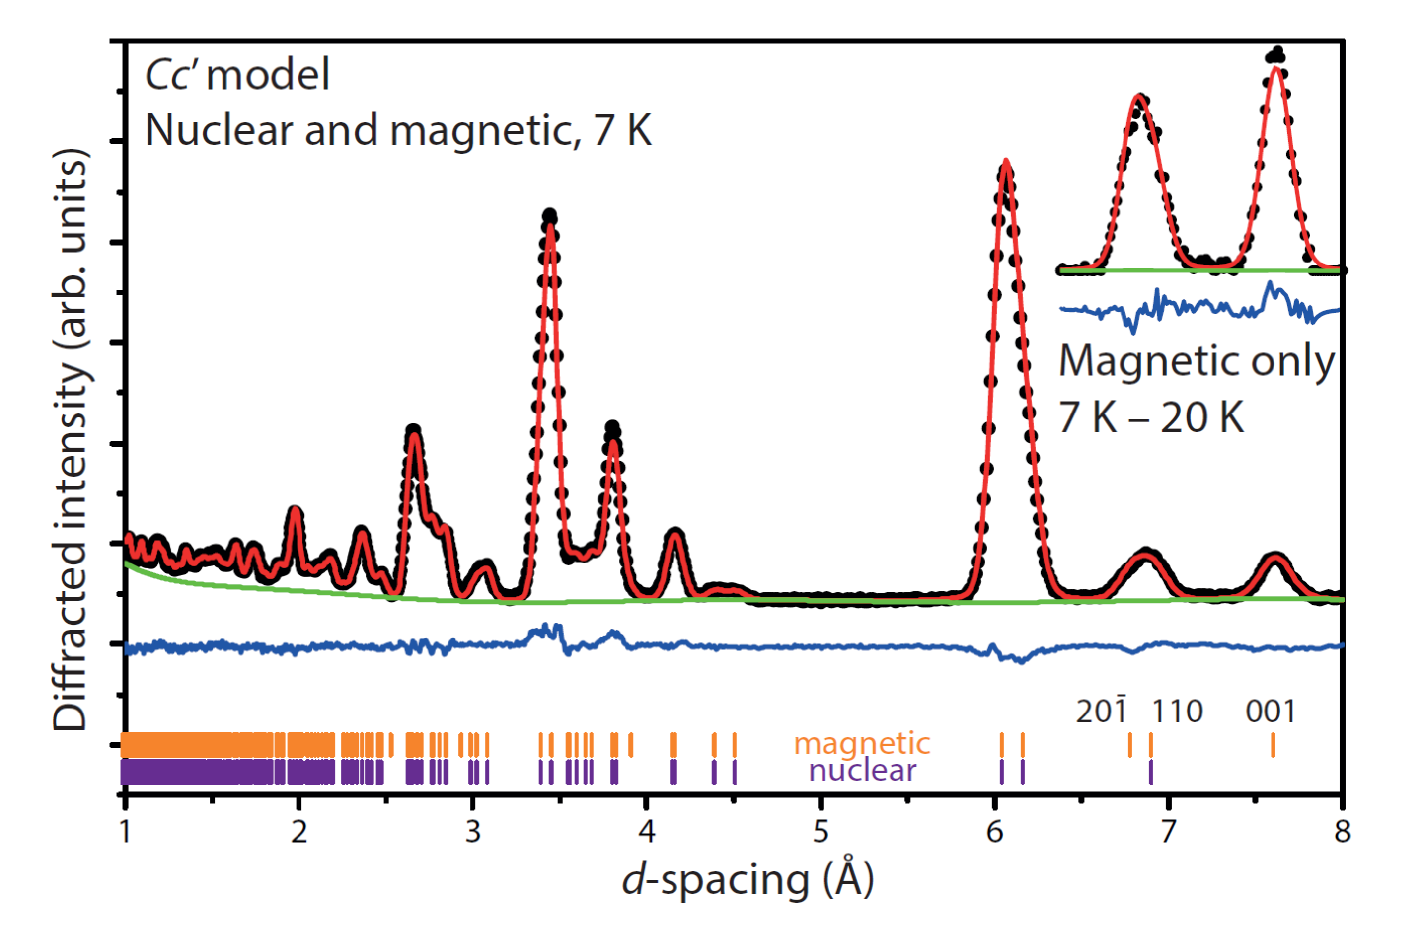
In the diffraction measurements, two clear magnetic peaks were observed (Fig. 2) on cooling below the Néel temperature. These were indexed as and the overlapping peaks and with respect to the nuclear lattice. The absence of any change to the lattice suggests a magnetic propagation vector of and reduces the choice of magnetic space group to two possibilities, and . Both of these space groups are consistent with -type (checkerboard) antiferromagnetism with respect to the pseudocubic, perovskite-like topology. For , this would correspond to a model with magnetic moment in the plane: given the strength of the peak, presumably with a substantial component. For , this would correspond to a model with magnetic moment parallel to . Of the two possibilities, a model fits the data substantially better ( K : , : ; for comparison K ). The magnetic moment refined to , considerably below the spin-only value of , suggesting sizeable fluctuations or a weak ferromagnetic component to which neutron diffraction will be only weakly sensitive. The refined magnetic structure is illustrated in Fig. 1.
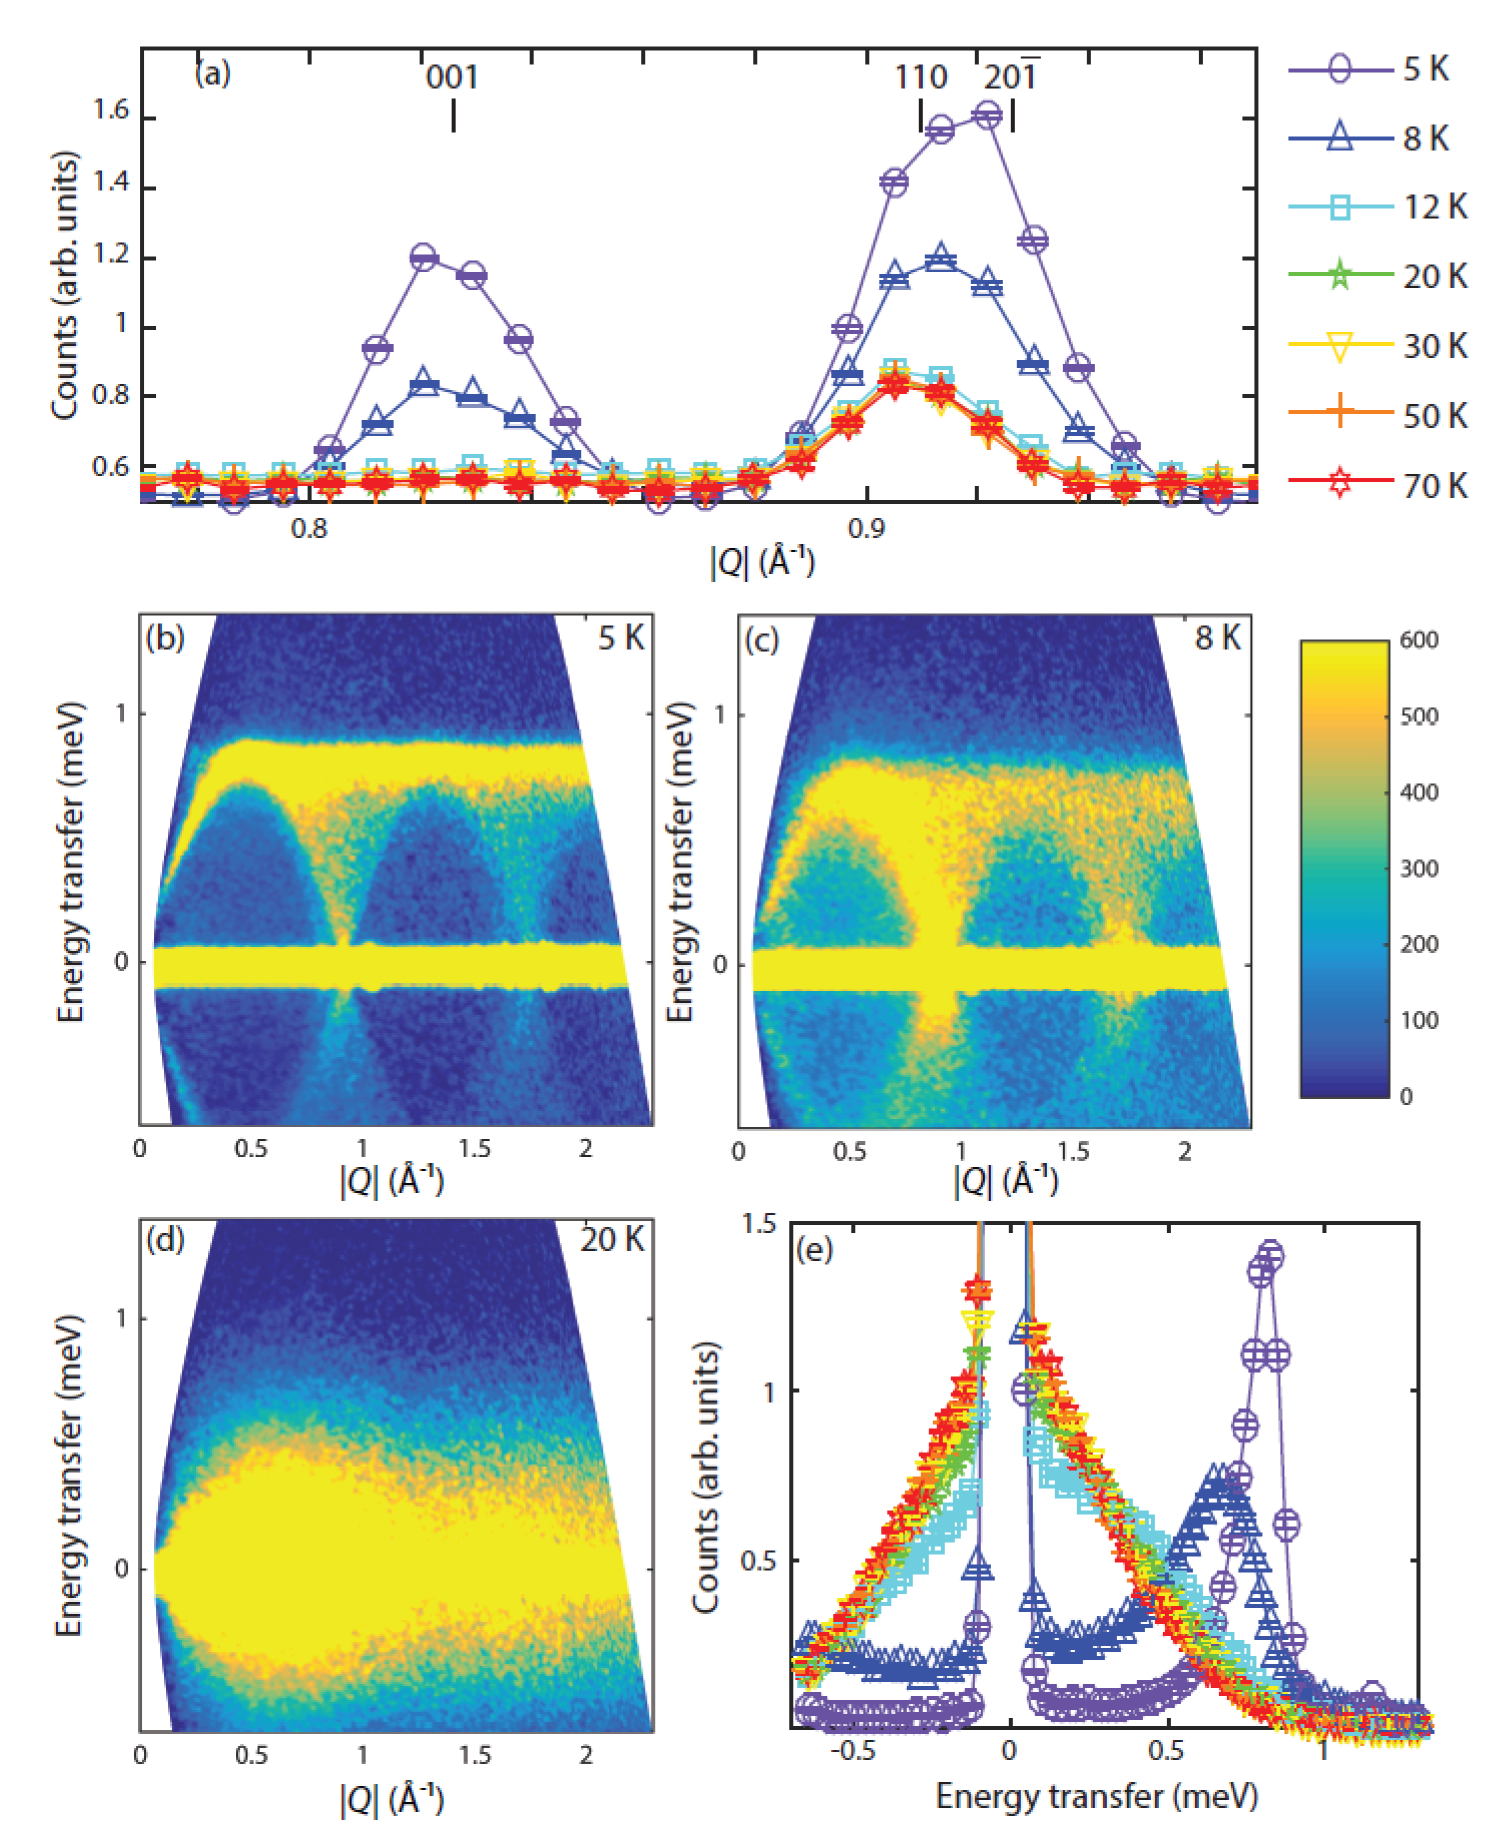
The same magnetic peaks were observed at the elastic line in the spectroscopic measurements on LET (Fig. 3(a)). The colour-coded inelastic neutron scattering intensity maps measured at selected temperatures are shown in Figure 3(b-d). At base temperature, clear spin waves emerge from the magnetic Bragg peaks at the elastic line, up to a maximum energy transfer of meV (Fig. 3(b)). No additional higher energy transfer features were observed up to a maximum of meV. For K, close to , the excitations become less distinct (Fig. 3(c)), broadening in energy and , with a lowering of the maximum energy transfer reached, and a shifting of the spectral weight to lower energy transfers. Above the previously sharply defined spin excitations appear to further broaden and shift down in energy before coalescing with a broad quasielastic signal that becomes more symmetric about the elastic line with increasing temperature (Fig. 3(e)).
In order to model the magnetic spectrum observed in the ordered phase, we calculated the spin wave dispersions, the spin-spin correlation function and the neutron scattering cross section using the SpinW programToth and Lake (2015). We used the Heisenberg magnetic Hamiltonian:
| (1) |
with three different exchange couplings for the nearest neighbour interactions, , and , between the divalent Mn ions, as shown in Fig. 1. As there is no sign of a spin gap in the spin wave spectrum, we neglected the single ion anisotropy term, which would generally open such a gap. The instrumental resolution as a function of energy transfer was estimated from the elastic line and this was included in the simulation.
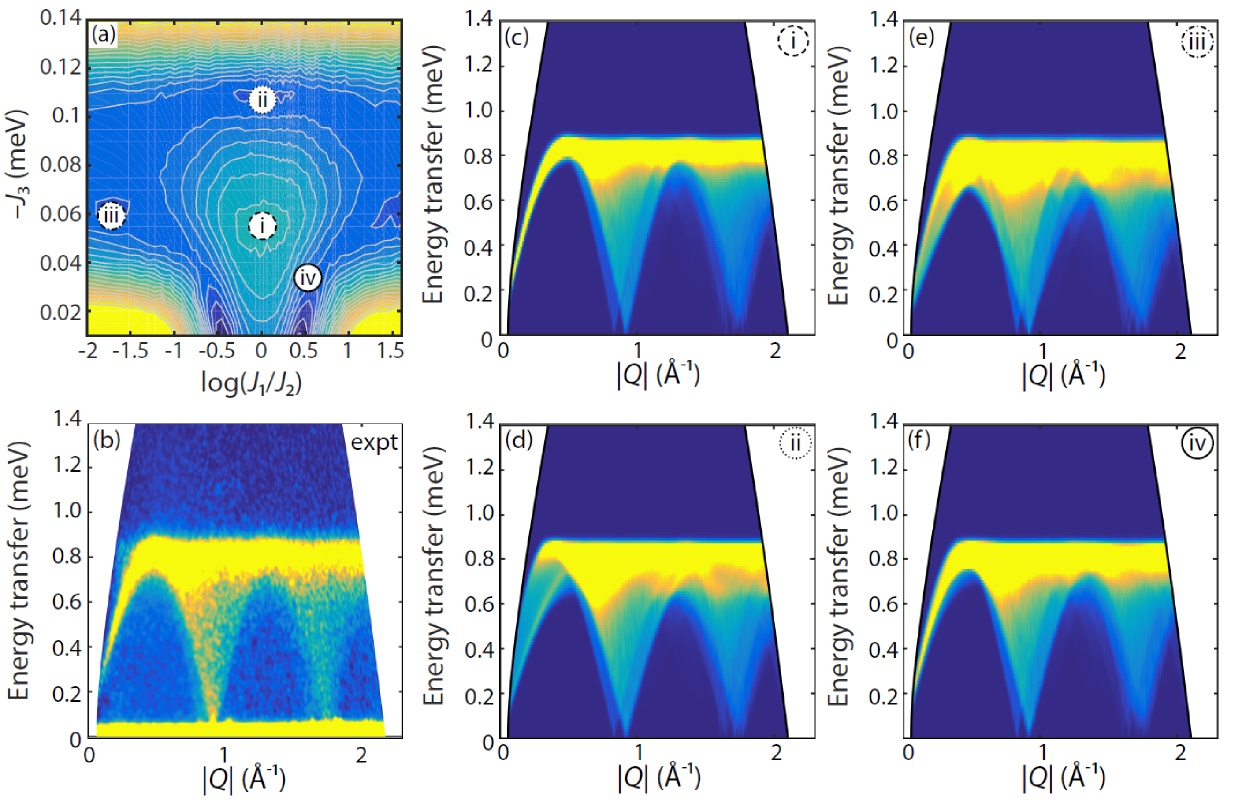
As a starting point, given that the three nearest neighbour Mn–Mn distances are identical in the high-temperature phase and vary very little in the low-temperature phase ( Å, Å and Å), we took the three nearest interactions to be identical in strength, and used meV, corresponding to the estimate from fits to the inverse magnetic susceptibilityWang et al. (2004). However, the simulation with these values substantially underestimated both the maximum energy transfer observed in the excitations, giving only meV, and the width of the band maximum. Instead, a more reasonable agreement to the data was obtained for meV (Fig. 4(c)). However, while this reproduced much of the general form of the dependence of the excitations, it underestimated their energy breadth, and also the spectral weight at different energy transfers.
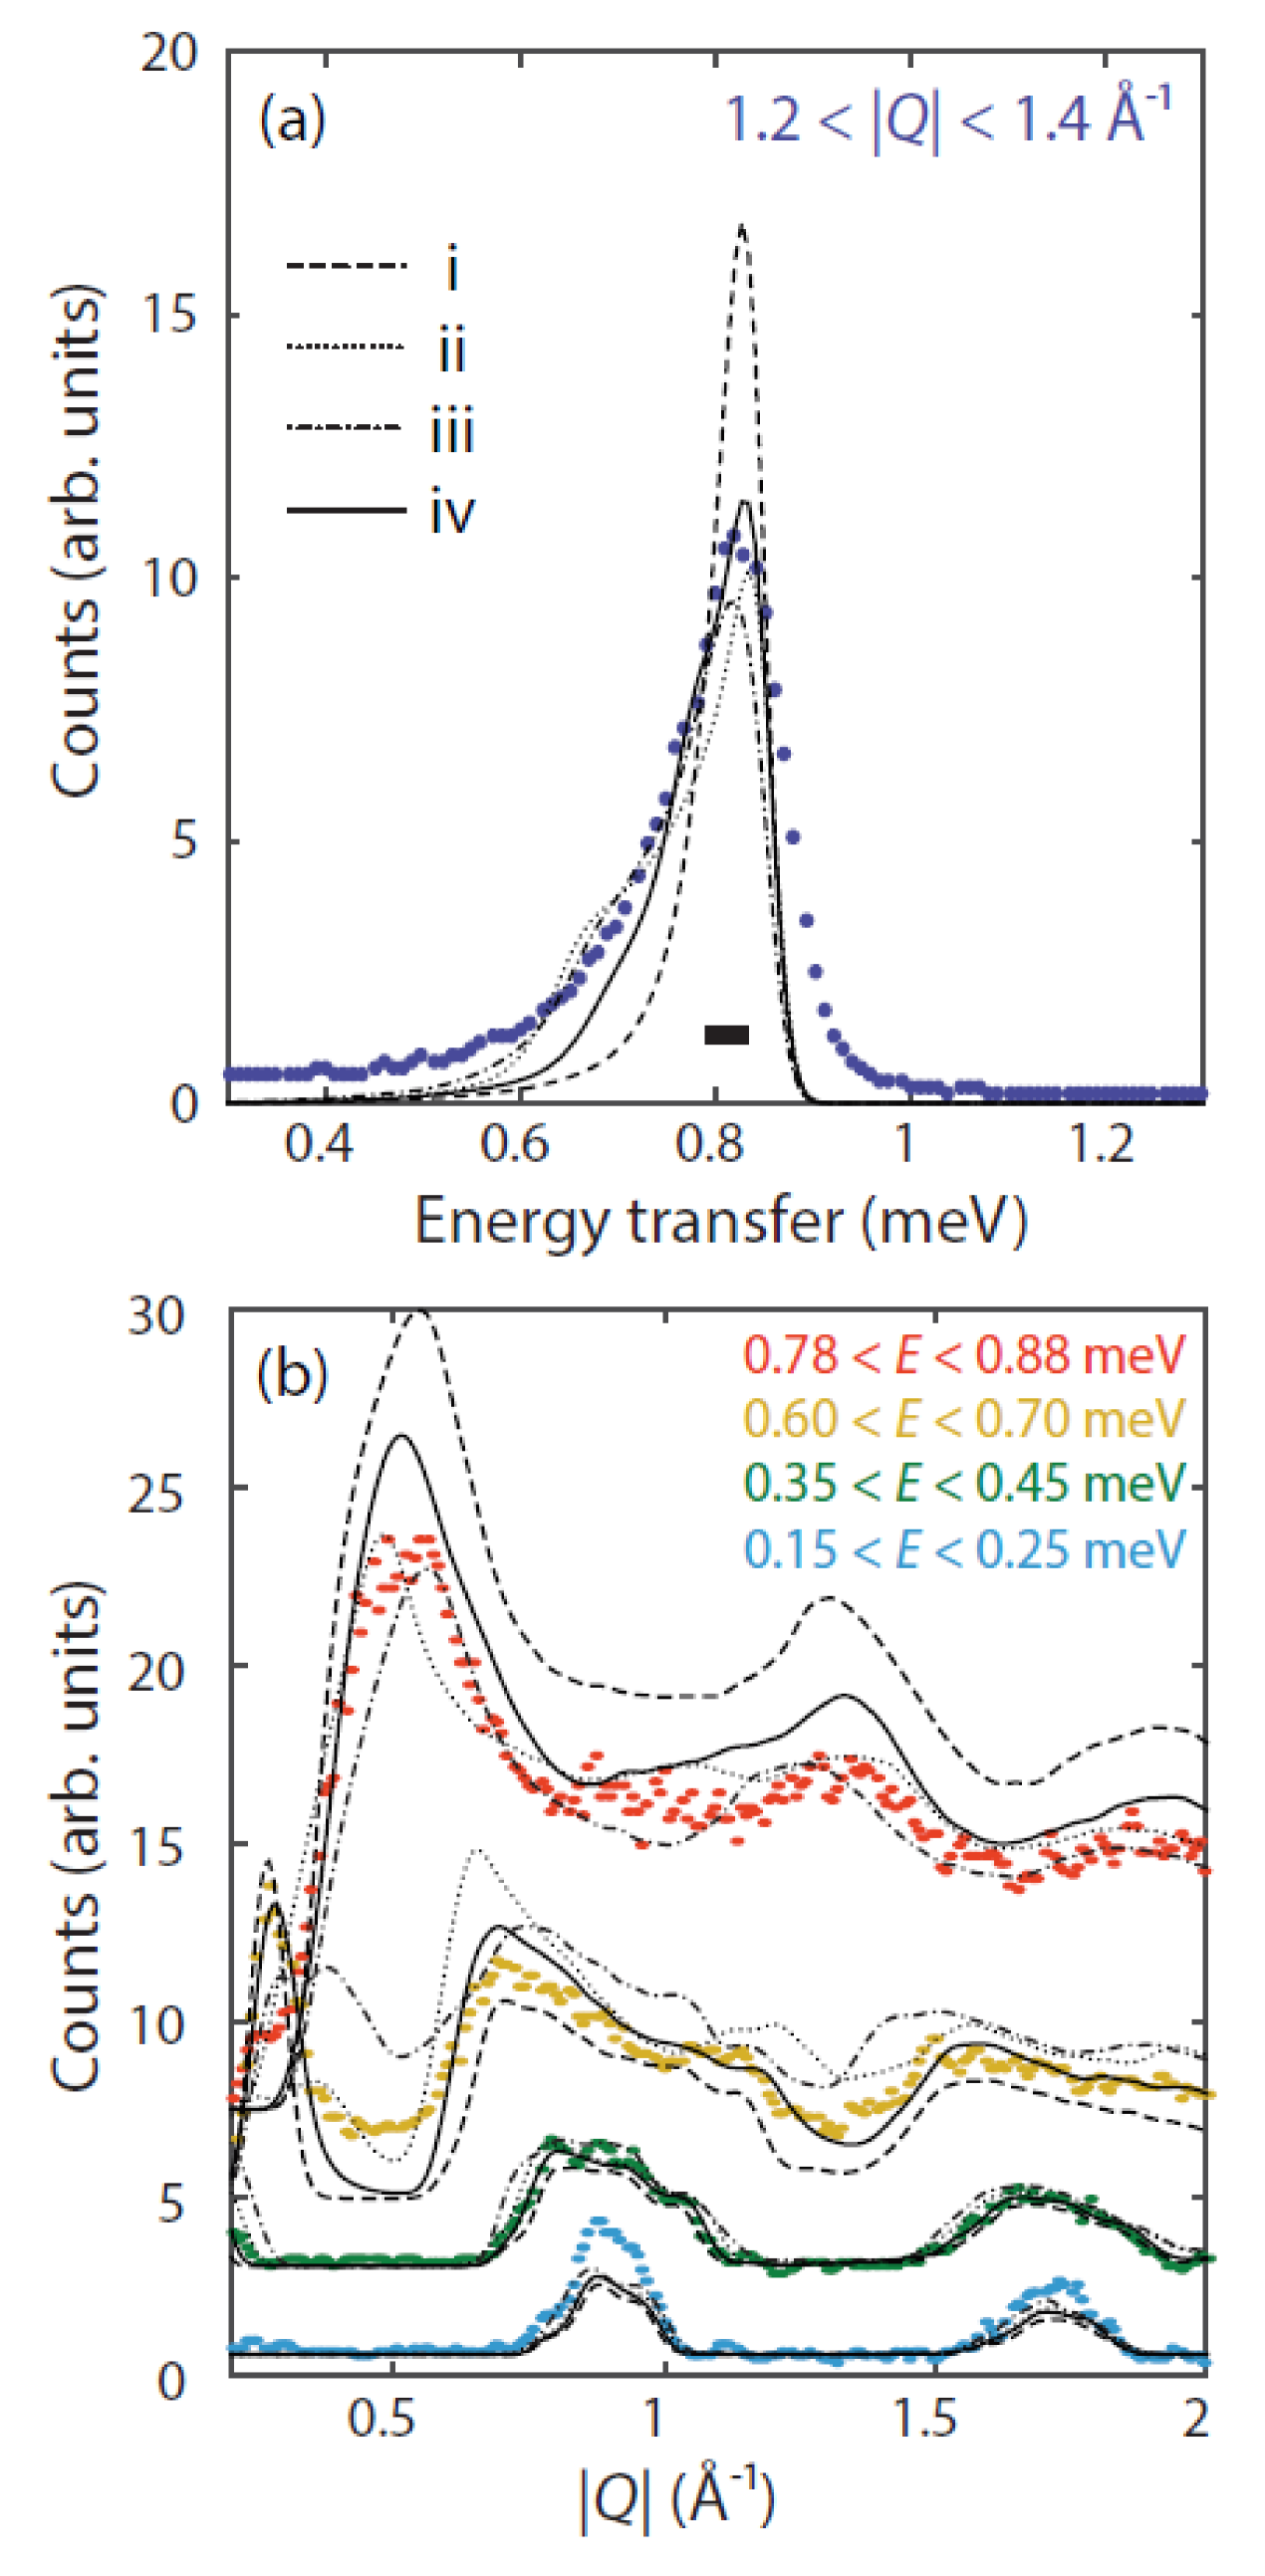
One of the defining features of the inelastic neutron scattering data is the energy width of the excitations observed at the van Hove-like maximum. This width is given by the energy resolution of the instrument (shown as a solid horizontal bar in Fig. 5(a)) combined with the effect of powder averaging over varying maxima in the dispersions along different directions in reciprocal space, which are dictated by the relative strengths of the three nearest neighbour interactions. Therefore, we evaluated a chi-squared map for an energy cut with Å-1 through the different , , spinW simulations, as shown in Fig. 4(a). In order to obtain the correct energy for the band maximum, the total was constrained to equal meV in the simulations. Given the similar geometries of the and paths it is perhaps to be expected that the plot is essentially symmetric about the line. Inspection of Fig. 4(a) shows that meV is actually the position of a local maximum in chi-squared, and reinforces the requirement for the interactions to be non-equal.
We subsequently used this map to inform our search for the optimal values of , and by focussing on the positions of the local minima. The global minimum occurs for , but this demonstrates why such a map, focussing on the agreement with one energy cut, can only be used as guidance. This particular fitting method was chosen as a compromise between accuracy and speed, in order to enable a search over a broad parameter space. When the full simulation is performed, and cuts along are considered, it becomes clear that for the inelastic scattering emerges from the elastic line at values of lower than those seen in the data (not shown here).
Panels (c), (d), (e) and (f) of Figure 4 show spinW simulations for the points labelled i, ii, iii and iv in panel (a). All four reproduce the general form of the inelastic neutron scattering data presented in (b), giving a van Hove-like maximum at meV, and spin waves emerging from the magnetic Bragg peaks at () and the overlapping () and (), with greater spectral weight at the latter. Simpler comparisons can be made by considering one dimensional cuts: Fig. 5(a) as a function of energy transfer for Å-1, and (b) as a function of for a series of different energy transfers. For all four models, Fig. 5(a) shows that the cut-off above the van Hove-like maximum is sharper than that seen in the data (blue points), which may be related to an oversimplification in the functional form of the instrumental energy resolution used in the simulations. The energy cuts through the different model simulations then present different modulated peaks which give rise to the overall peak broadening, showing clear differences between the models. However, it is difficult to choose between these based on the powder inelastic neutron scattering data, and would instead require single crystal measurements to allow us to identify the different spin wave dispersion maxima along different directions in reciprocal space.
Turning to the cuts in Fig. 5(b), which are presented as a function of for different energy transfers, the greatest variation between the different models is seen for the cut at relatively high energy transfers between and meV (yellow points). For this cut, only models i and iv, shown in Fig. 4 panels (c) and (f) respectively, manage to approximately reproduce the strong sharp peak seen below Å-1. While model iv gives a better agreement than model i to the highest energy cut. This model corresponds to meV, meV and meV, and while this slightly overestimates the intensity for meV, and underestimates it for meV (something common to all four models and possibly related to the strength of the elastic scattering at the magnetic Bragg peaks which is not captured by the spinW simulations), it gives the best overall agreement with all four data cuts. Although, as discussed above, an equally good fit would be obtained by reversing the values of and , this assignment is more likely, since in this model the shortest Mn–Mn distances correspond to the strongest exchange. This simple heuristic, however, is not always correctStride et al. (2006). We note further that the shortest linker has two dihedral angles of the same sign, whereas for the other two, the dihedral angles are of opposite sign. In other words, the two closest Mn atoms joined by a formate linker, corresponding to , are on the same side of the plane of the formate ion, whereas for and the Mn atoms are on opposite sides of the plane. These geometric details are at the limit of what can robustly be resolved from the powder diffraction data. They suggest that further investigation, perhaps of single crystals, would be useful to search for geometric reasons for the differences in coupling constant.
We have investigated the possibility of spin canting, as predicted by the observation of hysteresis in magnetisation measurementsWang et al. (2004). For the , , values of model iv, a canting of the spins away from the axis raises the ground state energy. It is probable that the canting is due to a weak Dzyaloshinskii-Moriya interaction, but a canting angle of , as predicted by Wang et al.Wang et al. (2004), implies an interaction strength of order eV, which would be very difficult to identify using inelastic neutron scattering.
IV Conclusions
To summarize, in its magnetically ordered phase (CD3)2ND2[Mn(DCO2)3] is a G-type antiferromagnet with magnetic moments pointing along the crystallographic axis. The spin wave excitations have been measured using inelastic neutron scattering, and used to parameterize the magnetic Hamiltonian in this multiferroic metal organic framework material. Unexpectedly, the exchange constant is not the same for the six nearest neighbours: instead, the structure consists of relatively strongly coupled zig-zag chains that interact more weakly with one another, with an exchange constant ratio of (red:yellow/blue links in Fig. 1). Our results suggest that orbital ordering may play an important role in the magnetic behaviour of this family of compounds. They further underline the importance of magnetic spectroscopy in elucidating the magnetic properties of novel materials such as metal-organic frameworks.
Acknowledgements.
The authors thank STFC for the award of beam time at ISIS Neutron and Muon Source. A. E. P. is grateful to EPSRC for funding (EP/L024977/1), and to Dr David Palmer (CrystalMaker Software Ltd.) for assistance in preparing Figure 1. H. D. D. acknowledges QMUL, SepNet and the STFC for funding her studentship.References
- Scott (2007) J. Scott, Nature Materials 6, 256 (2007).
- Kurmoo (2009) M. Kurmoo, Chem. Soc. Rev. 38, 1353 (2009).
- Lawler et al. (2015) J. M. M. Lawler, P. Manuel, A. L. Thompson, and P. J. Saines, Dalton Trans. 44, 11613 (2015).
- Wang et al. (2004) X.-Y. Wang, L. Gan, S.-W. Zhang, and S. Gao, Inorg. Chem. 43, 4615 (2004).
- Jain et al. (2008) P. Jain, N. S. Dalal, B. H. Toby, H. W. Kroto, and A. K. Cheetham, J. Am. Chem. Soc. 130, 10450 (2008).
- Baker et al. (2010) P. J. Baker, T. Lancaster, I. Franke, W. Hayes, S. J. Blundell, F. L. Pratt, P. Jain, Z.-M. Wang, and M. Kurmoo, Phys. Rev. B 82, 012407 (2010).
- Wang et al. (2013a) Z. Wang, P. Jain, K.-Y. Choi, J. van Tol, A. K. Cheetham, H. W. Kroto, H.-J. Koo, H. Zhou, J. Hwang, E. S. Choi, M.-H. Whangbo, and N. S. Dalal, Phys. Rev. B 87, 224406 (2013a).
- Yadav et al. (2016) R. Yadav, D. Swain, H. L. Bhat, and S. Elizabeth, J. Appl. Phys. 119, 064103 (2016).
- Maczka et al. (2015) M. Maczka, A. Sieradzki, B. Bondzior, P. Dereń, J. Hanuza, and K. Hermanowicz, J. Mater. Chem. C 3, 9337 (2015).
- Maczka et al. (2016) M. Maczka, A. Gagor, K. Hermanowicz, A. Sieradzki, L. Macalik, and A. Pikul, J. Solid State Chem. 237, 150 (2016).
- Kieslich et al. (2016) G. Kieslich, S. Kumagai, A. C. Forse, S. Sun, S. Henke, M. Yamashita, C. P. Grey, and A. K. Cheetham, Chem. Sci. 7, 5108 (2016).
- Colacio et al. (2000) E. Colacio, M. Ghazi, R. Kivekäs, and J. M. Moreno, Inorg. Chem. 39, 2882 (2000).
- Jain et al. (2009) P. Jain, V. Ramachandran, R. J. Clark, H. D. Zhou, B. H. Toby, N. S. Dalal, H. W. Kroto, and A. K. Cheetham, J. Am. Chem. Soc. 131, 13625 (2009).
- Sánchez-Andújar et al. (2014) M. Sánchez-Andújar, L. C. Gómez-Aguirre, B. P. Doldán, S. Yánez-Vilar, R. Artiaga, A. L. Llamas-Saiz, R. S. Manna, F. Schnelle, M. Lang, F. Ritter, A. A. Haghighirad, and M. A. Senarís-Rodríguez, CrystEngComm 16, 3558 (2014).
- Duncan et al. (2016) H. D. Duncan, M. T. Dove, D. A. Keen, and A. E. Phillips, Dalton Trans. 45, 4380 (2016).
- Kimura et al. (2003) T. Kimura, T. Goto, H. Shintani, K. Ishizaka, T. Arima, and Y. Tokura, Nature 426, 55 (2003).
- Cheong and Mostovoy (2007) S.-W. Cheong and M. Mostovoy, Nature Materials 6, 13 (2007).
- Wang et al. (2013b) W. Wang, L.-Q. Yan, J.-Z. Cong, Y.-L. Zhao, F. Wang, S.-P. Shen, T. Zou, D. Zhang, S.-G. Wang, X.-F. Han, and Y. Sun, Sci. Rep. 3, 2024 (2013b).
- Abhyankar et al. (2015) N. Abhyankar, S. Bertaina, and N. S. Dalal, J. Phys. Chem. C 119, 28143 (2015).
- Thomson et al. (2012) R. I. Thomson, P. Jain, A. K. Cheetham, and M. A. Carpenter, Phys. Rev. B 86, 214304 (2012).
- McQueeney et al. (2008) R. J. McQueeney, J.-Q. Yan, S. Chang, and J. Ma, Phys. Rev. B 78, 184417 (2008).
- Holbein et al. (2015) S. Holbein, P. Steffens, T. Finger, A. C. Komarek, Y. Sidis, P. Link, and M. Braden, Phys. Rev. B 91, 014432 (2015).
- Stride et al. (2006) J. A. Stride, M. Kurmoo, and Z. Wang, Physica B 385-386, 465 (2006).
- Hannon (2005) A. C. Hannon, Nucl. Instrum. Meth. A 551, 88 (2005).
- Arnold et al. (2014) O. Arnold et al., Nucl. Instrum. Methods Phys. Res. Sect. A 764, 156 (2014).
- Toby (2001) B. H. Toby, J. Appl. Crystallogr. 34, 210 (2001).
- Larson and Von Dreele (2004) A. C. Larson and R. B. Von Dreele, “General Structure Analysis System (GSAS),” (2004).
- Bewley et al. (2011) R. I. Bewley, J. W. Taylor, and S. M. Bennington, Nucl. Instrum. Methods Phys. Res. Sect. A 637, 128 (2011).
- Russina and Mezei (2009) M. Russina and F. Mezei, Nucl. Instrum. Methods in Phys. Rese. Sect. A 604, 624 (2009).
- Russina and Mezei (2010) M. Russina and F. Mezei, Journal of Physics: Conference Series 251, 012079 (2010).
- Nakamura et al. (2009) M. Nakamura, R. Kajimoto, Y. Inamura, F. Mizuno, M. Fujita, T. Yokoo, and M. Arai, J. Phys. Soc. Japan 78, 093002 (2009).
- Windsor (1981) C. G. Windsor, Pulsed Neutron Scattering (Taylor & Francis Ltd, London, 1981) The time independent background was subtracted using MantidPlot, using data between s and s.
- Toth and Lake (2015) S. Toth and B. Lake, J. Phys.: Condens. Matter 27, 166002 (2015).