Magnetic, thermal, and electronic-transport properties of EuMg2Bi2 single crystals
Abstract
The trigonal compound EuMg2Bi2 has recently been discussed in terms of its topological band properties. These are intertwined with its magnetic properties. Here detailed studies of the magnetic, thermal, and electronic transport properties of EuMg2Bi2 single crystals are presented. The Eu+2 spins-7/2 in EuMg2Bi2 exhibit an antiferromagnetic (AFM) transition at a temperature K, as previously reported. By analyzing the anisotropic magnetic susceptibility data below in terms of molecular-field theory (MFT), the AFM structure is inferred to be a -axis helix, where the ordered moments in the hexagonal -plane layers are aligned ferromagnetically in the plane with a turn angle between the moments in adjacent moment planes along the axis of . An alternate but less likely magnetic structure is a planar structure with nearest-neighbor Eu spins aligned at with respect to each other, where these ordered-moment layers are stacked along the axis. The magnetic heat capacity exhibits a anomaly at with evidence of dynamic short-range magnetic fluctuations both above and below . The high- limit of the magnetic entropy is close to the theoretical value for spins-7/2. The in-plane electrical resistivity data indicate metallic character with a mild and disorder-sensitive upturn below K. An anomalous rapid drop in on cooling below as found in zero field is replaced by a two-step decrease in magnetic fields. The measurements also reveal an additional transition below in applied fields of unknown origin that is not observed in the other measurements and may be associated with an incommensurate to commensurate AFM transition. The dependence of on the -axis magnetic field was derived from the field-dependent , , and measurements. This was found to be consistent with the prediction of MFT for a -axis helix with and was used to generate a phase diagram in the - plane.
I Introduction
The interplay between magnetism and band topology has generated immense interest recently due to the discovery of nontrivial phenomena such as the quantum anomalous Hall effect (QAHE) Qi2006_QAHE ; Liu2008_QAHE ; Yu2010_QAHE ; Chang2013_QAHE ; Liu2016_QAHE , axion electrodynamics Essin2009_AED ; Li2010_AED ; Lee_AED ; Wu2016_AED , and realization of relativistic particles like Majorana fermions Do2017_Majorana ; Akhmerov2009_Majorana ; Cook2011_Majorana ; Xu2015_Majorana . A topological state manifests topologically-protected electronic surface states that are different in nature from the bulk states Fu2007_TI ; Hasan2010_TI ; Moore2010_TI ; Qi2011_TI ; Ando2013_TI ; Tokura2019_TI . In addition to the parabolic bulk band, depending upon symmetry preservation, a unique gapless/gapped surface state with a linear energy versus crystal momentum - relation is also observed in these materials, resulting in massless surface electrons with ultrahigh mobility.
Time reversal symmetry (TRS) invariance in topological insulating states and its breaking in the presence of magnetism play a key role in discoveries in this field. Exotic quantum phenomena such as QAHE, chiral Majorana modes, and the topological magnetoelectric effect (TME) have been predicted in topological materials based on TRS breaking by magnetic order, with experimental support Liu2008_QAHE ; Yu2010_QAHE ; Chang2013_QAHE ; Essin2009_AED ; Li2010_AED ; Do2017_Majorana ; Fu2007_TI ; Qi2008_TRB ; Garate2010_TRB ; Xu2012_TRB . In a topological material exhibiting the QAHE, electrons can carry a dissipationless current, which is thus promising for use in energy-efficient electronic devices and also for fast computing. The experimental realization of QAHE in magnetic topological insulators has paved the way for researchers to discover other novel phenomena by studying various magnetic topological systems. In order to fully understand the phenomena triggered by TRS breaking in such magnetic topological systems, it is essential to understand the magnetic structure and symmetry of those materials.
Rare-earth-based intermetallic compounds have been of significant interest for many years due to their complex properties such as superconductivity, heavy fermion behavior, valence fluctuations, giant magnetocaloric effect, Kondo behavior, and quantum criticality Fertig1977_IC ; Nagarajan1994_IC ; Ghosh1995_IC ; Curro2000_IC ; Hundley2001_IC ; Sakai2011_IC ; Yamaoka2014_IC ; Pecharsky1997_IC ; Pakhira2016_IC ; Pakhira2017_IC ; Buschow1969_IC ; Gignoux1984_IC ; Ishida2002_IC ; Arndt2011_IC . Several rare-earth-based intermetallic compounds have also been discovered recently to exhibit topological states coupled with magnetic interactions Hirschberger2016_GdPtBi ; Wang2016_YbMnBi2 ; May2014_EuMnBi2 ; Soh2019_EuMnSb2 ; Schellenberg2011_EuCd2As2 ; Jo2020_EuCd2As2 ; Xu2019_EuIn2As2 . These discoveries reveal the subtle importance of magnetism in controlling the electronic surface states in the magnetic topological materials.
Recently, multiple Dirac states at different energies with respect to the Fermi energy were reported in a new magnetic topological material EuMg2Bi2 Kabir2019 . The magnetic ground state of the compound was suggested to be AFM in nature below K, the details of which are unclear as yet Kabir2019 ; May2011 ; Ramirez2015 . Based on the magnetic susceptibility behavior, where the -axis susceptibility decreases somewhat and the -plane susceptibility is almost temperature independent below , it was suggested that the moments are aligned along the axis Kabir2019 , presumably in a collinear AFM structure. In order to understand the mechanism of topological surface states and also to tune its nature it is important to clarify the magnetic structure and its evolution with applied magnetic field in EuMg2Bi2.
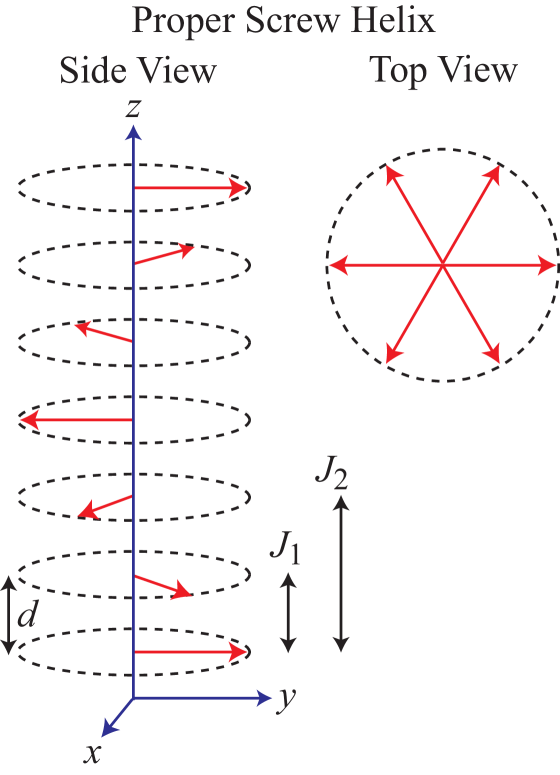
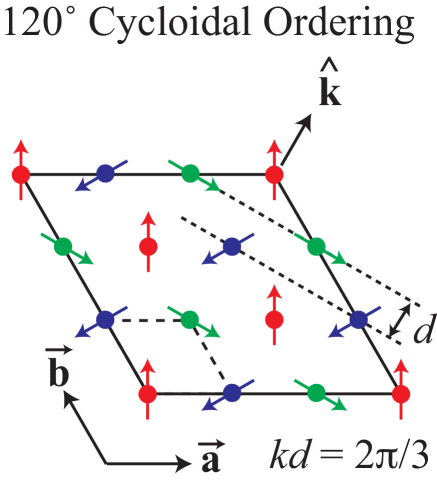
The primary purpose of this work was to investigate the magnetic structure and to explore the magnetic phase diagram of EuMg2Bi2 as a function of temperature and applied magnetic field to provide an experimental basis for relating the properties to the topology of the theoretical band structure. We present detailed measurements of the anisotropic versus temperature and magnetization versus isotherms for EuMg2Bi2 single crystals, together with complementary heat-capacity and electrical-resistivity measurements. We find that the magnetic susceptibilities for fields applied both in-plane and out-of-plane are almost temperature independent below , which is very unusual in magnetic Eu+2-based systems. Using a recently-developed molecular-field theory (MFT) Johnston2012 ; Johnston2015 , we deduce that the nearly -independent data below indicate that the magnetic structure is either a -axis helix in which the Eu moments are ferromagnetically aligned within each plane layer, with a turn angle between the moments in adjacent layers as generically illustrated in Fig. 1 Johnston2012 ; Johnston2015 , or a stacked coplanar structure with a angle between adjacent Eu moments in each triangular-lattice -plane layer as in the 120∘ cycloidal structure in Fig. 2. The in-plane electrical resistivity data indicate metallic character with a mild and disorder-sensitive upturn below K. An anomalous rapid drop on cooling below as found in zero field is replaced by a two-step decrease in magnetic fields. The measurements also reveal an additional transition below in applied fields of unknown origin that is not observed in the other measurements and may be associated with an incommensurate to commensurate AFM transition.
The experimental details and the crystal structure studies are discussed in Sec. II. The and isotherm data and analyses are given in Sec. III. Our heat capacity data and analyses are presented in Sec. IV, and the electrical resistivity data and analyses in Sec. V. The paper concludes with a summary in Sec. VI.
II Experimental Details and Crystal Structure
Single crystals of EuMg2Bi2 and YbMg2Bi2 were grown with the flux method in two different ways using high purity elements Eu (Ames Laboratory), Mg (Alfa Aesar, 99.98%), and Bi (Alfa Aesar, 99.9999%). One batch of crystals was obtained from the nominal flux composition EuMg4Bi6 and YbMg4Bi6 as described elsewhere May2011 . Another batch of crystals was grown from the starting composition EuMg2Bi7. The starting elements were loaded into alumina crucibles and sealed in silica tubes under atm of Ar gas. A sealed tube was heated to 900 ∘C at a rate of 50 ∘C/h and held at that temperature for 12 h. Then it was cooled to 500 ∘C over 200 h and the single crystals were then obtained by decanting the excess flux using a centrifuge. Most of the crystals obtained are three dimensional in shape with clear trigonal facets. In this work measurements were carried out on crystals obtained using the first growth process.
Room-temperature x-ray diffraction (XRD) measurements were carried out using a Rigaku Geigerflex x-ray diffractometer using Cu-Kα radiation. Structural analysis was performed by Rietveld refinement using the Fullprof software package Carvajal1993 . The chemical composition and homogeneity of the crystals were checked using a JEOL scanning-electron microscope (SEM) equipped with an EDS (energy-dispersive x-ray spectroscopy) analyzer.
The - and -dependent magnetization measurements were performed using a magnetic-properties measurement system (MPMS, Quantum Design, Inc.) in the range 1.8–300 K and up to 5.5 T (1 T Oe). A Quantm Design, Inc., physical-properties measurement system (PPMS) was used to measure and . Contacts to the samples were soldered with In in standard four-probe configuration, similar to the technique used for FeSe FeSeresistivity . The contact resistance was in the sub-Ohm range.
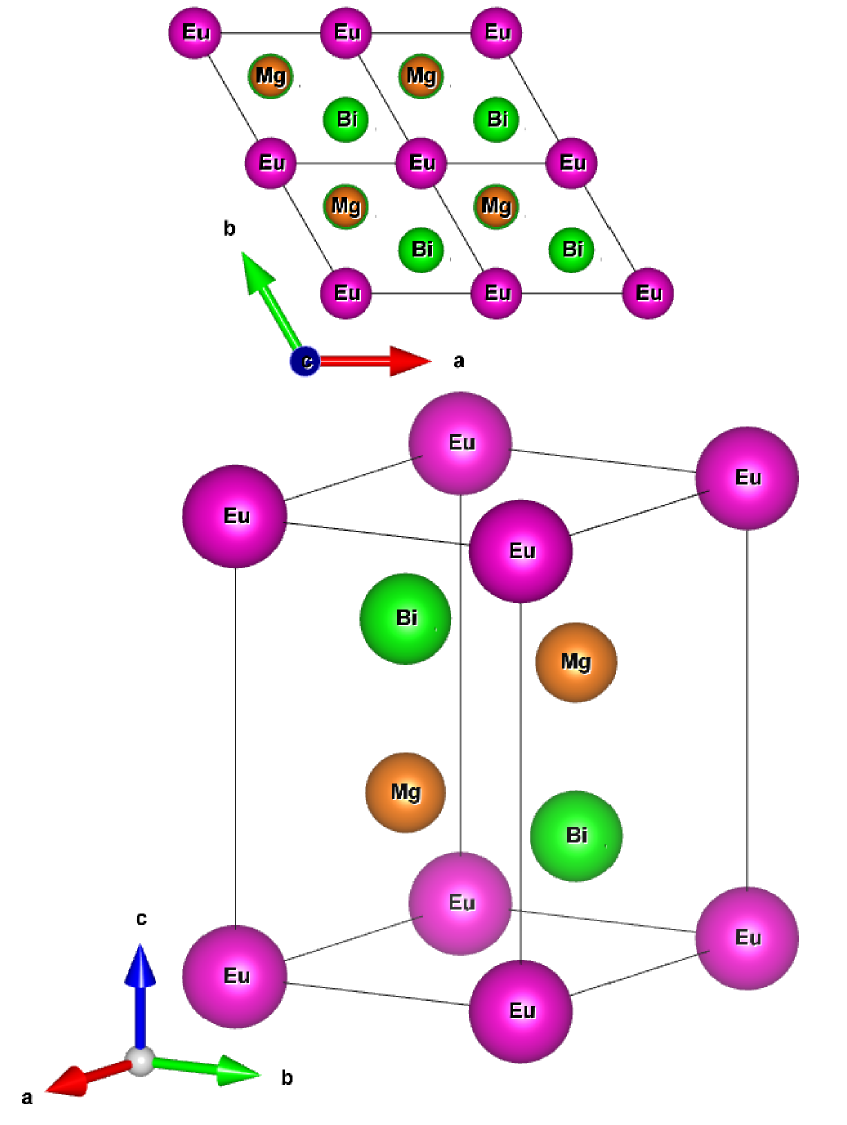
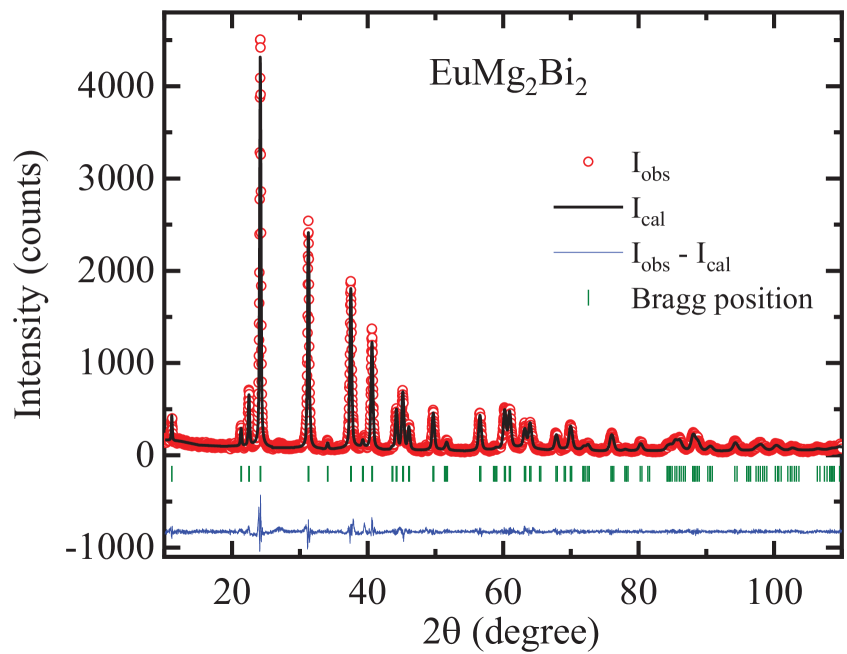
The reported CaAl2Si2-type trigonal crystal structure of EuMg2Bi2 (space group ) May2011 ; Zheng1986 is shown in Fig. 3. The structure consists of stacked planar triangular lattices of Eu in the plane separated along the axis by two ordered MgBi layers. The room-temperature powder x-ray diffraction (XRD) pattern collected on crushed EuMg2Bi2 single crystals along with our Rietveld refinement are shown in Fig. 4. The refinement confirms that EuMg2Bi2 crystallizes in the CaAl2Si2-type crystal structure with space group . The refined parameters are summarized in Table 1. The lattice parameters obtained are in agreement with previously reported values May2011 ; Ramirez2015 ; Kabir2019 . The SEM-EDS measurements confirm the homogeneity of the grown crystals with an average composition EuMg1.98(2)Bi2.01(2), which agrees with the stoichiometric composition EuMg2Bi2 to within the errors.
| Hexagonal lattice parameters | |||||
|---|---|---|---|---|---|
| a(Å) | 4.7724(3) | ||||
| c(Å) | 7.8483(5) | ||||
| c/a | 1.644(1) | ||||
| Vcell (Å3) | 154.80(2) | ||||
| Refinement quality | |||||
| 2.10 | |||||
| Rp (%) | 8.43 | ||||
| Rwp (%) | 11.5 | ||||
| Atomic coordinates | |||||
| Atom | Wyckoff Symbol | x | y | z | occupancy (%) |
| Eu | 1a | 0 | 0 | 0 | 100 |
| Mg | 2d | 1/3 | 2/3 | 0.6285(5) | 99(2) |
| Bi | 2d | 1/3 | 2/3 | 0.2499(4) | 98(2) |
III Magnetic susceptibility versus temperature and magnetization versus field isotherms
III.1 Magnetic susceptibility
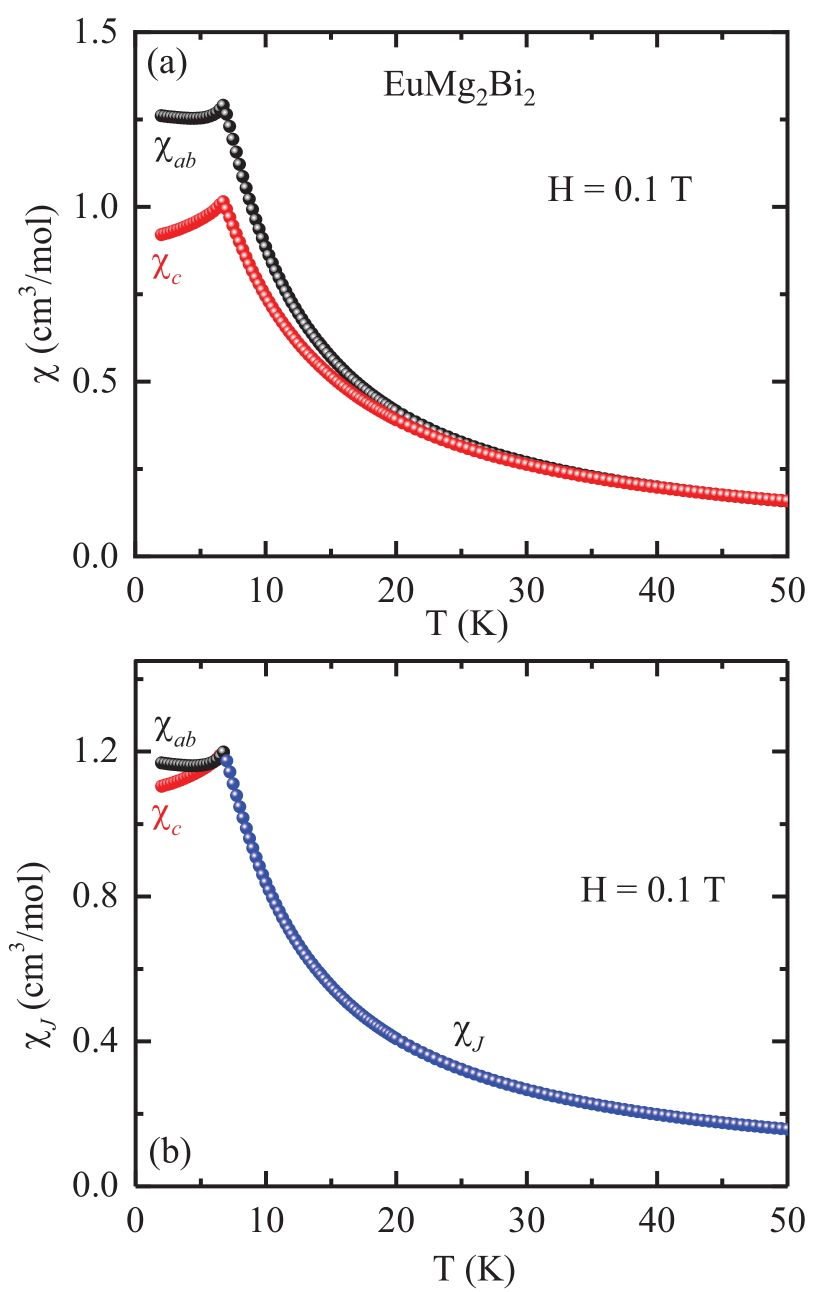
The magnetic susceptibility of a EuMg2Bi2 single crystal was measured at different applied magnetic fields in both zero-field-cooled (ZFC) and field-cooled (FC) modes. However, no signature of thermal hysteresis could be evidenced down to the lowest measured temperature even for the lowest applied magnetic field of 0.05 T. The temperature dependences of in ZFC mode measured at T applied in the plane () and along the axis () are shown in Fig. 5(a). Both and exhibit a sharp peak at K for T which is close to the previously reported for the compound May2011 ; Ramirez2015 ; Kabir2019 . Below , both and are almost independent of . Because below as in Fig. 5(a), it was suggested previously that the Eu ordered moments with spins-7/2 aligned antiferromagnetically along the axis. We obtain a different model below.
and start to diverge from each other below K, which is much higher than . This divergence suggests the occurrence of anisotropic FM fluctuations below this temperature, with the strongest fluctuations in the plane. We removed the influence of magnetic anisotropy in the paramagnetic (PM) state above by carrying out a spherical average of the data according to
| (1) |
as shown in Fig. 5(b), where the designation denotes that the remaining deviation of the temperature dependence of from Curie-Weiss behavior at arises from exchange interactions . Then the and data at were respectively shifted vertically so that these susceptibilities matched the spherically-averaged PM susceptibility at as shown in Fig. 5(b).
Interestingly, Fig. 5(b) shows that after correcting for the anisotropy in above , and are nearly the same and nearly independent of below . According to MFT Johnston2012 ; Johnston2015 , these two features suggest that the Eu spins are ordered in either a stacked planar 120∘ configuration or in a -axis helix with turn angle . Such behavior was previously observed for different -ordered triangular-lattice AFM systems Katsufuji2001 ; Brown2006 ; Maruyama2001 including for the most quantum spin , but where the explanation was not available at that time. Indeed, the MFT predicts that for 120∘ ordering in either a planar structure or in a helix with a turn angle between layers, below the susceptibility should be isotropic and independent of both and the value of the spin quantum number Johnston2012 ; Johnston2015 .
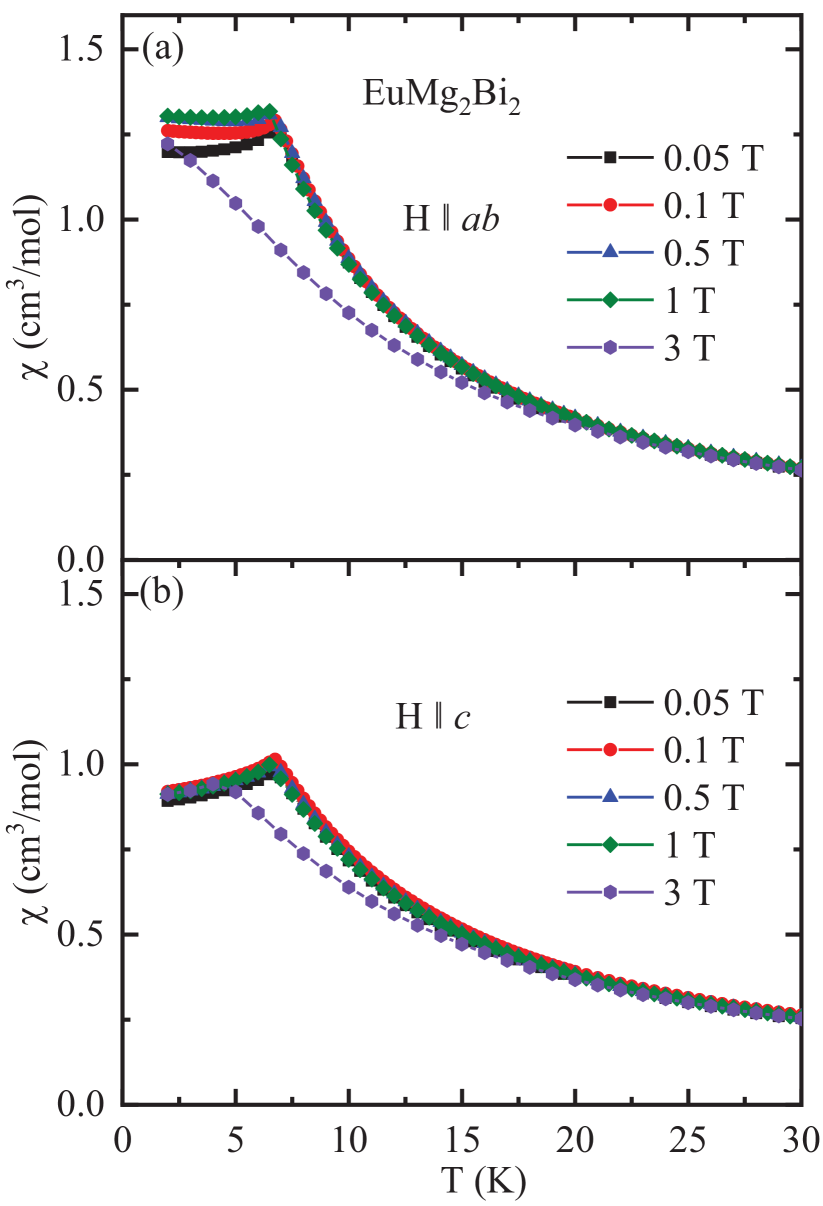
The anisotropic field-dependent magnetic susceptibilities for and are plotted versus for K in Figs. 6(a) and (b), respectively. The shifts to lower temperature with increasing for both field directions, but the suppression for T is clearly faster for than for .
III.2 Inverse magnetic susceptibility and Curie-Weiss behavior in the paramagnetic state
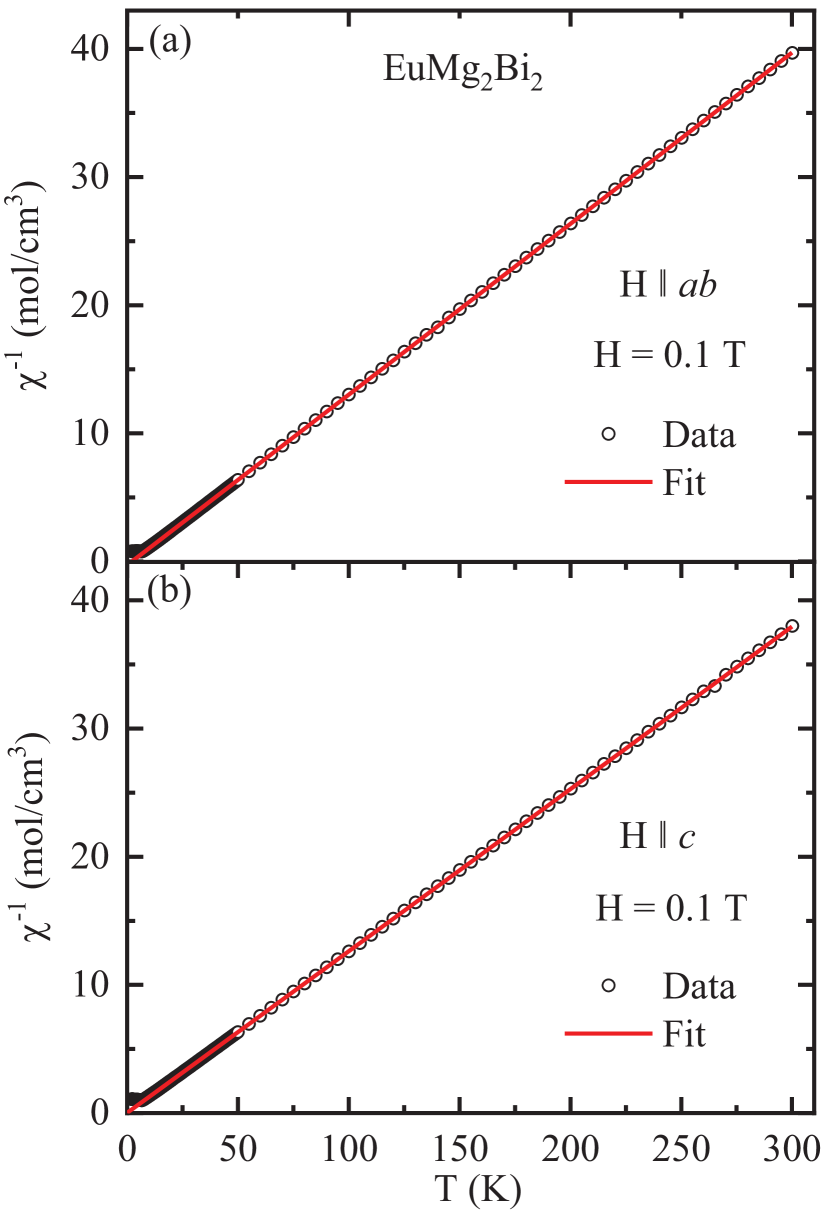
The inverse magnetic susceptibility data in the PM region are fitted by the modified Curie-Weiss law
| (2) |
where is an isotropic temperature-independent term, is the Weiss temperature, and is the Curie constant given by
| (3) |
where is Avogadro’s number, is the spectroscopic splitting factor ( factor) for the direction, is Boltzmann’s constant, and is the effective moment of an Eu spin in units of Bohr magnetons . Figures 7(a) and 7(b) depict the behavior in = 0.1 T for and , respectively, along with the modified Curie-Weiss fits obtained using Eq. (2). The parameters of the fits for the two different field directions are listed in Table 2. The values obtained from for both applied field directions are close to the value expected for Eu+2 spins with = 2. The positive value of indicates predominant FM in-plane interactions. The difference in magnitude of and may be due to the increased magnitude of FM fluctuations in the plane compared to those along the axis as discussed above.
| Field | ||||
|---|---|---|---|---|
| direction | (K) | |||
| 7.538(9) | 7.766(4) | 2.07(9) | ||
| 7.948(22) | 7.97(1) |
III.3 Heisenberg exchange interactions from MFT model
The Heisenberg exchange interactions between the Eu spins were estimated using a minimal one-dimensional -- MFT model for a helix Johnston2019_J0J1J2 ; Nagamiya_1967 (see Fig. 1). Here is the sum of the Heisenberg exchange interactions of a representative spin with all other spins in the same -plane layer, is the sum of exchange interactions of a spin with all spins in a nearest layer along the helix axis, and is the sum of the exchange interactions of a spin with all spins in a next-nearest layer (see Fig. 1). According to this MFT model, these exchange interactions are related to the turn angle , AFM transition temperature , and Weiss temperature by Johnston2012 ; Johnston2015
| (4a) | |||||
| (4b) | |||||
| (4c) | |||||
where a positive (negative) corresponds to net AFM (FM) interactions. The values of , , and were estimated using the parameters K (spherical average), and , yielding
| (5a) | |||
| (5b) | |||
| (5c) | |||
The FM value of and AFM values of and are consistent with a -axis helical spin structure with the moments ferromagnetically-aligned in each plane layer Johnston2012 ; Johnston2015 . This model is also consistent with the Weiss-temperature anisotropy in Table 2. The alternative possibility of a stacked triangular-lattice planar array of ordered moments with an angle of between adjacent moments in each layer is less likely because in that case one would expect to be AFM (negative) instead of positive (FM) as given in Table 2.
III.4 Magnetization versus applied magnetic field isotherms
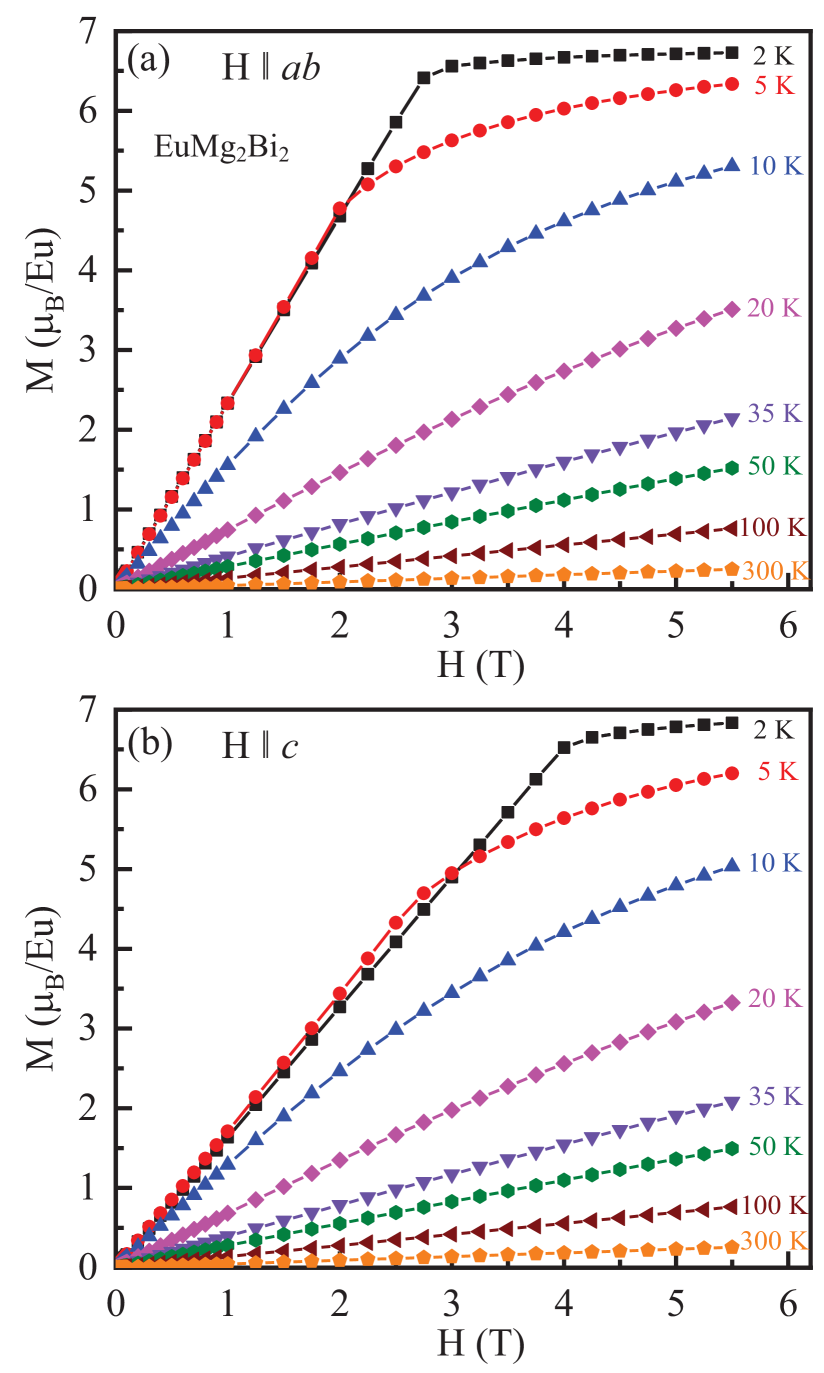
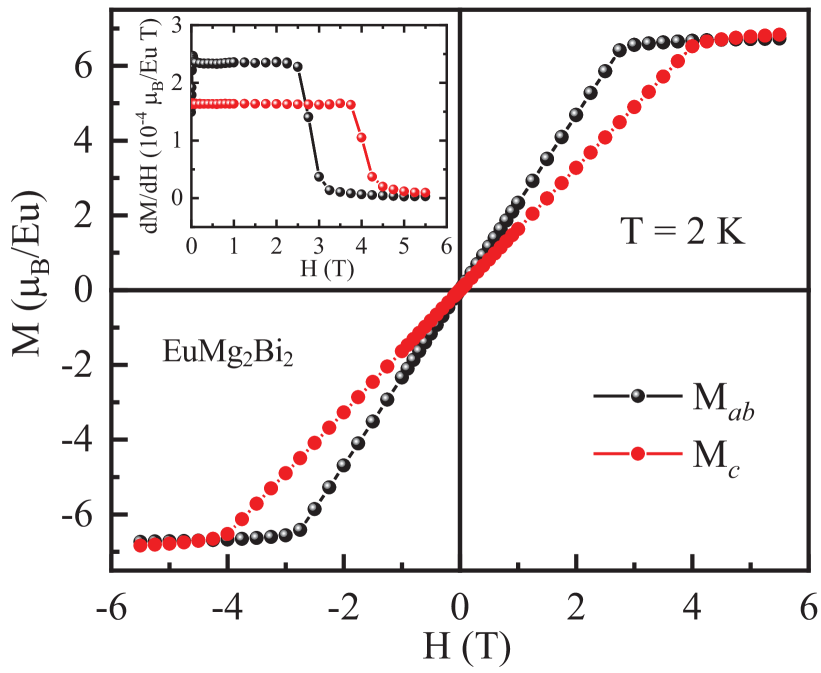
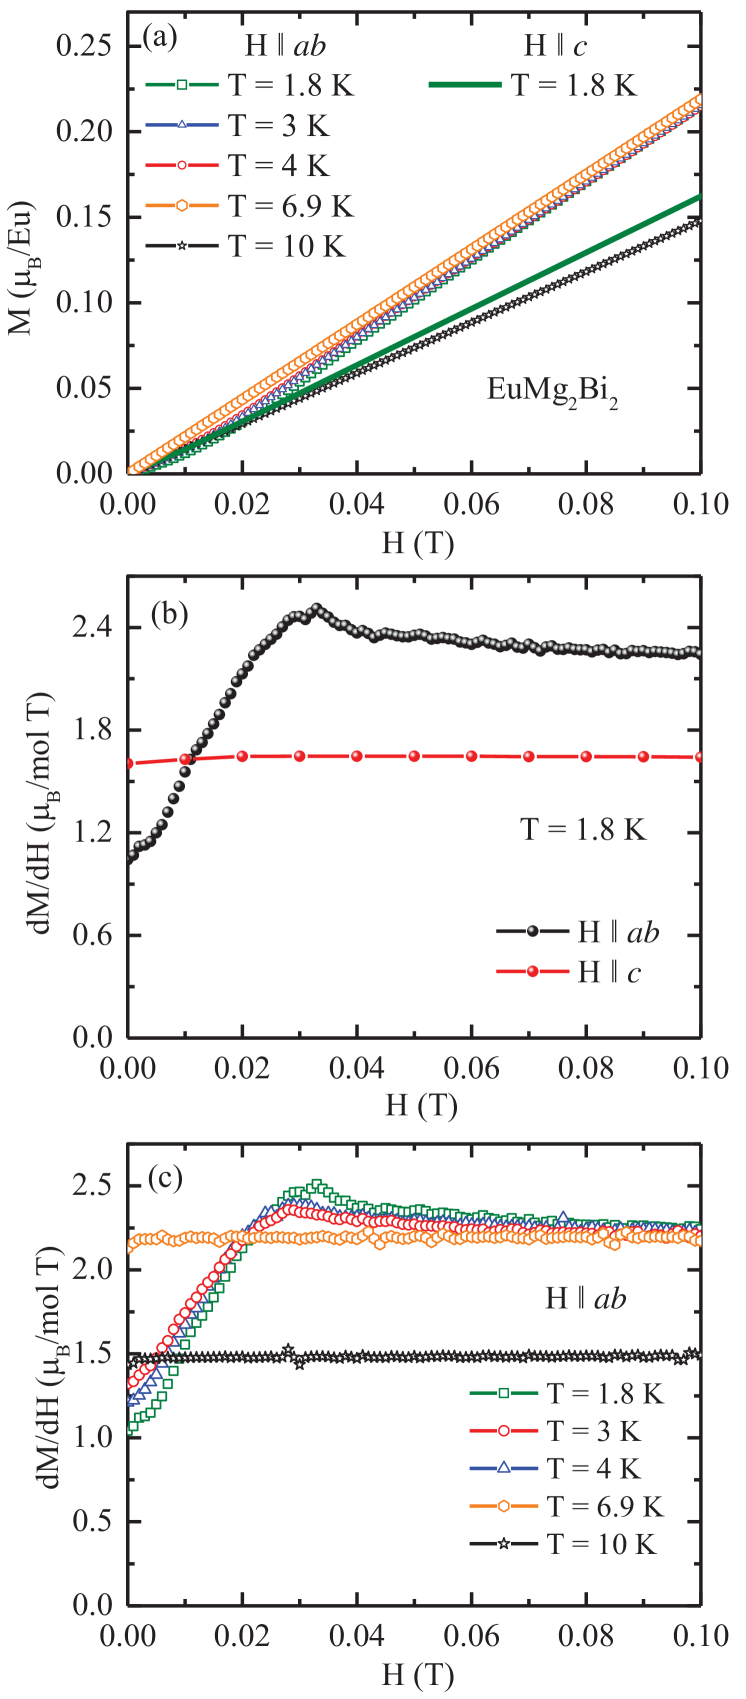
Isothermal magnetization versus data measured at different temperatures for and are shown in Figs. 8(a) and 8(b), respectively. The data at K are shown in Fig. 9 separately for the two different field directions for comparison. On the scale of the figures, and at 2 K increase linearly with increasing up to the respective critical fields T and T, above which the crystal enters the PM state and begins to saturate. At K, and attain values of /Eu at T. In view of the data in Table 2 obtained by fitting the data, the data for both field directions should indeed saturate to about /Eu at sufficiently high fields. Hysteresis in was not observed for either of the two applied field directions (not shown), consistent with the magnetic structure not having a glassy or FM component. These results are also consistent with the predictions of MFT for a -axis helix with a turn angle of 120∘ Johnston2015 ; Johnston2017 ; Johnston2017_2 . For the in-plane with this turn angle, a smooth crossover between a helix and a fan phase is predicted even though the theoretical prediction in this case is that below saturation. This prediction is indeed in apparent agreement with the data in Fig. 8(a) and the low-field data at K displayed in Fig. 10(a).
However, a detailed analysis of these data reveal a nonlinearity with a peak at Oe from the derivative plot versus in Fig. 10(b) that is not predicted by the MFT, whereas the corresponding -axis data in this figure show no such feature in agreement with MFT. The deviation from linearity in the low- data is also temperature dependent as seen from Fig. 10(c). The deviation is strongest at = 1.8 K, diminishes with increasing , and vanishes for . All these isothermal low- measurements were carried out on warming after quenching the superconducting magnet to avoid remanent fields in the magnet that might affect the results. Although not predicted by MFT for rad, the nonlinearity of is consistent with expectation for a noncollinear AFM structure with the moments aligned in the plane. It would be interesting to investigate by neutron diffraction how the magnetic structure changes in the low-field region below 1000 Oe.
IV Heat capacity and - Phase Diagram
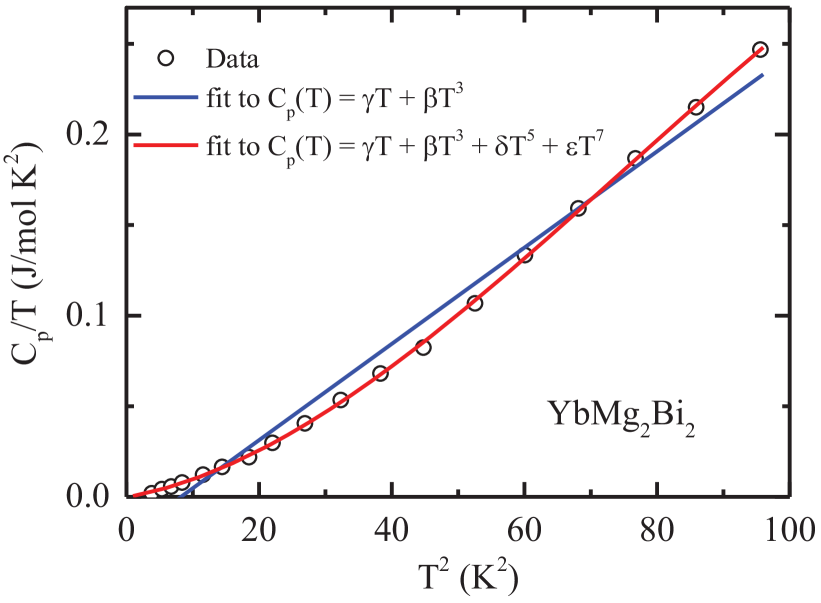
In this section we use the heat capacity of the nonmagnetic compound YbMg2Bi2 as a reference for the lattice heat capacity of EuMg2Bi2. The data for single-crystal YbMg2Bi2 at low are shown in Fig. 11, plotted as versus . For most nonmagnetic materials, the behavior at low temperatures is described by the expression
| (6) |
where is the Sommerfeld coefficient associated with degenerate itinerant charge carriers and is the coefficient of the term in the low- limit of the Debye lattice heat capacity. However, from Fig. 11 this two-term fit does not fit the data at all. Furthermore, it yields an unphysical negative value for . In order to obtain a good fit to the data below 10 K we added two additional lattice heat capacity terms according to
| (7) |
An excellent fit to the data was obtained by this expression as illustrated in Fig. 11 where
| (8) | |||
The value of is obtained from according to
| (9) |
where is the number of atoms per formula unit ( here) and is the molar gas constant, yielding K. It is notable that to within its error. Therefore below we assume when evaluating the heat capacity of EuMg2Bi2.
| Compound | |||
|---|---|---|---|
| (K) | (K) | ||
| YbMg2Bi2 | 309(5) | 75(2) | 0.37(1) |
| EuMg2Bi2 | 305(10) | 77(5) | 0.38(3) |
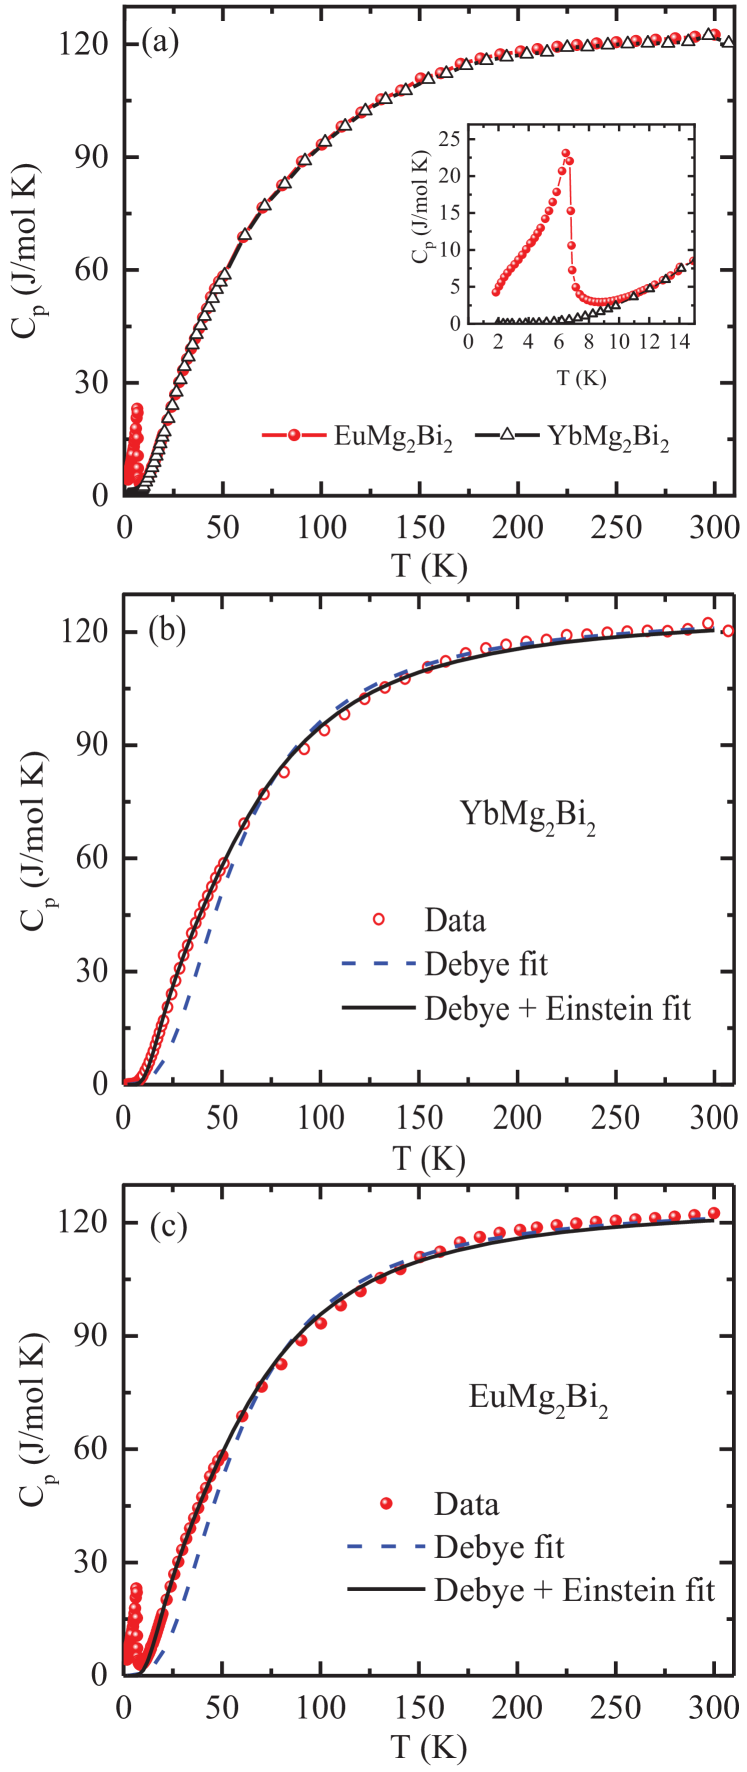
The zero-field single-crystal heat capacities of EuMg2Bi2 and the nonmagnetic analogue YbMg2Bi2 measured in the temperature range 1.8–300 K are plotted in Fig. 12(a). The of EuMg2Bi2 exhibits a pronounced peak at = 6.7 K as evident from the inset of Fig. 12(a). The attains values of J/mol K and J/mol K at K for EuMg2Bi2 and YbMg2Bi2, respectively. These values are close to the classical Dulong-Petit limit due to acoustic phonon modes J/mol K with being the number of atoms per formula unit of the above compounds.
We fitted the data in the temperature regions 25–300 K for EuMg2Bi2 and 2–300 K for YbMg2Bi2 by the Debye lattice heat capacity prediction
| (10) | |||||
where is the Debye temperature. The Padé approximant for the Debye function in Ref. Goetsch_2012 was used for the fits. As seen from dashed curves in Figs. 12(b) and 12(c), the lattice heat capacity is not described well by the Debye model. Much better fits were obtained by including an Einstein lattice contribution to the fits according to
| (11) |
where
| (12) |
with being the Einstein temperature. The parameter determines the fraction of the Einstein contribution to the total lattice heat capacity. Very good fits of the data by Eq. (11) were achieved, as depicted by the solid curves in Figs. 12(b) and 12(c). The fitted parameters are listed in Table 3. The Debye temperatures of K are much larger than the values of 207 K and 211 K previously reported from Debye fits to the data from 20 to 200 K for YbMg2Bi2 and EuMg2Bi2, respectively May2011 . The low Einstein temperatures of K suggest the presence of low-frequency optic modes associated with the heavy Bi and/or Yb or Eu atoms, respectively, as also suggested from Fig. 11.
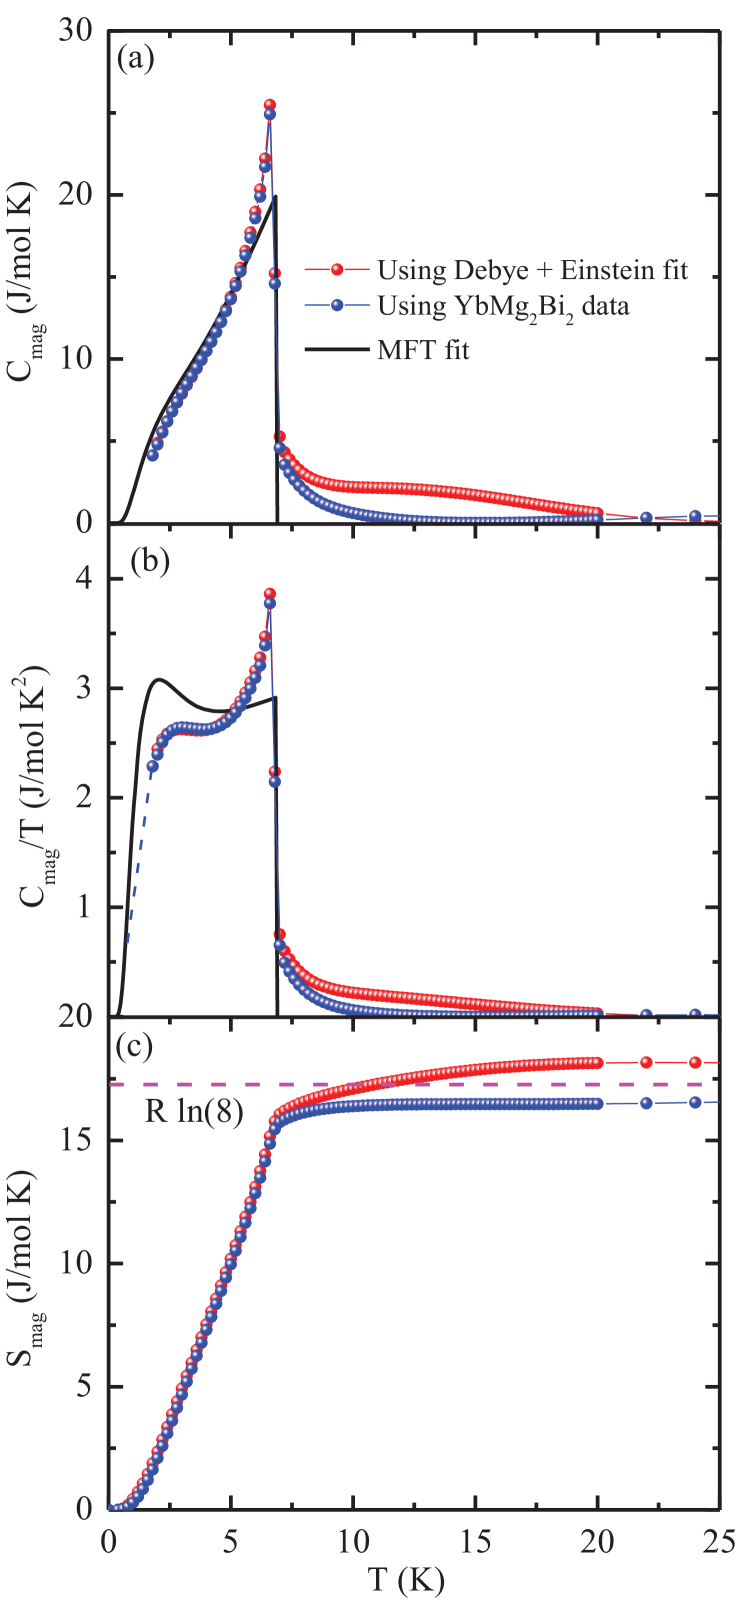
The magnetic contribution to the heat capacity of EuMg2Bi2 was obtained by subtracting the data of the nonmagnetic analogue YbMg2Bi2 in Fig. 12(a) after correcting for the difference in formula weights, where the temperature scale of YbMg2Bi2 was obtained as
| (13) |
where is the experimentally-measured temperature. The was also estimated by subtracting the lattice contribution obtained from the fit of the data by Eq. (11). Figure 13(a) shows obtained using the two different lattice heat capacity estimates. The two calculations of agree very well below , but the data above obtained using the measured lattice contribution of YbMg2Bi2 is physically more likely.
According to MFT, the discontinuity in at is given by Johnston2015
| (14) |
The jump in for EuMg2Bi2 at = 6.7 K expected from Eq. (14) is 20.14 J/mol K for . The experimentally-observed jump J/mol K is significantly larger than the MFT prediction. This difference arises because the observed shape of below is different from step shape of the MFT prediction shown as the solid curve in Fig. 13(a) obtained as follows.
The magnetic contribution to the heat capacity according to MFT is given by Johnston2015
| (15a) | |||||
| (15b) | |||||
| (15c) | |||||
| (15d) | |||||
where is the reduced ordered moment versus in , is the saturation moment of the spin, is Brillouin function, and . The solid black curve in Fig. 13(a) represents the predicted by MFT for K and . The disagreements with the data in Fig. 13(a) arise from neglect of dynamic magnetic fluctuations and correlations in MFT.
The zero-field magnetic entropy for EuMg2Bi2 in Fig. 13(c) was obtained from the zero-field data in Fig. 13(b) using the relation
| (16) |
The data in the range 0–1.8 K for which we have no data was estimated as described in the caption to Fig. 13 and shown as the dashed blue line in Fig. 13(b). The calculations for EuMg2Bi2 using the above two methods of calculating are shown in Fig. 13(c). The calculated using the Debye-Einstein lattice contribution saturates at high to a value of 18.2 J/mol K, which is slightly larger than the theoretical high- limit J/mol K for . On the other hand, when using the YbMg2Bi2 lattice contribution, saturates to a value of 16.7 J/mol K which is slightly smaller than the theoretical prediction. The reaches to 94% and 91% of at in these two calculations, respectively. The nonzero contributions to and above arise from dynamic short-range magnetic order. This feature has also been observed in other spin-7/2 Eu+2 helical AFM systems Sangeetha_EuCo2P2_2016 ; Sangeetha_EuCo2As2_2018 ; Sangeetha_EuNi2As2_2019 .
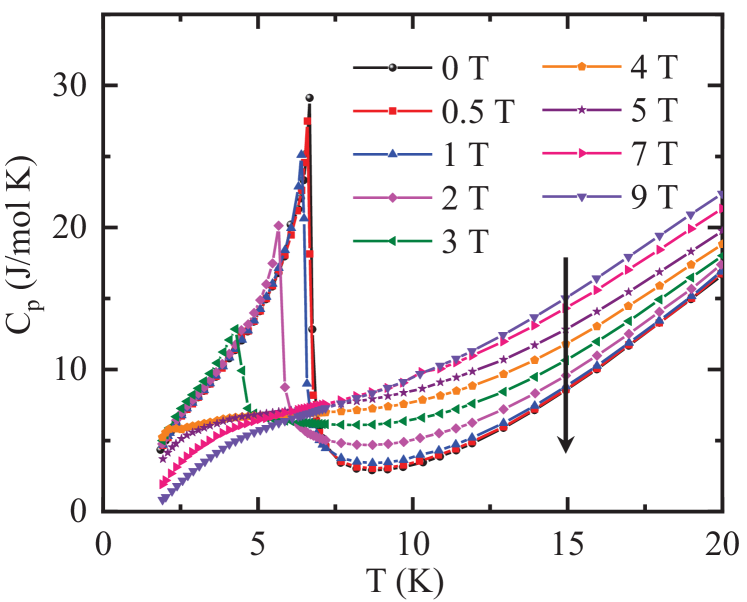
The variation of with magnetic field defined to be the field applied along the axis, perpendicular to the zero-field ordering plane, is shown in Fig. 14. Here we define the field along the axis as so as not to confuse the notation with the critical field and the -axis field . Due to the constraints of the PPMS used to measure , it was not possible to measure with . As seen from Fig. 14, shifts to lower temperature with increasing and also the jump in at decreases, where is defined as the temperature of the peak in the heat capacity because of the contribution of dynamic short-range magnetic ordering to above .
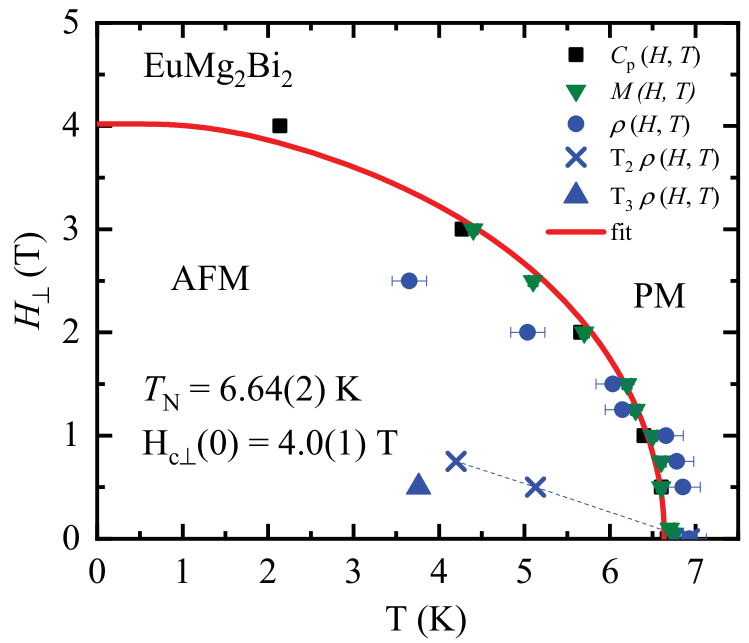
From the data in Fig. 14, one could plot versus the field or the critical field versus . We use the latter scaling because for a helical antiferromagnet, is given theoretically by MFT as Johnston2015
| (17) |
where is calculated using Eqs. (15). A fit of the versus data in Fig. 15 by Eq. (17) yields K and T, as shown by the red curve in the figure. This curve divides the phase diagram in the plane into helical AFM and PM regions as shown.
V Electrical Resistivity
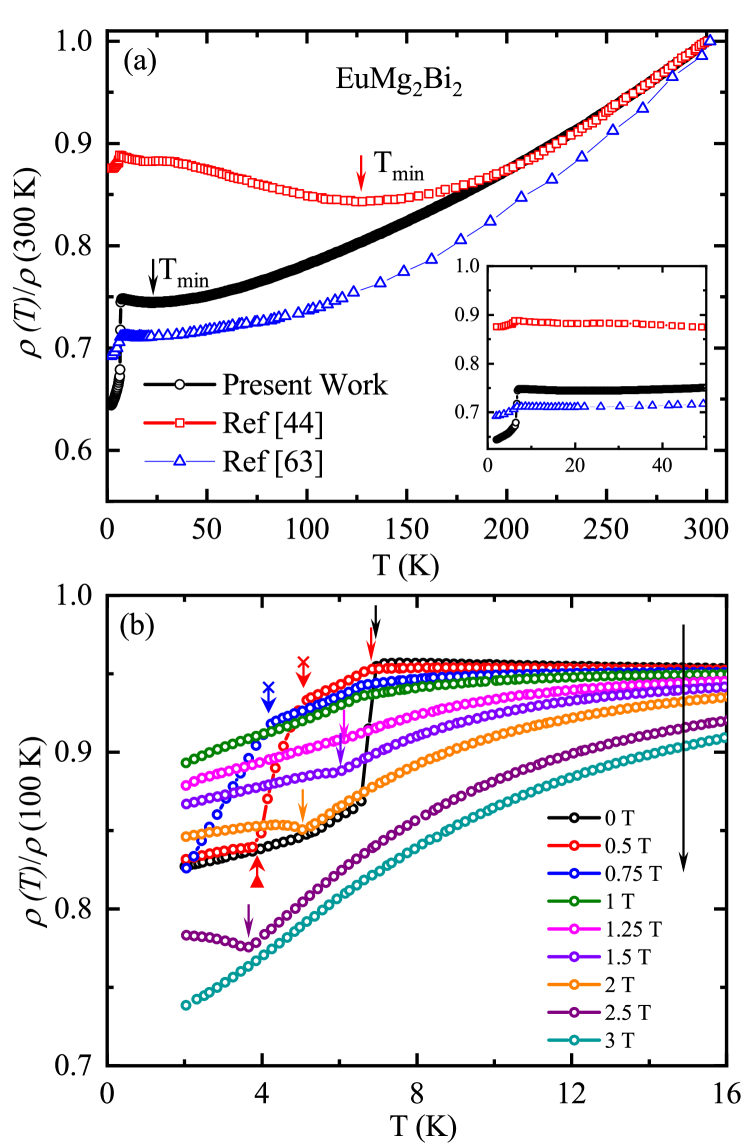
The temperature dependence of the -plane electrical resistivity measured in the temperature range 2 to 300 K in zero magnetic field is plotted in Fig. 16(a). The data are presented using a normalized scale. The resistivity shows a metallic decrease on cooling down to a shallow minimum at K, followed by a slight increase on further cooling. A sharp resistivity decrease below K (transition midpoint) indicates the onset of AFM ordering in the system.
The observed behavior is similar to that reported in similarly-grown crystals, blue triangles in Fig. 16(a) May2012 , but notably different from that reported in the previous study Kabir2019 in which a Sn-flux-grown single crystal was used for the measurements. The shallow minimum in as observed in our study at about 23 K is not observed in similarly-grown samples with higher RRR and is observed at a much higher temperature of K, in samples with notably lower RRR. Using the value of resistivity above as a proxy for , the extrapolated residual-resistivity ratio RRR K)/ increases from in the Sn-flux-grown crystal, to in our crystals and to in the data of Ref. May2012 . Progressively the position of the resistivity minimum shifts to zero. In previous studies of polycrystalline EuMg2Bi2 May2012 the minimum was much more pronounced and located at about 100 K. The slight resistivity increase on cooling is accompanied by a temperature-independent Hall constant May2012 arguing against an activated character of charge transport below the minimum. The minimum was also observed in nonmagnetic CaMg2Bi2, which makes a possible contribution of the Kondo effect Kondoeffect unlikely. We conclude that the most likely reason for the minimum is an onset of Anderson localization Anderson due to the strong effect of disorder in a low carrier-density metal.
The decrease of resistivity below in both previous studies is notably smaller than in our crystals, and is significantly less sharp. The origin of this discrepancy is unclear and deserve further study. The resistivity decrease below is governed by a decrease of magnetic entropy Paglione2005 and the sharp feature may be suggestive of the first-order character of the transition. The evolution of the temperature-dependent resistivity with is shown in Fig. 16(b). Of special note is the evolution between T (black) and 0.5 T (red). While the transition with onset at K in zero field is accompanied by a pretty sharp (full width of 0.4 K) resistivity decrease, the feature at K [which does not change much in temperature compared to the 0 T curve, as indicated by simple vertical black and red arrows in Fig. 16(b)], the decrease in at 0.5 T is quite small. On further cooling for 0.5 T reveals a second feature [we label it K and indicate with a cross arrow in Fig. 16(b)], below which the main resistivity decrease happens. A similar feature is found for the curve in 0.75 T field. The third feature at K (up-triangle arrow) leads to flattening of the in T for K. The is not found for 0.75 T in the temperature range studied. A magnetic field of 1 T suppresses the feature, but the feature at remains clearly discernible. With further magnetic field increase to 1.25 T the shape of the anomaly in changes qualitatively, with initial flattening and eventual increase of resistivity on cooling for T. A monotonically decreasing as found at 3 T suggests the suppression of to below the temperature range studied.
We summarize the anomalies in in the above phase diagram in Fig. 15. For fields below 1 T the feature in at (solid blue circles) is in good agreement with the heat capacity (black solid squares) and magnetization (green down-triangles) measurements. For T the position of the highest-temperature feature starts to go to zero notably faster than suggested by the magnetization and heat capacity determinations of . Note that the shape of changes in the same field range.
The position of the feature (blue crosses in Fig. 15) seems to be smoothly connected to the zero-field (blue dashed line). The position of the feature (solid blue up-triangle) does not seem to be connected to any special point in the phase diagram.
The sharpness of the feature at in zero-field resistivity measurements suggest a first-order character of the transition, and its splitting into two second-order transitions with application of magnetic field. However, this interpretation is not supported by either the or data in Fig. 5 and the inset of Fig. 12(a), respectively.
The fact that the low-temperature features at and are not observed in heat capacity and magnetization measurements may suggest that the features are due to lock-in transitions (transformations of helical order in magnetic field between incommensurate and commensurate on cooling), particularly difficult to observe in thermodynamic measurements due to the minute entropy changes involved Jensen .
VI Summary
In this work, we have investigated the detailed magnetic, thermal, and electronic transport properties of single crystals of the trigonal compound EuMg2Bi2, which has recently been reported to host multiple Dirac states. The magnetic susceptibility shows that the compound undergoes AFM ordering below K associated with the Eu+2 spins 7/2, as reported earlier.
The magnetic susceptibilities are found to be almost independent of temperature below for both and , where the hexagonal setting of the trigonal structure has lattice parameters and . According to molecular field theory (MFT), this behavior strongly suggests that the magnetic structure of EuMg2Bi2 below is a -axis helix, where ferromagnetically-aligned moments in planes rotate in a axis helical structure by a turn angle of from plane to plane along the axis. Another possible but less probable magnetic structure is a planar structure with in-plane nearest-neighbor Eu spins aligned at with respect to each other, with such planes stacked along the axis. The latter structure is less likely because the calculated value of the net in-plane magnetic exchange interaction derived from MFT is positive (FM), rather than negative (AFM) as would be expected for the latter structure, and because the Weiss temperature in the Curie-Weiss law is positive (FM-like) for fields in the plane.
According to MFT, the -axis magnetization of a -axis helix is linear for applied fields from to the critical field at which the magnetization approaches the saturation magnetization and a second-order transition to the paramagnetic state occurs. For fields applied in the plane of a helix with a turn angle, is also predicted to be linear from to the critical field at , even though a smooth crossover from a helix to fan phase occurs if the spins are confined to the plane. On the full scale of our measurement field, these predictions are verified. However, on closer examination, we find that shows a subtle nonlinearity at fields below about 500 Oe. It would be interesting in future work to determine experimentally what change in the magnetic structure this nonlinearity is associated with.
The zero-field heat capacity measurement reveals a anomaly at that shifts to lower temperature with increasing . The zero-field magnetic contribution to obtained using two different background subtractions reveals the presence of short-range dynamic magnetic fluctuations both below and above that contribute to the high-temperature limit of the magnetic entropy. This limit is close to the value expected for Eu spins .
A sharp drop in the electrical resistivity is observed on cooling below in zero field. It is replaced by a two-stage resistivity decrease in the smallest applied magnetic fields. This behavior is contrary to the previous studies and deserves further investigation. This behavior is not reflected in the or data, and to our knowledge has not been observed previously on cooling below in any other antiferromagnetic material. The drop is linear in temperature in nonzero -axis magnetic fields with the temperature width of the drop increasing with increasing field. A resistivity minimum above was also observed in the data at K, which is a significantly lower temperature than that reported earlier in Ref. Kabir2019 . Interestingly, although only one magnetic transition at is observed in our magnetic and heat capacity data, in addition to the above-noted feature at the data also reveal another distinct field-dependent anomaly in the magnetic-field range T for to K.
On the basis of the magnetic, thermal, and electronic transport studies, a magnetic phase diagram in the - plane for fields parallel to the axis was constructed that includes the antiferromagnetic and paramagnetic regions. The phase boundary between these two phases is fitted satisfactorily by MFT.
It would be interesting to theoretically investigate the degree and manner to which one or more of our measured properties of single-crystalline EuMg2Bi2 are influenced or even caused by topological features of the band structure. Of particular interest is the origin of the rapid drop in the resistivity on cooling below in zero field.
Acknowledgements.
We are grateful to P. P. Orth for helpful comments on the manuscript. The authors thank J. Jensen for useful discussion. This research was supported by the U.S. Department of Energy, Office of Basic Energy Sciences, Division of Materials Sciences and Engineering. Ames Laboratory is operated for the U.S. Department of Energy by Iowa State University under Contract No. DE-AC02-07CH11358.References
- (1) Xiao-Liang Qi, Yong-Shi Wu, and Shou-Cheng Zhang, Topological quantization of the spin Hall effect in two-dimensional paramagnetic semiconductors, Phys. Rev. B 74, 085308 (2006).
- (2) Chao-Xing Liu, Xiao-Liang Qi, X. Dai, Z. Fang, and Shou-Cheng Zhang, Quantum Anomalous Hall Effect in Hg1-yMnyTe Quantum Wells, Phys. Rev. Lett. 101, 146802 (2008).
- (3) R. Yu, W. Zhang, Hai-Jun Zhang, Shou-Cheng Zhang, X. Dai, Z. Fang, Quantized Anomalous Hall Effect in Magnetic Topological Insulators, Science 329, 61 (2010).
- (4) Cui-Zu Chang, J. Zhang, X. Feng, J. Shen, Z. Zhang, M. Guo, K. Li, Y. Ou, P. Wei, Li-Li Wang, Zhong-Qing Ji, Y. Feng, S. Ji, X. Chen, J. Jia, X. Dai, Z. Fang, Shou-Cheng Zhang, K. He, Y. Wang, L. Lu, Xu-Cun Ma, Qi-Kun Xue, Experimental Observation of the Quantum Anomalous Hall Effect in a Magnetic Topological Insulator, Science 340, 167 (2013).
- (5) Chao-Xing Liu, Shou-Cheng Zhang, and Xiao-Liang Qi, The Quantum Anomalous Hall Effect: Theory and Experiment, Annu. Rev. Condens. Matter Phys. 7, 301 (2016).
- (6) A. M. Essin, J. E. Moore, and D. Vanderbilt, Magnetoelectric Polarizability and Axion Electrodynamics in Crystalline Insulators, Phys. Rev. Lett. 102, 146805 (2009).
- (7) R. Li, J. Wang, Xiao-Liang Qi and Shou-Cheng Zhang, Dynamical axion field in topological magnetic insulators, Nat. Phys. 6, 284 (2010).
- (8) Yea-Lee Lee, H. C. Park, J. Ihm, and Young-Woo Son, Manifestation of axion electrodynamics through magnetic ordering on edges of a topological insulator, PNAS 112, 11514 (2015).
- (9) L. Wu, M. Salehi, N. Koirala, J. Moon, S. Oh, N. P. Armitage, Quantized Faraday and Kerr rotation and axion electrodynamics of a 3D topological insulator, Science 354, 1124 (2016).
- (10) Seung-Hwan Do, Sang-Youn Park, J. Yoshitake, J. Nasu, Y. Motome, Y. S. Kwon, D. T. Adroja, D. J. Voneshen, K. Kim, T.-H. Jang, J.-H. Park, Kwang-Yong Choi, and S. Ji, Majorana fermions in the Kitaev quantum spin system -RuCl3, Nature 13, 1079 (2017).
- (11) A. R. Akhmerov, J. Nilsson, and C. W. J. Beenakker, Electrically Detected Interferometry of Majorana Fermions in a Topological Insulator, Phys. Rev. Lett. 102, 216404 (2009).
- (12) A. Cook and M. Franz, Majorana fermions in a topological-insulator nanowire proximity-coupled to an s-wave superconductor, Phys. Rev. B 84, 201105(R) (2011).
- (13) Jin-Peng Xu, Mei-Xiao Wang, Z. L. Liu, Jian-Feng Ge, X. Yang, C. Liu, Z. A. Xu, D. Guan, C. L. Gao, D. Qian, Y. Liu, Qiang-Hua Wang, Fu-Chun Zhang, Qi-Kun Xue, and Jin-Feng Jia, Experimental Detection of a Majorana Mode in the core of a Magnetic Vortex inside a Topological Insulator-Superconductor Bi2Te3/NbSe2 Heterostructure, Phys. Rev. Lett. 114, 017001 (2015).
- (14) L. Fu and C. L. Kane, Topological insulators with inversion symmetry, Rev. Mod. Phys. 76, 045302 (2007).
- (15) M. Z. Hasan and C. L. Kane, Colloquium: Topological insulators, Rev. Mod. Phys. 82, 3045 (2010).
- (16) J. E. Moore, The birth of topological insulators, Nature 464, 194 (2010).
- (17) Xiao-Liang Qi and Shou-Cheng Zhang, Topological insulators and superconductors, Rev. Mod. Phys. 83, 3045 (2011).
- (18) Y. Ando, Topological Insulator Materials, J. Phys. Soc. Jpn. 82, 102001 (2013).
- (19) Y. Tokura, K. Yasuda, and A. Tsukazaki , Magnetic topological insulators, Nat. Rev. Phys. 1, 126 (2019).
- (20) Xiao-Liang Qi, T. L. Hughes, and Shou-Cheng Zhang, Topological field theory of time-reversal invariant insulators, Phys. Rev. B 78, 195424 (2008).
- (21) I. Garate and M. Franz, Inverse Spin-Galvanic Effect in the Interface between a Topological Insulator and a Ferromagnet, Phys. Rev. Lett. 104, 146802 (2010).
- (22) Su-Yang Xu, M. Neupane, C. Liu, D. Zhang, A. Richardella, L. A. Wray, N. Alidoust, M. Leandersson, T. Balasubramanian, J. Sánchez-Barriga, O. Rader, G. Landolt, B. Slomski, J. H. Dil, J. Osterwalder, Tay-Rong Chang, Horng-Tay Jeng, H. Lin, A. Bansil, N. Samarth, and M. Z. Hasan, Hedgehog spin texture and Berry’s phase tuning in a magnetic topological insulator, Nature 8, 616 (2012).
- (23) W. A. Fertig, D. C. Johnston, L. E. DeLong, R. W. McCallum, M. B. Maple, and B. T. Matthias, Destruction of Superconductivity at the Onset of Long-Range Magnetic Order in the Compound ErRh4B4, Phys. Rev. Lett. 38, 987 (1977).
- (24) R. Nagarajan, C, Mazumdar, Z. Hossain, S. K. Dhar, K. V. Gopalakrishnan, L. C. Gupta, C. Godart, B. D. Padalia, and R. Vijayaraghavan, Bulk superconductivity at an elevated temperature ( K) in a nickel containing alloy system Y-Ni-B-C, Phys. Rev. Lett. 72, 274 (1994).
- (25) K. Ghosh, S. Ramakrishnan, S. K. Dhar, S. K. Malik, G. Chandra, V. K. Pecharsky, K. A. Gschneidner, Jr., Z. Hu, and W. B. Yelon, Crystal structures and low-temperature behaviors of the heavy-fermion compounds CeRuGe3 and containing both trivalent and tetravalent cerium, Phys. Rev. B 52, 7267 (1995).
- (26) N. J. Curro, P. C. Hammel, P. G. Pagliuso, J. L. Sarrao, J. D. Thompson, and Z. Fisk, Evidence for spiral magnetic order in the heavy fermion material CeRhIn5, Phys. Rev. B 62, R6100(R) (2000).
- (27) M. F. Hundley, J. L. Sarrao, J. D. Thompson, R. Movshovich, M. Jaime, C. Petrovic, and Z. Fisk, Unusual Kondo behavior in the indium-rich heavy-fermion antiferromagnet , Phys. Rev. B 65, 024401 (2001).
- (28) A. Sakai and S. Nakatsuji, Strong valence fluctuation effects in SmAl20 ( = Ti, V, Cr), Phys. Rev. B 84, 201106(R) (2011).
- (29) H. Yamaoka, Y. Ikeda, I. Jarrige, N. Tsujii, Y. Zekko, Y. Yamamoto, J. Mizuki, J.-F. Lin, N. Hiraoka, H. Ishii, K.-D. Tsuei, T. C. Kobayashi, F. Honda, and Y. Onuki, Role of Valence Fluctuations in the Superconductivity of Ce122 Compounds, Phys. Rev. Lett. 113, 086403 (2014).
- (30) V. K. Pecharsky and K. A. Gschneidner, Jr., Giant Magnetocaloric Effect in , Phys. Rev. Lett. 78, 4494 (1997).
- (31) S. Pakhira, C. Mazumdar, R. Ranganathan, S. Giri, and M. Avdeev, Large magnetic cooling power involving frustrated antiferromagnetic spin-glass state in NiSi3 ( = Gd, Er), Phys. Rev. B 94, 104414 (2016).
- (32) S. Pakhira, C. Mazumdar, R. Ranganathan, and M. Avdeev, Magnetic frustration induced large magnetocaloric efect in the absence of long range magnetic order, Sci. Rep. 7, 7367 (2017).
- (33) K. H. J. Buschow and H. J. van Daal, Evidence for the Presence of the kondo effect in the Compound CeAl2, Phys. Rev. Lett. 23, 408 (1969).
- (34) D. Gignoux and J. C. Gomez-Sal, Competition between the Kondo effect and exchange interactions in the CeNixPt1-x compounds, Phys. Rev. B 30, 3967 (1984).
- (35) K. Ishida, K. Okamoto, Y. Kawasaki, Y. Kitaoka, O. Trovarelli, C. Geibel, and F. Steglich, : Spin Fluctuations in the Vicinity of a Quantum Critical Point at Low Magnetic Field, Phys. Rev. Lett. 89, 107202 (2002).
- (36) J. Arndt, O. Stockert, K. Schmalzl, E. Faulhaber, H. S. Jeevan, C. Geibel, W. Schmidt, M. Loewenhaupt, and F. Steglich, Spin Fluctuations in Normal State on Approaching the Quantum Critical Point, Phys. Rev. Lett. 106, 246401 (2011).
- (37) M. Hirschberger, S. Kushwaha, Z. Wang, Q. Gibson, S. Liang, C. A. Belvin, B. A. Bernevig, R. J. Cava, and N. P. Ong, The chiral anomaly and thermopower of Weyl fermions in the half-Heusler GdPtBi, Nat. Mater. 15, 1161 (2016).
- (38) A. Wang, I. Zaliznyak, W. Ren, L. Wu, D. Graf, V. O. Garlea, J. B. Warren, E. Bozin, Y. Zhu, and C. Petrovic, Magnetotransport study of Dirac fermions in YbMnBi2 antiferromagnet, Phys. Rev. B 94, 165161 (2016).
- (39) A. F. May, M. A. McGuire, and B. C. Sales, Effect of Eu magnetism on the electronic properties of the candidate Dirac material EuMnBi2, Phys. Rev. B 90, 075109 (2014).
- (40) J.-R. Soh, P. Manuel, N. M. B. Schröter, C. J. Yi, F. Orlandi, Y. G. Shi, D. Prabhakaran, and A. T. Boothroyd, Magnetic and electronic structure of Dirac semimetal candidate EuMnSb2, Phys. Rev. B 100, 174406 (2019).
- (41) I. Schellenberg, U. Pfannenschmidt, M. Eul, C. Schwickert, and R. Pöttgen, A 121Sb and 151Eu Mössbauer Spectroscopic Investigation of EuCd ( = P, As, Sb) and YbCd2Sb2, Z. Anorg. Allg. Chem. 637, 1863 (2011).
- (42) N. H. Jo, B. Kuthanazhi, Y. Wu, E. Timmons, Tae-Hoon Kim, L. Zhou, Lin-Lin Wang, B. G. Ueland, A. Palasyuk, D. H. Ryan, R. J. McQueeney, K. Lee, B. Schrunk, A. A. Burkov, R. Prozorov, S. L. Bud́ko, A. Kaminski, and P. C. Canfield, Manipulating of magnetism in the topological semimetal EuCd2As2, arXiv:2002.10485 (2020).
- (43) Y. Xu, Z. Song, Z. Wang, H. Weng, and X. Dai, Higher-Order Topology of the Axion Insulator EuIn2As2, Phys. Rev. Lett. 122, 256402 (2019).
- (44) F. Kabir, M. M. Hosen, F. Cheenicode-Kabeer, A. Aperis, X. Ding, G. Dhakal, K. Dimitri, C. Sims, S. Regmi, L. Persaud, K. Gofryk, P. M. Oppeneer, D. Kaczorowski, and M. Neupane, Observation of multiple Dirac states in a magnetic topological material EuMg2Bi2, arXiv:1912.08645 (2019).
- (45) A. F. May, M. A. McGuire, D. J. Singh, R. Custelcean, and G. E. Jellison Jr., Structure and Properties of Single Crystalline CaMg2Bi2, EuMg2Bi2, and YbMg2Bi2, Inorg. Chem. 50, 11127 (2011).
- (46) D. Ramirez, A. Gallagher, R. Baumbach, T. Siegrist, Synthesis and characterization of the divalent samarium Zintl-phases SmMg2Bi2 and SmMg2Sb2, J. Solid. State. Chem. 231, 217 (2015).
- (47) D. C. Johnston, Magnetic Susceptibility of Collinear and Noncollinear Heisenberg Antiferromagnets, Phys. Rev. Lett. 109, 077201 (2012).
- (48) D. C. Johnston, Unified molecular field theory for collinear and noncollinear Heisenberg antiferromagnets, Phys. Rev. B 91, 064427 (2015).
- (49) J. Rodríguez-Carvajal, Recent advances in magnetic structure determination by neutron powder diffraction, Physica B 192, 55 (1993).
- (50) M. A. Tanatar, A. E. Böhmer, E. I. Timmons, M. Schütt, G. Drachuck, V. Taufour, K. Kothapalli, A. Kreyssig, S. L. Bud́co, P. C. Canfield, R. M. Fernandes, and R. Prozorov, Origin of the Resistivity Anisotropy in the Nematic Phase of FeSe, Phys. Rev. Lett. 117, 127002 (2016).
- (51) C. Zheng, R. Hoffmann, R. Nesper, and H. G. Von Schnering, Site preferences and bond length differences in CaAl2Si2-type Zintl compounds, J. Am. Chem. Soc. 108, 1876 (1986).
- (52) T. Katsufuji, S. Mori, M. Masaki, Y. Moritomo, N. Yamamoto, and H. Takagi, Dielectric and magnetic anomalies and spin frustration in hexagonal MnO3 ( = Y, Yb, and Lu), Inorg. Chem. 64, 104419 (2001).
- (53) P. J. Brown and T. Chatterji, Neutron diffraction and polarimetric study of the magnetic and crystal structures of HoMnO3 and YMnO3, J. Phys.: Condens. Matter 18, 10085 (2006).
- (54) S. Maruyama, H. Tanaka, Y. Narumi, K. Kindo, H. Nojiri, M. Motokawa, and K. Nagata, Susceptibility, Magnetization Process and ESR Studies on the Helical Spin System RbCuCl3, J. Phys. Soc. Jpn. 70, 859 (2001).
- (55) D. C. Johnston, Magnetic structure and magnetization of -axis helical Heisenberg antiferromagnets with XY anisotropy in high magnetic fields transverse to the helix axis at zero temperature, Phys. Rev. B 99, 214438 (2019).
- (56) T. Nagamiya, Helical Spin Ordering. 1. Theory of Helical Spin Configurations, in Solid State Physics, Vol. 20, edited by F. Seitz, D. Turnbull, and H. Ehrenreich (Academic Press, New York, 1967), pp. 305–411.
- (57) D. C. Johnston, Influence of uniaxial single-ion anisotropy on the magnetic and thermal properties of Heisenberg antiferromagnets within unified molecular field theory, Phys. Rev. B 95, 094421 (2017).
- (58) D. C. Johnston, Magnetic structure and magnetization of helical antiferromagnets in high magnetic fields perpendicular to the helix axis at zero temperature, Phys. Rev. B 96, 104405 (2017).
- (59) R. J. Goetsch, V. K. Anand, A. Pandey, and D. C. Johnston, Structural, thermal, magnetic, and electronic transport properties of the LaNi2(Ge1-xPx)2 system, Phys. Rev. B 85, 054517 (2012).
- (60) N. S. Sangeetha, E. Cuervo-Reyes, A. Pandey, and D. C. Johnston, EuCo2P2: A model molecular-field helical Heisenberg antiferromagnet, Phys. Rev. B 94, 014422 (2016).
- (61) N. S. Sangeetha, V. K. Anand, E. Cuervo-Reyes, V. Smetana, A.-V. Mudring, and D. C. Johnston, Enhanced moments of Eu in single crystals of the metallic helical antiferromagnet EuCo2-yAs2, Phys. Rev. B 97, 144403 (2018).
- (62) N. S. Sangeetha, V. Smetana, A.-V. Mudring, and D. C. Johnston, Helical antiferromagnetic ordering in EuNi1.95As2 single crystals, Phys. Rev. B 100, 094438 (2019).
- (63) A. F. May, M. A. McGuire, D. J. Singh, J. Ma, O. Delaire, A. Huq, W. Cai, and H. Wang, Thermodelectric transport properties of , , and , Phys. Rev. B 85, 035202 (2012).
- (64) L. Kouwenhoven and L. Glazman, Revival of the Kondo effect, Phys. World 14, 33 (2001).
- (65) P. W. Anderson, Absence of diffusion in certain random lattices, Phys. Rev. 109, 1492 (1958).
- (66) J. Paglione, M. A. Tanatar, D. G. Hawthorn, R. W. Hill, F. Ronning, M. Sutherland, L. Taillefer, C. Petrovic, and P. C. Canfield, Heat Transport as a Probe of Electron Scattering by Spin Fluctuations: The Case of Antiferromagnetic CeRhIn5, Phys. Rev. Lett. 94, 216602 (2005).
- (67) J. Jensen, Theory of commensurable magnetic structures in holmium, Phys. Rev. B 54, 4021 (1996).