Mathematical model of mating probability and fertilized egg production in helminth parasites
Abstract
In the modeling of parasite transmission dynamics, understanding the reproductive characteristics of these parasites is crucial.
This paper presents a mathematical model that explores the reproductive behavior of dioecious parasites and its impact on transmission dynamics.
Specifically, the study focuses on the investigation of various reproductive variables such as the mating probability and the fertilized egg production in the case of helminth parasites.
While previous studies have commonly assumed Poisson and negative binomial distributions to describe the distribution of parasites among hosts, this study adopts an arbitrary distribution model and examines its consequences on some reproductive variables. These variables include mean number of fertile females, mean egg production, mating probability and mean fertilized egg production.
In addition, the study of these variables takes into account the sex distribution of the parasites and whether male and female parasites are considered to be distributed together or separately.
We show that the models obtained for the case of male and female parasites distributed separately in the hosts are ecologically unrealistic.
We present the results obtained for some specific models and we tested the models obtained in this work using Monte Carlo simulations.
Keywords: dioecious parasite; Mating probability; egg production; Negative binomial distribution; Mathematical Model;
1 Introduction
The mating probability of female parasites is a key factor in understanding the transmission dynamics of dioecious parasites. It is influenced by several factors, including parasite mating habits (polygamous vs. monogamous), sex ratio, mean parasite burden (mean of number of parasites per host), and the distribution pattern of female and male parasites within the host population (parasite sex distributed together or separately).
Previous models (Macdonald et al., 1965; Nåsell and Hirsch, 1973) estimated the mating probability by assuming that adult parasites are independently and randomly distributed among the hosts (Poisson distribution).
Later models (May, 1977; Bradley and May, 1978; May and Woolhouse, 1993) estimated mating probability by assuming that adult parasites are aggregated or clumped in their distribution (negative binomial distribution).
Theoretical models suggest that a high mating probability is associated with polygamous mating, a male-biased sex ratio, a high mean parasite burden, and a high degree of aggregation, provided that male and female parasites aggregate together (May, 1977; Bradley and May, 1978; May and Woolhouse, 1993). Mating probabilities for different types of polygamous parasites (ectoparasites, nematodes and helminths) have been calculated using previous models (Haukisalmi et al., 1996; Cox et al., 2017).
Another important aspect of parasite transmission dynamics is the production of new parasite stages, such as infective eggs and larvae, which is influenced by female parasite mating and female fecundity (Anderson and May, 1992).
In the case of parasitic helminths in particular, female fecundity exhibits negative density-dependent processes that limit growth rates in high-density populations and help to stabilise natural communities.
This has important implications for the stability and transmission dynamics of these populations, and it is essential to incorporate these processes into mathematical models with high accuracy to better understand their dynamic behaviour (Anderson and May, 1978, 1992; Churcher et al., 2005, 2006; Churcher and Basáñez, 2008). In particular, density-dependent egg production has been reported in human helminth infections, with per capita egg production decreasing as the number of parasites per host (parasite burden) increases (Hall and Holland, 2000; Churcher et al., 2006).
In this paper, we extend previous mating probability models to a more general and challenging scenario where the parasite distribution in the host population follows an arbitrary statistical model. This extension is necessary because several studies (Abdybekova and Torgerson, 2012; Crofton, 1971; Denwood et al., 2008; Lopez and Aparicio, 2023; Ziadinov et al., 2010) have reported parasite distributions other than the traditional ones, such as zero-inflated and hurdle models.
Based on this new model for the mating probability of female parasites, and taking into account the density-dependent aspects of helminth parasite fecundity, our second aim in this work is to determine the mean number of infective egg production per host and the probability of producing infective eggs. We also show how these variables can be incorporated into mean burden-based models of helminth infection.
Finally, we tested the models obtained in this work using Monte Carlo simulations in which we recreated some distributions of parasites in the host population.
2 Parasite sex distribution among hosts
2.1 Distribution and abundance of parasites
The distribution of parasites among hosts is a crucial aspect of host-parasite interactions. Typically, parasites exhibit a clustered or aggregated distribution, where a small proportion of hosts harbor the majority of parasites, while the majority of hosts remain parasite-free (Shaw and Dobson, 1995; Shaw et al., 1998). This distribution follows the widely recognized 20-80 rule, where 20% of individuals contribute to 80% of the parasite burden (Woolhouse et al., 1997).
Aggregation is considered a fundamental characteristic of parasitism and is often referred to as the ”First Law of Parasitism” (Crofton, 1971; Poulin, 2007).
In statistical terms, a distribution is considered aggregated when the variance-to-mean ratio of the number of parasites per host is significantly greater than one. To describe the distribution of parasites among hosts, the negative binomial distribution is commonly employed. This discrete and flexible distribution, characterized by two parameters (Fisher et al., 1941), fits well with the observed aggregation in nature (Bliss and Fisher, 1953). Consequently, several theoretical models of host-parasite dynamics implicitly assume the negative binomial distribution (Anderson and May, 1978; Adler and Kretzschmar, 1992).
However, it is important to note that the negative binomial distribution provides only a phenomenological description of aggregation, and its parameters are not explicitly linked to underlying processes governing host exposure to parasites and parasite success in infecting hosts (Duerr and Dietz, 2000; Gourbière et al., 2015).
In parasitology, the sex ratio of a parasite population is often quantified by the proportion of female parasites () and the proportion of male parasites (). The male-to-female sex ratio, expressed as , serves as a significant metric in the study of parasitic infections. Another important metric is the mean number of female parasites per host. If represents the mean parasite burden, the mean number of female and male parasites can be calculated as and , respectively. By understanding the sex ratio and the mean number of female parasites per host, researchers can gain valuable insights into the transmission and spread of parasitic infections.
2.2 Female and male parasites distributed together
In this section we use random variables to model the distribution of parasites in hosts. Let be the random variable representing the number of parasites in a host, also known as the parasite burden. The variable is distributed according to the distribution of parasites in the hosts. In this section we assume that male and female parasites are distributed together in hosts. Therefore, we consider the number of female and male parasites per host as two dependent random variables, denoted and , respectively. The total number of parasites per host, , is then the sum of and . To model the distribution of female parasites per host, we can model the number of female parasites per host, , as a random sum of other random variables, modeled by a stopped-sum model (Johnson et al., 2005), defined as where the are independent identically distributed (iid) Bernoulli random variables with parameter (). Its probability generating function (pgf) is the function composition , where is the pgf of the random variable and is the pgf of the Bernoulli distribution given by . Therefore, its pgf is of the form
| (1) |
The first moments of are
| (2) |
where and are the mean and variance of . The index of dispersion or variance-to-mean ratio (Cox and Lewis, 1966), , is given by
| (3) |
where is the variance-to-mean ratio of . Therefore, if is over-dispersed, so will .
Similarly, we define the random variable , the number of male parasites per host, as a randomly stopped-sum definity by where the are iid Bernoulli random variables with . Its pgf is of the form and the mean and variance are and , respectively. Note that for definition and are dependent random variables.
In practice, the distribution of the variable is known. Therefore, by obtaining the pgf and , we can determine the distributions of the variables and . A general class of distributions exists in which the statistical model of is conserved. This class includes the Poisson, binomial and negative binomial distributions, among others, which are widely used for counting models (Johnson et al., 2005).
In the paper, we define by , where is the probability mass function of the parasite distribution and is a parameter vector in which can include the mean, , of the parasite distribution.
2.3 Fertilized female parasites and mating probability
In this paper we considered a polygamous mating system for parasites, i.e. a male parasite can fertilize all female parasites in the same host (May and Woolhouse, 1993). Since the expression is the probability of having at least one male parasite in a parasite burden of size , we obtained the following result
Proposition 2.3.1.
The mean number of fertilized female parasites is given by
| (4) |
Then we can estimate the mating probability of a female parasite as the quotient of the mean number of fertilized female parasites per host, , and the mean number of female parasites per host, . Therefore, a expression for mating probability (denoted by ) as a function of mean parasite burden is given by
Theorem 2.3.2.
The mating probabillity of a female parasite is given by
| (5) |
2.4 Density-dependent fecundity of helminth parasites
In population ecology, density-dependent processes occur when population density affects growth rates. In the case of parasites, these processes can affect their fecundity, establishment and survival in the host. For example, in helminth parasites, their fecundity has been observed to decrease as the parasite burden in the host increases (Churcher et al., 2006; Walker et al., 2009). This phenomenon is known as density-dependent fecundity, and it is explained by a negative exponential function that relates per capita fecundity to parasite burden
| (6) |
where is the per capita female fecundity within a host with a parasite burden of size , is the intrinsic fecundity in the absence of density-dependent effects, and is the density-dependent intensity. To simplify the notation in the rest of the text, we will express female fecundity by where . In summary, density-dependent effects are an important factor in parasite ecology, and may have significant implications for parasite population dynamics. For more information on this subject, see the study by Hall and Holland (2000) on Ascaris lumbricoides.
2.4.1 Fertilized egg production and egg fertility probability (mating probabillity with density-dependent effects)
Due to the effects of density-dependent fecundity, egg production per female decreases as the parasite burden in the host increases. Therefore, if is the egg production of females within a host with parasites, and is the probability that a host with parasites has females. Then, we obtain the following result for the mean egg production per host
Proposition 2.4.1.
The mean egg production per host is given by
| (7) |
For the case of the mean fertilized egg production per host, we use the previous proof, but considering only the egg production of fertilized female parasites. As a result, an expression for the mean fertilized egg production per host is given by
Proposition 2.4.2.
The mean fertilized egg production per host is given by
According to the results obtained previously, if we consider the quotient of the mean fertilized egg production and the mean egg production, we obtain the egg fertility probability or the mating probability of the female parasites under the density-dependent effects. Therefore, the mating probability with density-dependent effects of a female parasite as a function of the mean parasite burden is given by
Theorem 2.4.3.
The mating probabillity with density-dependent effects of a female parasite is given by
| (8) |
2.4.2 An application for mean burden-based models for helminth infections
In deterministic population models based on the mean parasite burden for the transmission dynamics of helminth infections, such as (Anderson and May, 1985, 1992; Lopez and Aparicio, 2022; Truscott et al., 2014), it is necessary to know the effective transmission contribution of the female population to the parasite reservoir (in form of eggs or larvae), assuming density-dependent processes (positive and/or negative) within the parasite life cycle. The effective transmission contribution term is commonly denoted by and can be calculated as shown in (Churcher et al., 2005, 2006; Lopez and Aparicio, 2022),
| (9) |
where the density-dependent fecundity is redefined as . Therefore, the function has a maximum value of one and separates the density-independent term from the density-dependent processes.
Using the results obtained in this paper, we can calculate as a function of the mean parasite burden , as follows
| (10) |
Therefore, if we know the distribution of parasites in hosts, we can calculate the mean egg production per host as
| (11) |
However, only hosts with at least one female and one male parasite will effectively contribute to the parasite reservoir by producing fertilized (or infective) eggs. The mean fertilized egg production per host is then (see e.g. Anderson and May (1992); Lopez and Aparicio (2022))
| (12) |
where we assume that and are functions of the mean parasite burden .
2.5 Some examples
In this section we will consider the most common statistical models used to describe the distribution of parasites among hosts.
2.5.1 Poisson
A simple model for the distribution of parasites per host is the Poisson distribution (Lahmar et al., 2001; Macdonald et al., 1965),
| (13) |
where is the mean parasite burden and its pgf is given by
| (14) |
For this parasite distribution the effective transmission contribution of female parasites to the transmission cycle is given by (see eq (10))
| (15) |
Other important factors in parasite dynamics are the mating probability and the mating probability with density-dependent effect , which are given by (see eq 5,8).
| (16) |
The expression for the mating probability is the same as in (Anderson and May, 1992; May and Woolhouse, 1993; May, 1977). The expression generalizes the mating probability of these works for the case of helminth parasites.
2.5.2 Negative binomial
In most cases, soil-transmitted helminths, present a distribution of parasites per host that can be well described by a negative binomial distribution (Bundy et al., 1987; Hoagland and Schad, 1978; Seo et al., 1979a),
| (17) |
where is the mean parasite burden and is the inverse dispersion parameter of the parasites. The corresponding pgf is given by
| (18) |
Therefore, the expression for , the effective transmission contribution, which is given by (see eq. (10))
| (19) |
Finally, the mating probability, , and the mating probability with density-dependent effect, , are given by (see eq. (8))
| (20) |
The expression of is the same as in Anderson and May (1992); May and Woolhouse (1993); May (1977) and the expression results in a generalization of the mating probability for the case of helminth parasites.
2.5.3 Zero-inflated and hurdle models
Other commonly used models are the zero-inflated and hurdle models (see e.g. Abdybekova and Torgerson (2012); Crofton (1971); Denwood et al. (2008); Ziadinov et al. (2010); Lopez and Aparicio (2023)). For a zero-inflated model, its probability mass function is
where is the probability mass function of a distribution without excess of zero counts and is the corresponding pgf. Then the pgf of the zero-inflated distribution is
and the mean burden is
For this model the expression for , the mean contribution per female parasite, which is given by
| (21) |
Finally the mating probability can be calculated by
| (22) |
A hurdle model is a two-part model, the first part, , is the probability of observing the zero value, and the second part is the probability of observing non-zero values. The use of hurdle models is often motivated by an excess of zero counts in the data, which is not sufficiently accounted for in more standard statistical models (Johnson et al., 2005). For this model, its probability mass function is given by
Its pgf and its mean are of the form
Therefore, the expresions for and are given by
| (23) |
where .
2.5.4 Zero-inflated Poisson and zero-inflated negative binomial models
Negative binomial distribution is widely used to describe parasite distribution in hosts (Crofton, 1971; Seo et al., 1979a). However, in many cases the negative binomial distribution (or other similar distributions) cannot account for the observed excess of zero counts (Crofton, 1971; Lopez and Aparicio, 2023). One solution to this problem is zero-inflated models, which have been widely used for parasite counts in the last decade (Abdybekova and Torgerson, 2012; Denwood et al., 2008; Lopez and Aparicio, 2023; Ziadinov et al., 2010).
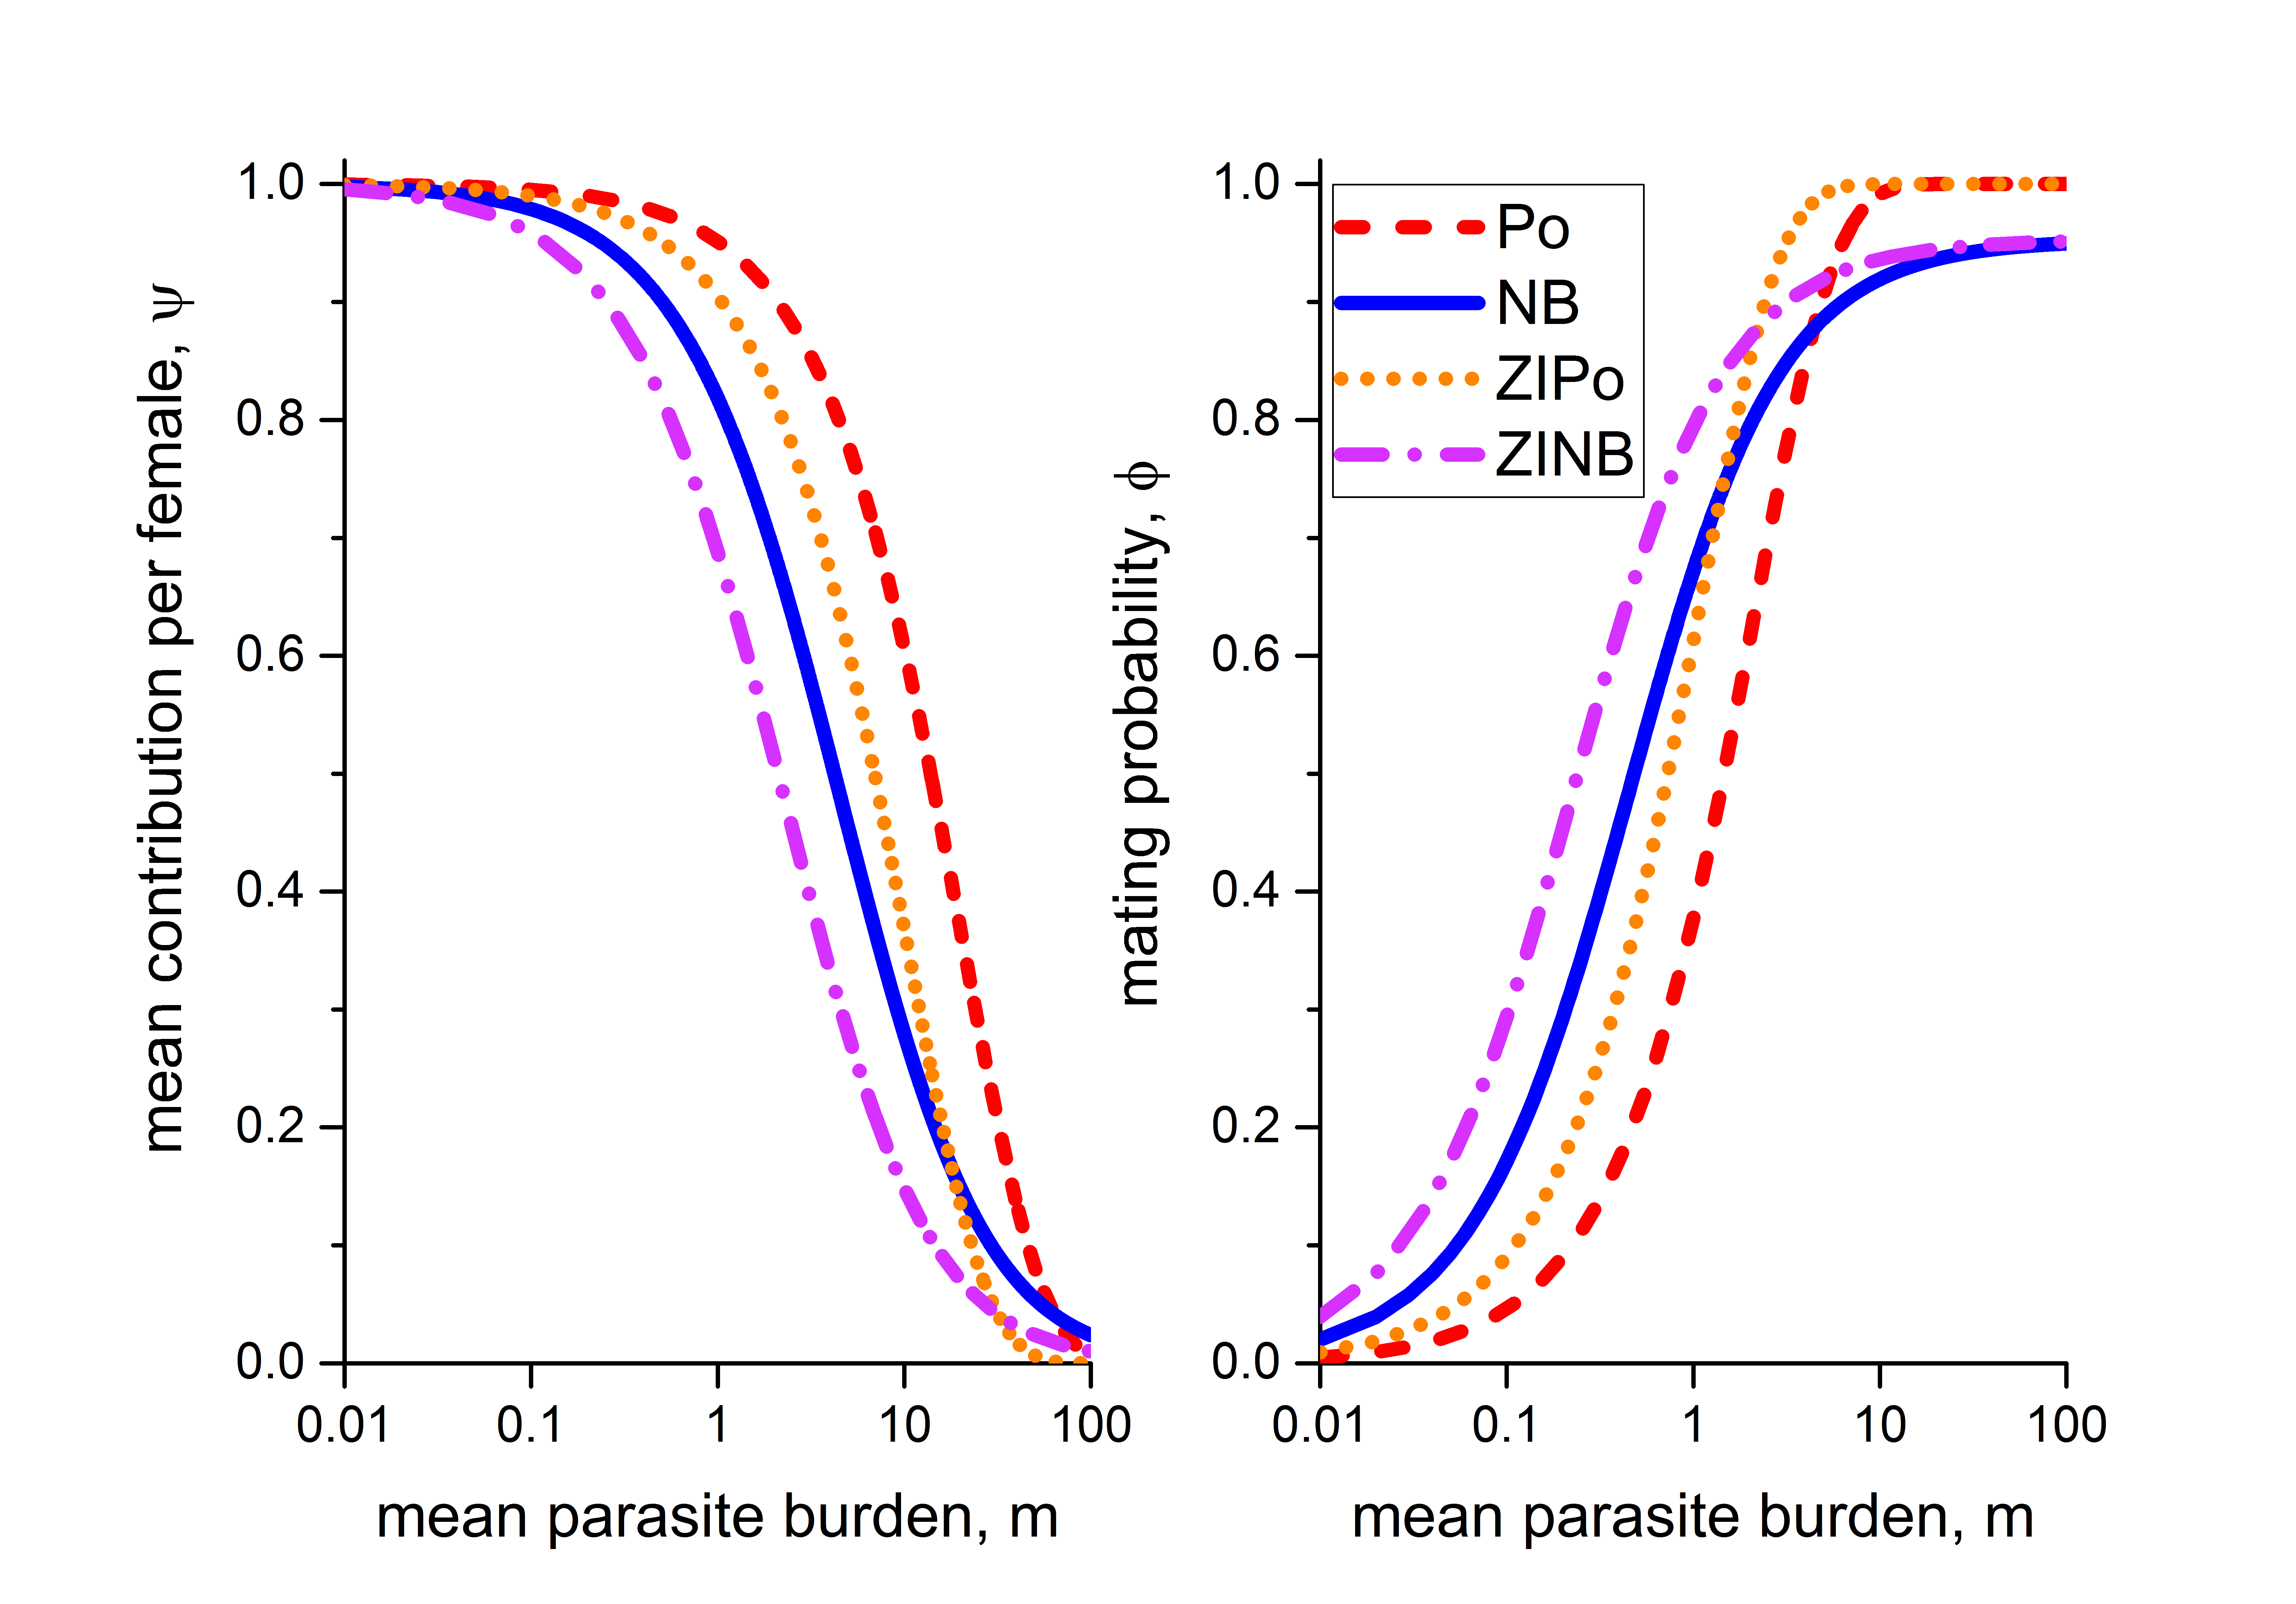
In table 1 we present the expressions for the effective transmission contribution and the mating probability with density-dependent effect for the zero-inflated Poisson and zero-inflated negative binomial models.
| Statistical model | ||
|---|---|---|
Note that to obtain the expression for the mating probability , we have to replace the variable in the expression for with 1. Plots of the effective transmission contribution () and the mating probability () for all the distributions discussed above are shown in Figure 1. We consider the parameters , , , (Anderson et al. (2014); Seo et al. (1979b)).
3 Can female and male parasites be distributed separately?
In this section we consider a case where the male and female parasites are distributed separately in the hosts. We assume that the random variables representing the number of male and female parasites per host are independent.
We show that in the common case of over-dispersed distributions, such as the negative binomial, independence leads to counter-intuitive results. This tells us that infection processes capable of producing independent distributions are unrealistic.
In the work of (May, 1977; Bradley and May, 1978), studies of the probability of mating were carried out taking into account a special condition: the separate distribution of female and male parasites in the hosts.
They found that the probability of mating is lower when considering this separate distribution than when considering the joint distribution. This is because the distribution of parasites is over-dispersed, making it difficult to find mates when there are few hosts with many parasites of the same sex.
On the other hand, empirical tests of mating probability have been carried out by (Cox et al., 2017; Poulin, 2007), assuming special conditions where female and male parasites are distributed separately in hosts. These studies concluded that the probability of mating is higher when the parasites are distributed together rather than separately.
3.1 Parasite sex distribution
In the previous section, we introduced the random variable , which represents the number of parasites in a host. We also introduced two additional random variables, and , representing the number of female and male parasites per host, respectively.
In this section we focus on the case where male and female parasites are distributed separately among hosts. Therefore, we assume that the random variables and are independent. This assumption allows us to investigate and verify the following properties:
| (24) |
where , and are probability generating function of the variables , and , respectively. From the definition of these random variables, we obtain that the first moments of the variables and are respectively
| (25) |
where and are the mean and variance of . The variance-to-mean ratios of the variables and are equal to , which is the variance-to-mean ratio of . Therefore, if is over-dispersed, and will also be over-dispersed. If we compare these variance-to-mean ratios with the case of the dependent variables (see (3)), we can see that the independent variables show a greater over-dispersion when is over-dispersed.
We now present an expression for each of the variables studied in the section 2. The proofs of these expressions can be found in the appendix LABEL:formulasind. Where is the mean of and is the probability mass function of .
-
•
Mean number of fertilized female parasites
(26) -
•
Mating probability
(27) -
•
Mean egg production per host
(28) -
•
Mean fertilized egg production per host
(29) -
•
Mating probability with density-dependent effects
(30) -
•
Mean effective transmission contribution by female parasite
(31) -
•
Contribution of mean fertilized egg production for mean-based deterministic model of parasite burden
(32)
3.2 Some examples
In this section, we show the results obtained for some of the statistical models used in the section 2.5.
3.2.1 Poisson
For the case where the distribution of parasites per host is Poisson with mean , . A solution for the independence of variables and are the following distributions
Note that the pgf of and coincide with what was obtained in section 2.2, which shows the independence of these variables in that section. The expressions obtained for and for this case are:
| (33) |
Note that the expression for and are the same as those obtained in the section 2.5.1.
3.2.2 Negative binomial
For the case of a negative binomial parasite distribution with parameters and , . A solution for the independence of and are the following distributions:
For this case, the pgf of and are not equal to those obtained in section 2.2, since it was shown that the variables were not independent. The expressions obtained for and for this case are:
| (34) |
Note that the expression is the same one obtained in the section 2.5.2. On the other hand, the mating probability is , which is the expression that May (1977) obtained for and .
3.2.3 Zero-inflated negative binomial
We now consider the case where the random variables and are zero-inflated negative binomial distributed.
Note that is not distributed as a zero-inflated negative binomial. However, the mean and variance of are
| (35) |
that coincide with the first moments of the model presented in section 2.5.4 for the case dependent variables. The expressions obtained for and for this case are:
| (36) |
Note that the expressions for and are different from those obtained in the section on dependent variables 2.5.4. The mating probability expression is given by . The last expression is the mating probability associated with as in the section 3.2.2, multiplied by the term , which is the probability of observing non-zero values in the zero-inflated model.
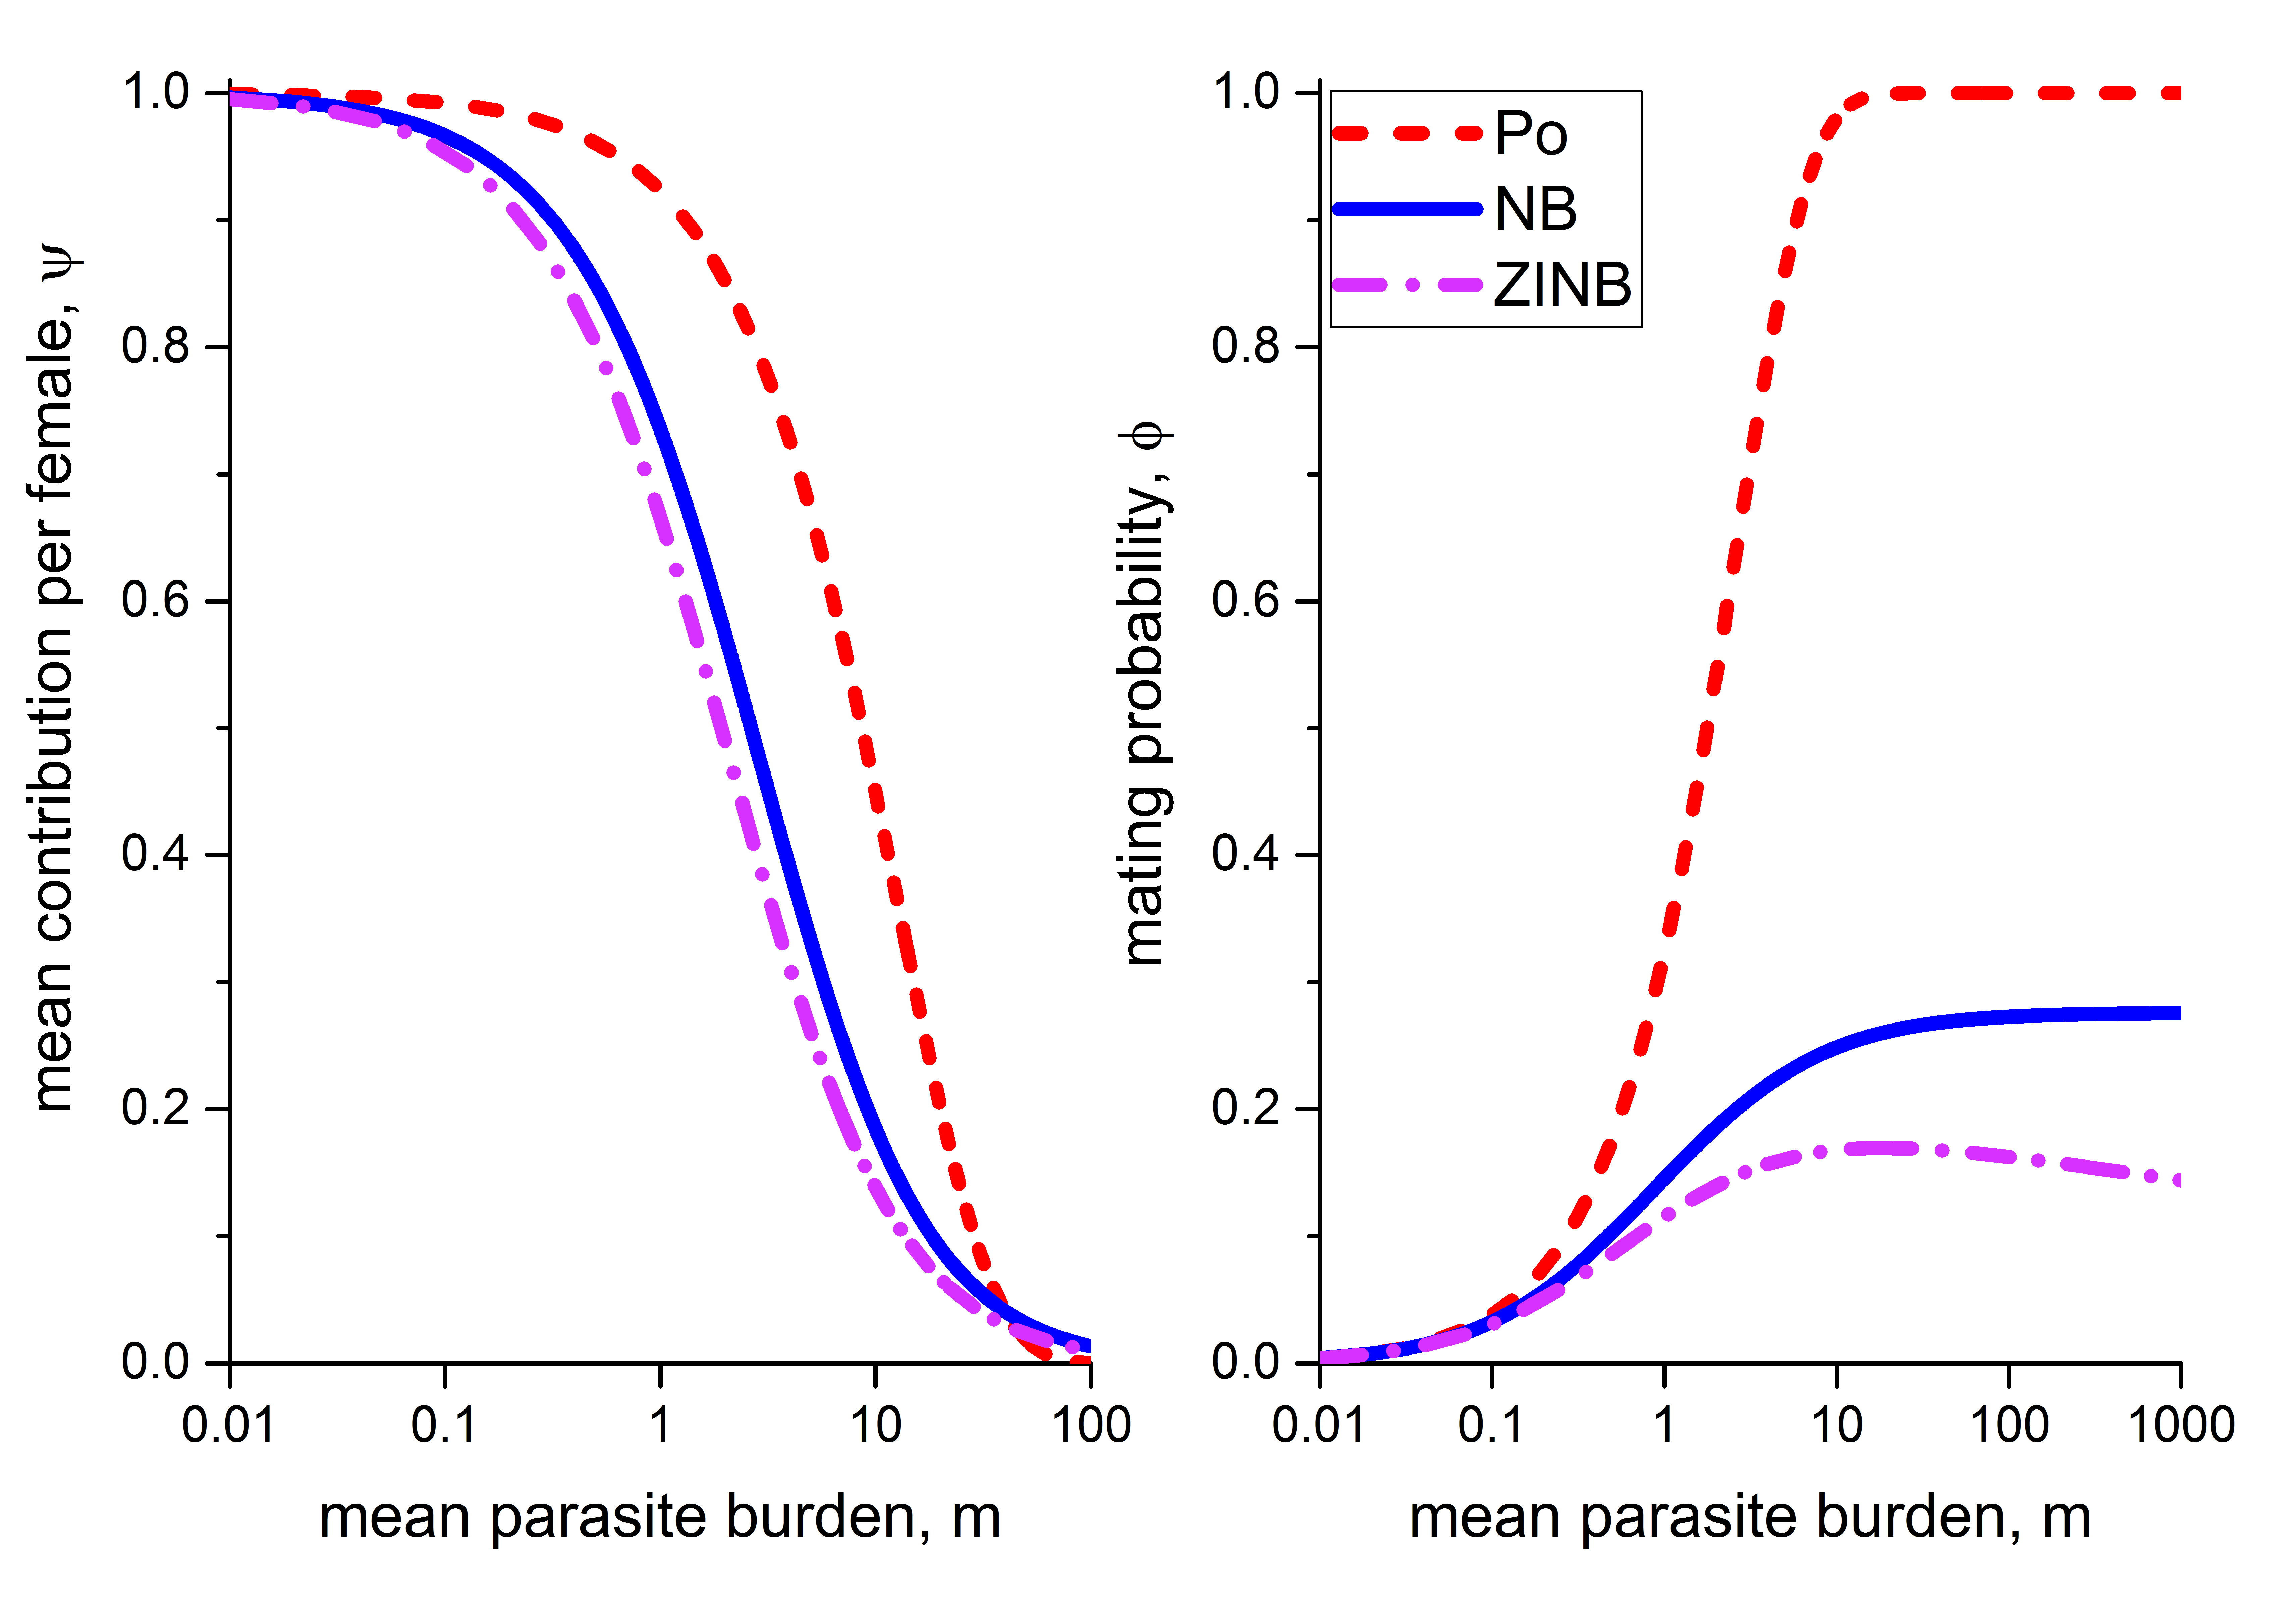
Plots of the effective transmission contribution () and the mating probability () for all the distributions discussed above are shown in Figure 2. We consider the parameters , , , (Anderson et al., 2014; Seo et al., 1979b).
4 Monte Carlo simulations
Monte Carlo simulations are computational algorithms that use random sampling and statistical analysis to solve problems or simulate complex systems. A model is created to represent the real-world system, which is run many times with random inputs. The results are statistically analyzed to generate a distribution of possible outcomes.
4.1 Model assumptions
Simulation algorithms presented in this section are based on the following assumptions and rules:
-
•
We considered a host population of size .
-
•
The parasite burden of each host is a random variable . Female and male burdens are random variables, and respectively. The values of the random variables will be denoted by , and respectively.
-
•
Distributed together: The individual parasite burden per host is a value associated to the variable W with some assumed distribution (Poisson, negative binomial, etc.). The individual female parasite burden () is then obtained as the result of Bernoulli trials with the success parameter , where is the sex ratio of the female parasites. The individual male parasite burden is then obtained as .
-
•
Distributed separately: The values of the individual female and male parasite burdens ( and , respectively) are associated with the variables and , respectively. These variables have assumed distributions (Poisson, negative binomial, etc.) that satisfy the equations (24)(25). The individual parasite burden per host, , is then obtained as .
-
•
The egg production per host is given by , where with the density-dependence intensity.
-
•
The infective egg production per host is given by , where is the indicator function of the set .
-
•
The fertilized female parasites are female parasites where the individual male parasite burden is non-zero ().
-
•
The mean effective transmission contribution per female parasite is obtained by quotient of the mean number egg production per host and the mean of female parasites per host.
-
•
The mating probability is obtained by quotient of the mean number of fertilized female parasites per host and the mean number of female parasites per host.
-
•
The mating probabillity with density-dependent effects is obtained by quotient of the mean number infective egg production and the mean number egg production.
All the simulations were carried out in RStudio (Version 2022.12.0+353).
4.2 Some examples
In this section, we present the results obtained from Monte Carlo simulations, considering a distribution of parasites in the host population based on negative binomial and zero-inflated negative binomial models.
4.2.1 Negative Binomial
In this section, we report the empirical values of and obtained from Monte Carlo simulations of a host population of size N. For each host, we simulated its parasite burden based on a negative binomial model, and we distributed the parasites by sex according to their sexual radius.
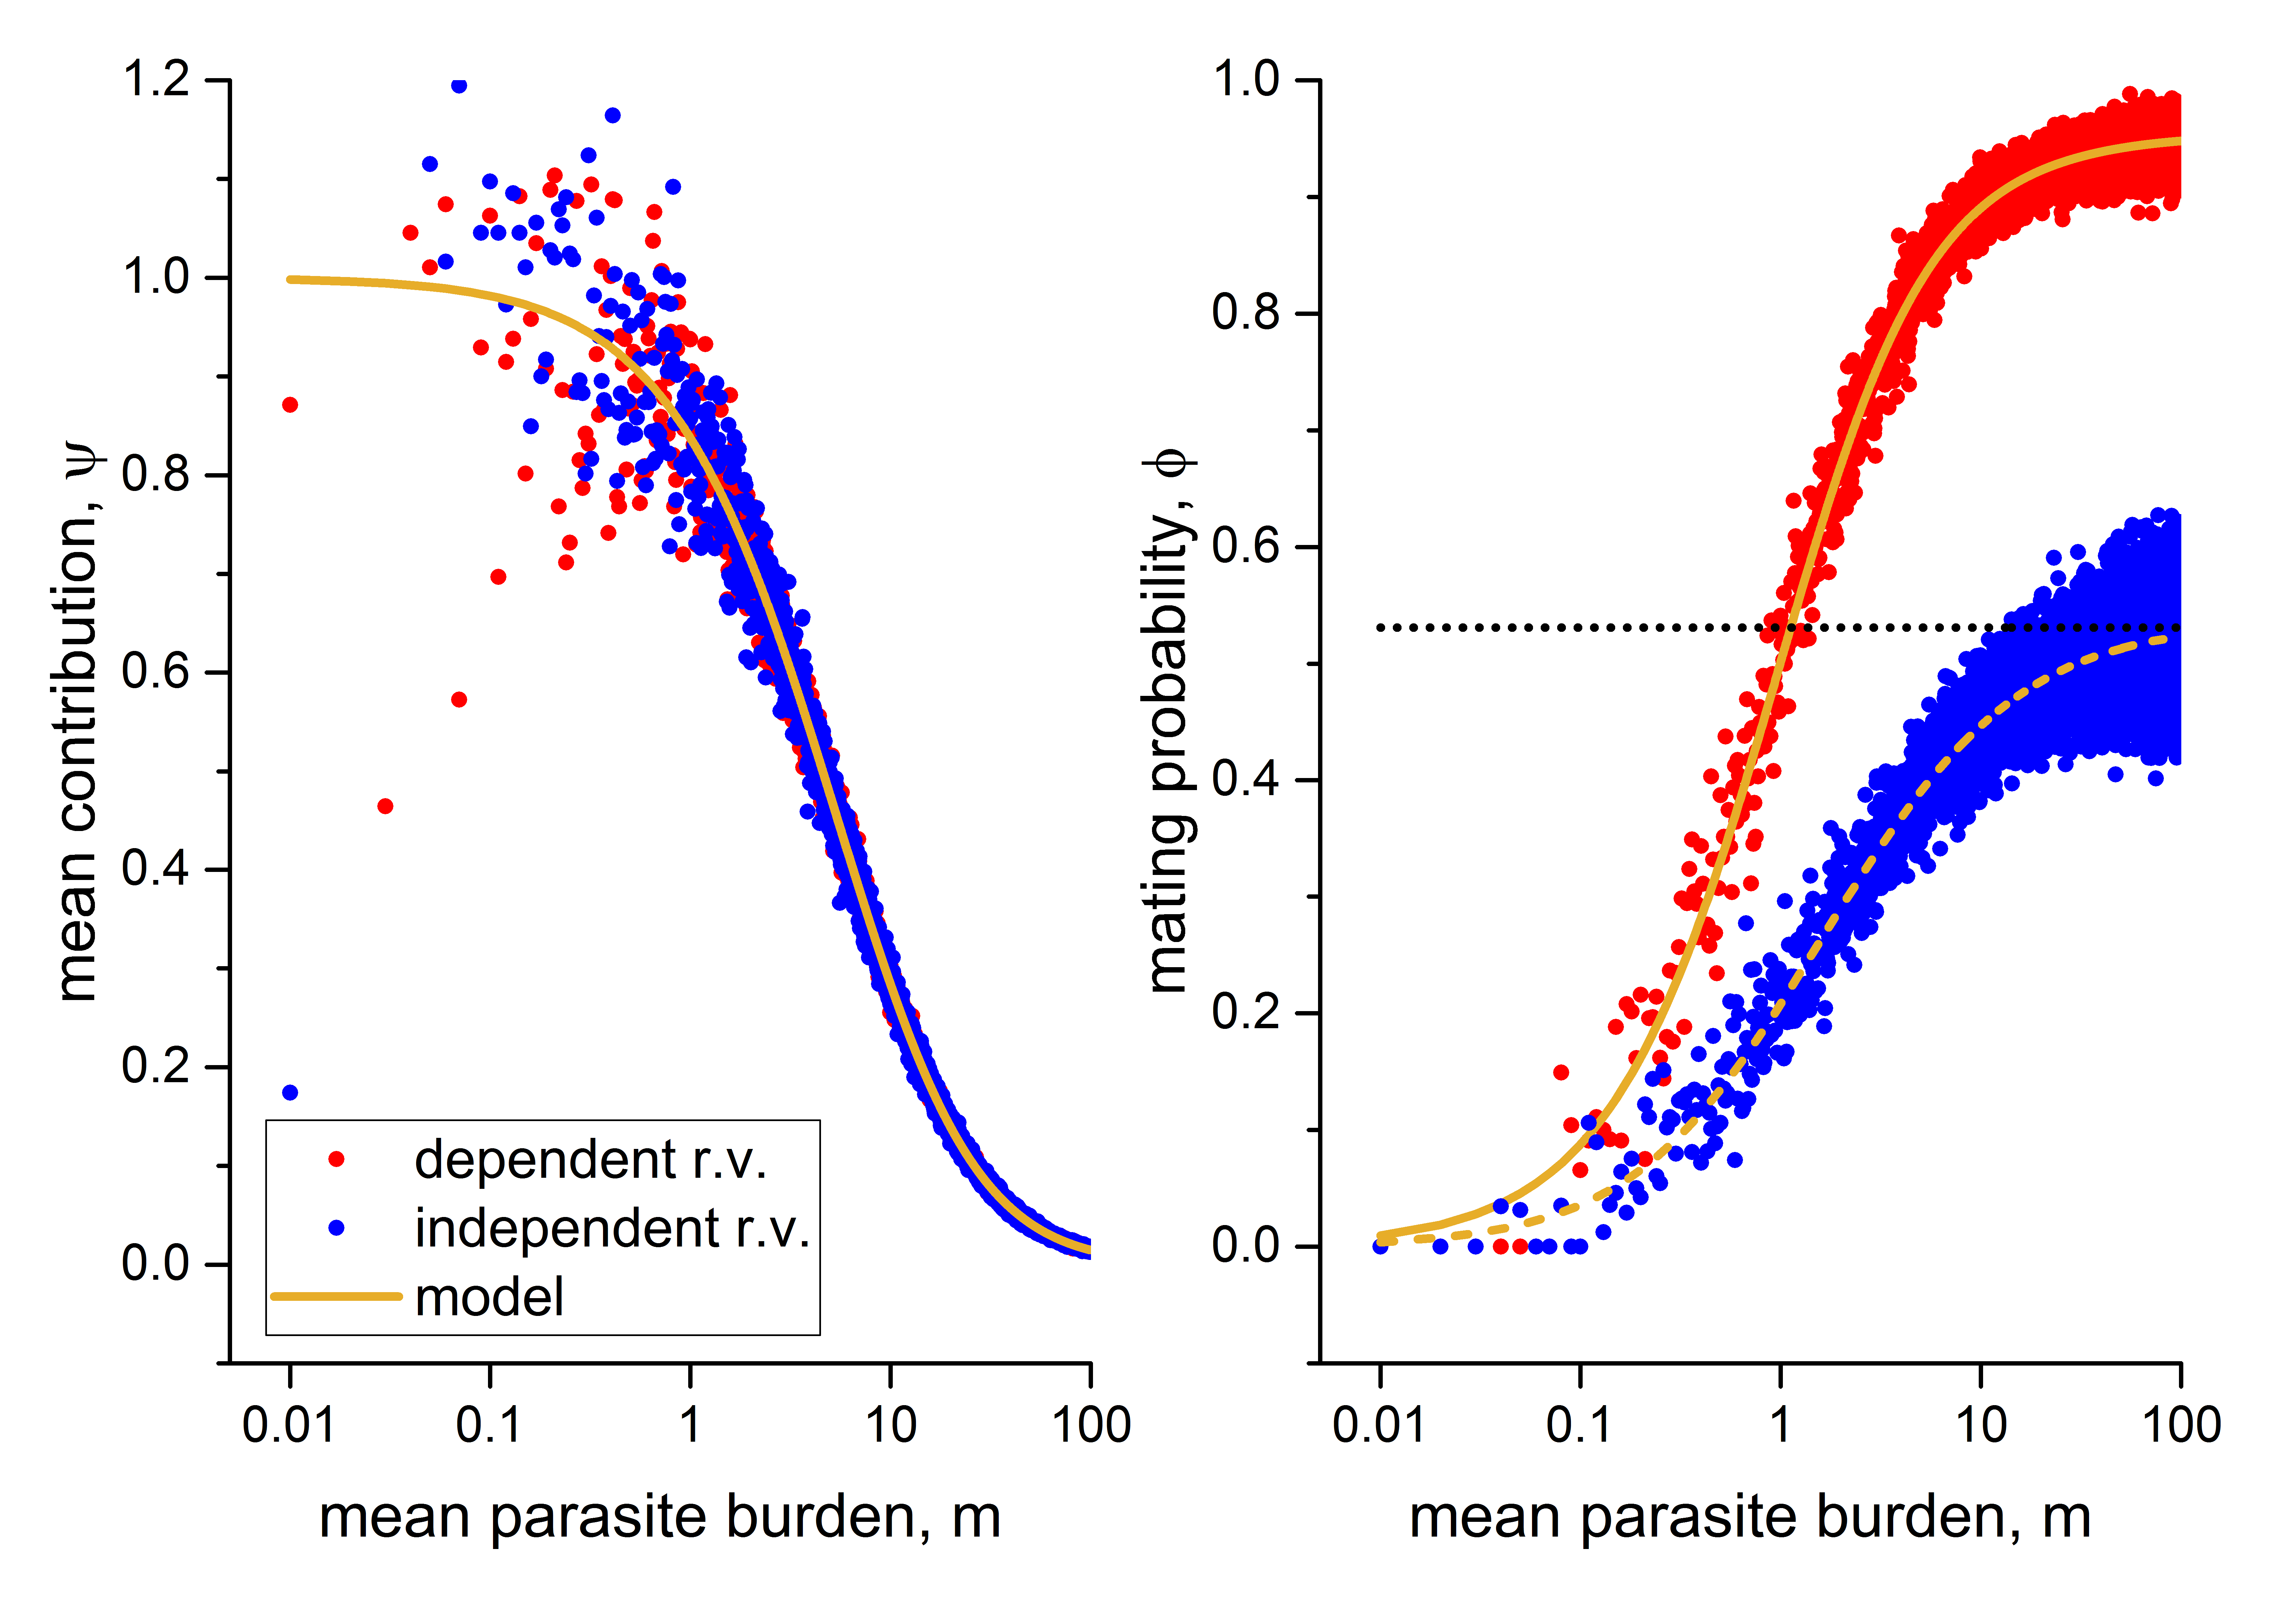
Figure 3 shows the empirical values of the mean contribution, , and the mating probability, , obtained from the Monte Carlo simulations. The blue and red points represent the empirical values of and for female and male parasites distributed together or separately, while the continuous and dashed curves show the theoretical models obtained for and respectively.
As seen in Figure 3, the empirical values of are well-modeled by the theoretical model, as both models coincide for the cases of parasites distributed together or separately (as obtained in (19) and (34)).
Similarly, the empirical values of for the cases of parasites distributed together or separately (blue and red points, respectively) are well-modeled by their respective theoretical models (continuous and dashed curves, respectively).
We also show the asymptotes (black dotted lines) for each of the theoretical models obtained for . It is worth noting that the values of the mating probability are close to one for the parasites distributed together case and further from one for the parasites distributed separately case.
Intuitively, we understand that the overdispersion in the distribution of parasites per host affects the mating probability since there are few hosts with many parasites, both females and males according to their sexual radius, to ensure mating. In the parasites distributed separately case, the negative effect of overdispersion is even greater because there are few hosts with many male parasites and few hosts with many female parasites. As a result, the occurrence of these two conditions in the same host is even more unlikely.
5 Discussion and Conclusions
We propose a model for the distribution of parasites among hosts, focusing on the distributions of females and males. Our model takes into account various reproductive variables of the parasites, such as the average number of fertilized female parasites, mean egg production, mating probability, mean fertilized egg production, and density-dependence effects.
We demonstrate that these reproductive variables are influenced by the independent nature of the female () and male () variables, as well as the density-dependent fecundity of the parasites. Interestingly, the reproductive expressions derived in our examples align with those found in previous works (May, 1977; May and Woolhouse, 1993; Bradley and May, 1978). However, these earlier studies did not consider the impact of density-dependent fertility on the reproductive behavior of parasites.
The expressions we obtained serve as a generalization of the findings in (May, 1977; May and Woolhouse, 1993; Bradley and May, 1978). It is important to note that our work focuses solely on parasites with a polygamous mating system, excluding monogamous and hermaphroditic parasites from consideration.
In conclusion, our study provides a comprehensive expression for the egg production and mating probability of parasites. We demonstrate how these expressions are influenced by the sex distribution of parasites and whether these distributions are considered joint or independent. Furthermore, we highlight the significant impact of density-dependence on parasite reproduction.
One of the main limitations of this work is that it only considers parasites with a polygamous mating system and we do not consider monogamous and hermaphroditic parasites.
In conclusion, in this work we obtained a general expression for egg production and the mating probability of the parasites. We show how these expressions depend on the sex distribution of the parasites and whether these distributions are considered joint or independent. We also show that these expressions vary due to the effects of the density-dependence of the parasites.
Aknowledgements
This work was partially supported by grant CIUNSA 2018-2467. JPA is a member of the CONICET. GML is a doctoral fellow of CONICET.
Conflict of Interest
The authors have declared no conflict of interest.
References
- Abdybekova and Torgerson (2012) Abdybekova, A. and Torgerson, P. (2012). Frequency distributions of helminths of wolves in kazakhstan. Veterinary Parasitology, 184(2):348–351.
- Adler and Kretzschmar (1992) Adler, F. and Kretzschmar, M. (1992). Aggregation and stability in parasite—host models. Parasitology, 104(2):199–205.
- Anderson and May (1985) Anderson, R. and May, R. (1985). Helminth infections of humans: mathematical models, population dynamics, and control. Advances in parasitology, 24:1–101.
- Anderson and May (1978) Anderson, R. and May, R. M. (1978). Regulation and stability of host-parasite population interactions. Journal of animal ecology, 47(1):219–247.
- Anderson et al. (2014) Anderson, R., Truscott, J., and Hollingsworth, T. D. (2014). The coverage and frequency of mass drug administration required to eliminate persistent transmission of soil-transmitted helminths. Philosophical Transactions of the Royal Society B: Biological Sciences, 369(1645):20130435.
- Anderson and May (1992) Anderson, R. M. and May, R. M. (1992). Infectious diseases of humans: dynamics and control. Oxford university press.
- Bliss and Fisher (1953) Bliss, C. I. and Fisher, R. A. (1953). Fitting the negative binomial distribution to biological data. Biometrics, 9(2):176–200.
- Bradley and May (1978) Bradley, D. J. and May, R. M. (1978). Consequences of helminth aggregation for the dynamics of schistosomiasis. Transactions of the Royal Society of Tropical Medicine and Hygiene, 72(3):262–273.
- Bundy et al. (1987) Bundy, D., Cooper, E., Thompson, D., Didier, J., and Simmons, I. (1987). Epidemiology and population dynamics of ascaris lumbricoides and trichuris trichiura infection in the same community. Transactions of the Royal Society of Tropical Medicine and Hygiene, 81(6):987–993.
- Churcher et al. (2005) Churcher, T., Ferguson, N., and Basáñez, M. (2005). Density dependence and overdispersion in the transmission of helminth parasites. Parasitology, 131(1):121–132.
- Churcher et al. (2006) Churcher, T., Filipe, J., and Basáñez, M. (2006). Density dependence and the control of helminth parasites. Journal of animal ecology, pages 1313–1320.
- Churcher and Basáñez (2008) Churcher, T. S. and Basáñez, M.-G. (2008). Density dependence and the spread of anthelmintic resistance. Evolution, 62(3):528–537.
- Cox and Lewis (1966) Cox, D. R. and Lewis, P. A. W. (1966). The statistical analysis of series of events. Springer Dordrecht.
- Cox et al. (2017) Cox, R., Groner, M., Todd, C. D., Gettinby, G., Patanasatienkul, T., and Revie, C. (2017). Mate limitation in sea lice infesting wild salmon hosts: the influence of parasite sex ratio and aggregation. Ecosphere, 8(12):e02040.
- Crofton (1971) Crofton, H. (1971). A quantitative approach to parasitism. Parasitology, 62(2):179–193.
- Denwood et al. (2008) Denwood, M., Stear, M., Matthews, L., Reid, S., Toft, N., and Innocent, G. (2008). The distribution of the pathogenic nematode nematodirus battus in lambs is zero-inflated. Parasitology, 135(10):1225–1235.
- Duerr and Dietz (2000) Duerr, H.-P. and Dietz, K. (2000). Stochastic models for aggregation processes. Mathematical biosciences, 165(2):135–145.
- Fisher et al. (1941) Fisher, P. et al. (1941). Negative binomial distribution. Annals of Eugenics, 11:182–787.
- Gourbière et al. (2015) Gourbière, S., Morand, S., and Waxman, D. (2015). Fundamental factors determining the nature of parasite aggregation in hosts. PloS one, 10(2):e0116893.
- Hall and Holland (2000) Hall, A. and Holland, C. (2000). Geographical variation in ascaris lumbricoides fecundity and its implications for helminth control. Parasitology Today, 16(12):540–544.
- Haukisalmi et al. (1996) Haukisalmi, V., Henttonen, H., and Vikman, P. (1996). Variability of sex ratio, mating probability and egg production in an intestinal nematode in its fluctuating host population. International Journal for Parasitology, 26(7):755–764.
- Hoagland and Schad (1978) Hoagland, K. and Schad, G. (1978). Necator americanus and ancylostoma duodenale: life history parameters and epidemiological implications of two sympatric hookworms of humans. Experimental Parasitology, 44(1):36–49.
- Johnson et al. (2005) Johnson, N., Kemp, A., and Kotz, S. (2005). Univariate discrete distributions. John Wiley & Sons.
- Lahmar et al. (2001) Lahmar, S., Kilani, M., and Torgerson, P. (2001). Frequency distributions of echinococcus granulosus and other helminths in stray dogs in tunisia. Annals of Tropical Medicine & Parasitology, 95(1):69–76.
- Lopez and Aparicio (2022) Lopez, G. and Aparicio, J. (2022). Modeling macroparasite infection dynamics. Journal of mathematical modeling of biological systems.
- Lopez and Aparicio (2023) Lopez, G. and Aparicio, J. (2023). Simple models for macro-parasite distributions in hosts. To appear in: Brazilian Journal of Biometrics.
- Macdonald et al. (1965) Macdonald, G. et al. (1965). The dynamics of helminth infections, with special reference to schistosomes. Transactions of the Royal Society of Tropical Medicine and Hygiene, 59(5):489–506.
- May and Woolhouse (1993) May, R. and Woolhouse, M. (1993). Biased sex ratios and parasite mating probabilities. Parasitology, 107(3):287–295.
- May (1977) May, R. M. (1977). Togetherness among schistosomes: its effects on the dynamics of the infection. Mathematical Biosciences, 35(3-4):301–343.
- Nåsell and Hirsch (1973) Nåsell, I. and Hirsch, W. M. (1973). The transmission dynamics of schistosomiasis. Communications on Pure and Applied Mathematics, 26(4):395–453.
- Poulin (2007) Poulin, R. (2007). Are there general laws in parasite ecology? Parasitology, 134(6):763–776.
- Seo et al. (1979a) Seo, B., Cho, S., and Chai, J. (1979a). Frequency distribution of ascaris lumbricoides in rural koreans with special reference on the effect of changing endemicity. The Korean Journal Parasitology, 17(2):105–113.
- Seo et al. (1979b) Seo, B. S., Cho, S., and Chai, J. (1979b). Egg discharging patterns of ascaris lumbricoides in low worm burden cases. The Korean Journal of Parasitology, 17(2):98–104.
- Shaw and Dobson (1995) Shaw, D. and Dobson, A. (1995). Patterns of macroparasite abundance and aggregation in wildlife populations: a quantitative review. Parasitology, 111(S1):S111–S133.
- Shaw et al. (1998) Shaw, D., Grenfell, B., and Dobson, A. (1998). Patterns of macroparasite aggregation in wildlife host populations. Parasitology, 117(6):597–610.
- Truscott et al. (2014) Truscott, J., Hollingsworth, T., and Anderson, R. (2014). Modeling the interruption of the transmission of soil-transmitted helminths by repeated mass chemotherapy of school-age children. PLoS neglected tropical diseases, 8(12):e3323.
- Walker et al. (2009) Walker, M., Hall, A., Anderson, R., and Basáñez, M. (2009). Density-dependent effects on the weight of female ascaris lumbricoides infections of humans and its impact on patterns of egg production. Parasites & Vectors, 2(1):11.
- Woolhouse et al. (1997) Woolhouse, M. E., Dye, C., Etard, J.-F., Smith, T., Charlwood, J., Garnett, G., Hagan, P., Hii, J. x., Ndhlovu, P., Quinnell, R., et al. (1997). Heterogeneities in the transmission of infectious agents: implications for the design of control programs. Proceedings of the National Academy of Sciences, 94(1):338–342.
- Ziadinov et al. (2010) Ziadinov, I., Deplazes, P., Mathis, A., Mutunova, B., Abdykerimov, K., Nurgaziev, R., and Torgerson, P. (2010). Frequency distribution of echinococcus multilocularis and other helminths of foxes in kyrgyzstan. Veterinary parasitology, 171(3):286–292.