Measurements of the top-quark mass with the ATLAS detector
Abstract:
The top-quark mass is one of the fundamental parameters of the Standard Model of particle physics. The latest ATLAS measurements of the top-quark mass in top quark pair final states are presented. Measurements use di-lepton, lepton+jets and all-jets final states and their combination is performed. Measurements of the top-quark pole mass based on precision theoretical QCD calculations for lepton kinematic distribution and for top quark pair production with an additional jet are also presented.
1 Introduction
The top-quark mass () is a fundamental parameter of the Standard Model (SM) and its precise value is indispensable for predictions of cross sections at the LHC. After the Higgs boson discovery at the LHC [1, 2] and in the current absence of direct evidence for new physics beyond the SM, precision theory predictions confronted with precision measurements are becoming an important area of research for self-consistency tests of the SM and in searching for new physics phenomena [3]. The measurements proceed then via kinematic reconstruction of the top quark’s decay products, a boson and a -quark jet, -jet, and comparisons to Monte Carlo (MC) simulations are done. These measurements are often referred to as MC top-quark mass () measurements. In many Quantum Chromodynamics (QCD) calculations the top-quark pole mass (), corresponding to the definition of the mass of a free particle, is used as the conventional scheme choice. Recent studies estimate the value of differs from by ) [4]. However, more recently it has been quoted that this difference could be much smaller [5]. The can be measured from inclusive production cross section (). However, this determination is currently less precise than the achieved measurements. This is due to the weak sensitivity of the inclusive to the , but also to the large uncertainties on the factorisation and renormalisation scales and the proton parton distribution function (PDF). In the following the latest ATLAS results on , or just , measurements in the di-lepton [6], the lepton+jets [7], and in the all-jets [8] decay channel using data at a centre of mass energy for an integrated luminosity of are presented, see Section 2. The value is determined from inclusive measurements in the di-lepton decay channel [9] and from normalised differential cross section measurements for events with in association with at least one jet, -jet [10], see Section 3. These analyses use data collected at and with an integrated luminosity of and respectively.
2 Measurements of the top-quark mass at
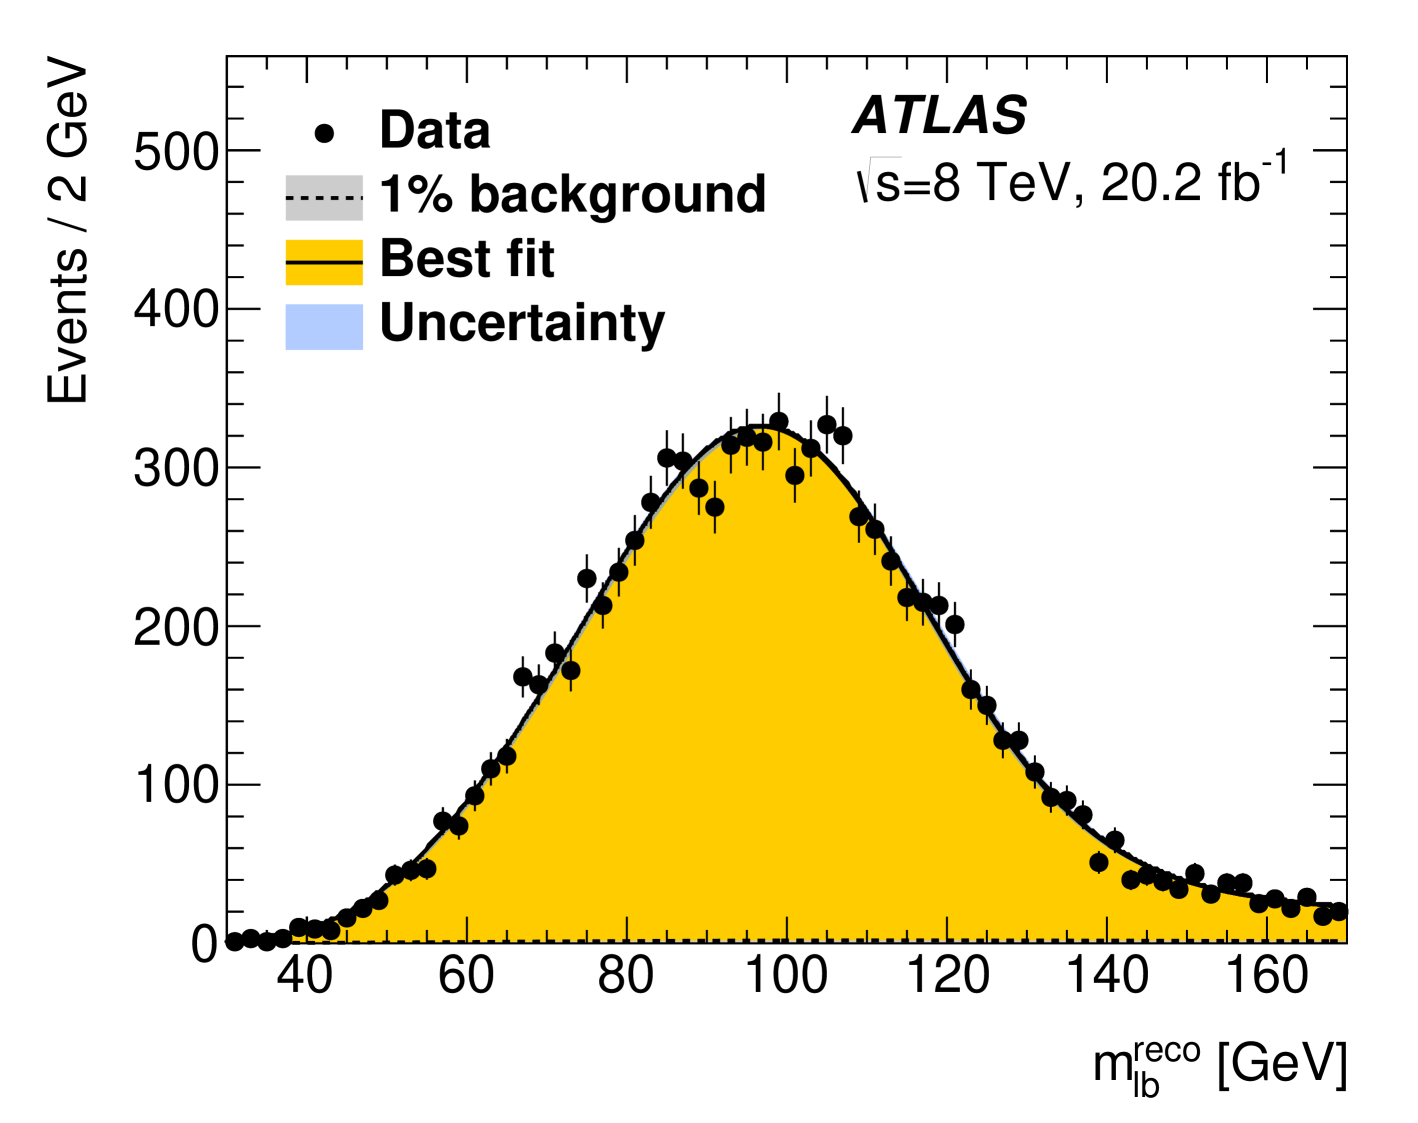
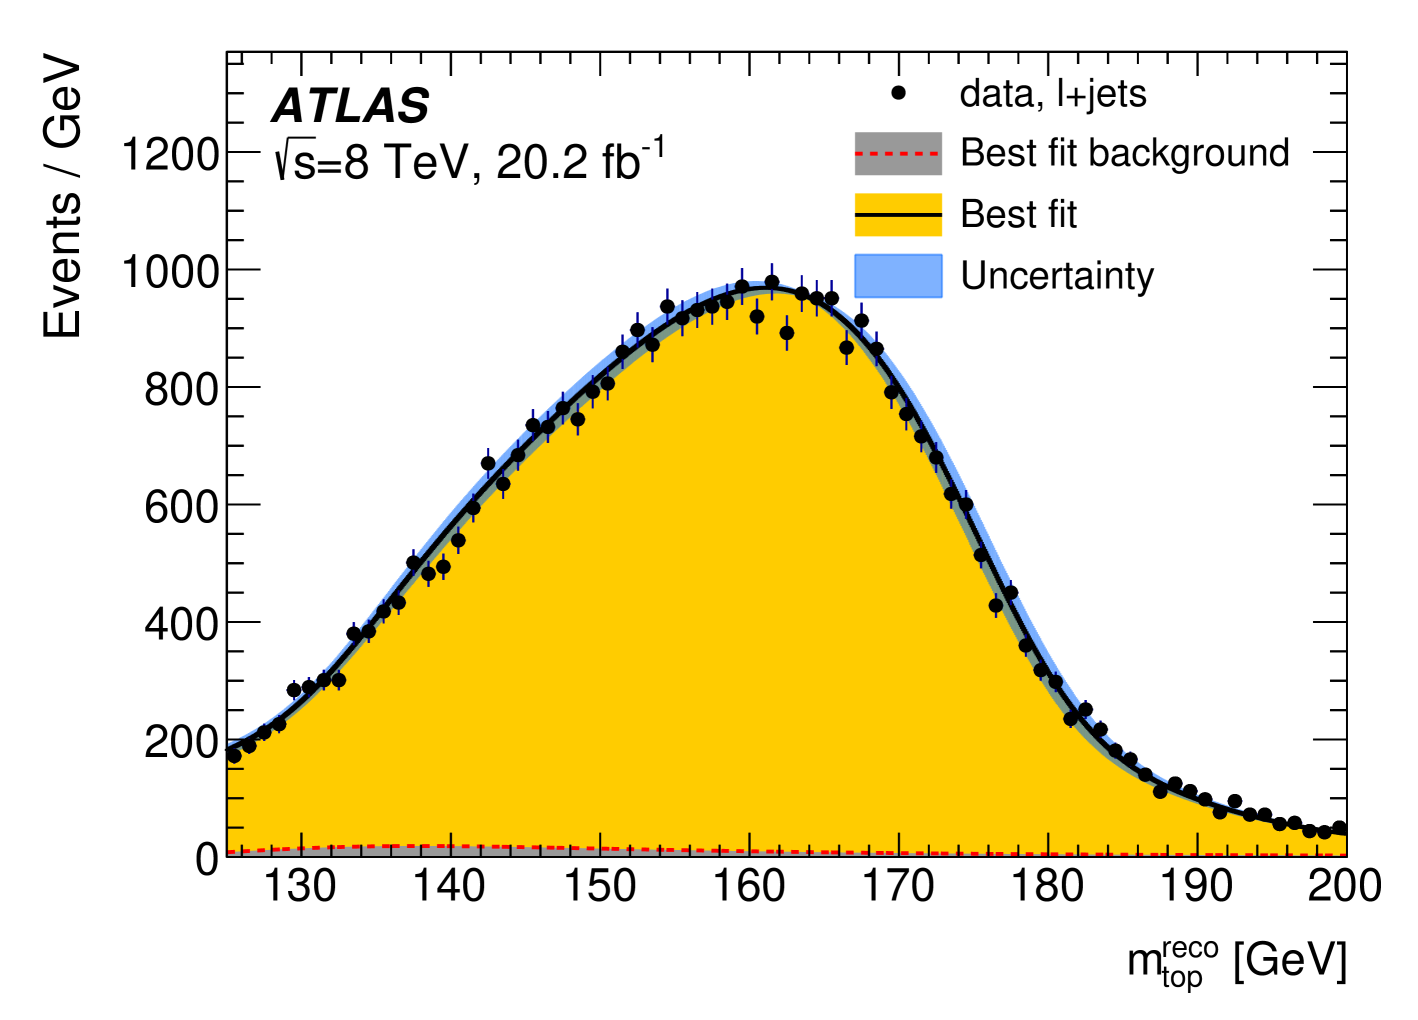
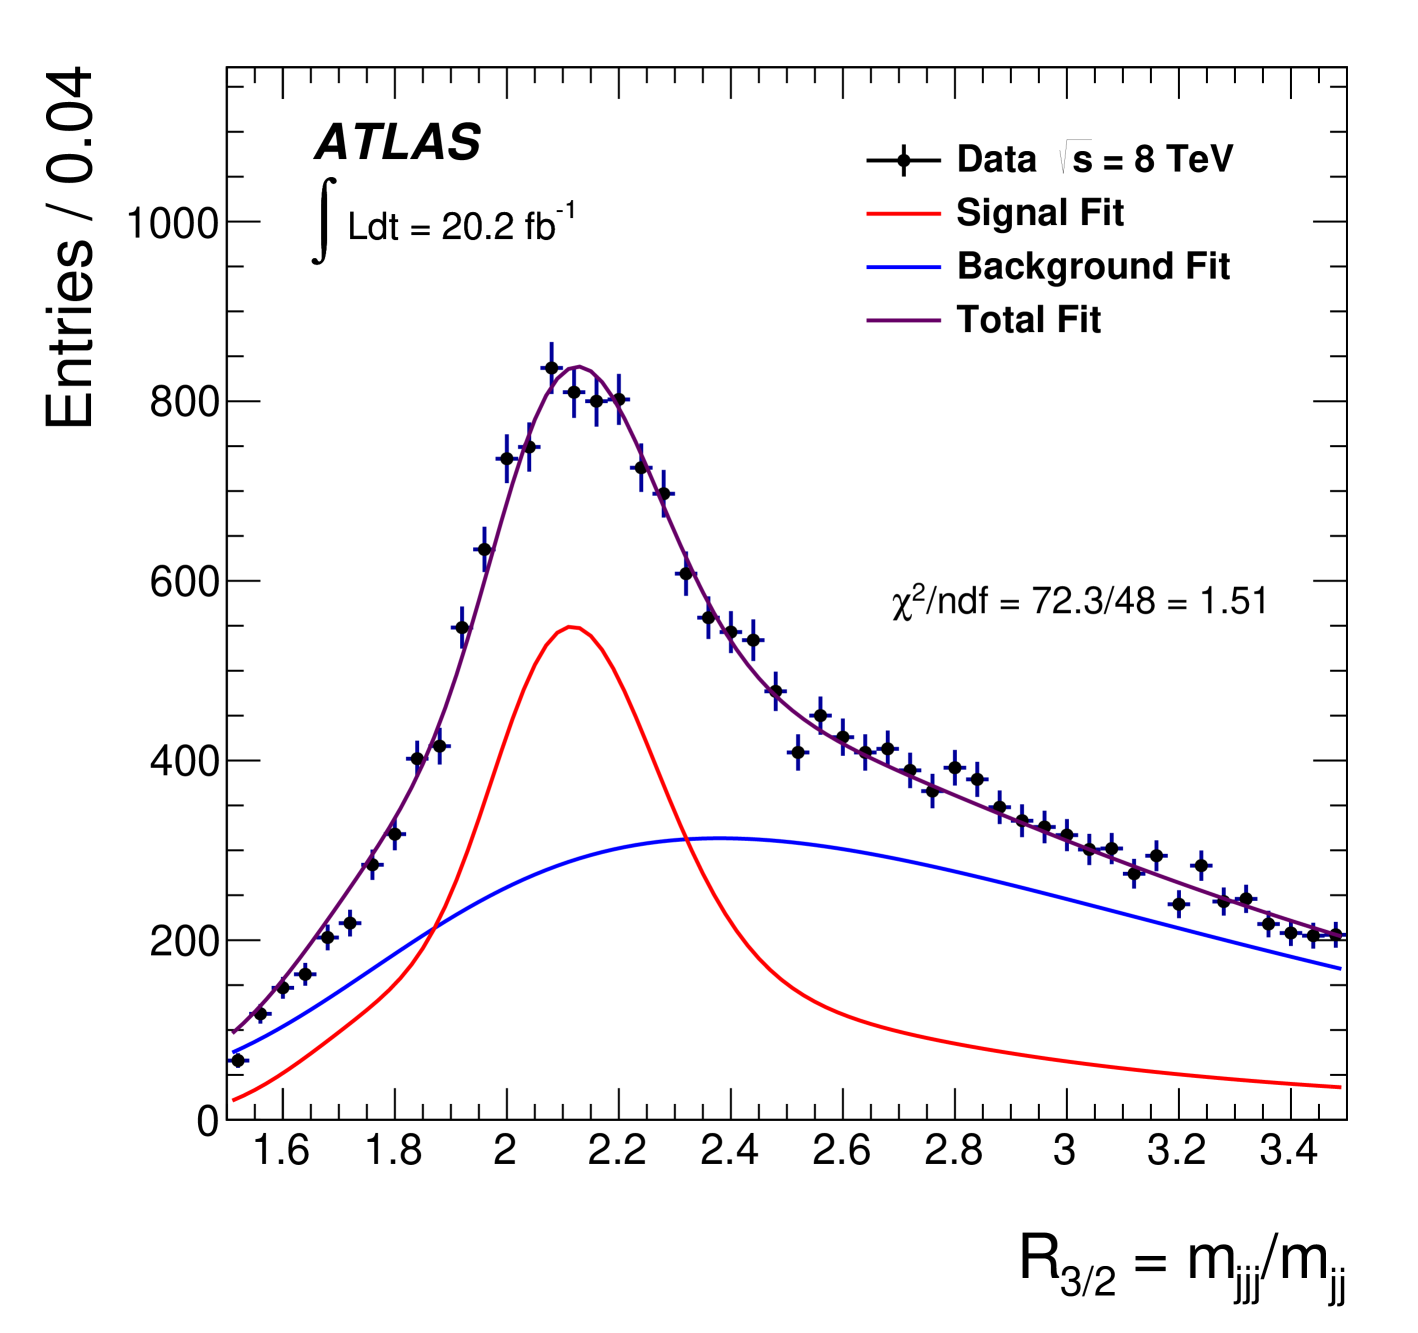
A measurement of is obtained in the di-lepton decay channel using data at [6]. The analysis exploits the decay , where both bosons decay into a charged lepton and its corresponding neutrino. The event selection described in Ref. [6] was optimised to achieve the smallest total uncertainty. In the analysis, -jets are selected, and two leptons are taken as the leptons from the decays. From the two possible assignments of the two pairs, the combination leading to the lowest average invariant mass of the two lepton--jet pairs () is retained. To perform the template parameterisation, see Ref. [6], the reconstructed quantity is used. The resulting template fit function based on simulated distributions of has as the only free parameter and an unbinned likelihood maximisation gives a value of . Figure 1, left plot, shows the distribution obtained with data together with the fitted probability density functions for the background (hardly visible at the bottom of the figure). This result is the most precise single result in this decay channel to date. The biggest systematic uncertainties comes from the measurement of the jet energies, through the jet energy scale (JES) and relative -to-light-JES (JES). The next most recent measurement of in the lepton+jets decay channel performed in ATLAS [7], looks for events with the decay . Here one boson decays into a charged lepton ( is or including , decays) and a neutrino (), and the other into a pair of quarks. A full kinematic reconstruction of the event is done with a likelihood fit algorithm. For the measurement of , the event selection is optimised [7] by using a multivariate Boosted Decision Tree, BDT, algorithm. The analysis uses then a three-dimensional template fit technique which determines together with the jet energy scale factors (JSF) and relative -to-light-JSF (JSF). Figure 1, central plot, shows the the distribution in the data with statistical uncertainties together with the corresponding fitted probability density functions for the background alone and for the sum of signal and background. The achieved measured value of obtained using the BDT selection is . Another recent measurement obtained using ATLAS data taken at [8] exploits the decay , where both bosons decay into jets from charged quarks, . This is a challenging measurement to make because of the large multi-jet background arising from various other processes of the strong interaction described by QCD. However, all-jets events profit from having no neutrinos among the decay products, so that all four-momenta can be measured directly. The multi-jet background for the all-jets channel, while large, leads to different systematic uncertainties than in the case of the di-leptonic, and lepton+jets channels. Events in this analysis are required to pass the selection described in Ref. [8]. To determine in each event, a minimum- approach is adopted. The dominant multi-jet background in the analysis is determined directly from the data. To extract the measurement of , a template method with a binned minimum- approach is employed. For each event, two values of the ratio of three-jet to dijet masses, , are obtained. The observable is chosen here because of its reduced dependence on the JES uncertainty. After applying a final fit, which uses matrix algebra to include non-diagonal co-variance matrices, the measurement gives . Figure 1, right plot, shows the distribution with the corresponding total fit as well as its decomposition into signal and the multi-jet background. The dominant sources of systematic uncertainty in this measurement come from the JES, hadronisation modelling and the JES. Finally a combination of different measurements is performed, see Ref [7]. The obtained combination value is , which is similar to other combined results [7].
3 Measurement of the the top-quark pole mass at and
In the following the determination from the absolute and normalised differential cross-sections measurement in the di-leptonic channel, is presented [9]. In this analysis one boson decays to an electron () and the other to a muon (), giving rise to the final state, with opposite charged lepton, that is particularly clean. The analysis uses ATLAS data at . Eight differential cross-section distributions are measured, see Ref. [9]. The measurements are made using events with an opposite-charge pair and one or two b-jets. The results are compared to the predictions of various NLO and LO multi-leg event generators, and to fixed-order perturbative QCD predictions. top-quark mass, and mass measurements are made by comparing the measured distributions to predictions from both NLO plus parton shower event generators and fixed-order QCD calculations. Various techniques for extracting the top quark mass from the measured distributions were explored. The most precise result was obtained from a fit of fixed-order predictions to all eight measured distributions simultaneously, extracting a value of , where the three uncertainties come from data statistics, experimental systematic effects, and uncertainties in the theoretical predictions. A previous measurement was extracted using -jet events collected with the ATLAS experiment in [10]. Events were selected by using the lepton+jets final state to identify the system and at least one additional jet. The was extracted from a measurement of the normalised differential cross section for -jet, as a function of the inverse of the invariant mass of the -jet system [10]. The achieved measurement gave , where the theoretical uncertainties include the uncertainty due to missing higher orders in the perturbative NLO calculation, as well as uncertainties due to the PDF and the strong coupling constant, , used in the calculations. The experimental uncertainty accounts for the uncertainties due to the imperfections in the modelling of the detector response, the background yield and the uncertainties arising from the signal modelling including hadronisation. The dominant experimental uncertainties are due to the JES and the initial- and final- state radiation modelling. The above results agree very well with other determinations of , and the available measurements of [7].
References
- [1] ATLAS Collaboration, Phys. Lett. B 716 1 (2012) [arXiv:1207.7214 [hep-ex]].
- [2] CMS Collaboration, Phys. Lett. B 716 30 (2012) [arXiv:1207.7235 [hep-ex]].
- [3] G. Degrassi et al., JHEP 08 098 (2012) [arXiv:1205.6497 [hep-ph]].
- [4] S. Moch et al., DESY-14-081, (2014) [arXiv:1405.4781 [hep-ph]].
- [5] P. Nason, CERN-TH-2017-266 (2017) [arXiv:1712.02796 [hep-ph]].
- [6] ATLAS Collaboration, Phys. Lett. B 761 350-371 (2016) [arXiv:1606.02179 [hep-ex]].
- [7] ATLAS Collaboration, Submitted to: Eur. Phys. J. (2018) [arXiv:1810.01772 [hep-ex]].
- [8] ATLAS Collaboration, JHEP 09 118 (2017) [arXiv:1702.07546 [hep-ex]].
- [9] ATLAS Collaboration, Eur. Phys. J. C 77 11 804 (2017) [arXiv:1709.09407 [hep-ex]].
- [10] ATLAS Collaboration, JHEP 10 121 (2015) [arXiv:1507.01769 [hep-ex]].