Mesoscale helicity distinguishes Vinen from Kolmogorov turbulence in helium II
Abstract
Experiments and numerical simulations show that quantum turbulence exists in two distinct limiting regimes: Kolmogorov turbulence (which shares with classical turbulence the important property of a cascade of kinetic energy from large eddies to small eddies) and Vinen turbulence (which is more similar to a random flow). In this work, we define a mesoscale helicity for the superfluid, which, tested in numerical experiments, distinguishes the two turbulent regimes, quantifying the amount of nonlocal vortex interactions and the orientation of the vortex lines.
I Introduction
Vorticity in superfluid liquid helium (helium II) is not a continuous and unconstrained field, as in ordinary (classical) fluids, but consists of thin vortex lines Primer whose strength (measured by the velocity circulation ) and thickness (i.e. the vortex core radius ) are held fixed by quantum mechanical constraints. In this study we focus on turbulent tangles of vortex lines generated when liquid helium is stirred Barenghi2014a ; SkrbekSreeni2012 ; Nemirovskii2013 . Similar tangles of vortex lines can also be created in trapped atomic Bose-Einstein condensates by laser stirring, by shaking the trap Henn2009 or by temperature quenches lamporesi-etal-2013 . The natural question is whether this state of disorder (hereafter referred to as quantum turbulence) is similar to turbulence in ordinary fluids (classical turbulence) or not.
The evidence so far is that quantum turbulence can assume two distinct limiting regimes Volovik2003 ; Walmsley2008 ; Nemirovskii2019 called respectively Kolmogorov turbulence and Vinen turbulence (see the Section II for a description of their physical properties). The Kolmogorov regime has been observed in helium experiments driven by counter-rotating propellers Tabeling1998 , wind tunnels Salort2010 , towed grids Smith1993 ; Zmeev2015 , vibrating grid in 3He-B Bradley2006 ; Bradley2011 , or by the injection of vortex rings Walmsley2008 , and has been reproduced in the numerical simulations of these experiments Baggaley2012structures ; Sherwin2012 . At large scales this regime resembles classical turbulence. The Vinen regime (and its crossover to the Kolmogorov regime) has been observed in experiments Walmsley2008 and in numerical simulations Baggaley2012ultra of turbulence driven by vortex ring injection; it has also been generated in numerical simulations of helium II turbulence driven by a small heat flux Sherwin2012 (also known as counterflow superfluid turbulence), in numerical simulations of turbulence in trapped atomic Bose-Einstein condensates Cidrim2017 (including the thermal quench of a Bose gas Stagg2016 ; bland-etal-2018 ), and in superfluid models of the early universe Mocz2017 . This regime seems to have no classical counterpart.
Our aim is to show that, in helium II, Kolmogorov turbulence and Vinen turbulence differ also in terms of what we call mesoscale helicity. Helicity is a property of great importance in classical fluid dynamics, but in the context of quantum fluids its role, and even its definition, are still debated. The mesoscale definition of superfluid helicity which here we propose extends the classical definition of helicity in fluid dynamics to the mesoscale description of turbulent vortex lines in helium II provided by the Vortex Filament Model (VFM); the VFM is the best model currently available for turbulent helium II at the non-zero temperatures and length scales typical of most turbulence experiments. Our results shed new light into the different nature of Kolmogorov and Vinen turbulent flows.
The plan of the paper is the following. Firstly we shall review the difference between Vinen and Kolmogorov turbulence regimes (Section II) and recall the mesoscale description of turbulence provided by the VFM (Section III). In Section IV we shall introduce the definition of mesoscale helicity for a superfluid. To better understand the physical meaning of , in Section V we shall determine for simple vortex configurations, before measuring it in two distinct turbulent flows (Section VI). Section VII will discuss how the values of distinguish Vinen from Kolmogorov regimes. Section VIII will draw the conclusions.
II Vinen vs Kolmogorov
Kolmogorov turbulence Frisch1995 is characterised by the same energy spectrum observed in classical turbulence in its simplest (homogeneous, isotropic, statistically-steady) form. The energy spectrum describes the distribution of turbulent kinetic energy over the length scales (where is the wavenumber). The scaling is interpreted as the manifestation of an energy cascade from large to small eddies taking place over the inertial range where is the (large) length scale of the energy injection and is the (small) length scale of the viscous dissipation. In quantum turbulence, must be replaced by where is the average distance between the vortex lines Barenghi2014b ; at length scales shorter than (), individual vortex line dynamics (such as Kelvin waves and phonon emission) becomes significant and leads to a departure from classical hydrodynamic turbulence. Numerical simulations Nore1997 ; Araki2002 reveal that the scaling observed for in superfluids arises from the partial polarisation of the vortex tangle: vortex lines align locally, forming energy-containing bundles BaggaleyLaurie2012 ; Baggaley2012bundles which can induce flow at large scales. Further evidence of classical behaviour arises from the temporal decay of the kinetic energy and the vortex line density which are observed when the forcing which sustains the turbulence in a steady-state is removed stalp-skrbek-donnelly-1999 ; varga-babuin-skrbek-2015 ; gao-etal-2016 : and , where is defined as the vortex length per unit volume at time .
The second limiting form of turbulence, Vinen turbulence, has different signatures. Its energy spectrum lacks the scaling and may peak at the intermediate scales around rather than at the large scales ; at larger wavenumbers it displays the characteristic behaviour of an isolated vortex. The last feature suggests that Vinen turbulence is a random-like flow with a weak or absent energy cascade Barenghi2016 (indeed the velocity correlation functions become negligible for distances larger than Stagg2016 ; Cidrim2017 ). If the forcing is removed, Vinen turbulence decays more slowly than Kolmogorov turbulence: and . For the sake of completeness, it is important to note that in Vinen turbulence observed in counterflow channels, one-point turbulent velocity statistics (PDFs) are Gaussian (as in classical turbulence) or exhibit quantum peculiar power laws, depending on whether the measurement region, , is or , respectively LaMantiaSkrbek2014stats ; Baggaley2011stats ; galantucci-sciacca-2014 .
III Vortex Filament Model
Since our concern is experiments in helium II at non-zero temperatures, we use the Vortex Filament Model (VFM) Schwarz1988 ; HanninenBaggaley2014 . The VFM is based on the separation of length scales typical of experiments, where is the vortex core radius, to is the average distance between vortex lines, and to is the system size. In the range of length scales relevant to turbulence, the VFM describes vortex lines as three dimensional, oriented, reconnecting space curves, , where is arclength, carrying one quantum of circulation. The curves have infinitesimal thickness, unlike quantum vortices described by more microscopic approaches such as the Gross Pitaevskii equation (GPE) Primer or N-body quantum mechanics GalliReattoRossi2014 ; in other words, the VFM is a mesoscopic model which neglects density variations at the scale of the vortex core. At each time , the VFM describes the vortex tangle as a collection of oriented curves of length (), where , and the total vortex length vary with . The velocity field which all vortex lines induce at a point (i.e. a point which is not on a vortex line) is given by the Biot-Savart law Saffman1993 :
| (1) |
where the line integral extends over the entire vortex configuration and is the unit tangent vector at the point . At non-zero temperature, the motion of vortex lines is determined by Schwarz’s equation Schwarz1988 :
| (2) |
where , is the velocity of the normal fluid at , and and are temperature-dependent friction coefficients BarenghiDonnelly1998 accounting for the interaction between normal fluid and vortex lines. Without a core structure, the Biot-Savart integral, Eq. (1), would diverge if evaluated at a point on a vortex line, and must be desingularized in a standard way Schwarz1988 which takes into account the vortex core’s finite size, , and the minimum Lagrangian discretization along the vortex lines, . The total superfluid velocity of the vortex line at the point can thus be decomposed into near, far and external contributions, i.e. . The far contribution is
| (3) |
where now the integral extends to all vortex lines present in the tangle (the line through the point as well as all other vortex lines) but excludes the neighborhood of the point (this is the meaning of the symbol ). The near contribution, accounting for this neighborhood, is
| (4) |
Note that is directed in the binormal direction and (neglecting the dependence on the slow varying logarithmic term) is inversely proportional to the local radius of curvature at the point , where . Finally the external contribution, , describes any irrotational flow which is externally applied, for example by bellows or a heater.
IV Mesoscale Helicity
The classical definition of helicity is Moffatt1969
| (5) |
where is the velocity field, is the vorticity field, is the position and is the volume containing the fluid. An ideal fluid evolving without viscosity according to the classical Euler equation conserves both energy and helicity; helicity conservation freezes the flow’s topology in time. In real fluids, viscous dissipation destroys both energy and helicity. Helicity is important in turbulence: a large value of weakens the nonlinearity of the governing Navier-Stokes equation, reducing the direct cascade of energy from large to small length scales Kraichnan1973 . Spontaneous reflectional symmetry breaking, implying nonzero net helicity, has been reported in turbulent flows with initial and boundary conditions which are symmetric Levich ; Kholmyansky . Recent work Biferale2012 has also shown that the interaction of helical modes of the same sign favours three-dimensional inverse energy transfer and the generation of large length scales. In astrophysics, helicity quantifies the lack of mirror symmetry of the flow which favours the generation of magnetic field by dynamo action BrandenburgSubramanian2005 . It is now possible to directly measure the helicity of thin-cored vortices Scheeler2017 , boosting the interest in the role kinetic helicity plays in constraining the hydrodynamics.
The superfluid component of helium II has zero viscosity and can thus be considered as the closest physical realisation of the mathematical concept of the classical ideal fluid obeying the Euler equation. On the other hand, quantized vortex-lines can reconnect modifying the flow topology which, hence, is not frozen, in contrast to ideal classical fluids. Questions naturally arise: is there an analogue of classical helicity in superfluid helium and other quantum fluids? What is its physical meaning? And, is it conserved?
These issues are currently debated in the context of the Gross-Pitaevskii equation (GPE). In GPE theory Primer , the vortex centerline (the vortex axis) is a nodal line of the wavefunction surrounded by a thin tubular core region of depleted density. Since the GPE vorticity, , is a Dirac delta function on the centerline (where the velocity diverges), a definition of superfluid helicity based on Eq. (5) requires a careful limiting procedure for , where is the radial distance to the centerline diLeoni2017 , and raises the question as to whether , thus defined, is conserved or not. An alternative approach is to define the superfluid helicity using the classical decomposition MoffattRicca1992 of for thin vortex tubes into writhe, link and twist, in which case superfluid helicity is zero at all times Hanninen2016 ; ZuccherRicca2018 ; Salman2018 . The second approach has a subtle aspect: the twist has an intrinsic component which relies upon the construction of a second vortex line along the vortex centerline in order to define a ribbon; this creates a difficulty in the context of GPE theory where there is only one vortex line in the core, the centerline delta function.
At the mesoscale level of description of superfluid turbulence provided by the VFM, the definition of superfluid helicity should not depend on the detailed nature of the vortex core, provided the definition has not physical or mathematical inconsistencies. Although the GPE is a good quantitative model of gaseous Bose-Einstein condensates, it is only a qualitative model of helium II, which is a liquid, not a weakly interacting Bose gas. A many-body quantum mechanical description of the helium vortex core accounts for rotons Amelio2018 and a more structured vortex core GalliReattoRossi2014 than predicted by the GPE, revealing that the the azimuthal velocity has the form of a Rankine vortex with crossover from behaviour to behaviour at , unlike the vortex solution of the GPE which is for all . The vorticity is therefore zero but in narrow tubes of approximately constant cross section with magnitude and direction tangential to the centerline. This result justifies the application of the classical definition of helicity, Eq. (5), to helium II. At the mesoscale level we find (see Appendix 1):
| (6) |
where is the non-local velocity Sherwin2012 induced at a point along a line by distant vortex line elements or by external means.
In order to compare different vortex configurations, the mesoscale helicity must be normalized by the vortex length , because, if the helicity density is constant along the vortex lines, would simply be proportional to . If we divide by , we find that the tangle-averaged non-local velocity contribution in the direction of the vorticity is the ratio of mesoscale helicity to the quantum of circulation times the total vortex length, i.e.:
| (7) |
Eq. (7) provides a physical interpretation of mesoscale helicity. We expect therefore that, if the vortex lines are randomly oriented in space (Vinen turbulence), then will be approximately zero because the non-local velocity contributions at a point on a vortex line will tend to cancel out each others. Vice versa, if the vortex tangle is partially polarised via bundles of quasi-parallel vortex lines within a random tangle (Kolmogorov turbulence), will be nonzero. Notice that the existence of large scale flows is not a sufficient condition for large helical flows: for example, two straight parallel vortex lines create a large scale superflow but the total mesoscale helicity is zero.
To test the interpretation of mesoscale helicity outlined in the previous section, we perform numerical simulations using the VFM. In Section V we examine the mesoscale helicity of simple vortex configurations. In Section VI we determine for two distinct turbulent vortex configurations.
V Simple Vortex Configurations.
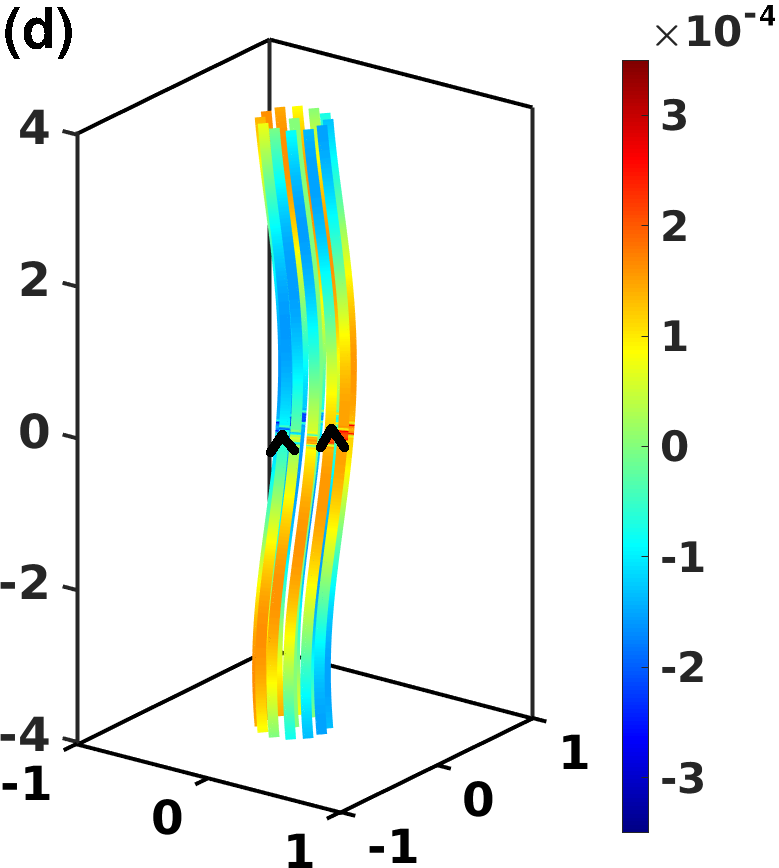
In order to further understand the physical meaning of the mesoscale helicity defined in Eq. (6), we numerically compute it for the following simple vortex configurations: (a) a vortex line perturbed by a Kelvin wave; (b) a vortex line perturbed by a Kelvin wave together with a second straight vortex line placed alongside the first line and oriented in the anti-parallel direction; (c) a vortex line perturbed by a Kelvin wave together with a second straight vortex line placed alongside the first line and oriented in the parallel direction; (d) a bundle of 13 parallel vortex lines all perturbed by Kelvin waves. The four vortex configurations are displayed in Fig. 1, where vortices are coloured according to the value of the local mesoscale helicity density .
In all configurations (a) - (d), the Kelvin wave amplitude is , its wavelength is , the size of the cubic computational box is , the spatial discretization along the vortex lines is and periodic boundary conditions are employed. In cases (b) and (c) the distance between the perturbed vortex line and the straight vortex line is , while in case (d) 12 vortex lines are arranged circularly around a central vortex line at distance . As a consequence, given that and boundary effects can be neglected.
To interpret the resulting values of , listed in the caption of Fig. 1, it is useful to decompose into self-induced and interaction contributions: . The first contribution, , is the sum of the helicity of each vortex line arising from the non-local velocity generated on the line by the line itself (implying that for a single straight vortex line); the second contribution, , is the helicity of the vortex lines due to the non-local velocity field generated by the other vortices. The mesoscale helicities of configurations (a), (b) and (c) can therefore be written as , and .
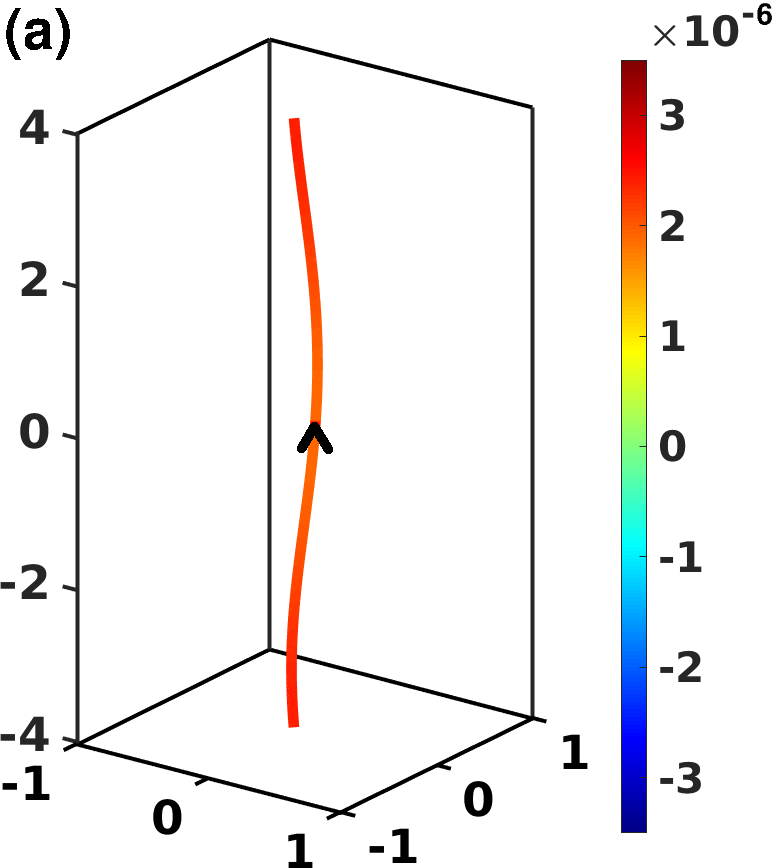
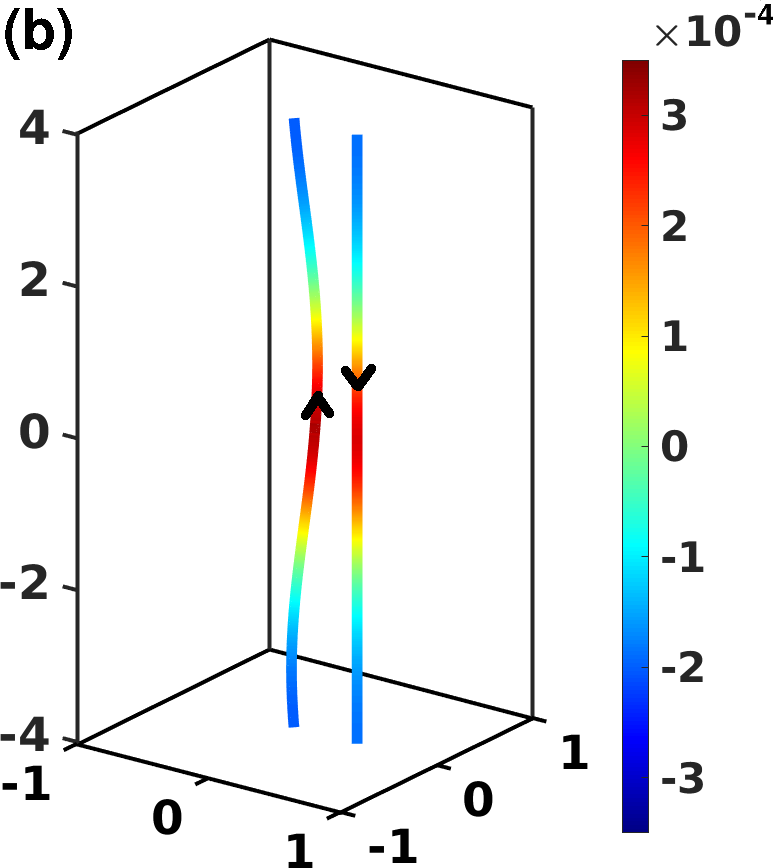
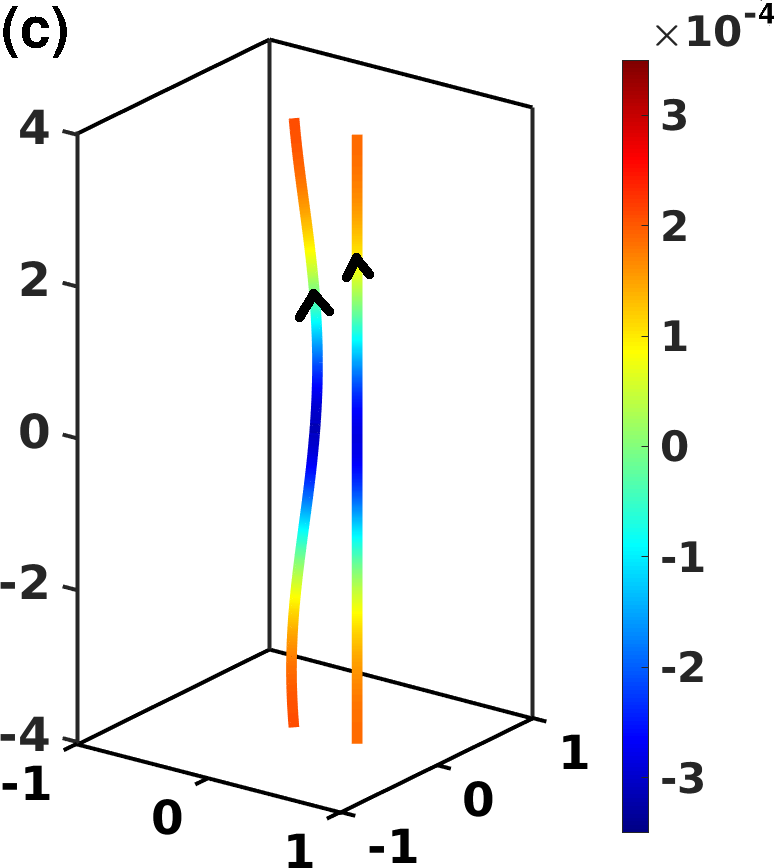
We note that a Kelvin wave, arising from an instability of a straight vortex line, has a natural orientation and rotates about the initial unperturbed vortex in direction opposite to the superfluid velocity. We find that when we add an anti-parallel straight vortex line to the perturbed vortex the total mesoscale helicity increases, while when we add a parallel straight vortex line, the total mesoscale helicity decreases.
The reason of this behaviour is two-fold. Firstly, because the local helicity density changes sign as the orientation of the straight line is reversed. Secondly, , because in case (b) the line elements of the Kelvin wave which are closer to the straight vortex mutually induce onto each other a positive interaction helicity density whose value is larger than the absolute value of the negative helicity density resulting from the interaction of more distant line elements: the overall sum is thus positive. More precisely, we find in case (b) and in case (c), leading to the corresponding total values reported in Fig. 1. If we repeat the computation of for two parallel vortex lines both perturbed by the same Kelvin wave as in (a) and separated by the same distance as in (b) and (c), we obtain that . As term of reference, if in case (a) we employ Eq. (7) to estimate the magnitude of the tangle-averaged non local velocity contribution in the direction of the vorticity , we obtain , which, in this configuration, is significantly smaller than the self-induced velocity along the Kelvin wave , computed using Eq. (4) and employing the radius of curvature of the Kelvin wave.
The negative values of in the circumstance of quasi-parallel vortex lines is the reason why the overall mesoscale helicity is negative if the vortex configuration consists of a bundle of Kelvin waves as in Fig. 1 (d). In this configuration, the -th vortex line has a self-induced helicity , hence . However, is a large negative number because it is the sum of interaction terms which are individually negative (here ). Overall, the total mesoscale helicity is negative.
We conclude that in superfluid turbulence, bundles of quasi-parallel curved vortex lines (which are responsible for the existence of large scale flows and quasi-classical Kolmogorov energy spectra Baggaley2012bundles ) possess negative helicity.
VI Turbulent Vortex Configurations
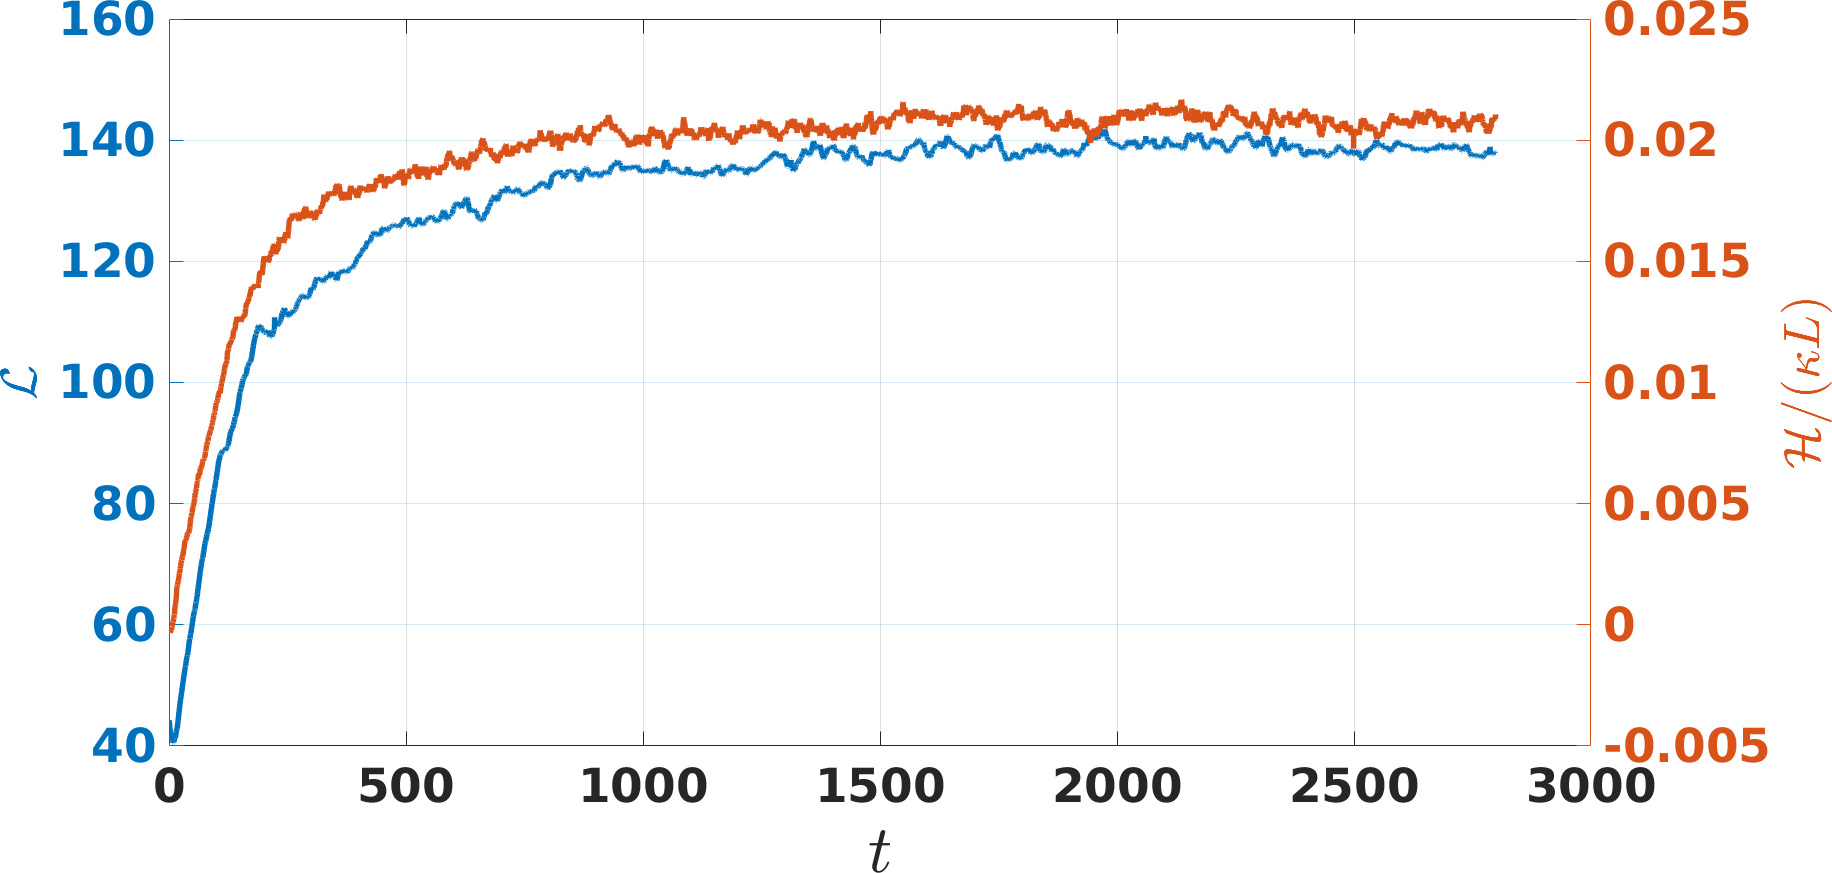
In the following subsections we determine the mesoscale helicity of two distinct turbulent configurations which we refer to as thermally-driven turbulence and injection-driven turbulence. In all numerical simulations of this section, the computational domain is a cube of size with periodic boundary conditions. The Lagrangian spatial discretization along the vortex lines is typically to , time step is to , and the time evolution is computed using a third order Runge-Kutta scheme. Vortex reconnections koplik-levine-1993 ; serafini-etal-2017 ; Galantucci2019 are implemented algorithmically as described elsewhere Schwarz1988 ; Baggaley2012recon and the Biot-Savart integral Eq. (1) is computed via a tree approximation baggaley-barenghi-2011 in order to decrease the computational cost of the calculations. All simulations start with a few seeding vortex lines which quickly multiply, until, after an initial transient, a statistical steady-state of turbulence is achieved in which the vortex line density (or, equivalently, the vortex length ) fluctuates around a mean value independent of the initial condition, as shown by the blue curves in Figures 3 and 5, for the two experiments. In this steady-state, a balance is reached between forcing and dissipation. Forcing occurs via the Donnelly-Glaberson instability Tsubota2003 in thermally-driven turbulence where , and via vortex ring injection in injection-driven turbulence; dissipation takes place via the friction in thermally-driven turbulence and via the finite discretization on the vortex lines which models the damping of the shortest Kelvin waves by phonon emission in injection-driven turbulence where .
VI.1 Thermally-driven turbulence
In this numerical simulation, we assume a uniform thermal counterflow velocity in Eq. (2), and simulate Vinen turbulence driven thermally by a small heat flux in a large channel Sherwin2012 at nonzero temperature. We choose temperature (corresponding to and ) and .
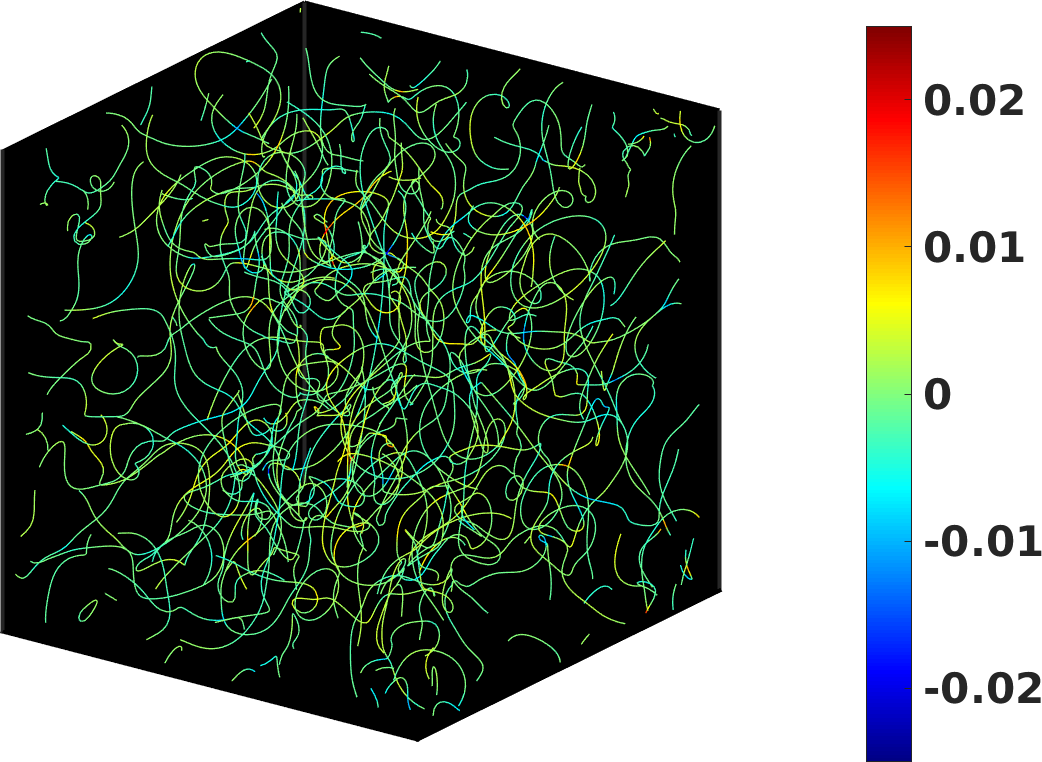
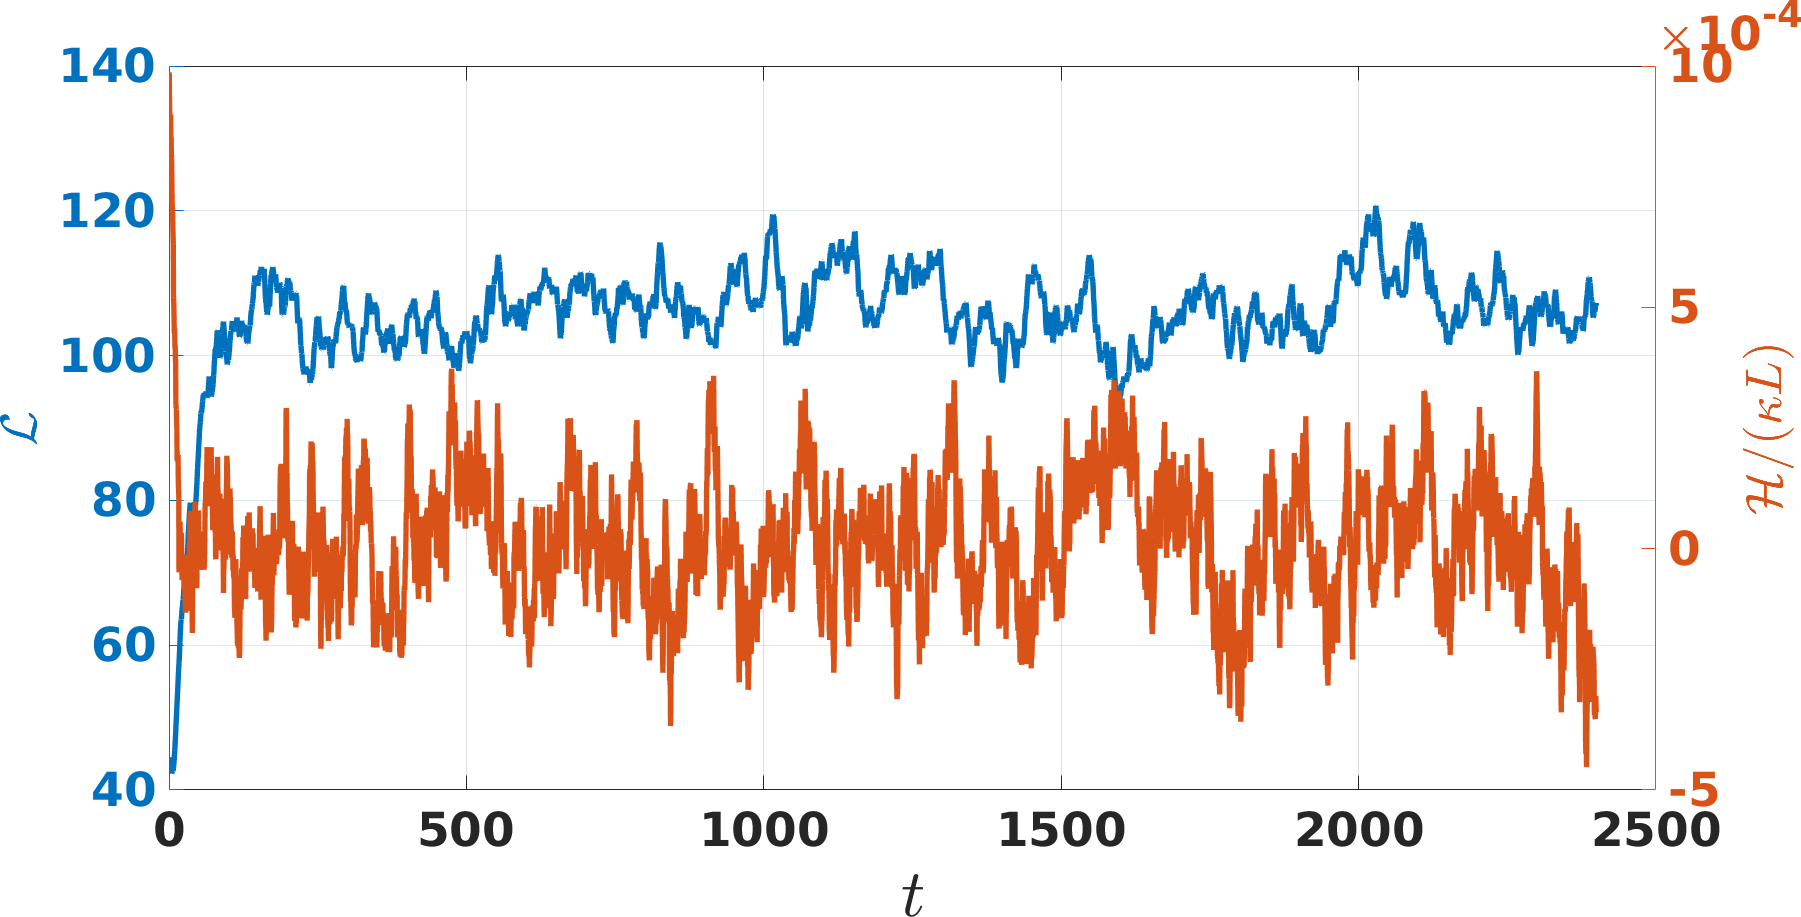
In Fig. 2 we report a snapshot of the vortex tangle after the initial transient, where vortex lines are colour-coded according to the local value of the mesoscale helicity density . It emerges that in the Vinen regime the mesoscale helicity density is essentially zero everywhere. This reflects in the temporal evolution of the integrated mesoscale helicity divided by (reported in Fig. 3), where performs small oscillations around zero when the statistically steady-state is achieved.
VI.2 Injection-driven turbulence
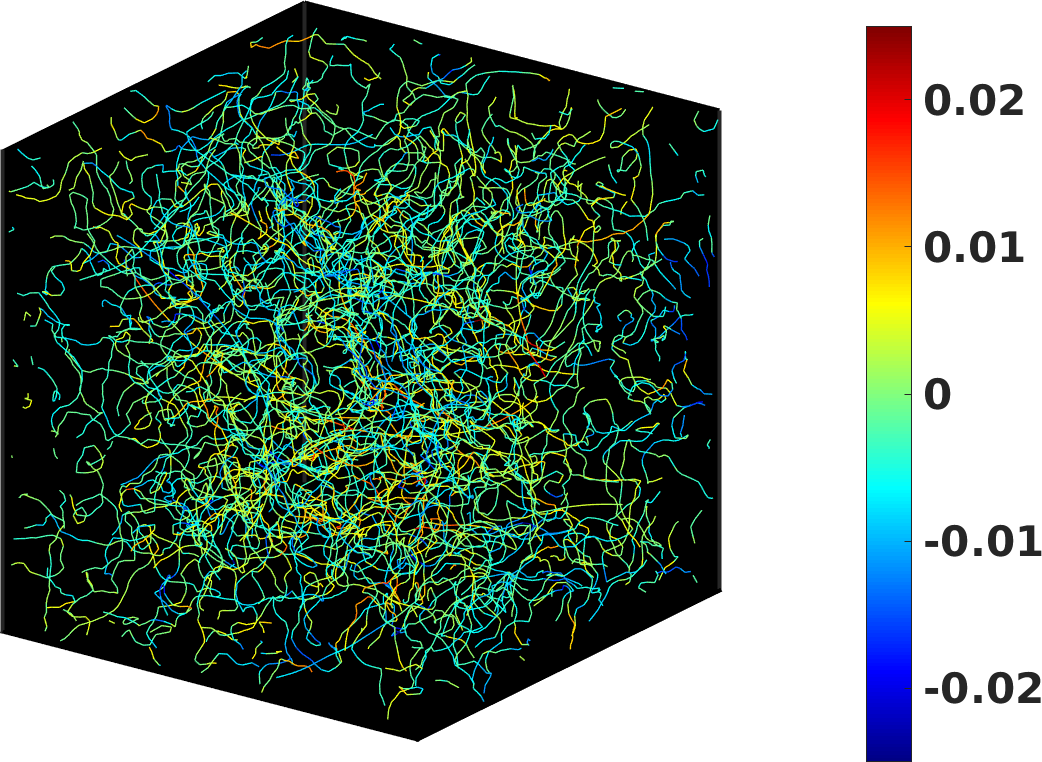
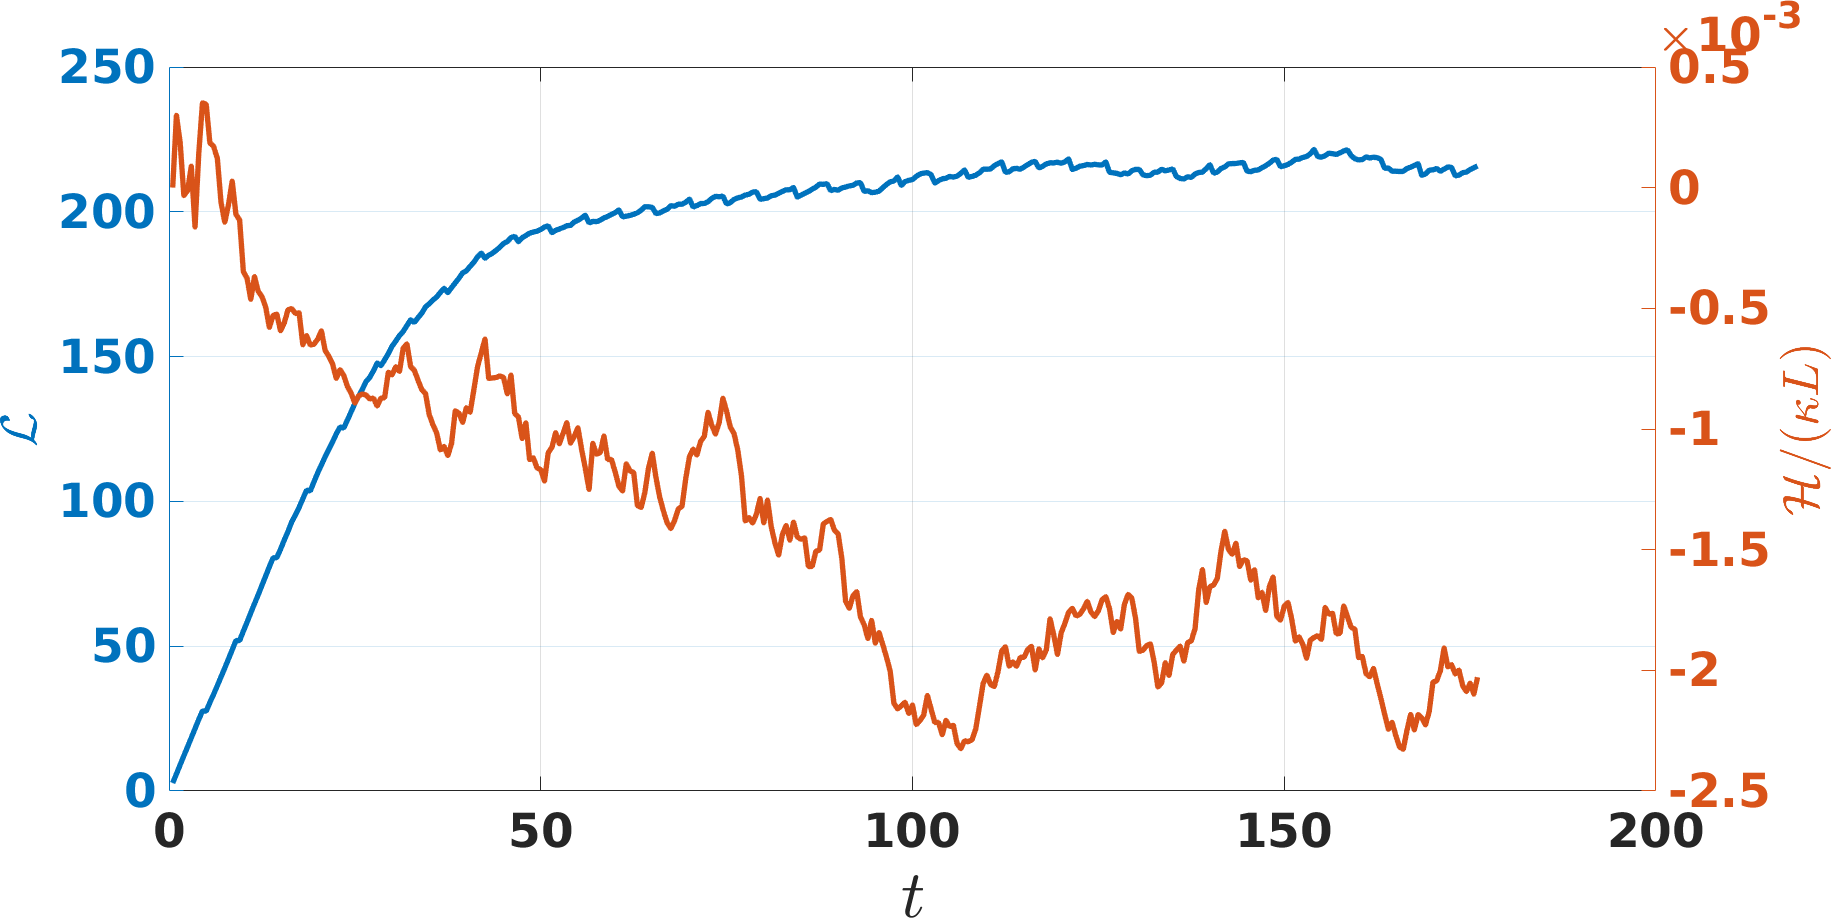
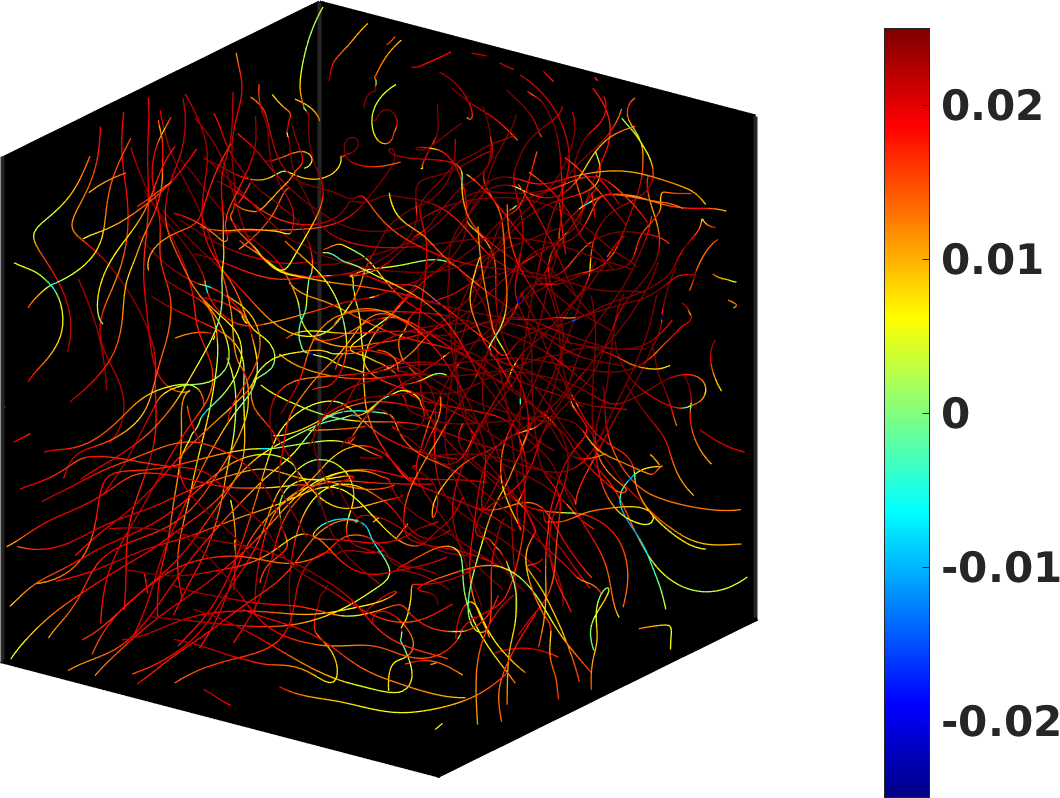
In this numerical experiment we generate turbulence at (no normal fluid) by injecting vortex rings of radius at random positions and with random orientation at the constant rate (a similar set-up was used in the laboratory by Walmsley and Golov Walmsley2008 ). The snapshot of the vortex tangle in the statistically steady-state colored according to the local mesoscale helicity density (Fig. 4) shows that locally achieves significantly larger values if compared to Vinen turbulence (Fig. 2). Furthermore, regions with negative seem to prevail over regions with positive . This visual suggestion is confirmed by the temporal evolution of reported in Fig. 5 which shows that, after a transient, is negative and its magnitude is larger than the one reported for Vinen turbulence (shown in Fig. 3).
VII Discussion
We interpret the observed behaviours of the magnitude of in thermally-driven and injection-driven turbulence as follows. In thermally-driven (Vinen) superfluid turbulence the vortex tangle configuration is a random arrangement of vortex loops and lacks large-scale flows. This is confirmed by the kinetic energy spectrum which we report in Fig. 6, which shows the characteristic behaviour of an isolated vortex at , where and is the average inter-vortex spacing. The absence of large scale flows apparent in figure ( decreases for ) implies that the non-local velocity contributions in Eq. (6) are small (as contributions from distinct vortices tend to cancel out given the random configuration), leading to an overall smaller value of observed in Fig. 3 with respect to the value of calculated for injection-driven turbulence (Fig. 5).
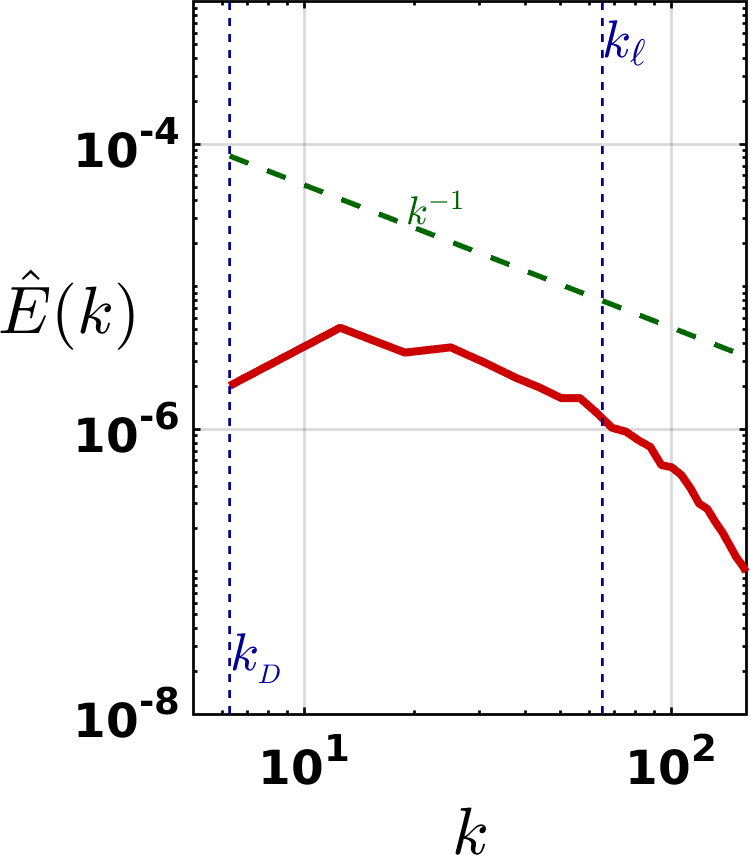
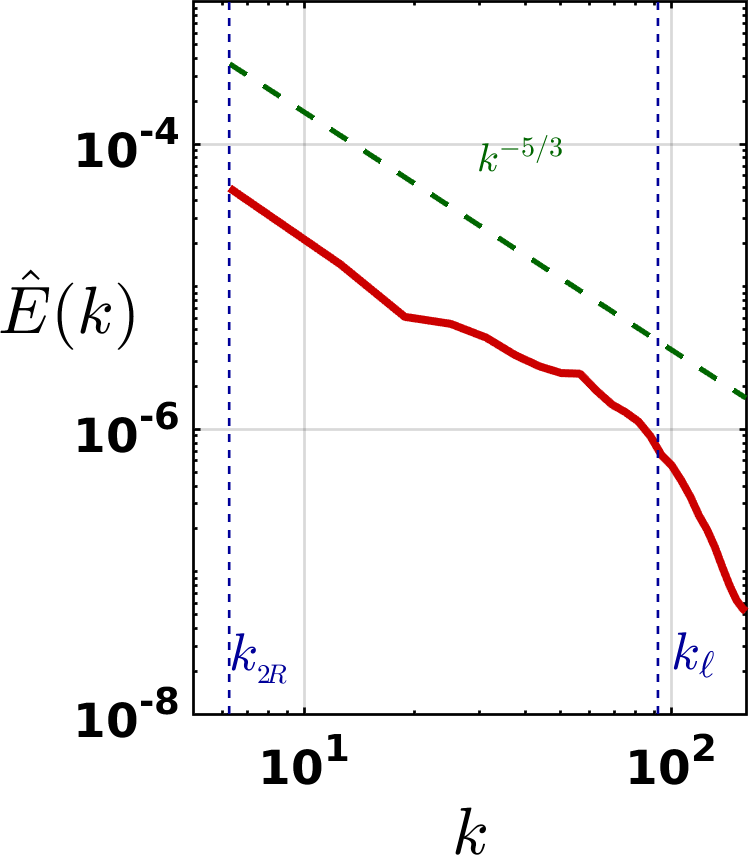
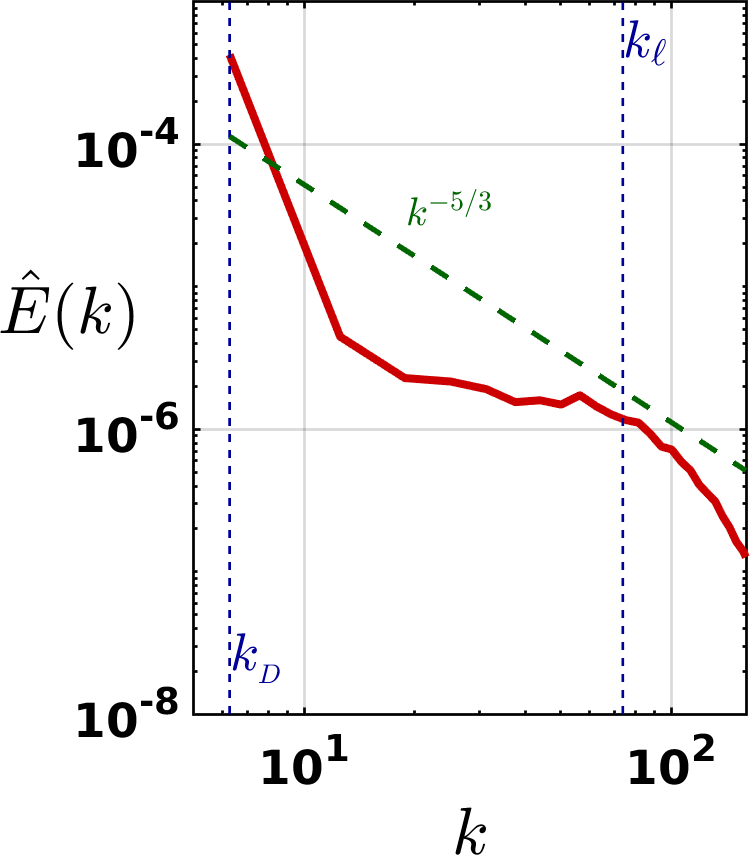
If the superfluid turbulence is driven by vortex ring injection instead, the energy spectra reveal a quasi-classical Kolmogorov behaviour, with for , as shown if Fig. 7. This property implies that most of the energy is contained in large-scale eddies ( increases for ). Thus, is significantly larger than in counterflow turbulence, accounting, see Eq. (7), for the observed larger magnitude of when compared to thermally-driven turbulence. Furthermore, on the basis of the results presented in Section V, we ascribe the negative value of in injection-driven turbulence to the presence in the flow of vortex-line bundles which are responsible for the observed Kolmogorov spectrum BaggaleyLaurie2012 ; Baggaley2012bundles . For the sake of completeness, in Appendix 3 we report the temporal evolution of mesoscale helicity in a numerical simulation of mechanically-driven superfluid turbulenceBauer1997 ; Sherwin2012 .
The interpretation of the mesoscale helicity as a measure of the non-local contribution to the motion of the vortex lines, Eq. (7), is confirmed by expressing in units of the characteristic self-induced velocity of the vortex lines in the tangle, which can be estimated from Eq. (4) using . For the thermally-driven turbulence shown in Fig. 2, we obtain , as fluctuates around zero; the largest fluctuations suggest that is at most . This is consistent with the early finding of SchwarzSchwarz1988 that the self-induced velocity alone is enough to generate the observed intensity of thermally-induced turbulence. For the injection-driven turbulence shown in Fig. (4), we obtain , a significant contribution to the total velocity, as expected. The model of mechanically-driven turbulence described in Appendix 3 (Fig. 10) yields , again as expected as this flow has the Beltrami property of maximal helicity (cf. Appendix 3 for further details).
A final consideration concerns vortex reconnections. The turbulence simulations involve thousands of reconnections. In the VFM, the standard reconnection procedure Baggaley2012recon reduces the vortex length (as proxy of energy) to model acoustic losses revealed by more microscopic GPE simulations Leadbeater2001 ; Zuccher2012 . We have therefore carefully monitored before, during and after an individual vortex reconnection at zero temperature (no friction). We have found (details are in Appendix 2) that is initially conserved, consistently with theoretical Laing2015 , experimental scheeler-etal-2014 and numerical Zuccher2017 studies showing that reconnections do not immediately affect the centerline helicity (helicity of vortex tubes without twist contribution). However, as the reconnection cusp relaxes and Kelvin wavepackets are released (a feature also observed in experiments Fonda2014 ), the relative proportions of near and far field velocity contributions change, resulting in an overall jump . In a turbulent flow, these jumps (being either positive or negative) cancel out in the statistical steady state. It is therefore unlikely that the difference in between Kolmogorov and Vinen regimes is caused by the reconnection algorithm, more so since the reconnection rate is larger for Vinen than Kolmogorov turbulence Sherwin2012 (polarised vortex lines suffer less reconnections).
VIII Conclusions
We have shown that the classical definition of helicity can be naturally generalised to the superfluid mesoscale context of the VFM without inconsistency with the microscopic nature of the helium vortex core. We have also shown that our mesoscale definition of helicity , Eq. (6), has the remarkable property of quantifying the far-field velocity contributions, , which are induced at a point along a vortex line by other vortex lines (or by elements on the same vortex line which are sufficiently far away), see Eq. (7); effectively measures the non-local contribution to the vortex motion, which in a random vortex tangle is dominated by the locally-induced velocity, .
Our numerical experiments show that in Vinen-type turbulence these non-local contributions tend to cancel out (corresponding to vanishing and ), whereas in quasi-classical, Kolmogorov-type turbulence they add up (corresponding to nonzero values of and ), as the tangle becomes polarised and vortex bundles generate large scale flows. Moreover, our numerical simulations with simple vortex structures explain why in Kolmogorov quasi-classical superfluid turbulence, mesoscopic helicity is negative, as a result of the presence of such vortex bundles, although larger-scale simulations are needed to rule out the role of any inhomogeneity and anisotropy of the vortex tangle and check how helicity scales with the tangle’s size. This helical property of quasi-classical superfluid turbulence is a direct consequence of the concentration of superfluid vorticity in one-dimensional vortex lines: quasi-classical turbulence in superfluids is in fact directly linked to the existence of quasi-parallel vortex bundles which carry negative helicity.
It is also worth emphasising that the presence of non-zero superfluid helicity in turbulence generated by vortex ring injection at demonstrates that helicity is not simply injected in the superfluid flow by the normal fluid.
At the moment the superfluid helicity which we have defined can only be determined in numerical simulations, where, as we have seen, it is a useful monitor of vortex interactions. It is natural to ask what is the outlook for experimental measurements of helicity. Recent experiments on helicity in classical fluid dynamics Scheeler2017 show that very slender vortex tubes are required for the experimental visualisation and the interpretation of helicity. Since there is no physical system where vorticity is more concentrated in thin tubes than superfluid helium, the motivation to measure helicity in superfluid helium is clear. A direct laboratory measurement of helicity at cryogenics temperature is not as far-fetched as it may seem. For example, Kelvin waves following superfluid vortex reconnections have been observed in the laboratory Fonda2014 . In order to reconstruct the evolution of the mesoscale helicity, what is further needed is a 3D image of the vortex shape, which is potentially feasible in liquid helium as it is done at room temperature.
Acknowledgements.
Acknowledgments
We acknowledge the support of EPSRC grant EP/R005192/1.
Appendix 1: Derivation of Eq. (6)
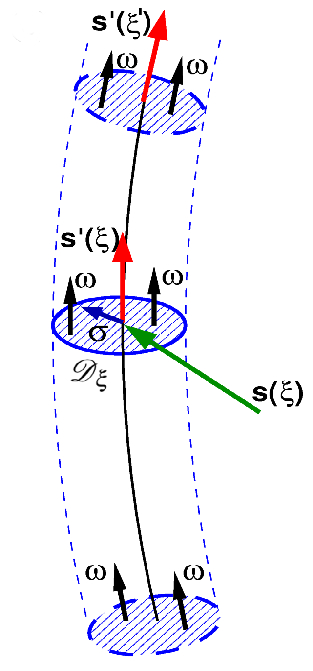
The Rankine-like velocity field observed in the many-body calculations of the helium vortex GalliReattoRossi2014 ; Amelio2018 implies that the vorticity is zero everywhere but in a narrow tube of approximately constant cross sectional area along the vortex line (see Figure 8) where its magnitude is and its direction is tangential to the centerline. At time , the vortex configuration consists of a collection of vortices of length (), and Eq. (1) becomes
where
Because of the large separation of length scales between , and , both the external superflow and the superfluid velocity field induced by all the other vortices are constant on the disc and can be evaluated at . In addition, the typical radius of curvature, , is always much larger than the vortex core radius: . The neighbourhood on the vortex line near a point is thus effectively straight and perpendicular to the disc at distances such that (range which exists given the huge scale separation characterising the system). At such distances, the superfluid velocity induced by the closest vortex line elements on is perpendicular to the unit tangent vector , yielding zero contribution to . Concerning the line element centered in , the only non-zero contribution to which arises from the vortex line going through is the contribution of elements of that line which are sufficiently distant from , where the induced velocity is constant and can be evaluated at . thus reduces to Eq. (6) in the main manuscript:
where
is the superfluid velocity at a point of a vortex line induced by distant vortex line elements on that line and other lines (), added to the external potential superflow .
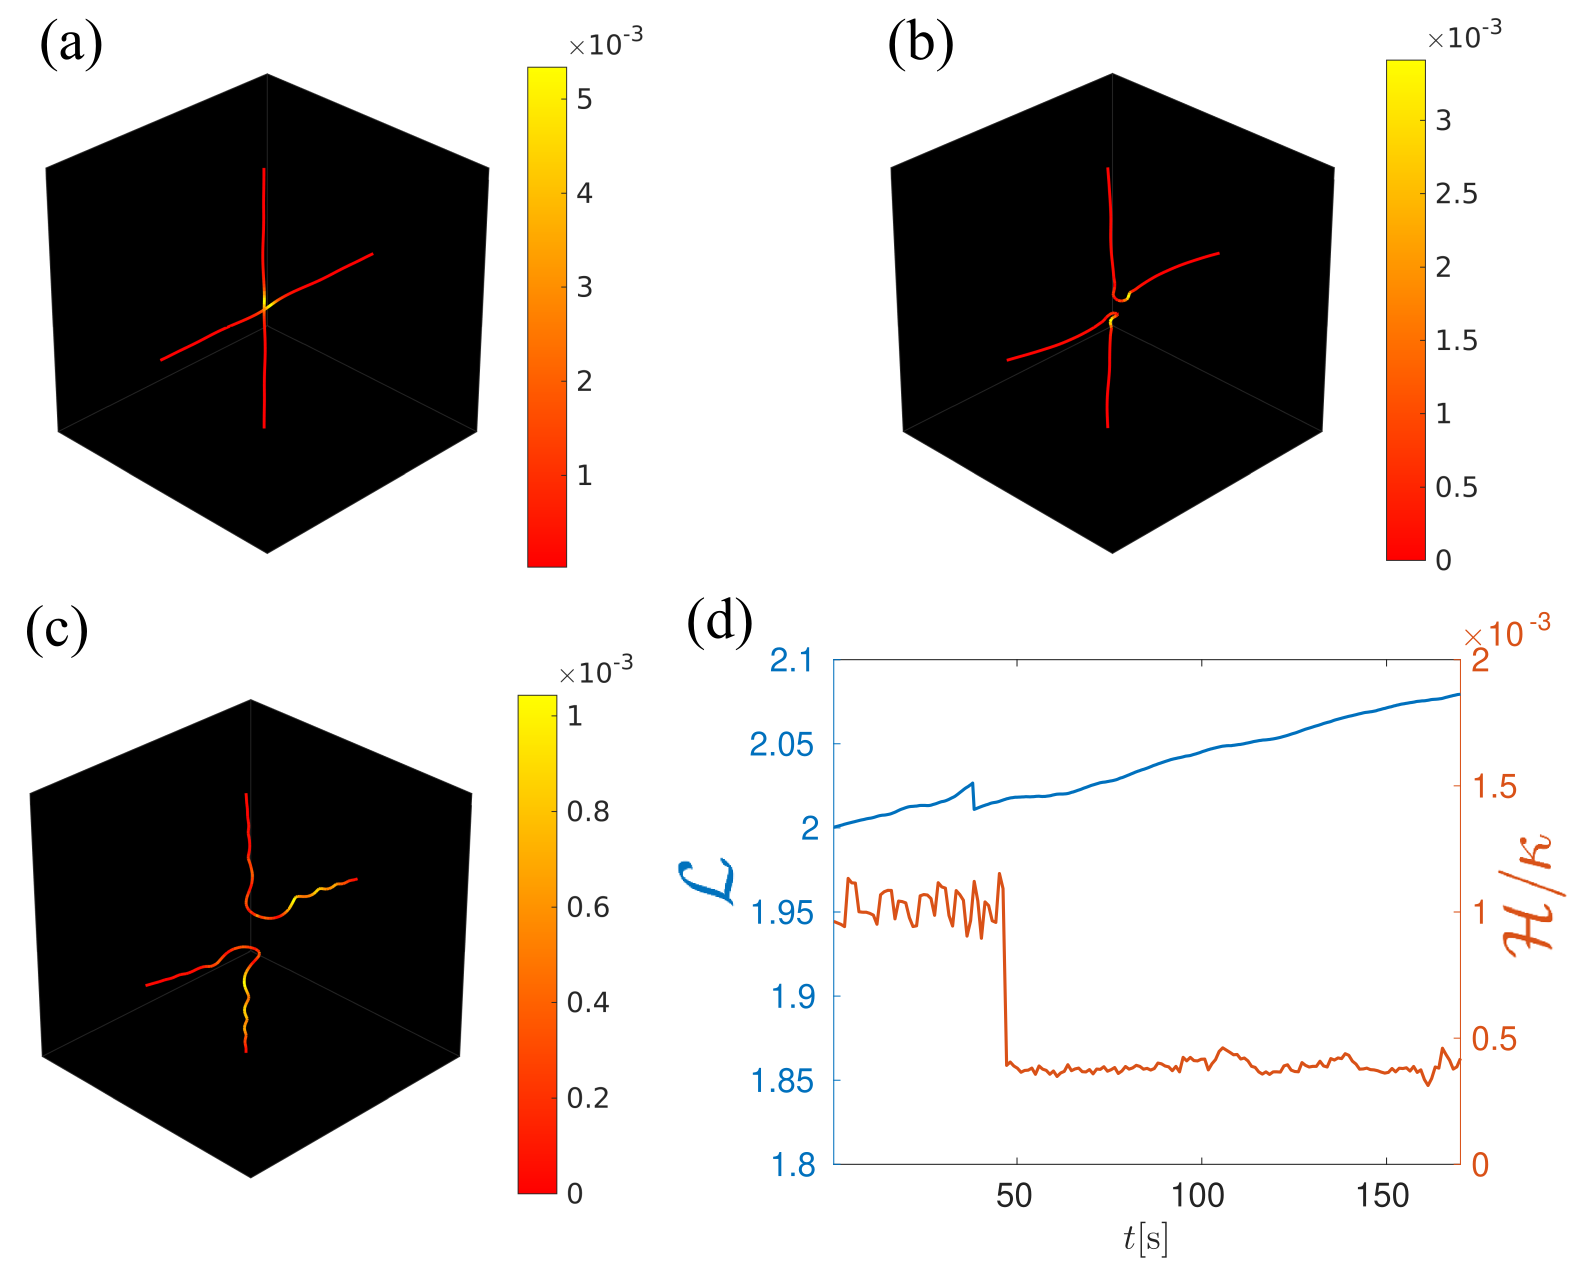
Appendix 2: Helicity during reconnection
Figure 9 illustrates a single reconnection of two initially orthogonal vortex lines at zero temperature simulated using the VFM in a periodic domain. The reconnection occurs at s, where the total length suddenly decreases due to the reconnection algorithm (on a longer time, the vortex lines are slightly stretched). There is a small time delay between the reconnection and the resulting jump of mesoscale helicity caused by the relaxing vortex cusp (notice the Kelvin waves which move away); this jump represents the changed proportion of near and far field velocity contributions. Before and after the reconnection, the mesoscale helicity is constant (there is no friction, unlike the simulations presented in the main paper).
Appendix 3: Mechanically-driven turbulence
In this appendix, for the sake of completeness given previous studies reported in the literature Bauer1997 ; Sherwin2012 , we perform a third superfluid turbulence numerical simulation. In particular, we consider superfluid helium at nonzero temperature driven mechanically, e.g. by propellers, which induce turbulence in the normal fluid. In this case, we model the coherent regions of intense normal fluid vorticity typical of classical turbulence by imposing a steady ABC normal fluid flow Bauer1997 ; Sherwin2012 :
| (8) | |||||
| (9) | |||||
| (10) |
with , , and temperature . The scale of the forcing is the size the computational box . All numerical parameters of the simulation (box-size, vortex-line spatial discretization and time-step) coincide with the parameters illustrated in Section VI.
In Fig. 10 we report a helicity density colored snapshot of the vortex tangle in the steady-state regime: it shows regions of large magnitude of positive helicity density , if compared to snapshots of the vortex tangle corresponding to thermally-driven and injection-driven turbulence (Fig. 2 and Fig. 4, respectively). This is reflected in the temporal evolution of (shown in Fig. 11) which in the statistically steady-state has a large positive value, one order of magnitude larger than the value of observed in injection generated superfluid turbulence (Fig. 5).
The fact that in mechanically-driven turbulence is larger than in thermally-driven and injection-driven turbulence is expected: the ABC flow has the Beltrami property of maximal helicity i.e. velocity and vorticity of the normal fluid are locally aligned. As the imposed normal fluid velocity field, which forces the superfluid turbulence, is stationary, superfluid vortex lines tend to align with the normal fluid vorticity Bauer1997 boosting the growth rate of helical Kelvin waves arising from the Glaberson-Donnelly instability. It is therefore possible to conclude that in mechanically-driven turbulence the large superfluid mesoscale helicity is an effect of the normal fluid via the mutual friction interaction.
This large value of is consistent with the computed average magnitude of non-local velocity contributions , in the spirit of Eq. (7). Indeed, if we calculate in the statistically steady-state we obtain , larger than the corresponding values evaluated for thermally-driven and injection-driven superfluid turbulence, respectively and . We stress that these computed values of for the three numerical simulations of superfluid turbulence only show the the qualitative behaviour of across the three distinct systems, as in Eq. (7) only the tangential component of is averaged over the vortex tangle. To conclude this section, in Fig. 12 we report the superfluid energy spectrum for this mechanically-driven superfluid turbulent flow. As a result of the stationary forcing imposed at the largest scale of the flow (the box-size ), is peaked at the highest wavenumber , producing a much steeper spectrum.
References
- (1) C. F. Barenghi and N. G. Parker, A Primer on Quantum Fluids, Springer (2016).
- (2) C. F. Barenghi, L. Skrbek, and K. R. Sreenivasan, Proc. Nat. Acad. Sci. USA 111 (suppl. 1), 4647 (2014).
- (3) L. Skrbek and K. R. Sreenivasan, Phys. Fluids 24, 011301 (2012).
- (4) S. K. Nemirovskii, Phys. Reports 524, 85 (2013).
- (5) E. A. L. Henn, J. A. Seman, G. Roati, K. M. F. Magalhães, and V. S. Bagnato, Phys. Rev. Lett. 103, 045301 (2009).
- (6) G. Lamporesi, S. Donadello, S. Serafini, F. Dalfovo, G. Ferrari, Nat Phys 9, 656 (2013).
- (7) G. E. Volovik, JETP Lett. 78, 533 (2003).
- (8) P. M. Walmsley and A. I. Golov, Phys. Rev. Lett. 100, 245301 (2008).
- (9) S. K. Nemirovskii, Low Temp. Phys. 45, 841 (2019).
- (10) J. Maurer and P. Tabeling, Europhys. Lett. 43, 29 (1998).
- (11) J. Salort, C. Baudet, B. Castaing, B. Chabaud, F. Davidaud, T. Didelot, P. Diribarne, B. Dubrulle, Y. Cagne, F. Gauthier, A. Girard, B. Hébral, B. Rousset, P. Thibault and P. E. Roche, Phys. Fluids 22, 125102 (2010).
- (12) M. R. Smith, R. J. Donnelly, N. Goldenfeld, and W. F. Vinen, Phys. Rev. Lett. 71 ,2583(1993)
- (13) D. E. Zmeev, P. M. Walmsley, A. I. Golov, P. V. E. McClintock, S. N. Fisher, and W. F. Vinen, Phys. Rev. Lett. 115, 155303 (2015).
- (14) D. I. Bradley, D. O. Clubb, S. N. Fisher, A. M. Guénault, R. P. Haley, C. J. Matthews, G. R. Pickett, V. Tsepelin and K. Zaki, Phys. Rev. Lett. 96, 035301 (2006).
- (15) D. I. Bradley, S. N. Fisher, A. M. Guénault, R. P. Haley, G. R. Pickett, and V. Tsepelin, Nature Phys. 7, 473 (2011).
- (16) A.W. Baggaley, C.F. Barenghi, A. Shukurov, and Y.A. Sergeev, Europhys. Lett. 98, 26002 (2012).
- (17) L.K. Sherwin-Robson, C.F. Barenghi and A.W. Baggaley, Phys. Rev. B 91, 104517 (2015).
- (18) A.W. Baggaley, C.F. Barenghi, and Y.A. Sergeev, Phys. Rev. B 85, 060501(R) (2012).
- (19) A. Cidrim, A.C. White, A.J. Allen, V.S. Bagnato, and C.F. Barenghi, Phys. Rev. A 96, 023617 (2017).
- (20) G.W. Stagg, N.G. Parker, and C.F. Barenghi, Phys. Rev. A 94, 053632 (2016).
- (21) T. Bland, G.W. Stagg, L. Galantucci, A.W. Baggaley, N.G. Parker, Phys. Rev. Lett. 121, 174501 (2018).
- (22) P. Mocz, M. Vogelsberge, V.H. Robles, J. Zavala, M. Boylan-Kolchin, A. Fialkov, and L. Hernquist. M.N.R.A.S. 471, 4559 (2017).
- (23) U. Frisch, Turbulence. The legacy of A.N. Kolmogorov. Cambridge (1995).
- (24) C.F. Barenghi, V. L’vov and P.E. Roche, Proc. Nat. Acad. Sci. USA, 111, (Suppl. 1) 4683 (2014).
- (25) C. Nore, M. Abid, and M.E. Brachet, Phys. Rev. Lett. 78, 3896 (1997).
- (26) T. Araki, M. Tsubota, and S.K. Nemirovskii, Phys. Rev. Lett. 89, 145301 (2002).
- (27) A.W. Baggaley, J. Laurie and C.F. Barenghi, Phys. Rev. Lett. 109, 205304 (2012)
- (28) A.W. Baggaley, Phys. Fluids 24, 055109 (2012).
- (29) S.R. Stalp, L. Skrbek, and R.J. Donnelly, Phys. Rev. Lett. 82, 4831 (1999).
- (30) E. Varga, S. Babuin, and L. Skrbek, Phys. Fluids 27, 065101 (2015).
- (31) J. Gao, W. Guo, and W.F. Vinen, Phys. Rev. B 94, 094502 (2016).
- (32) C.F. Barenghi, Y.A. Sergeev and A.W. Baggaley, Sci. Reports 6, 35701 (2016).
- (33) M. La Mantia and L. Skrbek, Europhys. Lett. 105, 46002 (2014).
- (34) A.W. Baggaley and C.F. Barenghi, Phys. Rev. E 84 067301 (2011).
- (35) L. Galantucci and M. Sciacca Acta Appl Math 132, 281 (2014).
- (36) K.W. Schwarz, Phys. Rev. B 38, 2398 (1988).
- (37) R. Hänninen, and A.W. Baggaley, Proc. Nat. Acad. Sci. USA 111 (Suppl. 1) 4667 (2014).
- (38) D.E. Galli, L. Reatto and M. Rossi, Phys. Rev. B 89, 224516 (2014).
- (39) P.G. Saffman, Vortex Dynamics, Cambridge (1993).
- (40) R.J. Donnelly and C.F. Barenghi, J. Phys. Chem. Ref. Data 27, 1217 (1998).
- (41) H.K. Moffatt, J. Fluid Mech. 35, 117 (1969).
- (42) R.H. Kraichnan, J. Fluid Mech. 59, 745 (1973).
- (43) E. Levich and L. Shtilman, Phys. Lett. A 126, 243 (1988).
- (44) M. Kholmyansky, M. Shapiro-Orot and A. Tsinober, Proc. Roy. Soc. A 457 2699 (2001).
- (45) L. Biferale, S. Musacchio and F. Toschi, Phys. Rev. Lett. 108, 164501 (2012).
- (46) A. Brandenburg and K. Subramanian, Phys. Reports 417, 1 (2005).
- (47) M.W. Scheeler, W.M. van Rees, H. Kedia and D. Kleckner, Science 357, 487 (2017).
- (48) P. Clark di Leoni, P.D. Mininni and M.E. Brachet, Phys. Rev. A 95, 053636 (2017).
- (49) H.K. Moffatt and R.L. Ricca, Proc. Roy. Soc. London A 439, 411 (1992).
- (50) R. Hänninen, N. Hietala and H. Salman, Sci. Reports 6, 37571 (2016).
- (51) S. Zuccher and R.L. Ricca, Fluid Dyn. Res. 50, 011414 (2018).
- (52) H. Salman, Proc. Roy. Soc. A 473, 20160853 (2018).
- (53) I. Amelio, D.E. Galli and L. Reatto, Phys. Rev. Lett. 121, 015302 (2018).
- (54) J. Koplik and H. Levine Phys. Rev. Lett 71, 1375 (1993).
- (55) S. Serafini, L. Galantucci, E. Iseni, T. Bienaime, R.N. Bisset, C. F. Barenghi, F. Dalfovo, G. Lamporesi and G. Ferrari Phys. Rev. X 7, 021031 (2017).
- (56) L. Galantucci, A.W. Baggaley, N.G. Parker, and C.F. Barenghi, Proc. Nat. Acad. Sci. USA 116, 12204 (2019)
- (57) A.W. Baggaley, J. Low Temp. Phys. 168, 18 (2012).
- (58) A.W. Baggaley and C.F. Barenghi Phys. Rev B 84, 020504(R) (2011).
- (59) M. Tsubota, T. Araki and C.F. Barenghi, Phys. Rev. Lett. 90, 205301 (2003).
- (60) C.F. Barenghi, G.G. Bauer, D.C. Samuels and R.J. Donnelly, Phys. Fluids 9, 2631 (1997).
- (61) M. Leadbeater, T. Winiecki, D.C. Samuels, C.F. Barenghi, and C.S. Adams, Phys. Rev. Lett. 86 1410 (2001).
- (62) S. Zuccher, M. Caliari, A. W. Baggaley and C. F. Barenghi, Phys. Fluids 24, 125108 (2012).
- (63) C.E. Laing, R.L. Ricca, and D.W.L. Sumners, Sci. Reports 5, 9224 (2015).
- (64) M.W. Scheeler, D. Kleckner, D. Proment, G.L. Kindlmann, and W.T.M. Irvine, Proc. Natl. Acad. Sci. USA 111, 15350 (2014).
- (65) S. Zuccher and R.L. Ricca, Phys. Rev. E 95, 053109 (2017).
- (66) E. Fonda, D.P. Meichle, N.T. Ouellette, S. Hormoz, and D.P. Lathrop, Proc. Nat. Acad. Sci. USA 111, suppl. 1, 4707 (2014).