Micron-scale Fast Electron Filamentation and Recirculation determined from Rear Side Optical Emission in High Intensity Laser-Solid Interactions
Abstract
The transport of relativistic electrons generated in the interaction of petawatt class lasers with solid targets has been studied through measurements of the optical emission from their rear surface. The high degree of polarization of the emission indicates that it is predominantly optical transition radiation. A halo that surrounds the main region of emission is also polarized, and is attributed to the effect of electron recirculation. The variation of the amplitude of the transition radiation with respect to observation angle provides evidence for the presence of m-size filaments.
1 Introduction
The study of electron transport through dense plasmas is an active area of research of importance to many applications. Relativistic electrons generated in high intensity laser-solid interactions can pass through the critical surface, where the laser energy is mostly absorbed, and continue, free from the influence of the laser, through to the rear surface of the target. The propagation of this large current of electrons can be affected by self-generated electric and magnetic fields, as well as collisions. A better understanding of this transport is a key issue for the success of the fast ignitor approach to inertial confinement fusion [1, 2] and may lead to optimization of ion acceleration from laser-irradiated solid targets [3, 4].
Electron transport has been studied by and XUV emission [5, 6], shadowgraphy [7, 8, 9] and optical emission [10, 11]. In particular, the divergence and temporal modulation of the electrons have been investigated by spatially and spectrally resolving rear surface optical radiation [10, 11, 12, 13, 14]. This radiation can be attributed to thermal, synchrotron, transition radiation or coherent wake emission (CWE) [15].
These different mechanisms of emission can be differentiated by their polarization characteristics. Thermal (blackbody) radiation is not expected to be polarized. Synchrotron radiation (SR) is mainly polarized in the plane of motion of the electrons [16]. In our case it would be produced by electrons being pulled back by the electrostatic field that builds up at the back of the target [10], so that the polarization would vary across the emission region, depending on the direction in which electrons travel before restriking the surface. CWE should be polarized in the plane of polarization of the laser field and is mainly emitted in the direction of propagation of the laser field [15]. Transition radiation (TR) is also polarized; its properties will be discussed in section 2.
In this paper we present the first spatially resolved measurements of the polarization of optical emission from the rear of solid targets irradiated by high intensity lasers. The radiation is found to be uniformly polarized over the emission region, with a degree of polarization dependent on the orientation of the target rear surface, demonstrating that it is predominantly TR. The strong variation of the signal with the orientation of the target rear surface (or, in other words, of the angle of observation) reveals that, at high laser intensities, fast electrons propagate in micron-size filaments. Moreover, imaging the TR far from the laser axis gives direct evidence for the presence of recirculating currents.
This paper is organized as follows. The polarization and general properties of transition radiation are briefly discussed in section 2. In sections 3 we describe the results of two different experimental campaigns, which have been performed on the Vulcan CPA laser system at the Central Laser Facility. The results of section 3 are further discussed in section 4 and a brief summary of the paper is given in section 5.
2 Polarization properties of transition radiation
The total emitted energy of the transition radiation per unit angular frequency and unit solid angle can be written as [18]
| (1) | |||||
where the first integrals (first line) refer to the incoherent component of the transition radiation (ITR) and the second integrals (second line) to the coherent one (CTR).
Here is the momentum distribution function, and are the Fourier-transforms of the electric fields in the plane parallel and perpendicular to the radiation plane (defined by the directions of the target normal and the direction of
observation) and is a coherence function that takes into account the exact time and position at which electrons reach the interface.
Expressions for and can be found in [17] for the case of two media with generic dielectric constant. However, for our purposes an interface that separates a perfect conductor with the vacuum can be assumed, in which case the Fourier-fields simplify becoming [17, 18]
| (2) | |||
| (3) |
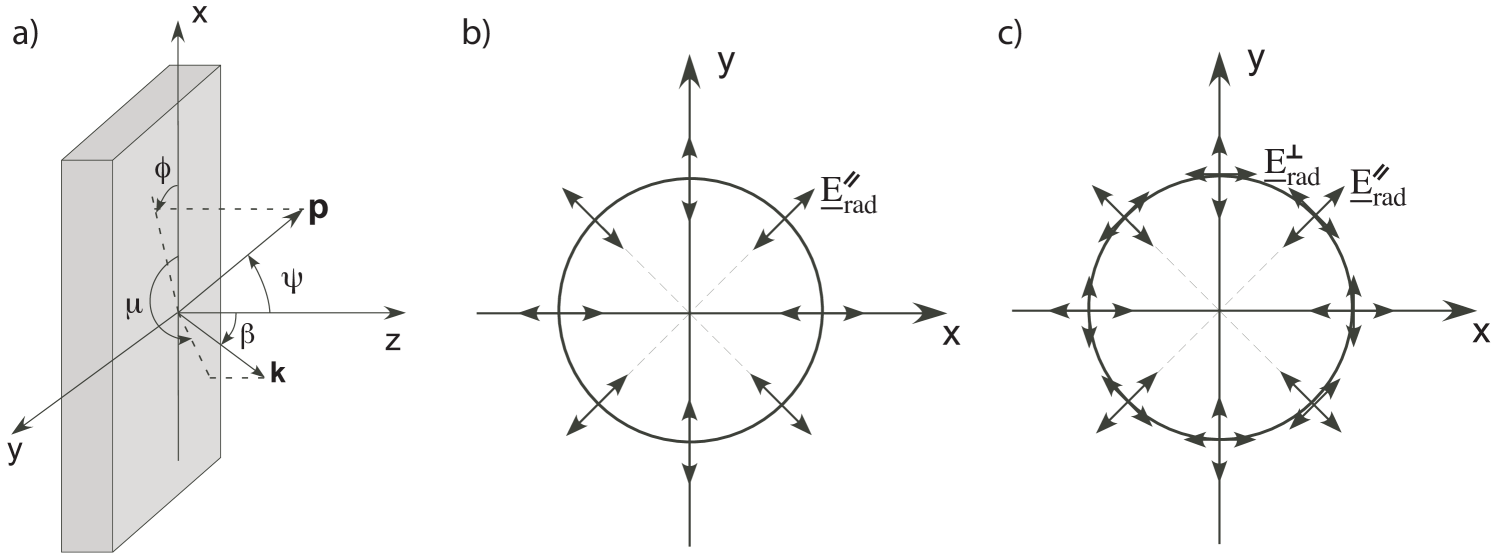
where is the normalized momentum, , and all the other variables are shown in Fig. 1a.
In the simplest case of a single particle traversing normal to a plasma-vacuum interface, transition radiation is radially polarised, since for . In other words, the electric field oscillates in the radiation plane (Figure 1b). For a particle that does not traverse normal to the interface the radiation is not radially polarized and a component normal to the radiation plane appears (Figure 1c). In this general case, the polarization state is dependent on both the particle’s momentum vector and the direction of observation . Thus for a given set of observation angles the polarization state of the radiation carries information on the direction of the particles as they escaped the rear surface. This will be used for later considerations, to estimate the direction of the electrons from the polarization state of the radiation.
3 Experimental results
The experiments were performed with the Vulcan CPA laser operating with wavelength m and pulse length .
3.1 Experiment 1
A series of shots were taken with J of energy on target (Experiment 1).
The p-polarized laser pulses were focused by a parabola to a FWHM spot size and a peak intensity on to a range of flat Au foils of varying thickness at an angle of incidence of . The target rear surface was imaged at from target normal and from laser axis in the horizontal plane onto two 16 bit CCD cameras equipped with interference filters
and polarizers. The magnification was with a theoretical resolution of .
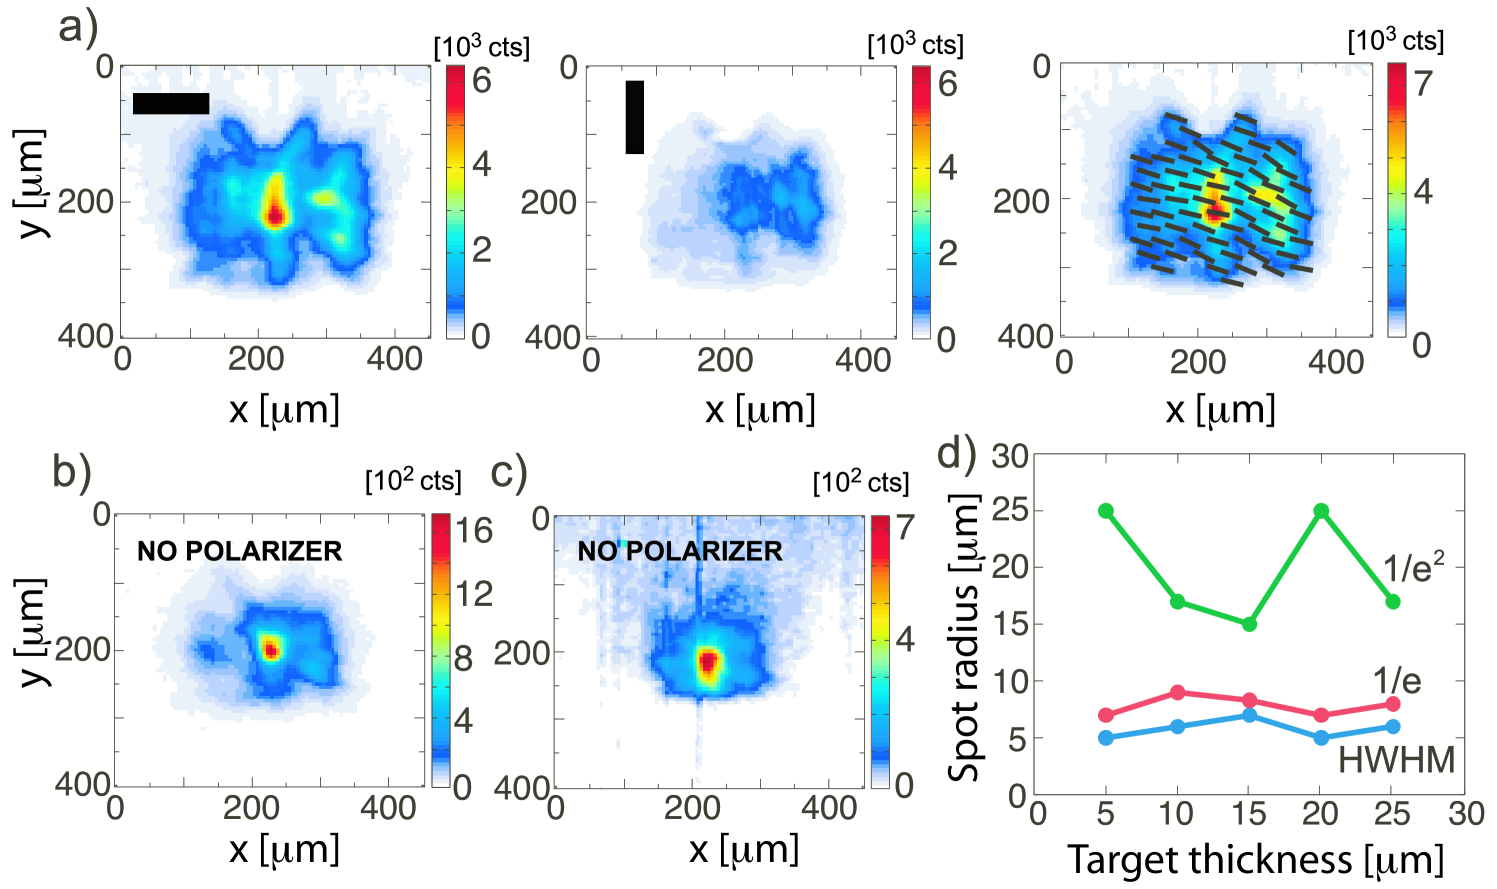
Figure 2a shows an image of the rear-surface emission from a 5 Au target. The image is horizontally polarized over the whole region. This is true for the extended halo as well as for the brightest central emission. Hence the emission is not thermal, and the uniformity of the polarization is also inconsistent with it being SR. The measurement is however consistent with it being radially polarised TR viewed in the horizontal plane.
That the halo is also TR, indicates that the electrons must have been transported transversely by multiple reflections within the target.
If, on the contrary, they had travelled ballistically from the source to an emission point with transverse displacements m, then they would be travelling at to target normal, which would severely inhibit their ability to generate TR. In fact, eqs. (2) and (3) show that
for (electron at grazing incidence). However, the signal at a displacement of m is as much as 20% of the peak intensity. This implies smaller angles of exit and is thus direct evidence for refluxing of hot electrons which has previously only been deduced indirectly [19, 20, 21]. Refluxing occurs because of the inhibition of electrons exiting into vacuum by the strong sheath fields that they generate, and is most dominant for thin targets where the surface charge density is greatest.
We also note that the TR signal strength decreases with increasing target thickness, as expected, but the spatial extent of the emission remains relatively unchanged (Fig. 2d). This is in contrast to previous measurements at lower intensities where increasing emission size with target thickness could be explained by ballistic transport of hot electrons [10].
3.2 Experiment 2
A further scan was performed on targets with varying rear-surface wedge angle (Experiment 2). For these shots, an energy of up to on target was focused with of the energy within , to give . In this case the p-polarized pulses were incident at a fixed angle of to target normal.
The radiation was collected using an imaging system, centered at from the normal to the target front (i.e. to laser axis) in the horizontal plane, with magnification and theoretical resolution . The radiation was split into two orthogonal polarizations with a Wollaston prism and imaged onto the same chip of a filtered bit CCD camera.
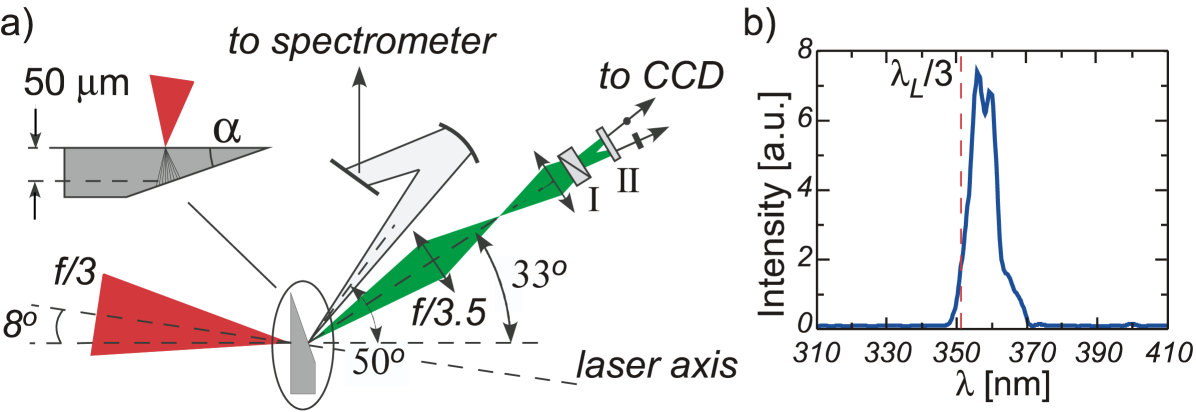
The radiation was also spectrally resolved from the NIR to the UV using an optical spectrometer with resolution . Harmonics of the laser frequency were recorded in the emission, most strongly at , but also at , and (e.g. Fig. 3b). This supports the fact that the emission is mainly coherent transition radiation (CTR) at the wavelengths of interest, indicating a combination of resonant and heating [11].
Cu wedges with angles of , 20∘ and 35∘ as well as a m flat () target were used (Fig. 3a). The interaction point was chosen to ensure that the distance from front to rear surface was 50 for each target, thus keeping the effective foil thickness constant. The use of wedge targets allowed the angle that the fast electron beam formed to the rear surface to be varied without significantly changing the absorption at the front surface. Hence it can be assumed that the fast electrons produced in the interaction for all these targets had similar properties (temperature, direction, temporal envelope). As the collection optics were at a fixed position, this also enabled a variation of the angle of observation (shown in Fig. 1a) with respect to the normal to the target rear side.
In the following two properties of the data collected in this campaign (Experiment 2) will be discussed, as a function of the angle of observation:
-
1.
the polarization state of the radiation, from which an estimate for the direction of the electron filaments diagnosed by our imaging system will be inferred;
-
2.
the integrated signal level recorded on the CCD camera, from which an estimate for the size of the electron beamlets responsible for the CTR signal will be inferred.
3.2.1 Polarization data - direction of the electron filaments.
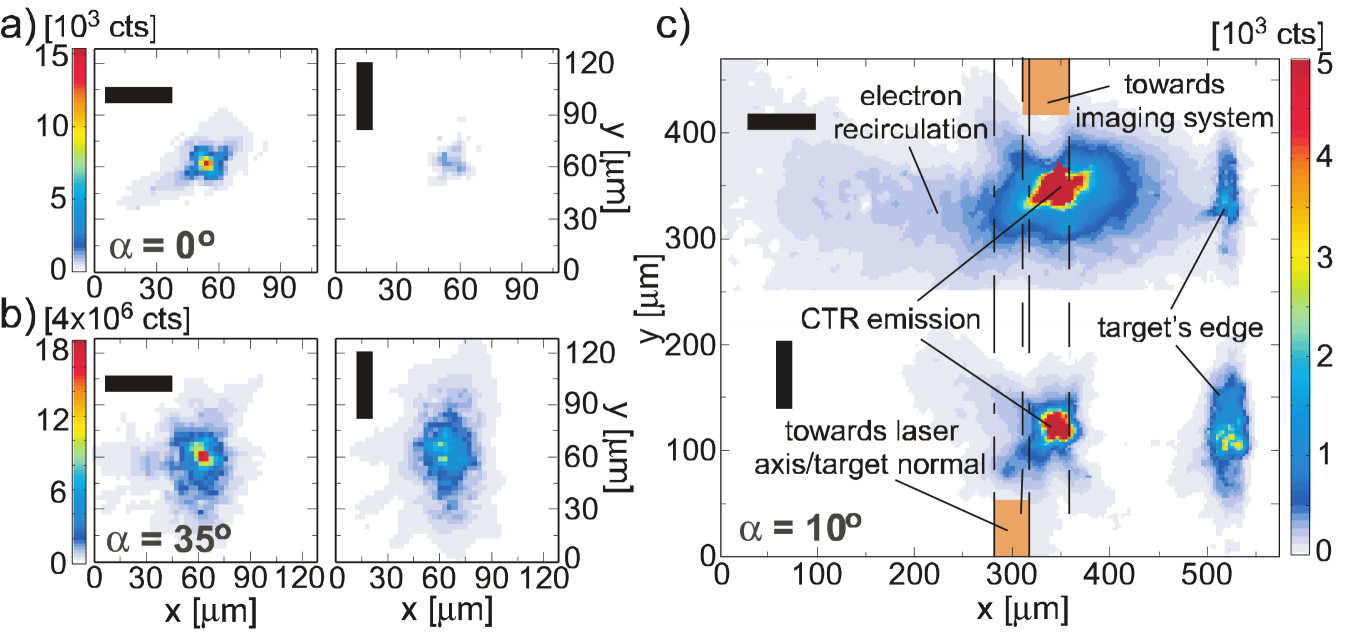
The radiation exhibited a high degree of polarization that was dependent on the wedge angle (Fig. 4). As for Experiment 1, these images exhibit a wide polarized halo surrounding the bright central CTR, most clearly seen in Fig. 4c. On the right side of this image, for both polarizations, a bright line of emission is seen from the target edge. Both the extended halo and the target-edge emission are at distances far from the initial interaction region. Therefore, these effects can also be attributed to electron recirculation. Ion emission from the edge of solid targets has been observed previously [21], and has also been attributed to the dynamics of electrons transported through the targets by recirculation.
For flat targets the dominant polarization was horizontal, as before. However, increasing the wedge angle increased the relative contribution of the vertical polarization as expected for TR. A mean direction for the electrons diagnosed by our imaging system can be inferred from the dependence of the polarization state on .
For this analysis, the CTR component of eq. (1) was integrated over the solid angle of the collection optics. The form factor was evaluated as shown in the next paragraph 3.2.2, however it is not of relevance for the present discussion. Our choice has been to identify the polarization state of the radiation by the ratio of the horizontal to the vertical polarization. For each wedge target, the direction of a collimated beam of electrons is then varied with respect to the front side target normal (which was not varied for the different wedge targets). For each of these directions, integration of eq. (1) over the solid angle of the imaging system gives rise to a particular value of this polarization ratio. This process is then repeated for a different wedge target. Figure 5 shows the results for varying compared to the experimental results at different (or, equivalently, ). It should be noted that the dominant polarization is horizontal, since we were observing the radiation mainly along the horizontal plane.
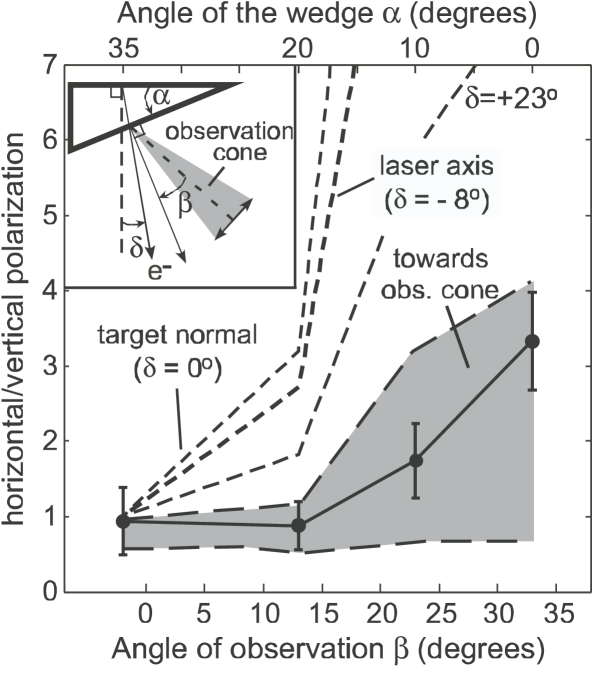
The analysis suggests that the electron beamlets diagnosed by the imaging system were directed within the cone of the collection optics, i.e. . This is also supported by noting the distance of the main CTR from the laser axis (Fig. 4c), which can be determined by measuring the distance from the target edge.
This conclusion is also supported more directly by noting the distance of the main CTR from the laser axis in Fig. 4c, which can be determined by measuring the distance from the target edge. The position of the signal from the CTR coincides with the position along the direction of the first lens.
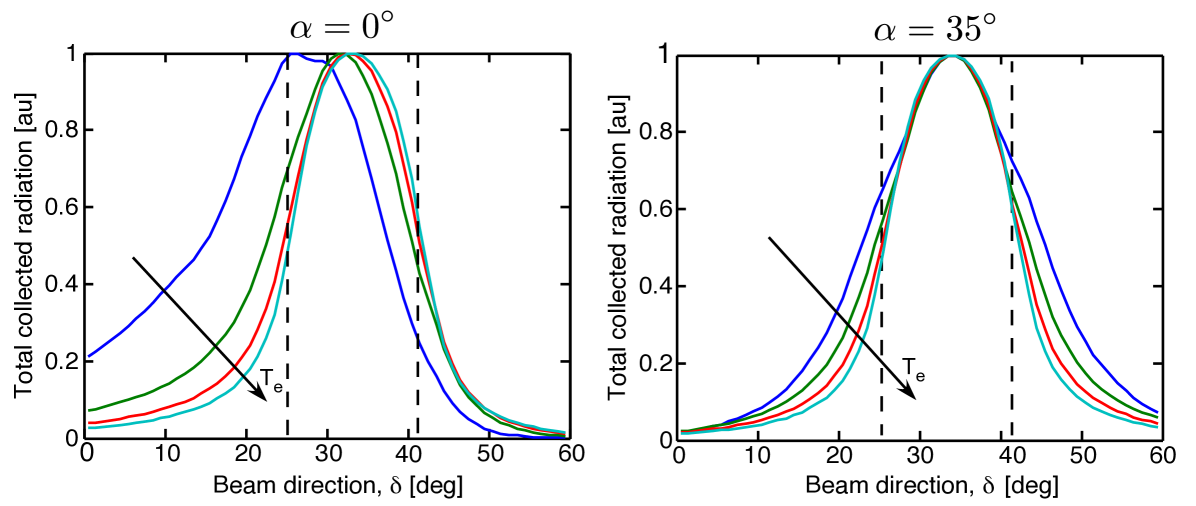
This result is expected since for relativistic electrons the angular distribution of transition radiation is confined almost along the particle’s direction of propagation. The (theoretical) amount of radiation collected by the imaging system as a function of the same angle of the electrons , and for two different wedge targets () is shown in Fig. 6. It is clear that electrons going towards the collection optics (denoted by the two vertical broken lines) are more easily detected by the imaging system. These plots are made assuming a Maxwellian distribution of electrons.
3.2.2 Signal intensity data - size of the electron filaments.
The size of the main bright source of radiation in Fig. 4 is limited by the resolution of the imaging system. A measure of this size can also be obtained by using the angular distribution of the radiated energy, which for CTR should be strongly dependent on source size. To interpret the variation of the signal intensity with wedge angle it is important to retain all the parameters in the CTR component of eq. (1). In particular, the role of the form factor is essential in this case. Physically, it accounts for the phase difference of the waves emitted at the rear of the target. Therefore it depends on the time and position at which each electron reaches the back surface. Assuming that a train of impulsive electron bunches is produced at the front surface, that the beam is collimated and that the transverse profile of the electron beam is Gaussian, is given by
| (4) |
Here is the bunch period, the number of bunches and the diameter of the beam at maximum intensity.
The effect of the quantity (for which we do not give a full expression since it is not relevant for this discussion) is mainly a decrease in signal strength with target thickness. The second term in eq. (4) gives rise to harmonics of the bunch frequency in the spectrum, as reported previously [11, 13, 14].
The third term in eq. (4) is the result of the Fourier-transform of the transverse profile of the electron current [18, 23]. It can be understood by analogy with classical diffraction in the far-field (Fraunhofer) approximation.
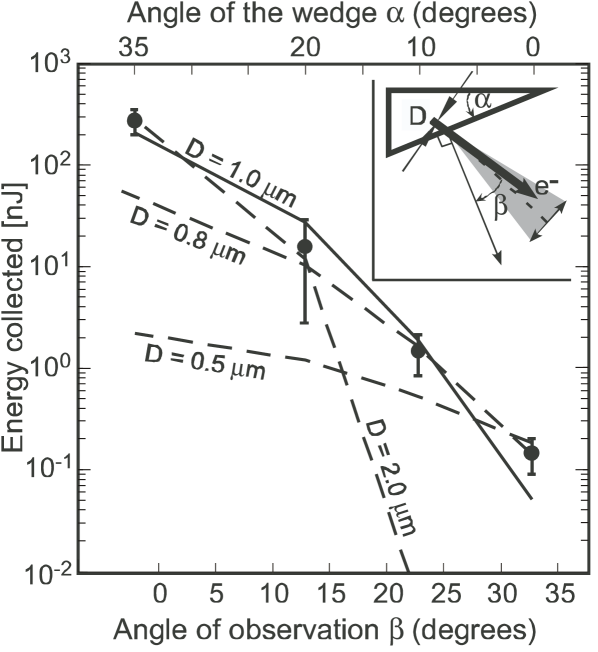
The radiation emitted from the rear surface can be thought of as the diffraction of a plane wave by a circular aperture with a Gaussian transmission function. When the angle of observation differs from zero, this term leads to a rapid decrease in intensity, depending on the transverse size of the beam . This idea was suggested by Zheng et al. [23] but, to our knowledge, in all previous experiments the observation angle was kept constant.
The data in Fig. 7 have been fitted for different beam sizes.
The electron temperature was assumed to be MeV, but the dependence on is weak. A best fit over all the experimental data implies FWHM diameter m, however the fall-off in signal strength at large is too strong. A better fit is found if only the data for and are considered. In this case, the best fit is for m. For m the calculated fall-off in signal would be slower than measured.
4 Discussion
Numerous numerical results have demonstrated the formation of -scale filaments directed over a wide range of angles [24, 25]. For our conditions, these filaments would have to propagate through m of solid Cu, where angular scattering would be expected to cause rapid transverse expansion. Neglecting energy loss and assuming small total angular deflection, this “beam blooming”, defined as the variance of the transverse beam size due to scattering [26], can be written as
| (5) |
where is the distance travelled, the atomic number, the atom number density, is a term that depends on the electron-atom scattering cross section and , are the momentum and velocity of the electron, respectively.
This result gives excellent agreement with Monte Carlo modelling [27].
Eq. (5) indicates that, in order to obtain features FWHM (), electrons with energies MeV are required for all realistic values of .
This is well above the ponderomotive potential of the laser ( MeV) and contradicts the maximum of – MeV measured with an electron spectrometer positioned on laser axis in this experiment.
Direct imaging of rear surface emission has recently suggested the presence of filaments as small as m and with a mean size of m for intensities of onto a range of different targets [28, 29]. However, we show that at higher intensities, the filament size can be below that observable with traditional imaging techniques.
This small scale structure can only be explained by the influence of self-generated electric or magnetic fields inside the target. This could be due to the resistive growth of the magnetic field inside the target [30].
Results from the code LSP for parameters close to those of this experiment show no sign of filaments at ps for intensities up to Wcm-2, but exhibit filaments – m wide at W cm-2 (see Fig. 12 in [25]).
In addition, rear surface magnetic focusing [31] and instabilities associated with the electron sheath at the back surface may contribute to the observed small emission size.
5 Conclusions
In conclusion, we have shown that the Polarization of CTR can be used to directly characterise non-linear propagation phenomena of intense electron beams such as recirculation and filamentation with unprecedented spatial resolution. These results imply that the transport is strongly influenced by collective effects at high laser intensity. Understanding the formation and behavior of these small scale structure will be of vital importance for applications of high intensity laser physics.
Acknowledgments
We acknowledge discussions with S. Atzeni and R. J. Kingham and the assistance of the staff of the Central Laser Facility at the Rutherford Appleton Laboratory.
References
References
- [1] M. Tabak et al., Phys. Plasmas 1, 1626 (1994)
- [2] S. Atzeni, Phys. Plasmas 6, 3316 (1999).
- [3] E. Clark et al., Phys. Rev. Lett. 84, 670 (2000).
- [4] R. A. Snavely et al., Phys. Rev. Lett. 85, 2945 (2000).
- [5] R. B. Stephens et al., Phys. Rev. E 69, 066414 (2004).
- [6] K. L. Lancaster et al., Phys. Rev. Lett. 98, 125002 (2007).
- [7] M. Tatarakis et al., Phys. Rev. Lett. 81, 999 (1998).
- [8] M. Borghesi et al., Phys. Rev. Lett. 83, 4309 (1999).
- [9] L. Gremillet et al., Phys. Rev. Lett. 83, 5015 (1999).
- [10] J. J. Santos et al., Phys. Rev. Lett. 89, 025001 (2002).
- [11] S. D. Baton et al., Phys. Rev. Lett. 91, 105001 (2003).
- [12] R. Jung et al., Phys. Rev. Lett. 94, 195001 (2005).
- [13] H. Popescu et al., Phys. Plasmas 12, 063106 (2005).
- [14] J. J. Santos et al., Phys. Plasmas 14, 103107 (2007).
- [15] U. Teubner et al., Phys. Rev. Lett. 92, 185001 (2004).
- [16] Jackson, Classical Electrodynamics, John Wiley & Sons, 1998.
- [17] M. L. Ter-Mikaelian, High-Energy Electromagnetic Processes in Condensed Media, Wiley-Interscience, 1972.
- [18] C. B. Schroeder et al., Phys. Rev. E 69, 016501 (2004).
- [19] A. J. Mackinnon et al., Phys. Rev. Lett. 88, 215006 (2002).
- [20] P. M. Nilson et al., Phys. Rev. E 79, 016406 (2009).
- [21] P. McKenna et al., Phys. Rev. Lett. 98, 145001 (2007).
- [22] J. Zheng et al., Phys. Plasmas 10, 2994 (2003).
- [23] J. Zheng et al., Phys. Plasmas 9, 3610 (2002).
- [24] B. F. Lasinski et al., Phys. Plasmas 6, 2041(1999); H. Ruhl, Plasma Sources Sci. Technol. 11, A154A158 (2002) ; Y. Sentoku et al., Phys. Rev. E 65, 046408 (2002); C. Ren et al., Phys. Rev. Lett. 93, 185004 (2004); J. C. Adam et al., Phys. Rev. Lett. 97, 205006 (2006).
- [25] R. G. Evans, High Energy Density Physics, 2 35 (2006).
- [26] C. K. Li and R. D. Petrasso, Phys. Rev. E 73, 016402 (2006).
- [27] J. R. Davies et al., Phys. Rev. E 56, 7194, (1997).
- [28] M. Storm et al., Rev. Sci. Instrum. 79, 10F503 (2008).
- [29] M. Storm et al., Phys. Rev. Lett. 102, 235004 (2009).
- [30] L. Gremillet et al., Phys. Plasmas 9, 941 (2002).
- [31] J. R. Davies, A. R. Bell, and M. Tatarakis, Phys. Rev. E 59, 6032 (1999).