MixFlows: principled variational inference via mixed flows
Abstract
This work presents mixed variational flows (MixFlows), a new variational family that consists of a mixture of repeated applications of a map to an initial reference distribution. First, we provide efficient algorithms for i.i.d. sampling, density evaluation, and unbiased ELBO estimation. We then show that MixFlows have MCMC-like convergence guarantees when the flow map is ergodic and measure-preserving, and provide bounds on the accumulation of error for practical implementations where the flow map is approximated. Finally, we develop an implementation of MixFlows based on uncorrected discretized Hamiltonian dynamics combined with deterministic momentum refreshment. Simulated and real data experiments show that MixFlows can provide more reliable posterior approximations than several black-box normalizing flows, as well as samples of comparable quality to those obtained from state-of-the-art MCMC methods.
1 Introduction
Bayesian statistical modelling and inference provides a principled approach to learning from data. However, for all but the simplest models, exact inference is not possible and computational approximations are required. A standard methodology for Bayesian inference is Markov chain Monte Carlo (MCMC) [Robert & Casella, 2004; Robert & Casella, 2011; Gelman et al., 2013, Ch. 11,12], which involves simulating a Markov chain whose stationary distribution is the Bayesian posterior distribution, and then treating the sequence of states as draws from the posterior. MCMC methods are supported by theory that guarantees that if one simulates the chain for long enough, Monte Carlo averages based on the sequence of states will converge to the exact posterior expectation of interest (e.g., (Roberts & Rosenthal, 2004)). This “exactness” property is quite compelling: regardless of how well one is able to tune the Markov chain, the method is guaranteed to eventually produce an accurate result given enough computation time. Nevertheless, it remains a challenge to assess and optimize the performance of MCMC in practice with a finite computational budget. One option is to use a Stein discrepancy (Gorham & Mackey, 2015; Liu et al., 2016; Chwialkowski et al., 2016; Gorham & Mackey, 2017; Anastasiou et al., 2021), which quantifies how well a set of MCMC samples approximates the posterior distribution. But standard Stein discrepancies are not reliable in the presence of multimodality (Wenliang & Kanagawa, 2020), are computationally expensive to estimate, and suffer from the curse of dimensionality, although recent work addresses the latter two issues to an extent (Huggins & Mackey, 2018; Gong et al., 2021). The other option is to use a traditional diagnostic, e.g., Gelman–Rubin (Gelman & Rubin, 1992; Brooks & Gelman, 1998), effective sample size (Gelman et al., 2013, p. 286), Geweke (1992), or others (Cowles & Carlin, 1996). These diagnostics detect mixing issues, but do not comprehensively quantify how well the MCMC samples approximate the posterior.
Variational inference (VI) (Jordan et al., 1999; Wainwright & Jordan, 2008; Blei et al., 2017) is an alternative to MCMC that does provide a straightforward quantification of posterior approximation error. In particular, VI involves approximating the posterior with a probability distribution—typically selected from a parametric family—that enables both i.i.d. sampling and density evaluation (Wainwright & Jordan, 2008; Rezende & Mohamed, 2015a; Ranganath et al., 2016; Papamakarios et al., 2021). Because one can both obtain i.i.d. draws and evaluate the density, one can estimate the ELBO (Blei et al., 2017), i.e., the Kullback-Leibler (KL) divergence (Kullback & Leibler, 1951) to the posterior up to a constant. The ability to estimate this quantity, in turn, enables scalable tuning via straightforward stochastic gradient descent algorithms (Hoffman et al., 2013; Ranganath et al., 2014), optimally mixed approximations (Jaakkola & Jordan, 1998; Gershman et al., 2012; Zobay, 2014; Guo et al., 2016; Wang, 2016; Miller et al., 2017; Locatello et al., 2018b, a; Campbell & Li, 2019), model selection (Corduneau & Bishop, 2001; Masa-aki, 2001; Constantinopoulos et al., 2006; Ormerod et al., 2017; Chérief-Abdellatif & Alquier, 2018; Tao et al., 2018), and more. However, VI typically does not possess the same “exactness regardless of tuning” that MCMC does. The optimal variational distribution is not usually equal to the posterior due to the use of a limited parametric variational family; and even if it were, one could not reliably find it due to nonconvexity of the KL objective (Xu & Campbell, 2022). Recent work addresses this problem by constructing variational families from parametrized Markov chains targeting the posterior. Many are related to annealed importance sampling (Salimans et al., 2015; Wolf et al., 2016; Geffner & Domke, 2021; Zhang et al., 2021; Thin et al., 2021b; Jankowiak & Phan, 2021); these methods introduce numerous auxiliary variables and only have convergence guarantees in the limit of increasing dimension of the joint distribution. Those based on flows (Neal, 2005; Caterini et al., 2018; Chen et al., 2022) avoid the increase in dimension with flow length, but typically do not have guaranteed convergence to the target. Methods involving the final-state marginal of finite simulations of standard MCMC methods (e.g., Zhang & Hernández-Lobato, 2020) do not enable density evaluation.
The first contribution of this work is a new family of mixed variational flows (MixFlows), constructed via averaging over repeated applications of a pushforward map to an initial reference distribution. We develop efficient methods for i.i.d. sampling, density evaluation, and unbiased ELBO estimation. The second contribution is a theoretical analysis of MixFlows. We show (Theorems 4.1 and 4.2) that when the map family is ergodic and measure-preserving, MixFlows converge to the target distribution for any value of the variational parameter, and hence have guarantees regardless of tuning as in MCMC. We then extend these results (Theorems 4.3 and 4.4) to MixFlows based on approximated maps—which are typically necessary in practice—with bounds on error with increasing flow length. The third contribution of the work is an implementation of MixFlows via uncorrected discretized Hamiltonian dynamics. Simulated and real data experiments compare performance to the No-U-Turn sampler (NUTS) (Hoffman & Gelman, 2014), standard Hamiltonian Monte Carlo (HMC) (Neal, 2011), and several black-box normalizing flows (Rezende & Mohamed, 2015b; Dinh et al., 2017). Our results demonstrate a comparable sample quality to NUTS, similar computational efficiency to HMC, and more reliable posterior approximations than standard normalizing flows.
Related work.
Averages of Markov chain state distributions in general were studied in early work on shift-coupling (Aldous & Thorisson, 1993), with convergence guarantees established by Roberts & Rosenthal (1997). However, these guarantees involve minorization and drift conditions that are designed for stochastic Markov chains, and are not applicable to MixFlows. Averages of deterministic pushforwards specifically to enable density evaluation have also appeared in more recent work. Rotskoff & Vanden-Eijnden (2019); Thin et al. (2021a) use an average of pushforwards generated by simulating nonequilibrium dynamics as an importance sampling proposal. The proposal distribution itself does not come with any convergence guarantees—due to the use of non-measure-preserving, non-ergodic damped Hamiltonian dynamics—or tuning guidance. Our work provides comprehensive convergence theory and establishes a convenient means of optimizing hyperparameters.
MixFlows are also related to past work on deterministic MCMC (Murray & Elliott, 2012; Neal, 2012; ver Steeg & Galstyan, 2021; Neklyudov et al., 2021). Murray & Elliott (2012) developed a Markov chain Monte Carlo procedure based on an arbitrarily dependent random stream via augmentation and measure-preserving bijections. ver Steeg & Galstyan (2021) designed a specialized momentum distribution that generates valid Monte Carlo samples solely through the simulation of deterministic Hamiltonian dynamics. Neklyudov et al. (2021) proposed a general form of measure-preserving dynamics that can be utilized to construct deterministic Gibbs samplers. These works all involve only deterministic updates, but do not construct variational approximations, provide total variation convergence guarantees, or provide guidance on hyperparameter tuning. Finally, some of these works involve discretization of dynamical systems, but do not characterize the resultant error (ver Steeg & Galstyan, 2021; Neklyudov et al., 2021). In contrast, our work provides a comprehensive convergence theory, with error bounds for when approximate maps are used.
2 Background
2.1 Variational inference with flows
Consider a set and a target probability distribution on whose density with respect to the Lebesgue measure we denote for . In the setting of Bayesian inference, is the posterior distribution that we aim to approximate, and we are only able to evaluate a function such that for some unknown normalization constant . Throughout, we will assume all distributions have densities with respect to the Lebesgue measure on , and will use the same symbol to denote a distribution and its density; it will be clear from context what is meant.
Variational inference involves approximating the target distribution by minimizing the Kullback-Leibler (KL) divergence from to members of a parametric family , , i.e.,
| (2) |
The two objective functions in Equation 2 differ only by the constant . In order to be able to optimize using standard techniques, the variational family , must enable both i.i.d. sampling and density evaluation. A common approach to constructing such a family is to pass draws from a simple reference distribution through a measurable function ; is often referred to as a flow when comprised of repeated composed functions (Tabak & Turner, 2013; Rezende & Mohamed, 2015a; Kobyzev et al., 2021). If is a diffeomorphism, i.e., differentiable and has a differentiable inverse, then we can express the density of , as
| (3) |
In this case the optimization in Equation 2 can be rewritten using a transformation of variables as
| (4) |
One can solve the optimization problem Equation 4 using unbiased stochastic estimates of the gradient111We assume throughout that differentiation and integration can be swapped wherever necessary. with respect to based on draws from (Salimans & Knowles, 2013; Kingma & Welling, 2014),
| (5) |
2.2 Measure-preserving and ergodic maps
Variational flows are often constructed from a flexible, general-purpose parametrized family that is not specialized for any particular target distribution (Papamakarios et al., 2021); it is the job of the KL divergence minimization Equation 4 to adapt the parameter such that becomes a good approximation of the target . However, there are certain functions—in particular, those that are both measure-preserving and ergodic for —that naturally provide a means to approximate expectations of interest under without the need for tuning. Intuitively, a measure-preserving map will not change the distribution of draws from : if , then . And an ergodic map , when applied repeatedly, will not get “stuck” in a subset of unless it has probability either 0 or 1 under . The precise definitions are given in Definitions 2.1 and 2.2.
Definition 2.1 (Measure-preserving map (Eisner et al., 2015, pp. 73, 105)).
is measure-preserving for if , where is the pushforward measure given by for each measurable set .
Definition 2.2 (Ergodic map (Eisner et al., 2015, pp. 73, 105)).
is ergodic for if for all measurable sets , implies that .
If a map satisfies both Definitions 2.1 and 2.2, then long-run averages resulting from repeated applications of will converge to expectations under , as shown by Theorem 2.3. When is compact, this result shows that the discrete measure converges weakly to (Dajani & Dirksin, 2008, Theorem 6.1.7).
Theorem 2.3 (Ergodic Theorem [Birkhoff, 1931; Eisner et al., 2015, p. 212]).
Suppose is measure-preserving and ergodic for , and . Then
| (6) |
Based on this result, one might reasonably consider building a measure-preserving variational flow, i.e., where . However, it is straightforward to show that measure-preserving bijections do not decrease the KL divergence (or any other -divergence, e.g., total variation and Hellinger (Qiao & Minematsu, 2010, Theorem 1)):
| (7) |
3 Mixed variational flows (MixFlows)
In this section, we develop a general family of mixed variational flows (MixFlows) as well as algorithms for tractable i.i.d. sampling, density evaluation, and ELBO estimation. MixFlows consist of a mixture of normalizing flows obtained via repeated application of a pushforward map. This section introduces general MixFlows; later in Sections 4 and 5 we will provide convergence guarantees and examples based on Hamiltonian dynamics.
3.1 Variational family
Define a reference distribution on for which i.i.d. sampling and density evaluation is tractable, and a collection of measurable functions parametrized by . Then the MixFlow family generated by and is
| (8) |
where denotes the pushforward of the distribution under repeated applications of .
3.2 Density evaluation and sampling
If is a diffeomorphism with Jacobian , we can express the density of by using a transformation of variables formula on each component in the mixture:
| (9) |
This density can be computed efficiently using evaluations of and each (Algorithm 2). For sampling, we can obtain an independent draw by treating as a mixture of distributions:
| (10) |
The procedure is given in Algorithm 1. On average, this computation requires applications of , and at most it requires applications. However, one often takes samples from to estimate the expectation of some test function . In this case, one can use all intermediate states over a single pass of a trajectory rather than individual i.i.d. draws. In particular, we obtain an unbiased estimate of via
| (11) |
We refer to this estimate as the trajectory-averaged estimate of . The trajectory-averaged estimate of is preferred over the naïve estimate based on a single draw , as its cost is of the same order ( applications of ) and its variance is bounded above by that of the naïve estimate , as shown in Proposition 3.1. See Section E.2, and Figure 6 in particular, for empirical verification of Proposition 3.1.
Proposition 3.1.
| (12) |
3.3 ELBO estimation
We can minimize the KL divergence from to by maximizing the ELBO (Blei et al., 2017), given by
| (13) | ||||
| (14) |
The trajectory-averaged ELBO estimate is thus
| (15) |
The naïve method to compute this estimate—sampling and then computing the log density ratio for each term—requires computation because each evaluation of is . Algorithm 3 provides an efficient way of computing in operations, which is on par with taking a single draw from or evaluating once. The key insight in Algorithm 3 is that we can evaluate the collection of values incrementally, starting from and iteratively computing each for increasing in constant time. Specifically, in practice one computes with a complexity of and iteratively updates and the Jacobian for . Each update requires only constant cost if one precomputes and stores and . This then implies that Algorithm 3 requires memory; Algorithm 5 in Appendix B provides a slightly more complicated time, memory implementation of Equation 15.
4 Guarantees for MixFlows
In this section, we show that when is measure-preserving and ergodic for —or approximately so—MixFlows come with convergence guarantees and bounds on their approximation error as a function of flow length. Proofs for all results may be found in Appendix A.
4.1 Ergodic MixFlows
Ergodic MixFlow families are those where , is measure-preserving and ergodic for . In this setting, Theorems 4.1 and 4.2 show that MixFlows converge to the target weakly and in total variation as regardless of the choice of (i.e., regardless of parameter tuning effort). Thus, ergodic MixFlow families provide the same compelling convergence result as MCMC, but with the added benefit of unbiased ELBO estimates. We first demonstrate setwise and weak convergence. Recall that a sequence of distributions converges weakly to if for all bounded, continuous , , and converges setwise to if for all measurable , .
Theorem 4.1.
Suppose and is measure-preserving and ergodic for . Then converges both setwise and weakly to as .
Using Theorem 4.1 as a stepping stone, we can obtain convergence in total variation. Recall that a sequence of distributions converges in total variation to if as . Note that similar nonasymptotic results exist for the ergodic average law of Markov chains (Roberts & Rosenthal, 1997), but as previously mentioned, these results do not apply to deterministic Markov kernels.
Theorem 4.2.
Suppose and is measure-preserving and ergodic for . Then converges in total variation to as .
4.2 Approximated MixFlows
In practice, it is rare to be able to evaluate a measure-preserving map exactly; but approximations are commonly available. For example, in Section 5 we will create a measure-preserving map using Hamiltonian dynamics, and then approximate that map with a discretized leapfrog integrator. We therefore need to extend the result in Section 4.1 to apply to approximated maps.
Suppose we have two maps, and , with corresponding MixFlow families and (suppressing for brevity). Theorem 4.3 shows that the error of the MixFlow family reflects an accumulation of the difference between the pushforward of each under and .
Theorem 4.3.
Suppose is a bijection. Then
| (16) |
Suppose is measure-preserving and ergodic for and . Then Theorem 4.2 implies that , and for the second term, we (very loosely) expect that for large . Therefore, the second term should behave like , i.e., increase linearly in proportional to how “non-measure-preserving” is. This presents a trade-off between flow length and approximation quality: better approximations enable longer flows and lower minimal error bounds. Our empirical findings in Section 6 generally confirm this behavior. Corollary 4.4 further provides a more explicit characterization of this trade-off when and its log-Jacobian are uniformly close to their exact counterparts and , and and are uniformly (over ) Lipschitz continuous. The latter assumption is reasonable in practical settings where we observe that the log-density of closely approximates (see the experimental results in Section 6).
Corollary 4.4.
Suppose that for all ,
| (17) |
for all , and are -Lipschitz continuous, and that are diffeomorphisms. Then
| (18) |
This result states that the overall map-approximation error is when is small. Theorem 1 of Butzer & Westphal (1971) also suggests that in many cases, which hints that the bound should decrease roughly until , with error bound . We leave a more careful investigation of this trade-off for future work.
4.3 Discussion
Our main convergence results (Theorems 4.1 and 4.2) require that dominates the reference , and that is both measure-preserving and ergodic. It is often straightforward to design a dominated reference . Designing a measure-preserving map with an implementable approximation is also often feasible. However, verifying the ergodicity of conclusively is typically a very challenging task. As a consequence, most past work involving measure-preserving transformations just asserts the ergodic hypothesis without proof; see the discussions in ver Steeg & Galstyan (2021, p. 4) and Tupper (2005, p. 2-3).
But because MixFlows provide the ability to estimate the Kullback-Leibler divergence up to a constant, it is not critical to prove convergence a priori (as it is in the case of MCMC, for example). Instead, we suggest using the results of Theorems 4.1, 4.2, 4.3 and 4.4 as a guiding recipe for constructing principled variational families. First, start by designing a family of measure-preserving maps , . Next, approximate with some tractable including a tunable fidelity parameter , such as that , becomes closer to . Finally, build a MixFlow from , and tune both and by maximizing the ELBO. We follow this recipe in Section 5 and verify it empirically in Section 6.
5 Uncorrected Hamiltonian MixFlows
In this section, we provide an example of how to design a MixFlow by starting from an exactly measure-preserving map and then creating a tunable approximation to it. The construction is inspired by Hamiltonian Monte Carlo (HMC) (Neal, 2011, 1996), in which each iteration involves simulating Hamiltonian dynamics followed by a stochastic momentum refreshment; our method replaces the stochastic refreshment with a deterministic transformation. In particular, consider the augmented target density on ,
| (19) |
with auxiliary variables , , and some almost-everywhere differentiable univariate probability density . The -marginal distribution of is the original target distribution .
5.1 Measure-preserving map via Hamiltonian dynamics
We construct by composing the following three steps, which are all measure-preserving for :
(1) Hamiltonian dynamics
We first apply
| (20) |
where is the map of Hamiltonian dynamics with position and momentum simulated for a time interval of length ,
| (21) |
One can show that this preserves density (and hence is measure preserving) and is also unit Jacobian (Neal, 2011).
(2) Pseudotime shift
Second, we apply a constant shift to the pseudotime variable ,
| (22) |
where is a fixed irrational number (say, ). As this is a constant shift, it is unit Jacobian and density-preserving (and hence measure-preserving). The component will act as a notion of “time” of the flow, and ensures that the refreshment of in step (3) below will take a different form even if visits the same location again.
(3) Momentum refreshment
Finally, we refresh each of the momentum variables via
| (23) |
where is the cumulative distribution function (CDF) of density , and is any differentiable function; this generalizes the map from Neal (2012); Murray & Elliott (2012) to enable the shift to depend on the state and pseudotime . This step (3) is an attempt to replicate the independent resampling of from HMC using only deterministic maps. This map is measure-preserving as it involves mapping the momentum to a random variable via the CDF, shifting by an amount that depends only on , and then mapping back using the inverse CDF. The Jacobian is the momentum density ratio .
5.2 Approximation via uncorrected leapfrog integration
In practice, we cannot simulate the dynamics in step (1) perfectly. Instead, we approximate the dynamics in Equation 21 by running steps of the leapfrog method, where each leapfrog map involves interleaving three discrete transformations with step size ,
| (24) |
Denote the map to be the composition of the three steps with Hamiltonian dynamics replaced by the leapfrog integrator; Algorithm 6 in Appendix C provides the pseudocode. The final variational tuning parameters for the MixFlow are the step size —which controls how close is to being measure-preserving for —the Hamiltonian simulation length , and the flow length . In our experiments we tune the number of leapfrog steps and the step size by maximizing the ELBO. We also tune the number of refreshments to achieve a desirable computation-quality tradeoff by visually inspecting the convergence of the ELBO.
5.3 Numerical stability
Density evaluation (Algorithm 2) and ELBO estimation (Algorithm 3) both involve repeated applications of and . This poses no issue in theory, but in a computer—with floating point computations—one should code the map and its inverse in a numerically precise way such that is the identity map for large . Figure 8 in Section E.2 displays the severity of the numerical error when and are not carefully implemented. In practice, we check the stability limits of our flow by taking draws from and evaluating followed by (and vice versa) for increasing until we cannot reliably invert the flow. See Figure 7 in the appendix for an example usage of this diagnostic. Note that for sample generation specifically (Algorithm 1), numerical stability is not a concern as it only requires forward evaluation of the map .
6 Experiments








In this section, we demonstrate the performance of our method (MixFlow) on 7 synthetic targets and 7 real data targets. See Appendix E for the details of each target. Both our synthetic and real data examples are designed to cover a range of challenging features such as heavy tails, high dimensions, multimodality, and weak identifiability. We compare posterior approximation quality to several black-box normalizing flow methods (NF): PlanarFlow, RadialFlow, and RealNVP with various architectures (Papamakarios et al., 2021). To make the methods comparable via the ELBO, we train all NFs on the same joint space as MixFlow. We also compare the marginal sample quality of MixFlow against samples from NUTS and NFs. Finally, we compare sampling time with all competitors, and effective sample size (ESS) per second with HMC. For all experiments, we use the standard Laplace distribution as the momentum distribution due to its numerical stability (see Figure 7 in Appendix E). Additional comparisons to variational inference based on uncorrected Hamiltonian annealing (UHA) (Geffner & Domke, 2021) and nonequilibrium orbit sampling (NEO) (Thin et al., 2021a, Algorithm 2) may be found in Appendix E. All experiments were conducted on a machine with an AMD Ryzen 9 3900X and 32GB of RAM. Code is available at https://github.com/zuhengxu/Ergodic-variational-flow-code.
6.1 Qualitative assessment
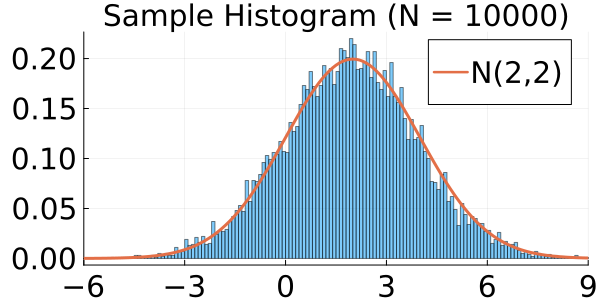
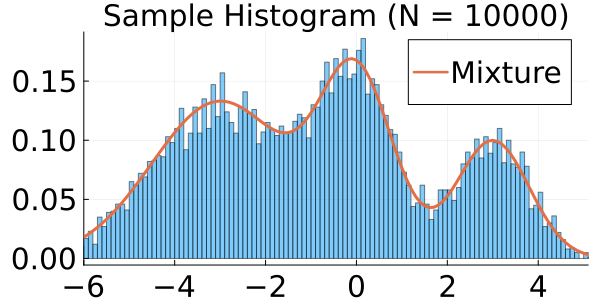
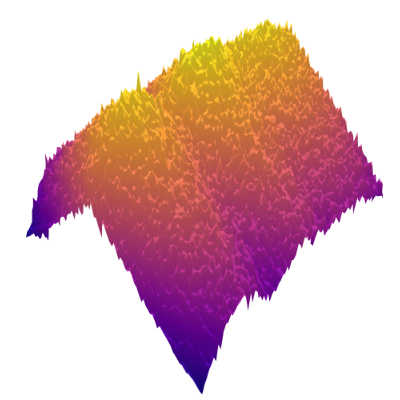
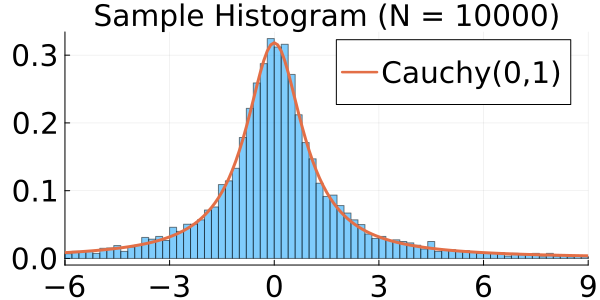
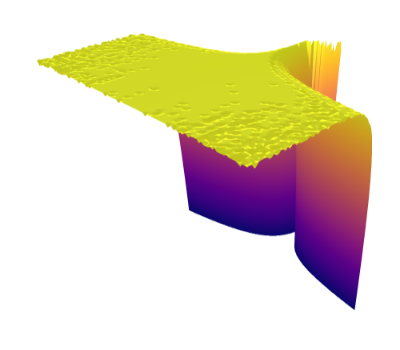
We begin with a qualitative examination of the i.i.d. samples and the approximated targets produced by MixFlow initialized at for three one-dimensional synthetic distributions: a Gaussian, a mixture of Gaussians, and the standard Cauchy. We excluded the pseudotime variable here in order to visualize the full joint density of in 2 dimensions. More details can be found in Section E.1. Figures 1(a), 1(b) and 1(c) show histograms of i.i.d. -marginal samples generated by MixFlow for each of the three targets, which nearly perfectly match the true target marginals. Figures 1(a), 1(b) and 1(c) also show that is generally a good approximation of the log target density.
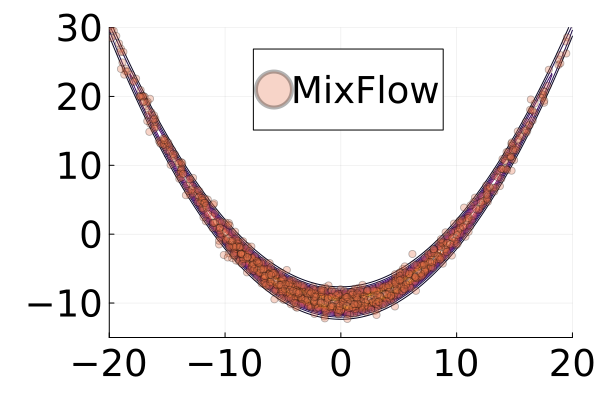
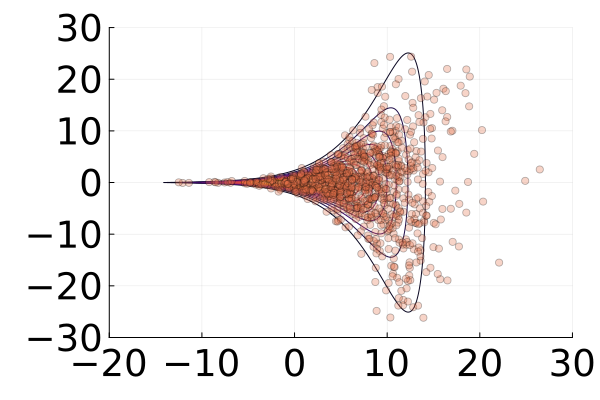
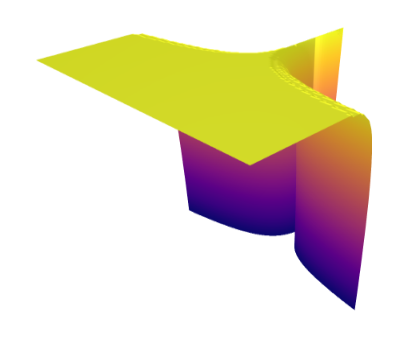
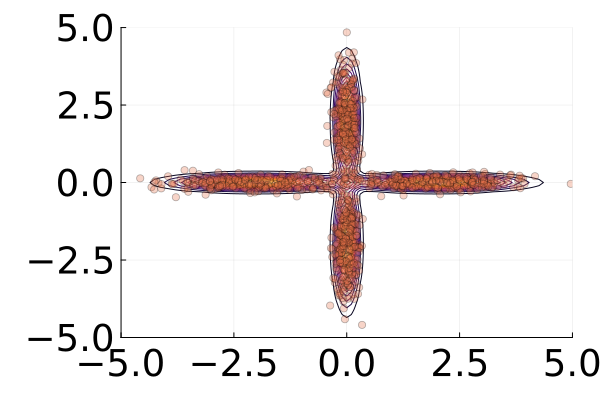
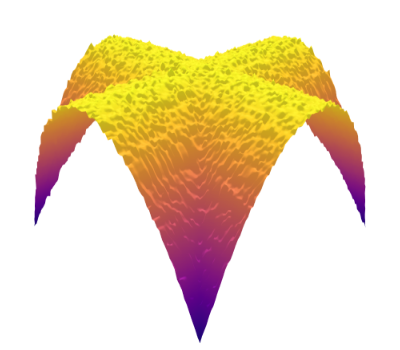
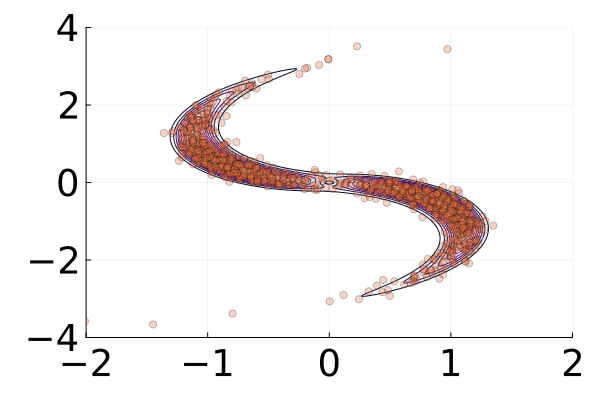
We then present similar visualizations on four more challenging synthetic target distributions: the banana (Haario et al., 2001), Neal’s funnel (Neal, 2003), a cross-shaped Gaussian mixture, and a warped Gaussian. All four examples have a 2-dimensional state , and hence . In each example we set the initial distribution to be the mean-field Gaussian approximation. More details can be found in Section E.2. Figures 1(d), 1(e), 1(f) and 1(g) shows the scatter plots consisting of i.i.d. -marginal samples drawn from MixFlow, as well as the approximated MixFlow log density and exact log density sliced as a function of for a single value of chosen randomly via (which is required for visualization, as ). We see that, qualitatively, both the samples and approximated densities from MixFlow closely match the target. Finally, Figure 9 in Section E.2 provides a more comprehensive set of sample histograms (showing the -, -, and -marginals). These visualizations support our earlier theoretical analysis.
6.2 Posterior approximation quality
regression
regression
regression
regression
regression
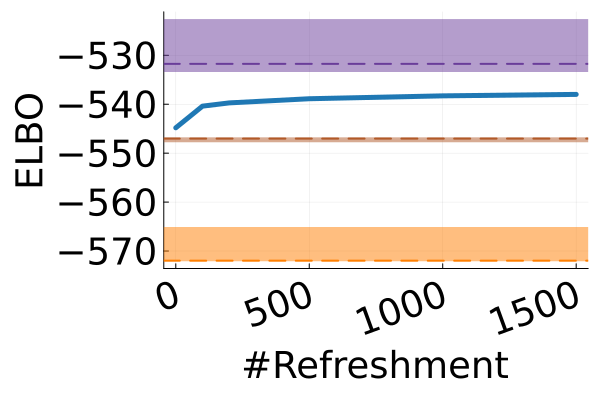
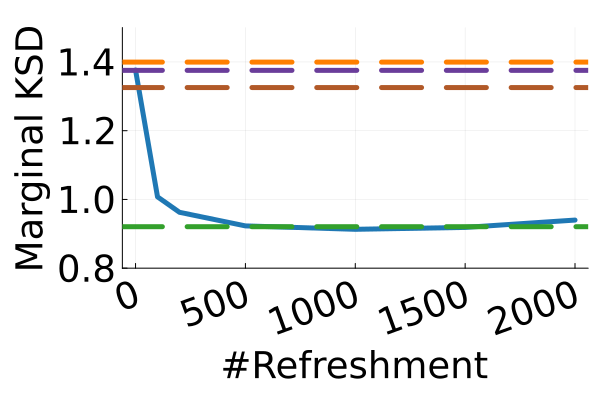
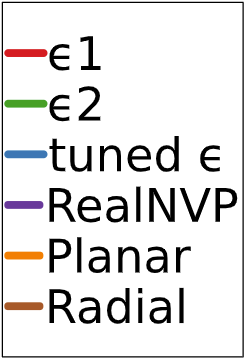
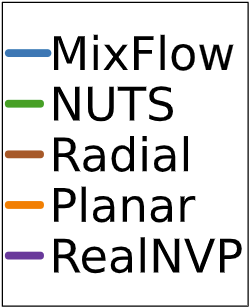
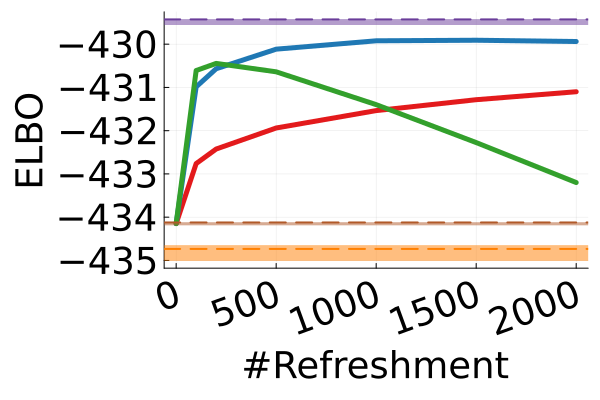
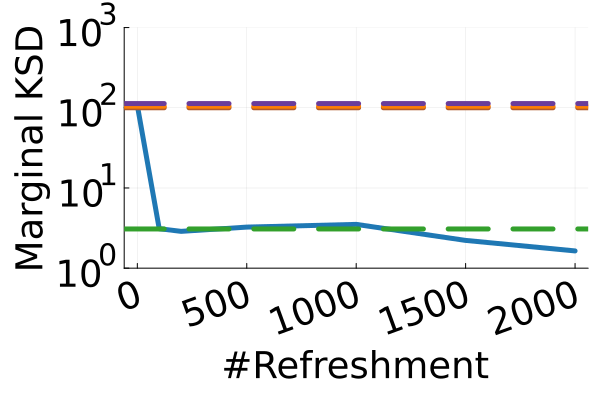
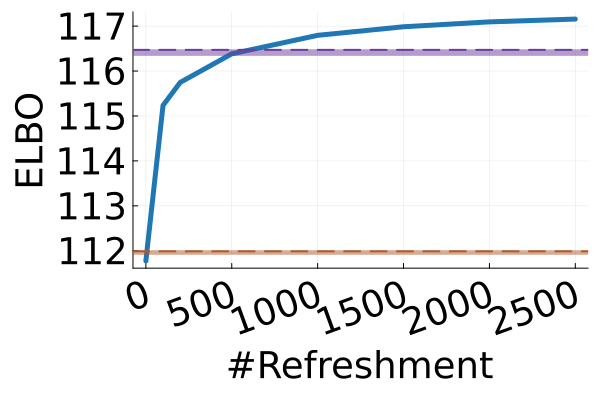
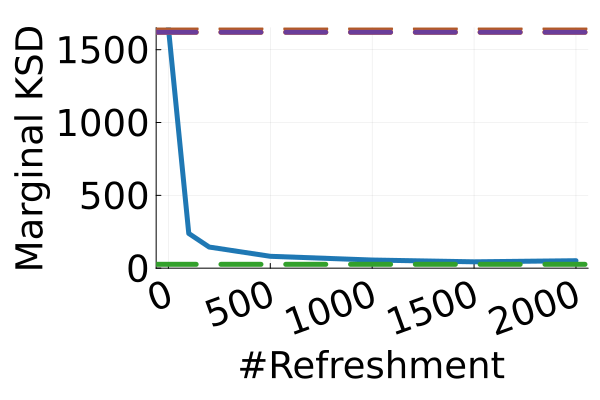
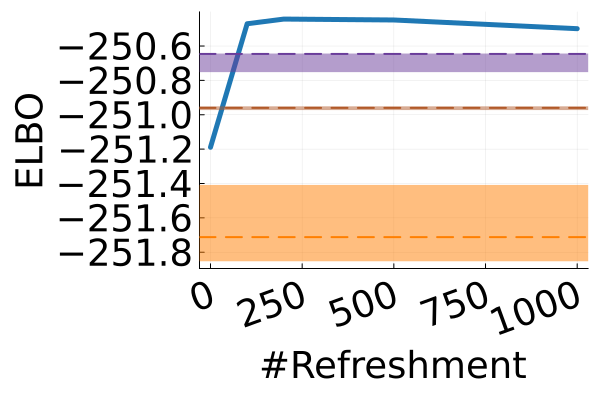
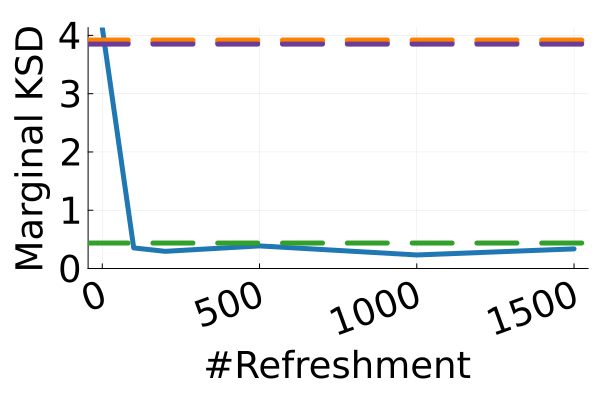
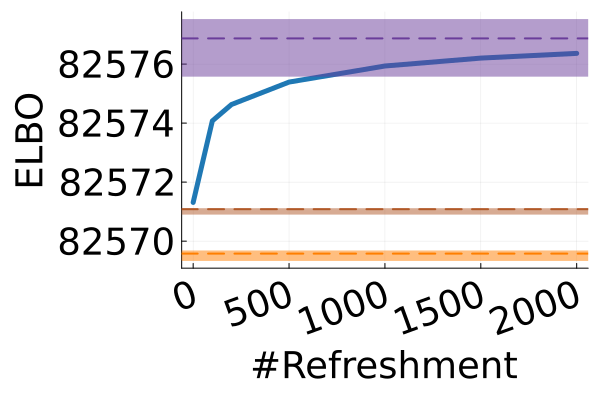
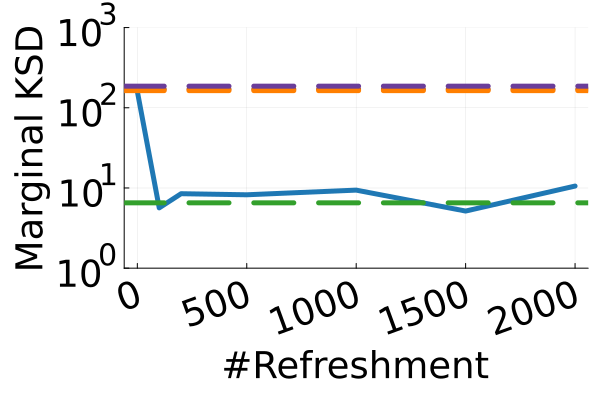
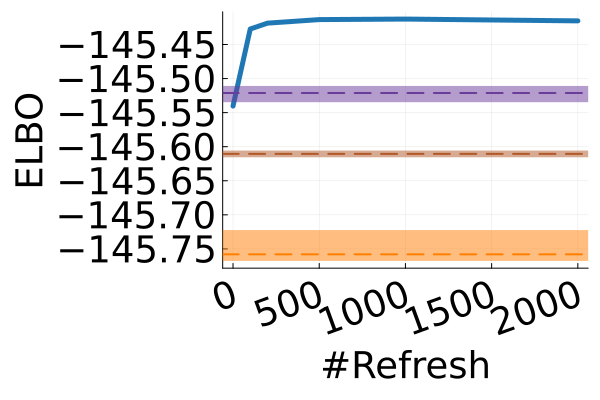
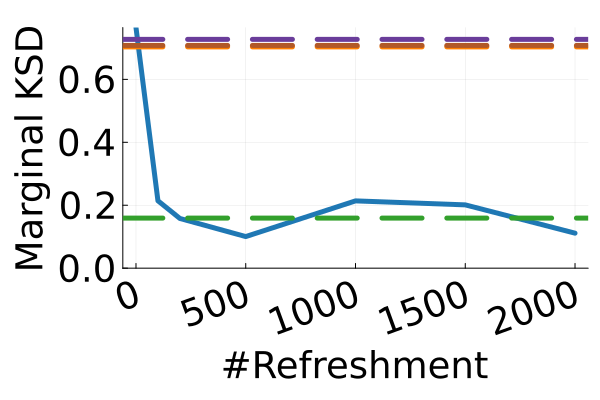
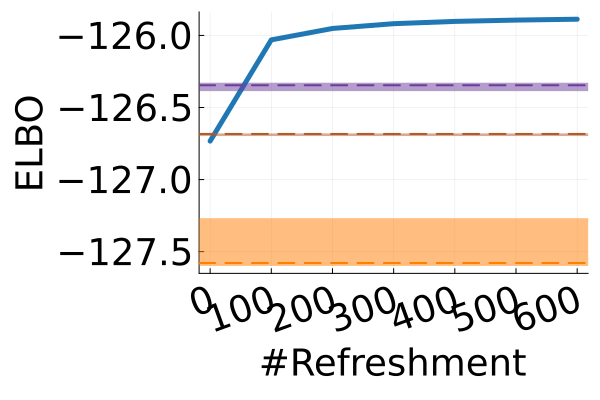
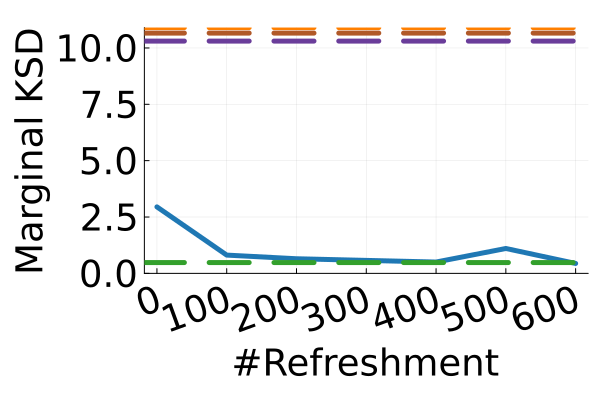
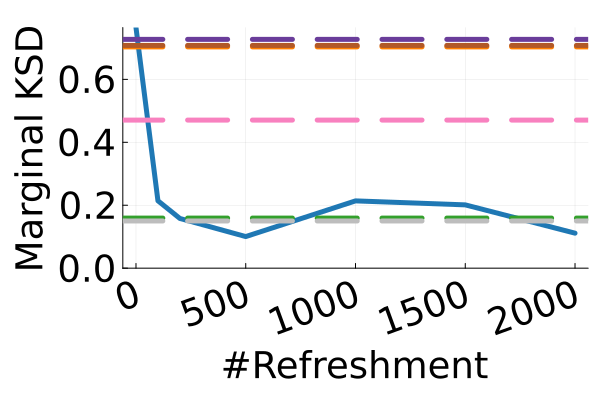
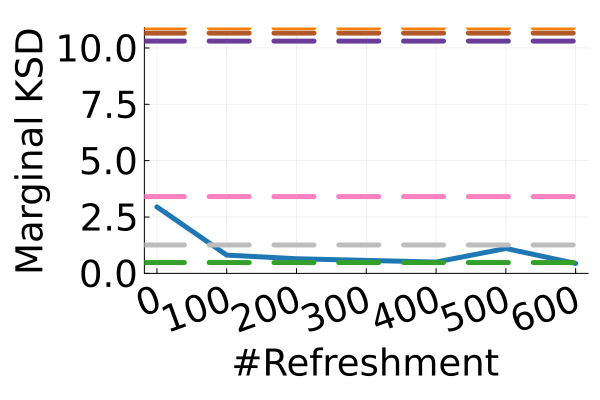
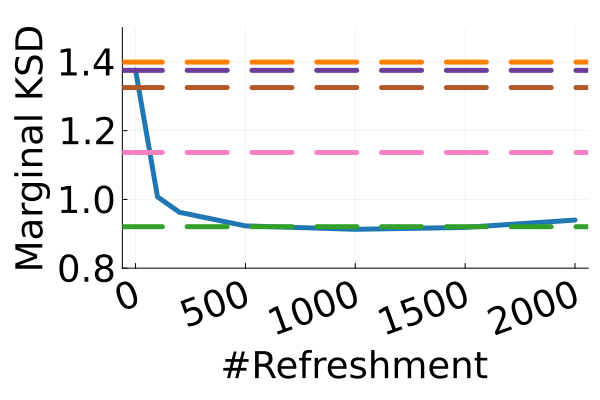
Next, we provide a quantitative comparison of MixFlow, NFs, NUTS on 7 real data experiments outlined in Section E.5. We tune each NF method under various settings (Tables 1, 2 and 3), and present the best one for each example. ELBOs of MixFlow are estimated with Algorithm 3, averaging over independent trajectories. ELBOs of NFs are based on samples. To obtain an assessment for the target marginal distribution itself (not the augmented target), we also compare methods using the kernel Stein discrepancy (KSD) with an inverse quadratic (IMQ) kernel (Gorham & Mackey, 2017). NUTS and NFs use samples for KSD estimation, while MixFlow is based on i.i.d. draws (Algorithm 1). For KSD comparisons, all variational methods are tuned by maximizing the ELBO (Figures 2 and 17).
Augmented target distribution
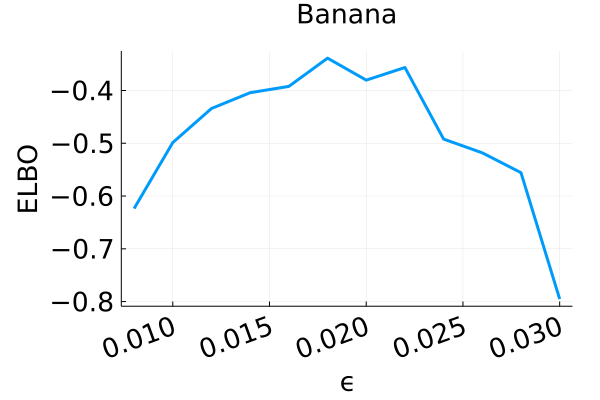
Figure 2 displays the ELBO comparison. First, Figure 2(a) shows how different step sizes and number of refreshments affects approximation quality. Overly large step sizes typically result in errors due to the use of discretized Hamiltonian dynamics, while overly small step sizes result in a flow that makes slow progress towards the target. MixFlow with a tuned step size generally shows a comparable joint ELBO value to the best NF method, yielding a competitive target approximation. Similar comparisons and assessment of the effect of step size for the synthetic examples are presented in Figures 5, 10 and 16. Note that in three examples (Figures 2(a), 2(d) and 2(g)), the tuned RealNVP ELBO exceeds MixFlow by a small amount; but this required expensive architecture search and parameter tuning, and as we will describe next, MixFlow is actually more reliable in terms of target marginal sample quality and density estimation.
Original target distribution
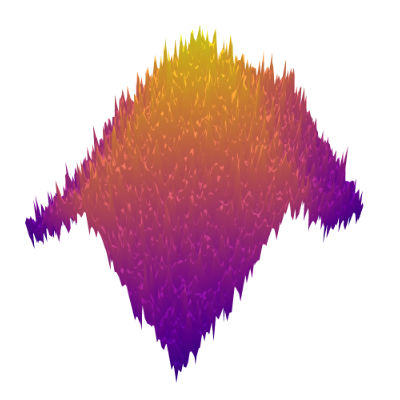
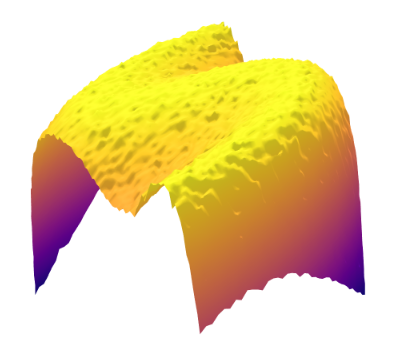
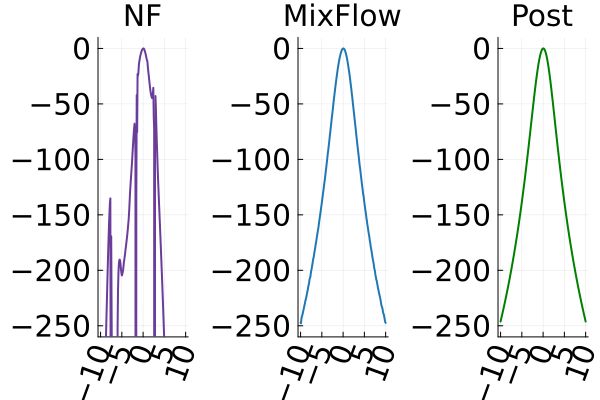
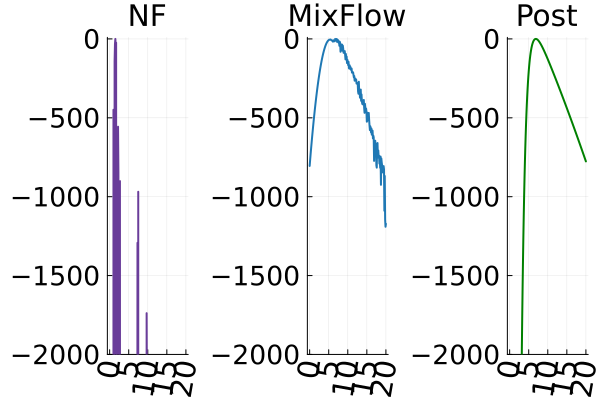
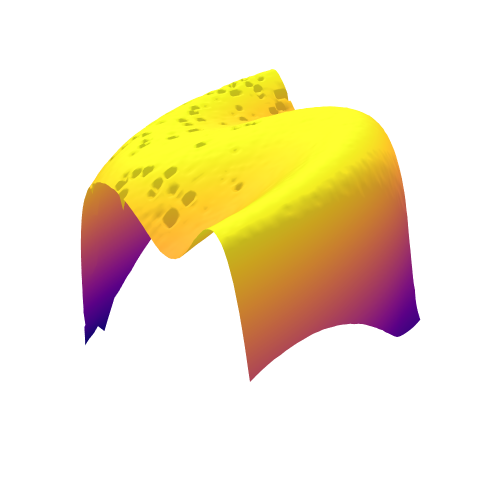
The second row of Figure 2 displays a comparison of KSD for the target distribution itself (instead of the augmented target). In particular, MixFlow produces comparable sample quality to that from NUTS—an exact MCMC method—and clearly outperforms all of the NF competitors. The scatter plots of samples in Figure 20 confirm the improvement in sample quality of MixFlow over variational competitors. Further, Figure 3 shows the (sliced) densities on two difficult real data examples: Bayesian student-t regression (with a heavy-tailed posterior), and a high-dimensional sparse regression (parameter dimension is ). This result demonstrates that the densities provided by MixFlow more closely match those of the original target distribution than those of the best NF. Notice that MixFlow accurately captures the skew and heavy tails of the exact target, while the NF density fails to do so and contains many spurious modes.
6.3 Ease of tuning
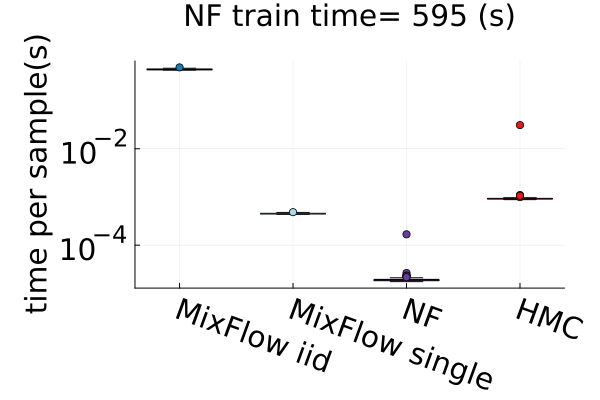
In order to tune MixFlow, we simply run a 1-dimensional parameter sweep for the step size , and use a visual inspection of the ELBO to set an appropriate number of flow steps . Tuning an NF requires optimizing its architecture, number of layers, and its (typically many) parameters. Not only is this time consuming—in our experiments, tuning took 10 minutes to roughly 1 hour (Figure 4)—but the optimization can also behave in unintuitive ways. For example, performance can be heavily dependent on the number of flow layers, and adding more layers does not necessarily improve quality. Figures 16, 1, 2 and 3 show that using more layers does not necessarily help, and slows tuning considerably. In the case of RealNVP specifically, tuning can be unstable, especially for more complex models. The optimizer often returns NaN values for flow parameters during training (see Table 1). This instability has been noted in earlier work (Dinh et al., 2017, Sec. 3.7).
6.4 Time efficiency
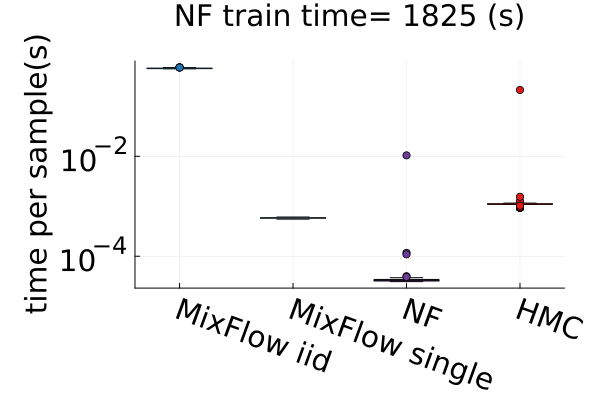
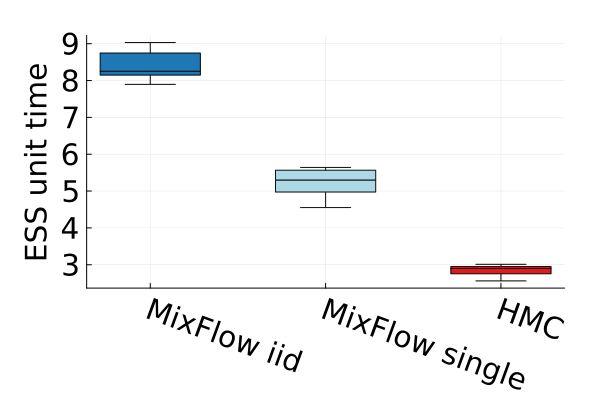
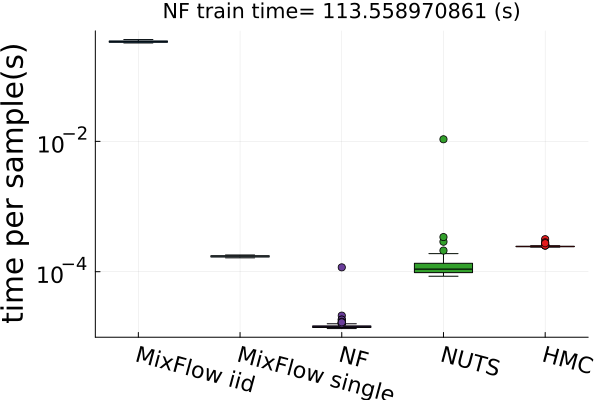
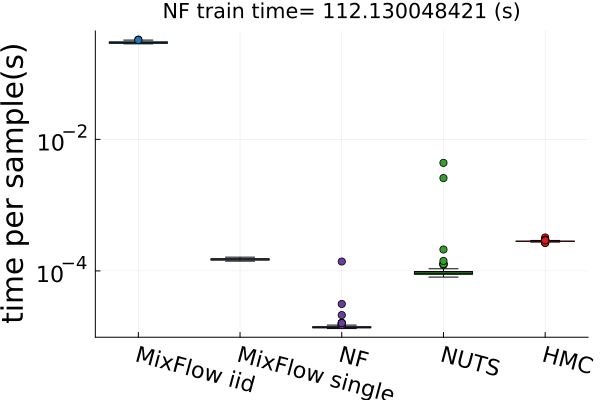
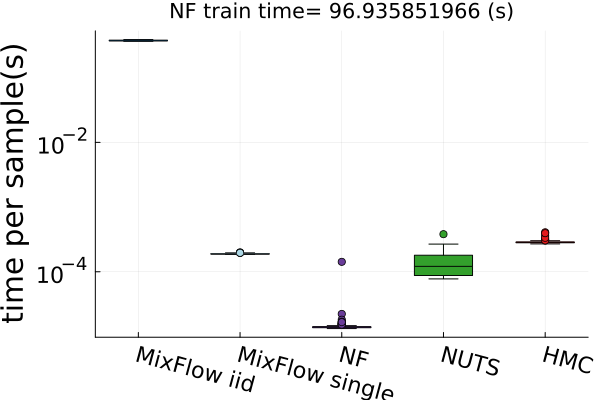
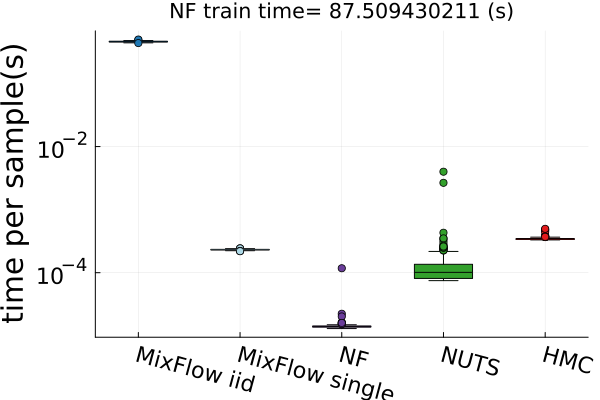
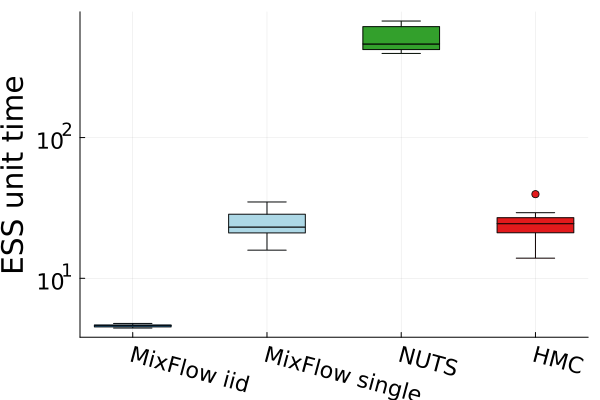
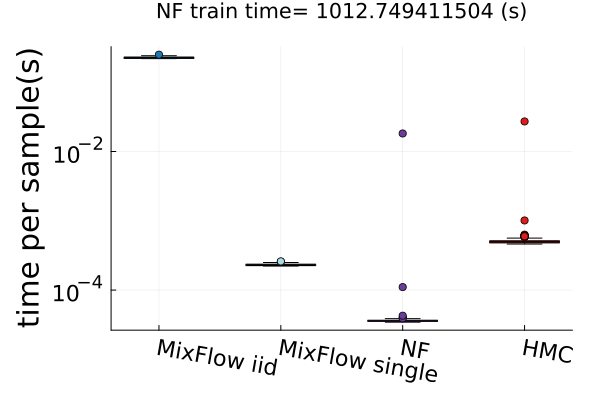
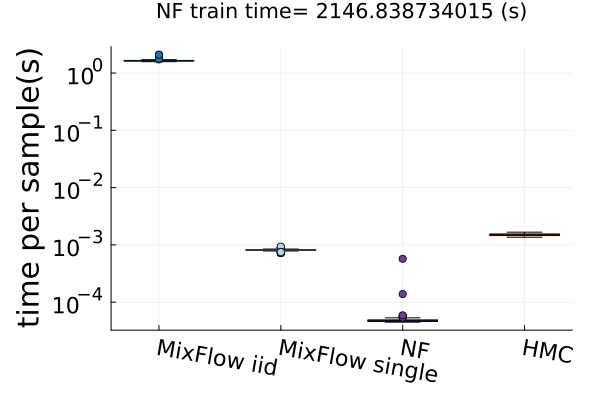
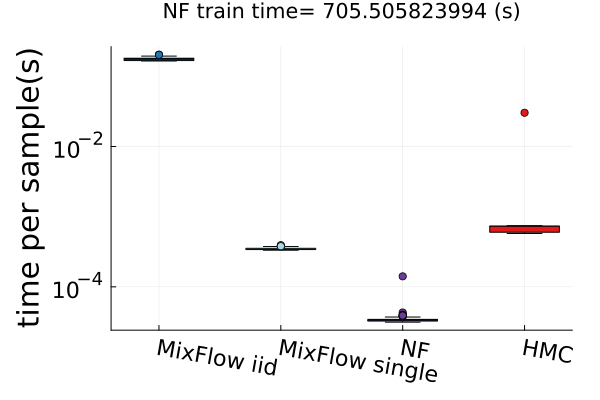
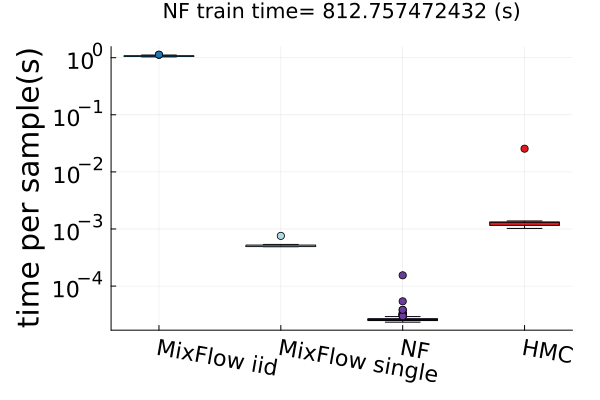
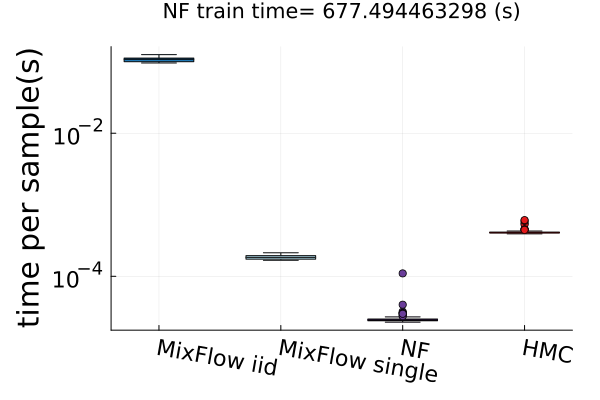
Finally, Figure 4 presents timing results for two of the real data experiments (additional comparisons in Figures 14 and 19). In this figure, we use MixFlow iid to refer to i.i.d. sampling from MixFlow, and MixFlow single to refer to collecting all intermediate states on a single trajectory. This result shows that the per sample time of MixFlow single is similar to NUTS and HMC as one would expect. MixFlow iid is the slowest because each sample is generated by passing through the entire flow. The NF generates the fastest draws, but recall that this comes at the cost of significant initial tuning time; in the time it takes NF to generate its first sample, MixFlow single has generated millions of samples in Figure 4. See Section E.4 for a detailed discussion of this trade-off.
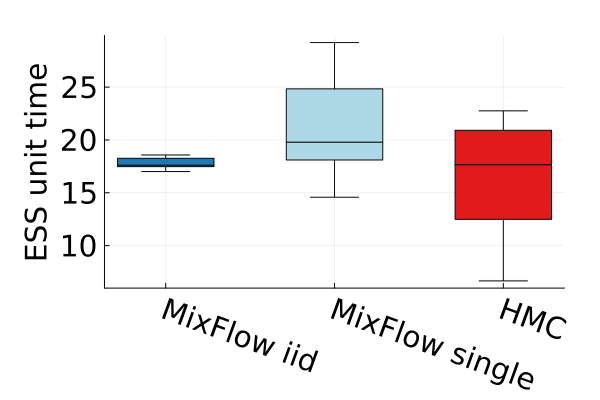
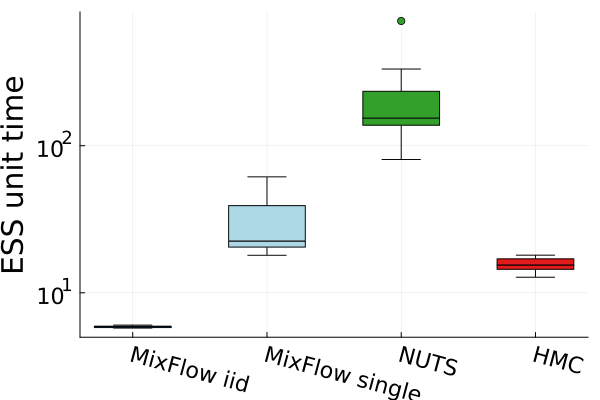
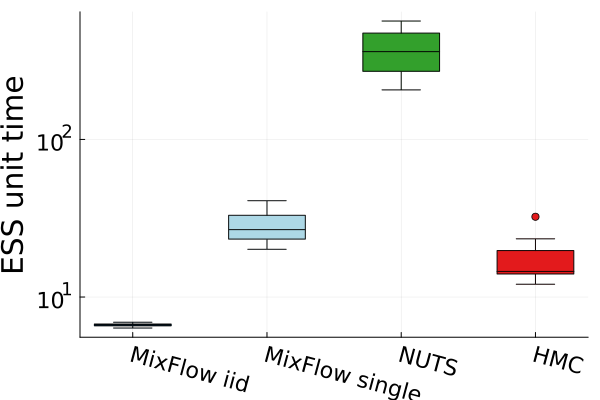
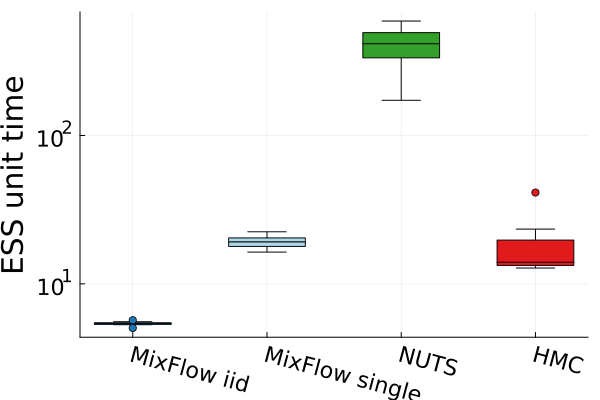
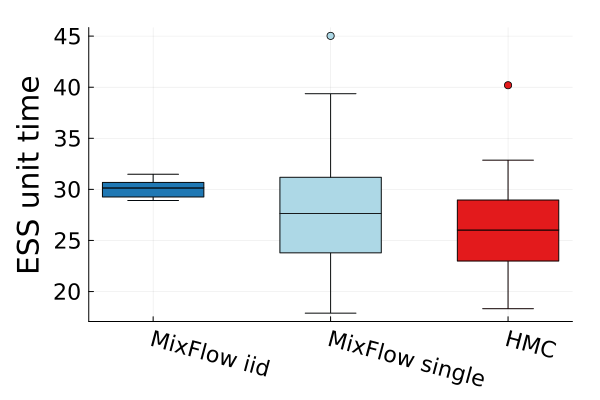
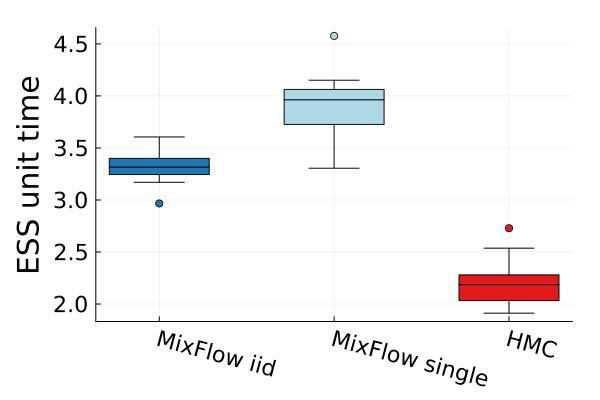
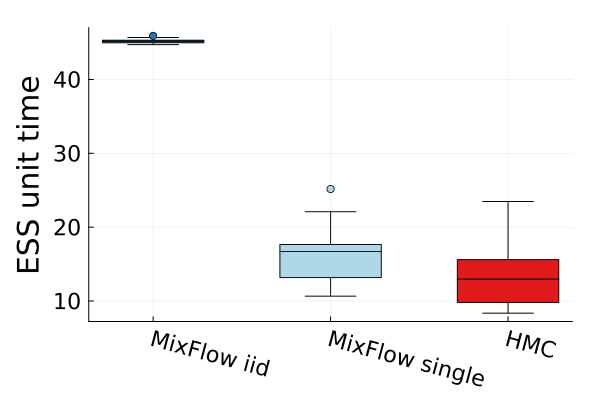
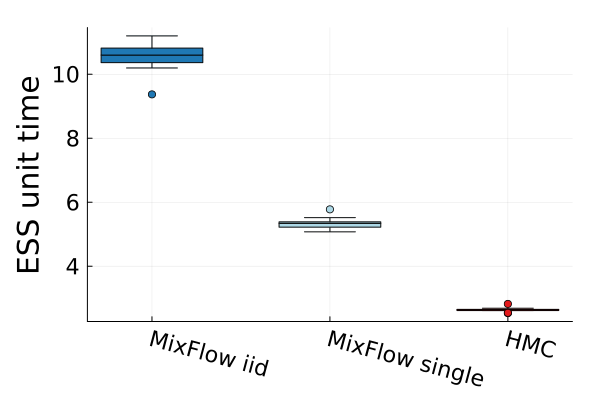
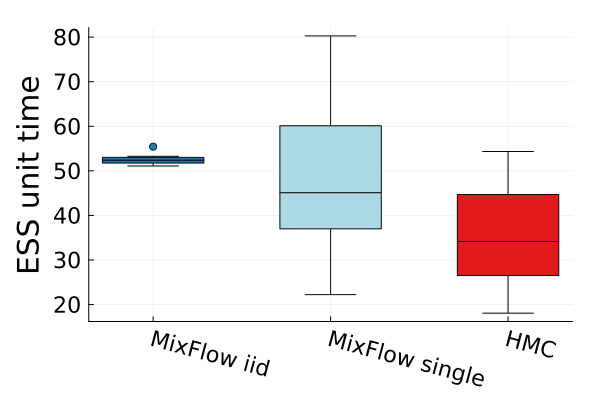
Figures 4 and 19 further show the computational efficiency in terms of ESS per second on real data examples, which reflects the autocorrelation between drawn samples. Results show that MixFlow produce comparable ESS per second to HMC. MixFlow single behaves similarly to HMC as expected since the pseudo-momentum refreshment we proposed (steps (2-3) of Section 5) resembles the momentum resample step of HMC. The ESS efficiency of MixFlow iid depends on the trade-off between a slower sampling time and i.i.d. nature of drawn samples. In these real data examples, MixFlow iid typically produces a high ESS per second; but in the synthetic examples (Figure 14(b)), MixFlow iid is similar to the others.
7 Conclusion
This work presented MixFlows, a new variational family constructed from mixtures of pushforward maps. Experiments demonstrate a comparable sample quality to NUTS and more reliable posterior approximations than standard normalizing flows. A main limitation of our methodology is numerical stability; reversing the flow for long trajectories can be unstable in practice. Future work includes developing more stable momentum refreshment schemes and extensions via involutive MCMC (Neklyudov et al., 2020; Spanbauer et al., 2020; Neklyudov & Welling, 2022).
Acknowledgements
The authors gratefully acknowledge the support of a National Sciences and Engineering Research Council of Canada (NSERC) Discovery Grant and a UBC four year doctoral fellowship.
References
- Aldous & Thorisson (1993) Aldous, D. and Thorisson, H. Shift-coupling. Stochastic Processes and their Applications, 44:1–14, 1993.
- Anastasiou et al. (2021) Anastasiou, A., Barp, A., Briol, F.-X., Ebner, B., Gaunt, R., Ghaderinezhad, F., Gorham, J., Gretton, A., Ley, C., Liu, Q., Mackey, L., Oates, C., Reinert, G., and Swan, Y. Stein’s method meets statistics: a review of some recent developments. arXiv:2105.03481, 2021.
- Birkhoff (1931) Birkhoff, G. Proof of the ergodic theorem. Proceedings of the National Academy of Sciences, 17(12):656–660, 1931.
- Blei et al. (2017) Blei, D., Kucukelbir, A., and McAuliffe, J. Variational inference: a review for statisticians. Journal of the American Statistical Association, 112(518):859–877, 2017.
- Brooks & Gelman (1998) Brooks, S. and Gelman, A. General methods for monitoring convergence of iterative simulations. Journal of Computational and Graphical Statistics, 7(4):434–455, 1998.
- Butzer & Westphal (1971) Butzer, P. and Westphal, U. The mean ergodic theorem and saturation. Indiana University Mathematics Journal, 20(12):1163–1174, 1971.
- Campbell & Li (2019) Campbell, T. and Li, X. Universal boosting variational inference. In Advances in Neural Information Processing Systems, 2019.
- Carpenter et al. (2017) Carpenter, B., Gelman, A., Hoffman, M., Lee, D., Goodrich, B., Betancourt, M., Brubaker, M., Guo, J., Li, P., and Riddell, A. Stan: A probabilistic programming language. Journal of Statistical Software, 76(1), 2017.
- Caterini et al. (2018) Caterini, A., Doucet, A., and Sejdinovic, D. Hamiltonian variational auto-encoder. In Advances in Neural Information Processing Systems, 2018.
- Chen et al. (2022) Chen, N., Xu, Z., and Campbell, T. Bayesian inference via sparse Hamiltonian flows. In Advances in Neural Information Processing Systems, 2022.
- Chérief-Abdellatif & Alquier (2018) Chérief-Abdellatif, B.-E. and Alquier, P. Consistency of variational Bayes inference for estimation and model selection in mixtures. Electronic Journal of Statistics, 12(2):2995–3035, 2018.
- Chwialkowski et al. (2016) Chwialkowski, K., Strathmann, H., and Gretton, A. A kernel test of goodness of fit. In International Conference on Machine Learning, 2016.
- Constantinopoulos et al. (2006) Constantinopoulos, C., Titsias, M., and Likas, A. Bayesian feature and model selection for Gaussian mixture models. IEEE Transactions on Pattern Analysis and Machine Intelligence, 28(6):1013–1018, 2006.
- Corduneau & Bishop (2001) Corduneau, A. and Bishop, C. Variational Bayesian model selection for mixture distributions. In Artificial Intelligence and Statistics, 2001.
- Cowles & Carlin (1996) Cowles, M. K. and Carlin, B. Markov chain Monte Carlo convergence diagnostics: a comparative review. Journal of the American Statistical Association, 91(434):883–904, 1996.
- Dajani & Dirksin (2008) Dajani, K. and Dirksin, S. A simple introduction to ergodic theory, 2008. URL: https://webspace.science.uu.nl/ kraai101/lecturenotes2009.pdf.
- Dinh et al. (2017) Dinh, L., Sohl-Dickstein, J., and Bengio, S. Density estimation using Real NVP. In International Conference on Learning Representations, 2017.
- Eisner et al. (2015) Eisner, T., Farkas, B., Haase, M., and Nagel, R. Operator Theoretic Aspects of Ergodic Theory. Graduate Texts in Mathematics. Springer, 2015.
- Fjelde et al. (2020) Fjelde, T. E., Xu, K., Tarek, M., Yalburgi, S., and Ge, H. Bijectors.jl: Flexible transformations for probability distributions. In Symposium on Advances in Approximate Bayesian Inference, pp. 1–17, 2020.
- Geffner & Domke (2021) Geffner, T. and Domke, J. MCMC variational inference via uncorrected Hamiltonian annealing. In Advances in Neural Information Processing Systems, 2021.
- Gelman & Rubin (1992) Gelman, A. and Rubin, D. Inference from iterative simulation using multiple sequences. Statistical Science, 7(4):457–472, 1992.
- Gelman et al. (2013) Gelman, A., Carlin, J., Stern, H., Dunson, D., Vehtari, A., and Rubin, D. Bayesian data analysis. CRC Press, 3rd edition, 2013.
- Gershman et al. (2012) Gershman, S., Hoffman, M., and Blei, D. Nonparametric variational inference. In International Conference on Machine Learning, 2012.
- Geweke (1992) Geweke, J. Evaluating the accuracy of sampling-based approaches to the calculation of posterior moments. In Bernardo, J. M., Berger, J. O., and Dawid, A. P. (eds.), Bayesian Statistics, volume 4, pp. 169–193, 1992.
- Gong et al. (2021) Gong, W., Li, Y., and Hernández-Lobato, J. M. Sliced kernelized Stein discrepancy. In International Conference on Learning Representations, 2021.
- Gorham & Mackey (2015) Gorham, J. and Mackey, L. Measuring sample quality with Stein’s method. In Advances in Neural Information Processing Systems, 2015.
- Gorham & Mackey (2017) Gorham, J. and Mackey, L. Measuring sample quality with kernels. In International Conference on Machine Learning, 2017.
- Guo et al. (2016) Guo, F., Wang, X., Fan, K., Broderick, T., and Dunson, D. Boosting variational inference. In Advances in Neural Information Processing Systems, 2016.
- Haario et al. (2001) Haario, H., Saksman, E., and Tamminen, J. An adaptive Metropolis algorithm. Bernoulli, pp. 223–242, 2001.
- Hamidieh (2018) Hamidieh, K. A data-driven statistical model for predicting the critical temperature of a superconductor. Computational Materials Science, 154:346–354, 2018.
- Harrison Jr. & Rubinfeld (1978) Harrison Jr., D. and Rubinfeld, D. Hedonic housing prices and the demand for clean air. Journal of Environmental Economics and Management, 5(1):81–102, 1978.
- Hoffman & Gelman (2014) Hoffman, M. and Gelman, A. The No-U-Turn Sampler: adaptively setting path lengths in Hamiltonian Monte Carlo. Journal of Machine Learning Research, 15(1):1593–1623, 2014.
- Hoffman et al. (2013) Hoffman, M. D., Blei, D. M., Wang, C., and Paisley, J. Stochastic variational inference. Journal of Machine Learning Research, 14:1303–1347, 2013.
- Huggins & Mackey (2018) Huggins, J. and Mackey, L. Random feature Stein discrepancies. In Advances in Neural Information Processing Systems, 2018.
- Jaakkola & Jordan (1998) Jaakkola, T. and Jordan, M. Improving the mean field approximation via the use of mixture distributions. In Learning in graphical models, pp. 163–173. Springer, 1998.
- Jankowiak & Phan (2021) Jankowiak, M. and Phan, D. Surrogate likelihoods for variational annealed importance sampling. arXiv:2112.12194, 2021.
- Jordan et al. (1999) Jordan, M., Ghahramani, Z., Jaakkola, T., and Saul, L. An introduction to variational methods for graphical models. Machine Learning, 37:183–233, 1999.
- Kakutani (1938) Kakutani, S. Iteration of linear operations in complex Banach spaces. Proceedings of the Imperial Academy, 14(8):295–300, 1938.
- Kingma & Welling (2014) Kingma, D. and Welling, M. Auto-encoding variational Bayes. In International Conference on Learning Representations, 2014.
- Kobyzev et al. (2021) Kobyzev, I., Prince, S., and Brubaker, M. Normalizing flows: an introduction and review of current methods. IEEE Transactions on Pattern Analysis and Machine Intelligence, 43(11):3964–3979, 2021.
- Kullback & Leibler (1951) Kullback, S. and Leibler, R. On information and sufficiency. The Annals of Mathematical Statistics, 22(1):79–86, 1951.
- Liu & Rubin (1995) Liu, C. and Rubin, D. ML estimation of the t distribution using EM and its extensions, ECM and ECME. Statistica Sinica, pp. 19–39, 1995.
- Liu et al. (2016) Liu, Q., Lee, J., and Jordan, M. A kernelized Stein discrepancy for goodness-of-fit tests and model evaluation. In International Conference on Machine Learning, 2016.
- Locatello et al. (2018a) Locatello, F., Dresdner, G., Khanna, R., Valera, I., and Rätsch, G. Boosting black box variational inference. In Advances in Neural Information Processing Systems, 2018a.
- Locatello et al. (2018b) Locatello, F., Khanna, R., Ghosh, J., and Rätsch, G. Boosting variational inference: an optimization perspective. In International Conference on Artificial Intelligence and Statistics, 2018b.
- Masa-aki (2001) Masa-aki, S. Online model selection based on the variational Bayes. Neural Computation, 13(7):1649–1681, 2001.
- Miller et al. (2017) Miller, A., Foti, N., and Adams, R. Variational boosting: iteratively refining posterior approximations. In International Conference on Machine Learning, 2017.
- Moro et al. (2014) Moro, S., Cortez, P., and Rita, P. A data-driven approach to predict the success of bank telemarketing. Decision Support Systems, 62:22–31, 2014.
- Murray & Elliott (2012) Murray, I. and Elliott, L. Driving Markov chain Monte Carlo with a dependent random stream. arXiv:1204.3187, 2012.
- Neal (1996) Neal, R. Bayesian Learning for Neural Networks. Lecture Notes in Statistics, No. 118. Springer-Verlag, 1996.
- Neal (2003) Neal, R. Slice sampling. The Annals of Statistics, 31(3):705–767, 2003.
- Neal (2005) Neal, R. Hamiltonian importance sampling. Banff International Research Station (BIRS) Workshop on Mathematical Issues in Molecular Dynamics, 2005.
- Neal (2011) Neal, R. MCMC using Hamiltonian dynamics. In Brooks, S., Gelman, A., Jones, G., and Meng, X.-L. (eds.), Handbook of Markov chain Monte Carlo, chapter 5. CRC Press, 2011.
- Neal (2012) Neal, R. How to view an MCMC simulation as permutation, with applications to parallel simulation and improved importance sampling. arXiv:1205.0070, 2012.
- Neklyudov & Welling (2022) Neklyudov, K. and Welling, M. Orbital MCMC. In Artificial Intelligence and Statistics, 2022.
- Neklyudov et al. (2020) Neklyudov, K., Welling, M., Egorov, E., and Vetrov, D. Involutive MCMC: a unifying framework. In International Conference on Machine Learning, 2020.
- Neklyudov et al. (2021) Neklyudov, K., Bondesan, R., and Welling, M. Deterministic gibbs sampling via ordinary differential equations. arXiv:2106.10188, 2021.
- Ormerod et al. (2017) Ormerod, J., You, C., and Müller, S. A variational Bayes approach to variable selection. Electronic Journal of Statistics, 11(2):3549–3594, 2017.
- Papamakarios et al. (2021) Papamakarios, G., Nalisnick, E., Rezende, D. J., Mohamed, S., and Lakshminarayanan, B. Normalizing flows for probabilistic modeling and inference. Journal of Machine Learning Research, 22:1–64, 2021.
- Qiao & Minematsu (2010) Qiao, Y. and Minematsu, N. A study on invariance of -divergence and its application to speech recognition. IEEE Transactions on Signal Processing, 58(7):3884–3890, 2010.
- Ranganath et al. (2014) Ranganath, R., Gerrish, S., and Blei, D. Black box variational inference. In International Conference on Artificial Intelligence and Statistics, 2014.
- Ranganath et al. (2016) Ranganath, R., Tran, D., and Blei, D. Hierarchical variational models. In International Conference on Machine Learning, 2016.
- Rezende & Mohamed (2015a) Rezende, D. and Mohamed, S. Variational inference with normalizing flows. In International Conference on Machine Learning, 2015a.
- Rezende & Mohamed (2015b) Rezende, D. and Mohamed, S. Variational inference with normalizing flows. In International Conference on Machine Learning, pp. 1530–1538. PMLR, 2015b.
- Riesz (1938) Riesz, F. Some mean ergodic theorems. Journal of the London Mathematical Society, 13(4):274–278, 1938.
- Robert & Casella (2004) Robert, C. and Casella, G. Monte Carlo Statistical Methods. Springer, 2nd edition, 2004.
- Robert & Casella (2011) Robert, C. and Casella, G. A short history of Markov Chain Monte Carlo: subjective recollections from incomplete data. Statistical Science, 26(1):102–115, 2011.
- Roberts & Rosenthal (1997) Roberts, G. and Rosenthal, J. Shift-coupling and convergence rates of ergodic averages. Stochastic Models, 13(1):147–165, 1997.
- Roberts & Rosenthal (2004) Roberts, G. and Rosenthal, J. General state space Markov chains and MCMC algorithms. Probability Surveys, 1:20–71, 2004.
- Rotskoff & Vanden-Eijnden (2019) Rotskoff, G. and Vanden-Eijnden, E. Dynamical computation of the density of states and Bayes factors using nonequilibrium importance sampling. Physical Review Letters, 122(15):150602, 2019.
- Salimans & Knowles (2013) Salimans, T. and Knowles, D. Fixed-form variational posterior approximation through stochastic linear regression. Bayesian Analysis, 8(4):837–882, 2013.
- Salimans et al. (2015) Salimans, T., Kingma, D., and Welling, M. Markov chain Monte Carlo and variational inference: bridging the gap. In International Conference on Machine Learning, 2015.
- Spanbauer et al. (2020) Spanbauer, S., Freer, C., and Mansinghka, V. Deep involutive generative models for neural MCMC. arXiv:2006.15167, 2020.
- Tabak & Turner (2013) Tabak, E. and Turner, C. A family of non-parametric density estimation algorithms. Communications on Pure and Applied Mathematics, 66(2):145–164, 2013.
- Tao et al. (2018) Tao, C., Chen, L., Zhang, R., Henao, R., and Carin, L. Variational inference and model selection with generalized evidence bounds. In International Conference on Machine Learning, 2018.
- Thin et al. (2021a) Thin, A., Janati, Y., Le Corff, S., Ollion, C., Doucet, A., Durmus, A., Moulines, É., and Robert, C. NEO: non equilibrium sampling on the orbit of a deterministic transform. Advances in Neural Information Processing Systems, 2021a.
- Thin et al. (2021b) Thin, A., Kotelevskii, N., Durmus, A., Panov, M., Moulines, E., and Doucet, A. Monte Carlo variational auto-encoders. In International Conference on Machine Learning, 2021b.
- Tupper (2005) Tupper, P. Ergodicity and the numerical simulation of Hamiltonian systems. SIAM Journal on Applied Dynamical Systems, 4(3):563–587, 2005.
- U.S. Department of Justice Federal Bureau of Investigation (1995) U.S. Department of Justice Federal Bureau of Investigation. Crime in the United States, 1995. URL: https://ucr.fbi.gov/crime-in-the-u.s/1995.
- ver Steeg & Galstyan (2021) ver Steeg, G. and Galstyan, A. Hamiltonian dynamics with non-Newtonian momentum for rapid sampling. In Advances in Neural Information Processing Systems, 2021.
- Wainwright & Jordan (2008) Wainwright, M. and Jordan, M. Graphical models, exponential families, and variational inference. Foundations and Trends in Machine Learning, 1(1–2):1–305, 2008.
- Wang (2016) Wang, X. Boosting variational inference: theory and examples. Master’s thesis, Duke University, 2016.
- Wenliang & Kanagawa (2020) Wenliang, L. and Kanagawa, H. Blindness of score-based methods to isolated components and mixing proportions. arXiv:2008.10087, 2020.
- Wolf et al. (2016) Wolf, C., Karl, M., and van der Smagt, P. Variational inference with Hamiltonian Monte Carlo. arXiv:1609.08203, 2016.
- Xu et al. (2020) Xu, K., Ge, H., Tebbutt, W., Tarek, M., Trapp, M., and Ghahramani, Z. AdvancedHMC.jl: A robust, modular and efficient implementation of advanced HMC algorithms. In Symposium on Advances in Approximate Bayesian Inference, 2020.
- Xu & Campbell (2022) Xu, Z. and Campbell, T. The computational asymptotics of variational inference and the Laplace approximation. Statistics and Computing, 32(4):1–37, 2022.
- Yosida (1938) Yosida, K. Mean ergodic theorem in Banach spaces. Proceedings of the Imperial Academy, 14(8):292–294, 1938.
- Zhang et al. (2021) Zhang, G., Hsu, K., Li, J., Finn, C., and Grosse, R. Differentiable annealed importance sampling and the perils of gradient noise. In Advances in Neural Information Processing Systems, 2021.
- Zhang & Hernández-Lobato (2020) Zhang, Y. and Hernández-Lobato, J. M. Ergodic inference: accelerate convergence by optimisation. In arXiv:1805.10377, 2020.
- Zobay (2014) Zobay, O. Variational Bayesian inference with Gaussian-mixture approximations. Electronic Journal of Statistics, 8:355–389, 2014.
Appendix A Proofs
Proof of Proposition 3.1.
Because both estimates are unbiased, it suffices to show that , which itself follows by Jensen’s inequality:
| (25) |
∎
Proof of Theorem 4.1.
Since setwise convergence implies weak convergence, we will focus on proving setwise convergence. We have that converges setwise to if and only if for all measurable bounded ,
| (26) |
The proof proceeds by directly analyzing :
| (27) | ||||
| (28) | ||||
| (29) | ||||
| (30) |
Since , by the Radon-Nikodym theorem, there exists a density of with respect to , so
| (31) |
By the pointwise ergodic theorem (Theorem 2.3), converges pointwise -a.e. to ; and because is bounded, is uniformly bounded for all . Hence by the Lebesgue dominated convergence theorem,
| (32) | ||||
| (33) | ||||
| (34) |
∎
Theorem A.1 (Mean ergodic theorem in Banach spaces [Yosida, 1938; Kakutani, 1938; Riesz, 1938; Eisner et al., 2015, Theorem 8.5]).
Let be a bounded linear operator on a Banach space , define the operator
| (35) |
and let
| (36) |
Suppose that and that for all . Then the subspace
| (37) |
is closed, -invariant, and decomposes into a direct sum of closed subspaces
| (38) |
The operator on is mean ergodic. Furthermore, the operator
| (39) |
is a bounded projection with kernel and .
Proof of Theorem 4.2.
We suppress subscripts for brevity. Consider the Banach space of signed finite measures dominated by endowed with the total variation norm . Then the pushforward of under is dominated by since
| (40) |
Note the slight abuse of notation involving the same symbol for and the associated operator. Hence is a linear operator on . Further,
| (41) |
and so is bounded with . Hence for all , and if we define the operator
| (42) |
we have that . Therefore by the mean ergodic theorem in Banach spaces [Yosida, 1938; Kakutani, 1938; Riesz, 1938; Eisner et al., 2015, Theorem 8.5], we have that
| (43) |
where . Eisner et al. (2015, Theorem 8.20) guarantees that as long as the weak limit of exists for each . Note that since and are isometric (via the map ), and is -finite, the dual of is the set of linear functionals
| (44) |
So therefore we have that if for each , there exists a such that
| (45) |
The same technique using a transformation of variables and the pointwise ergodic theorem from the proof of Theorem 4.1 provides the desired weak convergence. Therefore we have that converges in total variation to for all , and hence converges in total variation to . Furthermore Theorem 4.1 guarantees weak convergence of to , and , so thus . ∎
Proof of Theorem 4.3.
We suppress subscripts for brevity. By the triangle inequality,
| (46) |
Focusing on the error term, we have that
| (47) | ||||
| (48) | ||||
| (49) | ||||
| (50) | ||||
| (51) | ||||
| (52) |
where the last equality is due to the fact that is a bijection. The triangle inequality yields
| (53) | ||||
| (54) |
Then iterating that technique yields
| (55) |
which completes the proof. ∎
Proof of Corollary 4.4.
Examining the total variation in its distance formulation yields that for ,
| (56) | ||||
| (57) |
By assumption,
| (58) |
and
| (59) | ||||
| (60) | ||||
| (61) |
Combining these two bounds yields
| (62) |
Therefore, by Equation 55, we obtain that
| (63) |
Finally, combining the above with Theorem 4.3 yields the desired result. ∎
Appendix B Memory efficient ELBO estimation
Appendix C Hamiltonian flow pseudocode
Appendix D Extensions
Tunable reference
So far we have assumed that the reference distribution for the flow is fixed. Given that is often quite far from the target , this forces the variational flow to spend some of its steps just moving the bulk of the mass to . But this can be accomplished much easier with, say, a simple linear transformation that efficiently allows large global moves in mass. For example, if , we can include a map
| (64) |
where , where and . Note that it is possible to optimize the reference and flow jointly, or to optimize the reference distribution by itself first and then use that fixed reference in the flow optimization.
Automated burn-in
A common practice in MCMC is to throw away a first fraction of the states in the sequence to ensure that the starting sample is in a high probability region of the target distribution, thus reducing the bias from initialization (“burn-in”). Usually one needs a diagnostic to check when burn-in is completed. In the case of MixFlow, we can monitor the burn-in phase in a principled way by evaluating the ELBO. Once the flow is trained, the variational distribution with burn-in samples is simply
| (65) |
We can easily optimize this by estimating the ELBOs for .
Mixtures of MixFlows
One can build multiple MixFlows starting from multiple different initial reference distributions; when the posterior is multimodal, it may be the case that some of these MixFlows converge to different modes but do not mix across modes. In this scenario, it can be helpful to average several MixFlows, i.e., build an approximation of the form
| (66) |
Because each component flow provides access to i.i.d. samples and density evaluation, MixFlow provides the ability to optimize the weights by maximizing the ELBO (i.e., minimizing the KL divergence).
Appendix E Additional experimental details
In this section, we provide details for each experiment presented in the main text, as well as additional results regarding numerical stability and a high-dimensional synthetic experiment. Aside from the univariate synthetic example, all examples include a pseudotime shift step with , and a momentum refreshment with . For the kernel Stein discrepancy, we use a IMQ kernel with , the same setting as in (Gorham & Mackey, 2017).
For all experiments, unless otherwise stated, NUTS uses steps for adaptation, targeting at an average acceptance ratio , and generates samples for KSD estimation. The KSD for MixFlow is estimated using samples. The KSD estimation for NEO is based on samples generated by a tuned NEO after burn-in steps. We adopted two tuning strategies for NEO: (1) choosing among the combinations of several fixed settings of discretization step (), friction parameter of nonequilibrium Hamiltonian dynamics (), integration steps (), and mass matrix of momentum distribution (); (2) fixing the integration steps () and friction parameter (), and using windowed adaptation (Carpenter et al., 2017) to adapt the mass matrix and integration step size, targeting at an average acceptance ratio at . The optimal setting of NEO is considered to be the one that produces lowest average marginal KSD over runs with no NaN values encountered. Performance of NEO across various settings for each example is summarized in Table 4. In each of NEO MCMC transition, we run deterministic orbits and computes corresponding normalizing constant estimates in parallel. Aside from NEO, all other methods are deployed using a single processor.
As for NUTS, we use the Julia package AdvancedHMC.jl (Xu et al., 2020) with all default settings. NEO adaptation is also conducted using AdvancedHMC.jl with the number of simulation steps set to the number of integration steps of NEO. The ESS is computed using the R package mcmcse, which is based on batch mean estimation. We implement all NFs using the Julia package Bijectors.jl (Fjelde et al., 2020). The flow layers of PlanarFlow and RadialFlow, as well as the coupling layers of RealNVP are implemented in Bijectors.jl. The affine coupling functions of RealNVP—a scaling function and a shifting function—are both parameterized using fully connected neural networks of three layers, of which the activation function is LeakyReLU and number of hidden units is by default the same dimension as the target distribution, unless otherwise stated.
E.1 Univariate synthetic examples
The three target distributions tested in this experiment were
-
•
normal: ,
-
•
synthetic Gaussian mixture: , and
-
•
Cauchy: .
For all three examples, we use a momentum refreshment without introducing the pseudotime variable; this enables us to plot the full joint density of :
| (67) |
For the three examples, we used the leapfrog stepsize and run leapfrogs between each refreshment. For both the Gaussian and Gaussian mixture targets, we use refreshments. In the case of the Cauchy, we used refreshments.
E.2 Multivariate synthetic examples
The three target distributions tested in this experiment were
-
•
the banana distribution (Haario et al., 2001):
(68) -
•
Neals’ funnel (Neal, 2003):
(69) -
•
a cross-shaped distribution: in particular, a Gaussian mixture of the form
(70) (71) -
•
and a warped Gaussian distribution
(72) where is the angle, in radians, between the positive axis and the ray to the point .
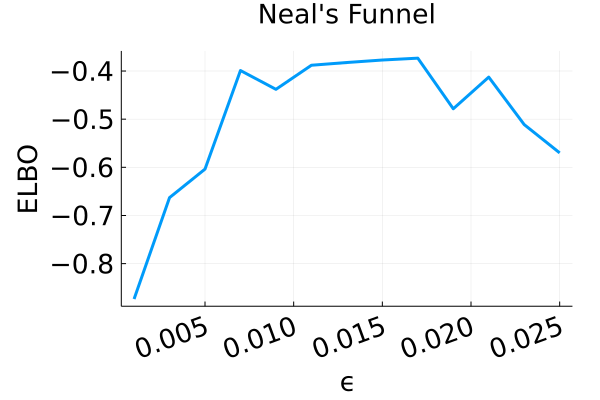
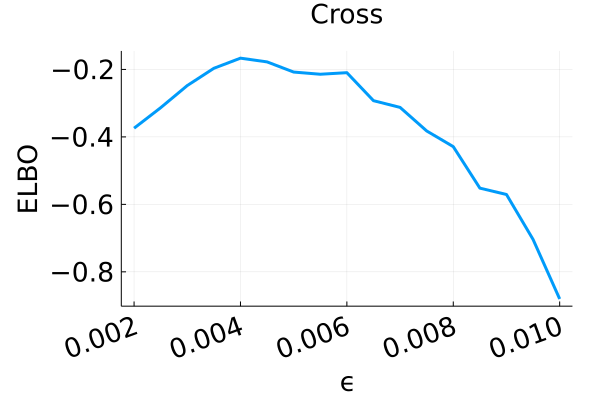
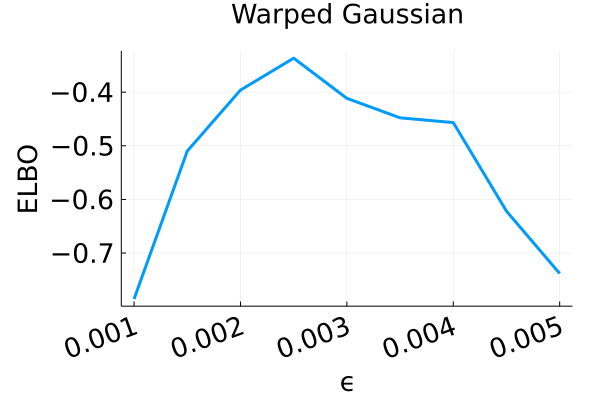
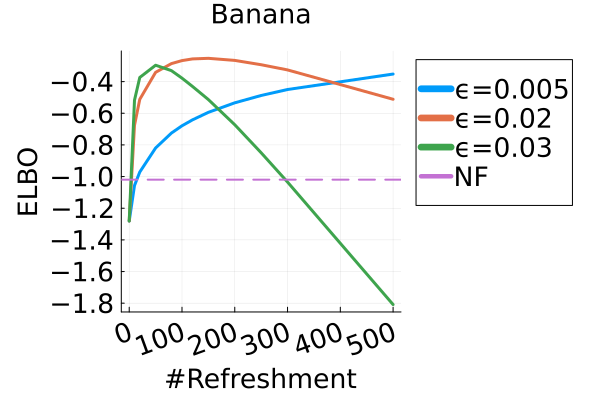
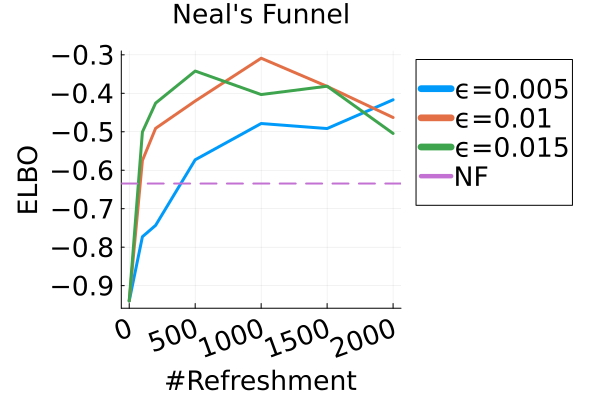
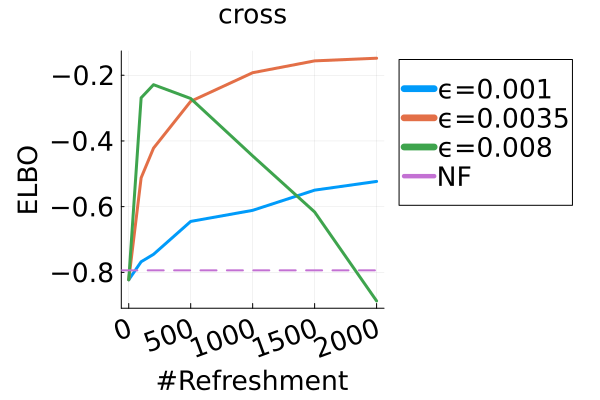
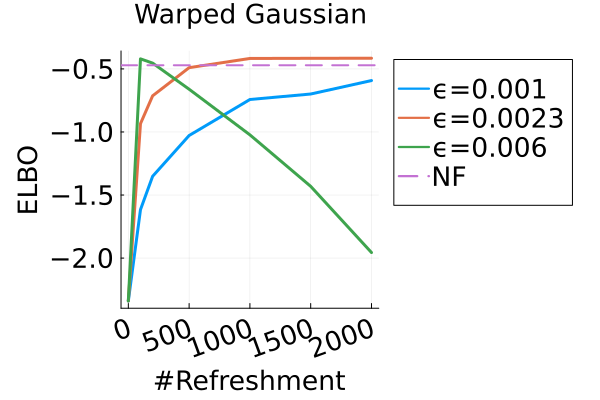
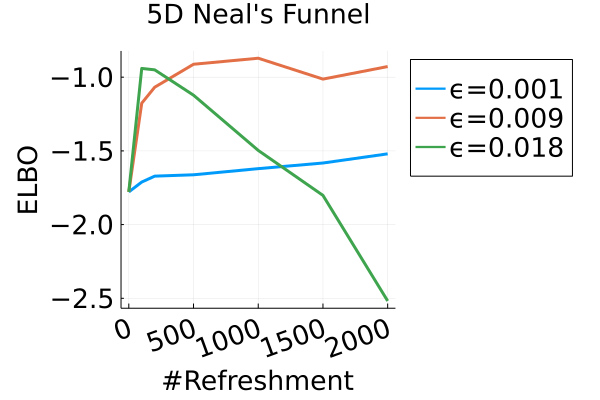
We used flows with and refreshments for the banana distribution, Neal’s Funnel respectively, and a flow with refreshments for both cross distribution and warped Gaussian. Between each refreshment we used 200 leapfrog steps for the banana distribution, 60 for the cross distribution, and 80 for the funnel and warped Gaussian. Note that in all four examples, we individually tuned the step size by maximizing the estimated ELBO, as shown in Figure 5(a). Figure 5(b) also demonstrates how the ELBO varies versus the number of refreshments . For small step sizes , the discretized Hamiltonian dynamics approximates the continuous dynamics, and the ELBO generally increases with indicating convergence to the target. For larger step sizes , the ELBO increases to a peak and then decreases, indicating that the discretized dynamics do not exactly target the desired distribution.
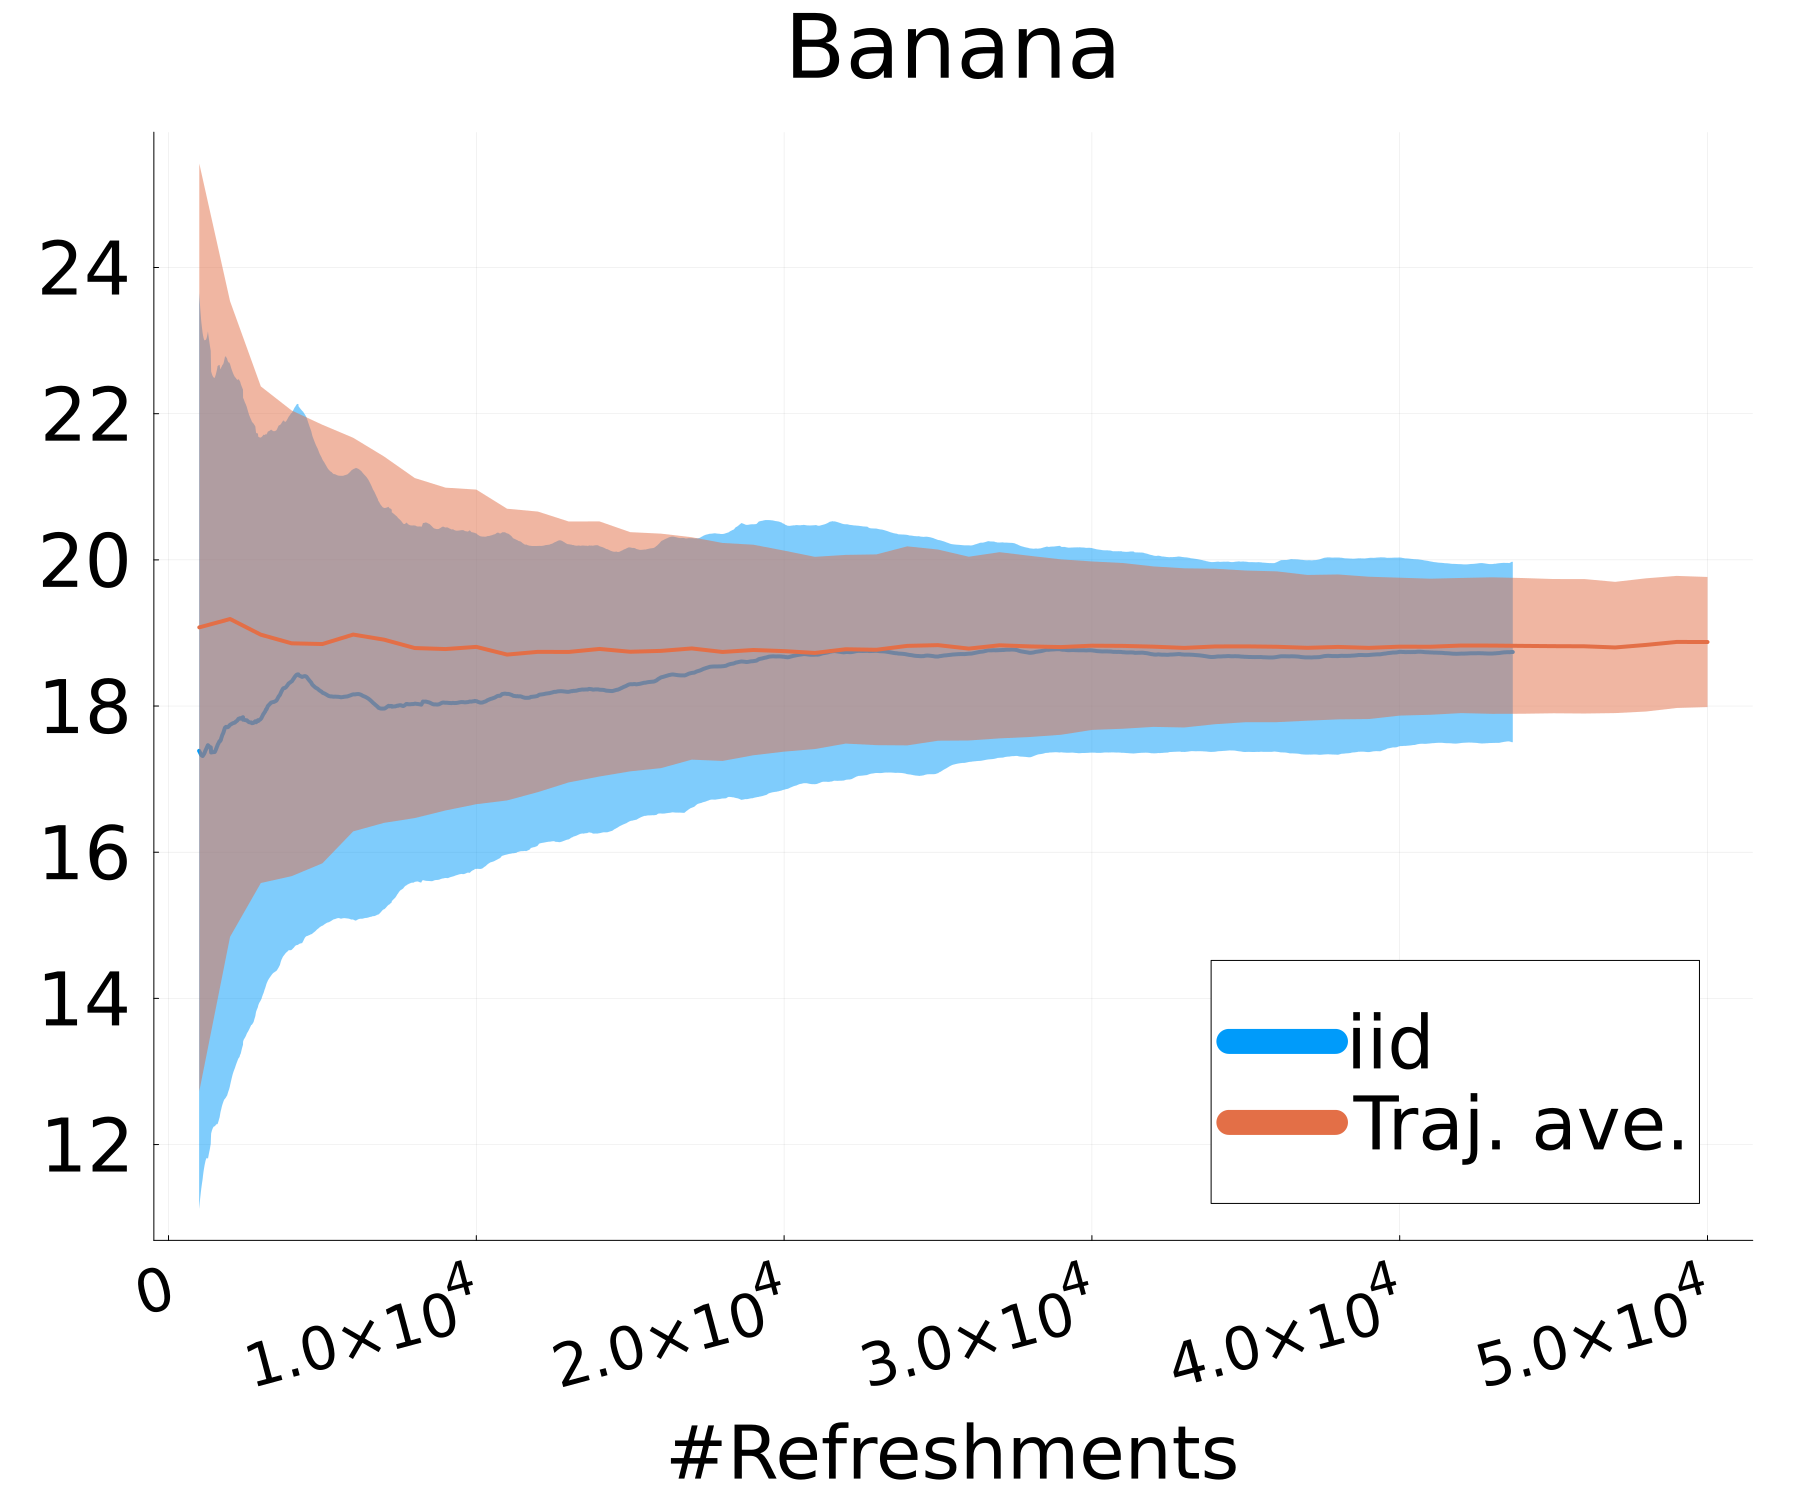
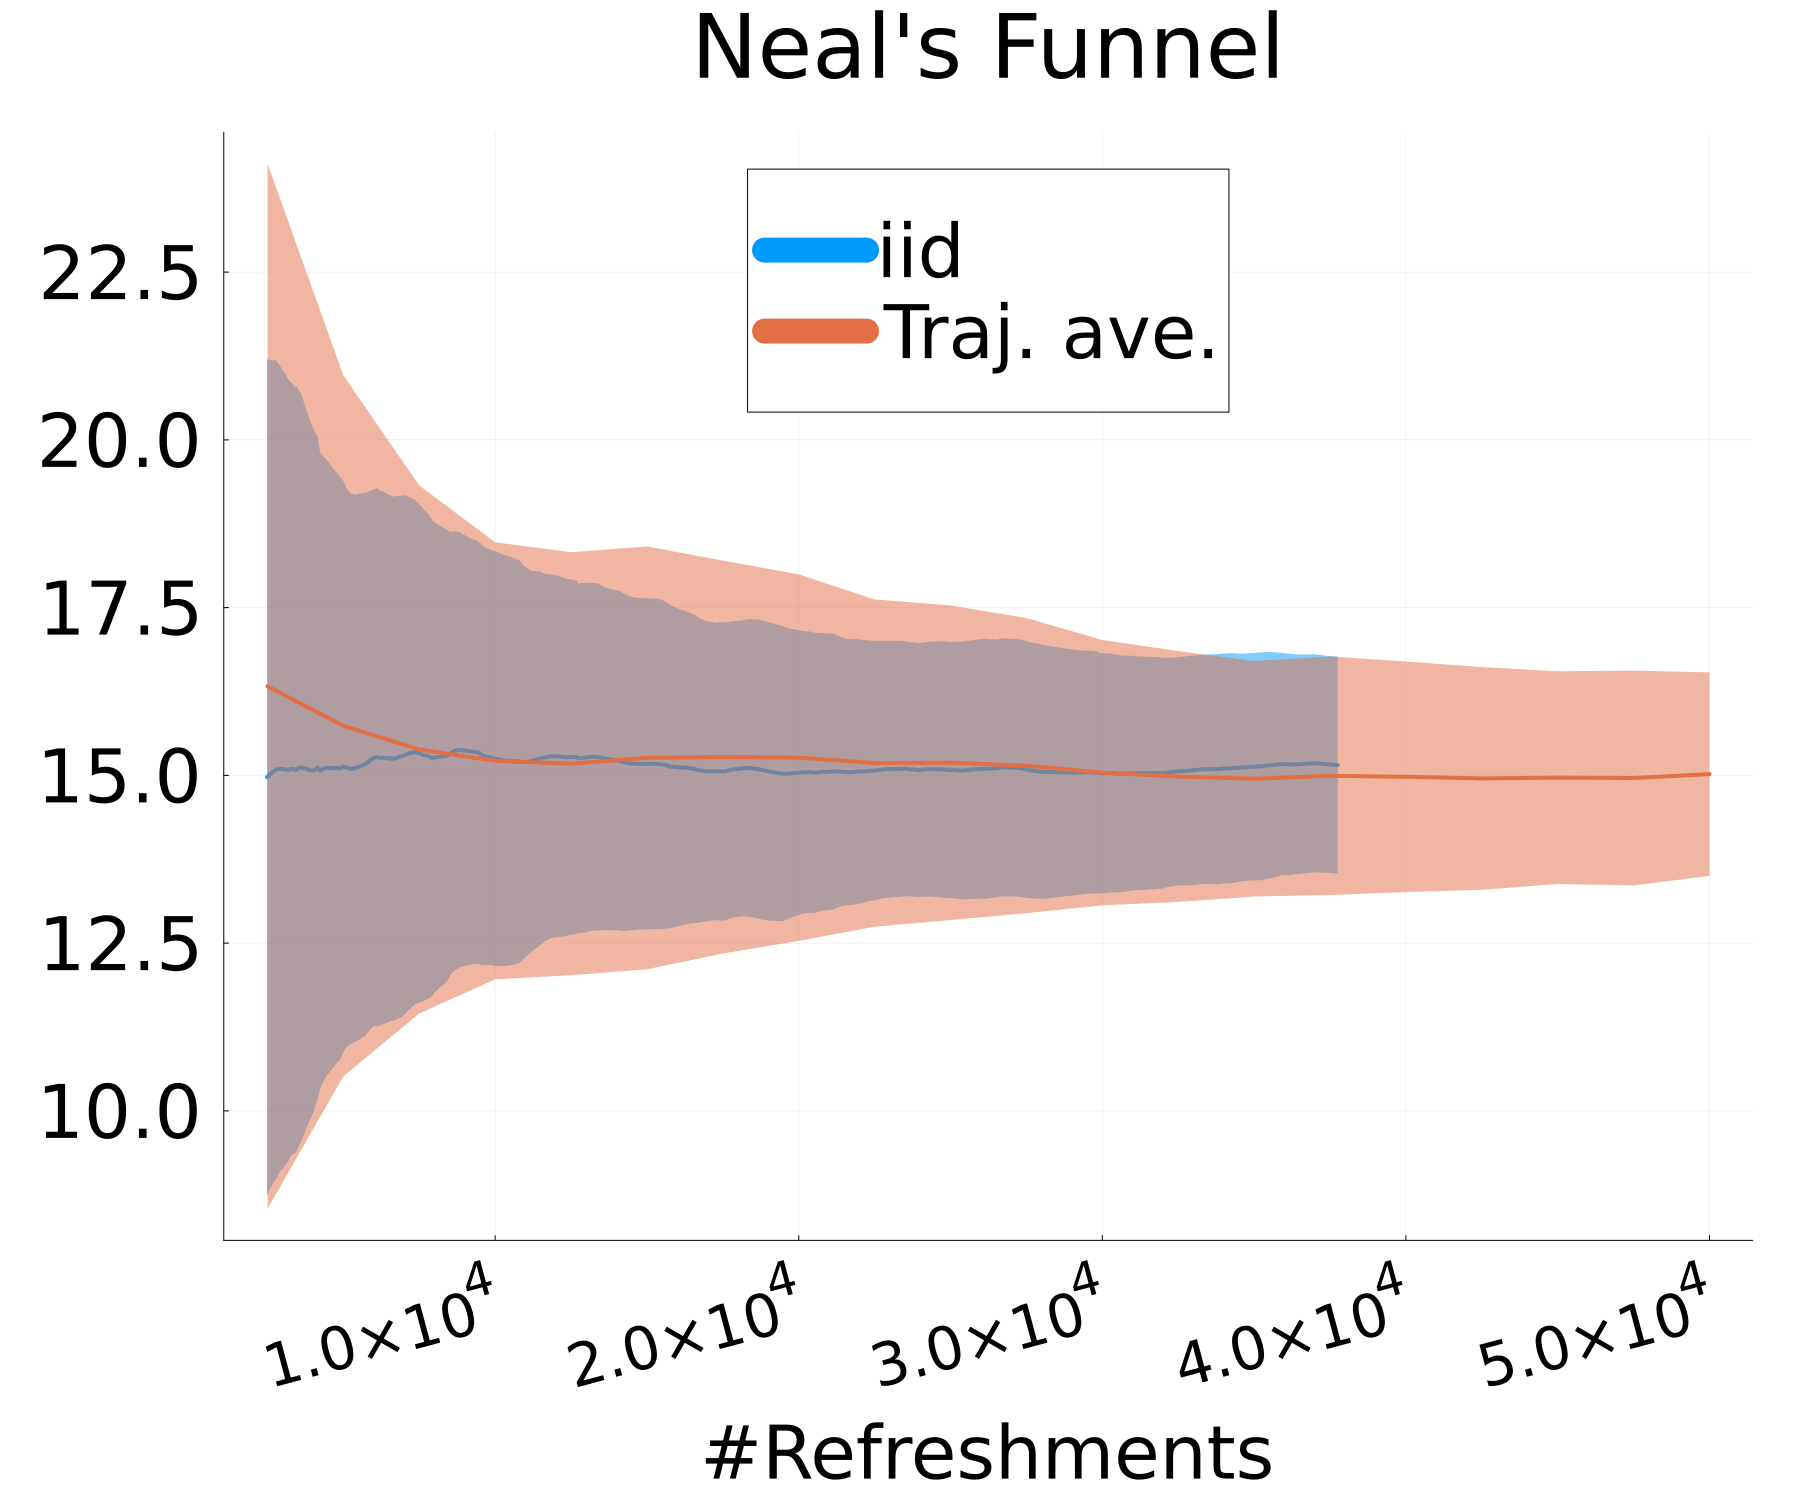
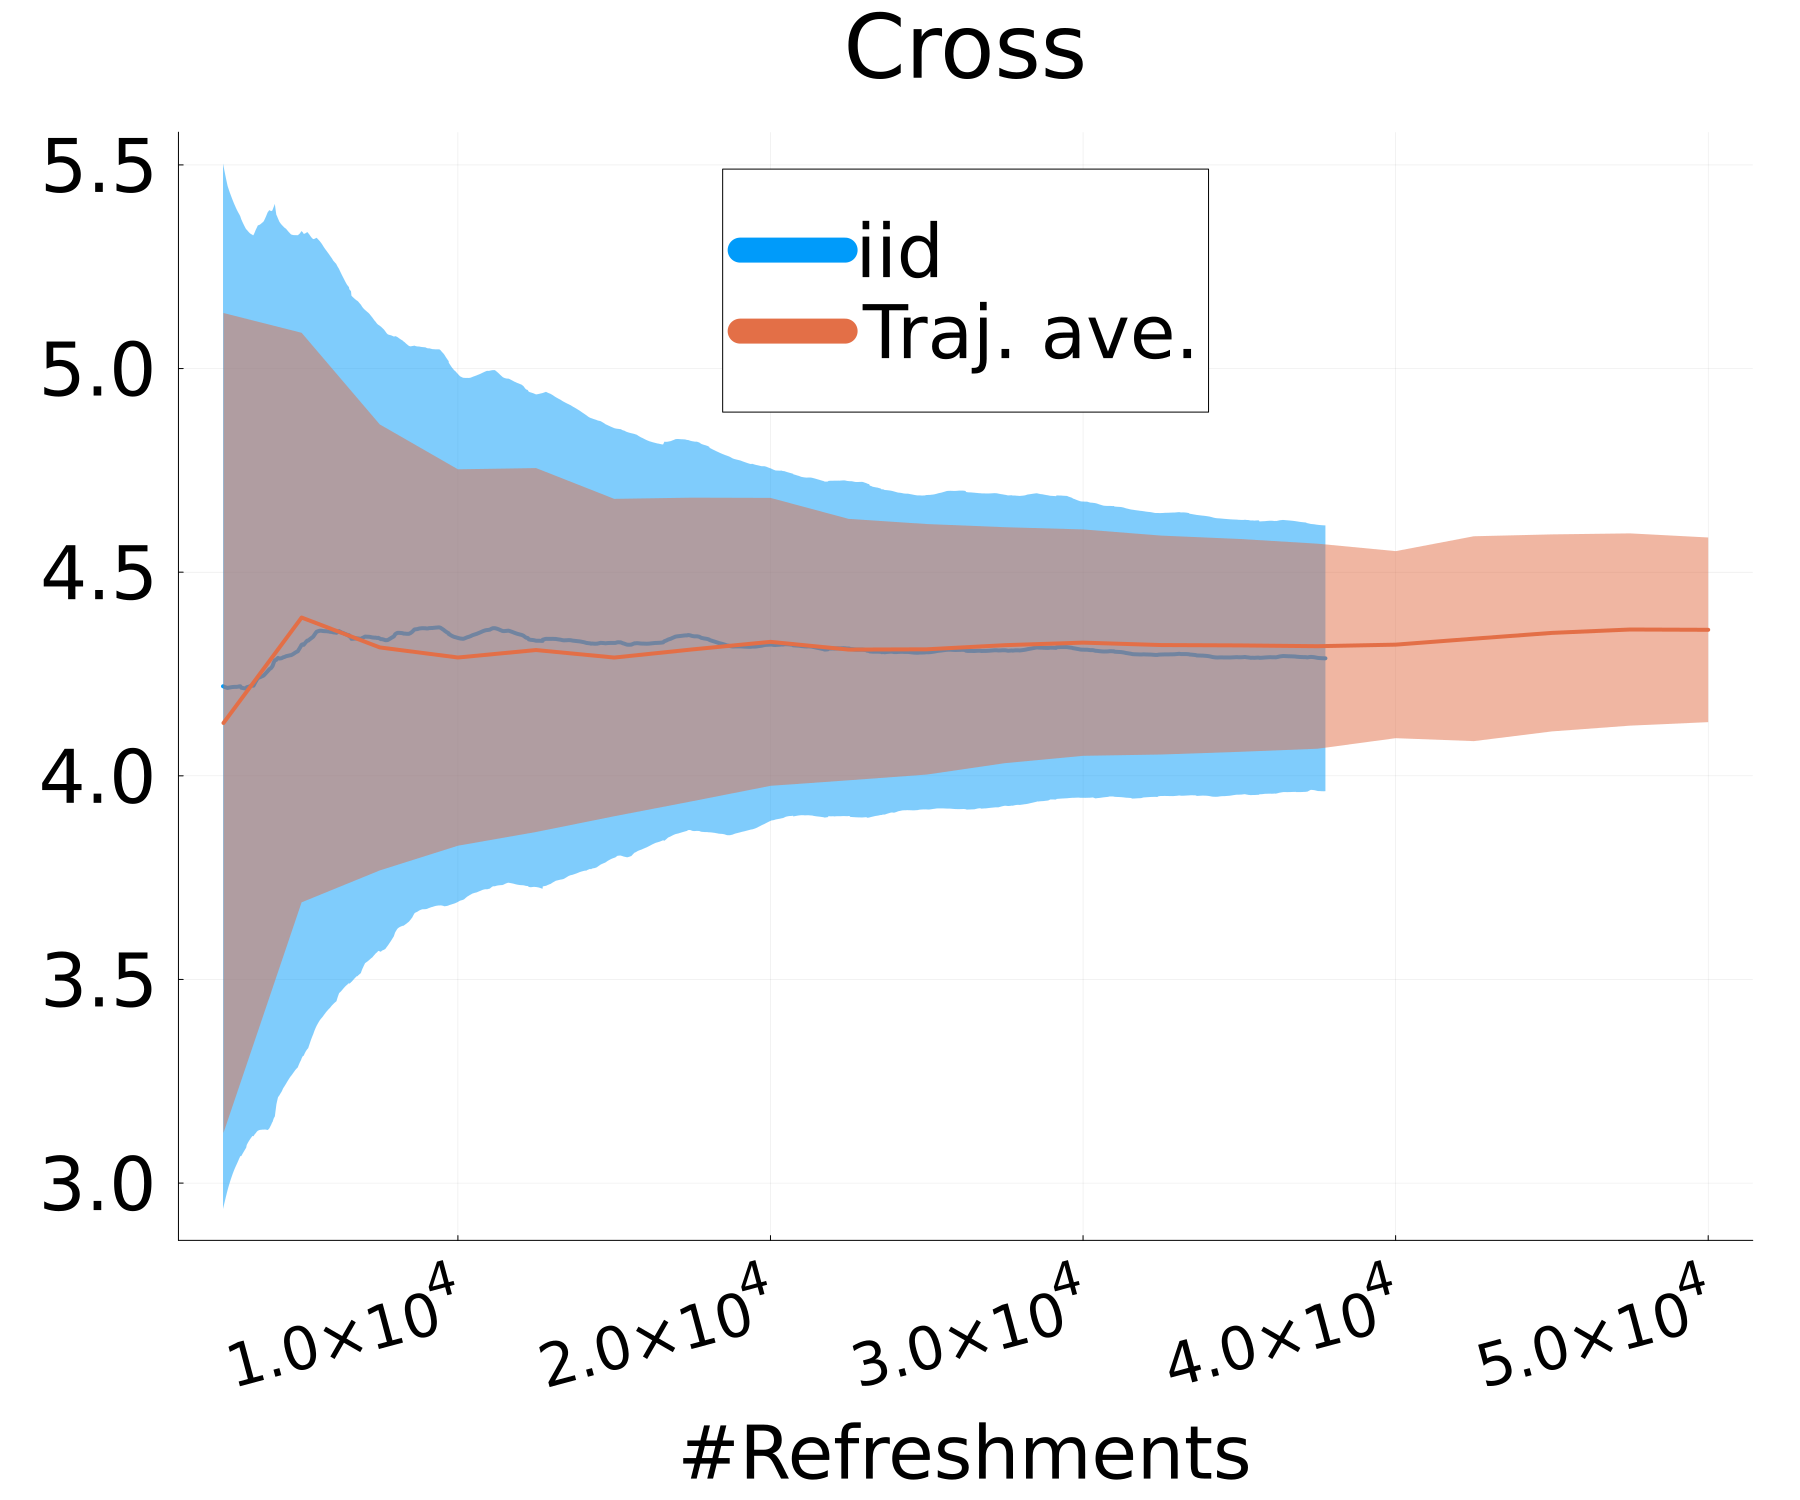
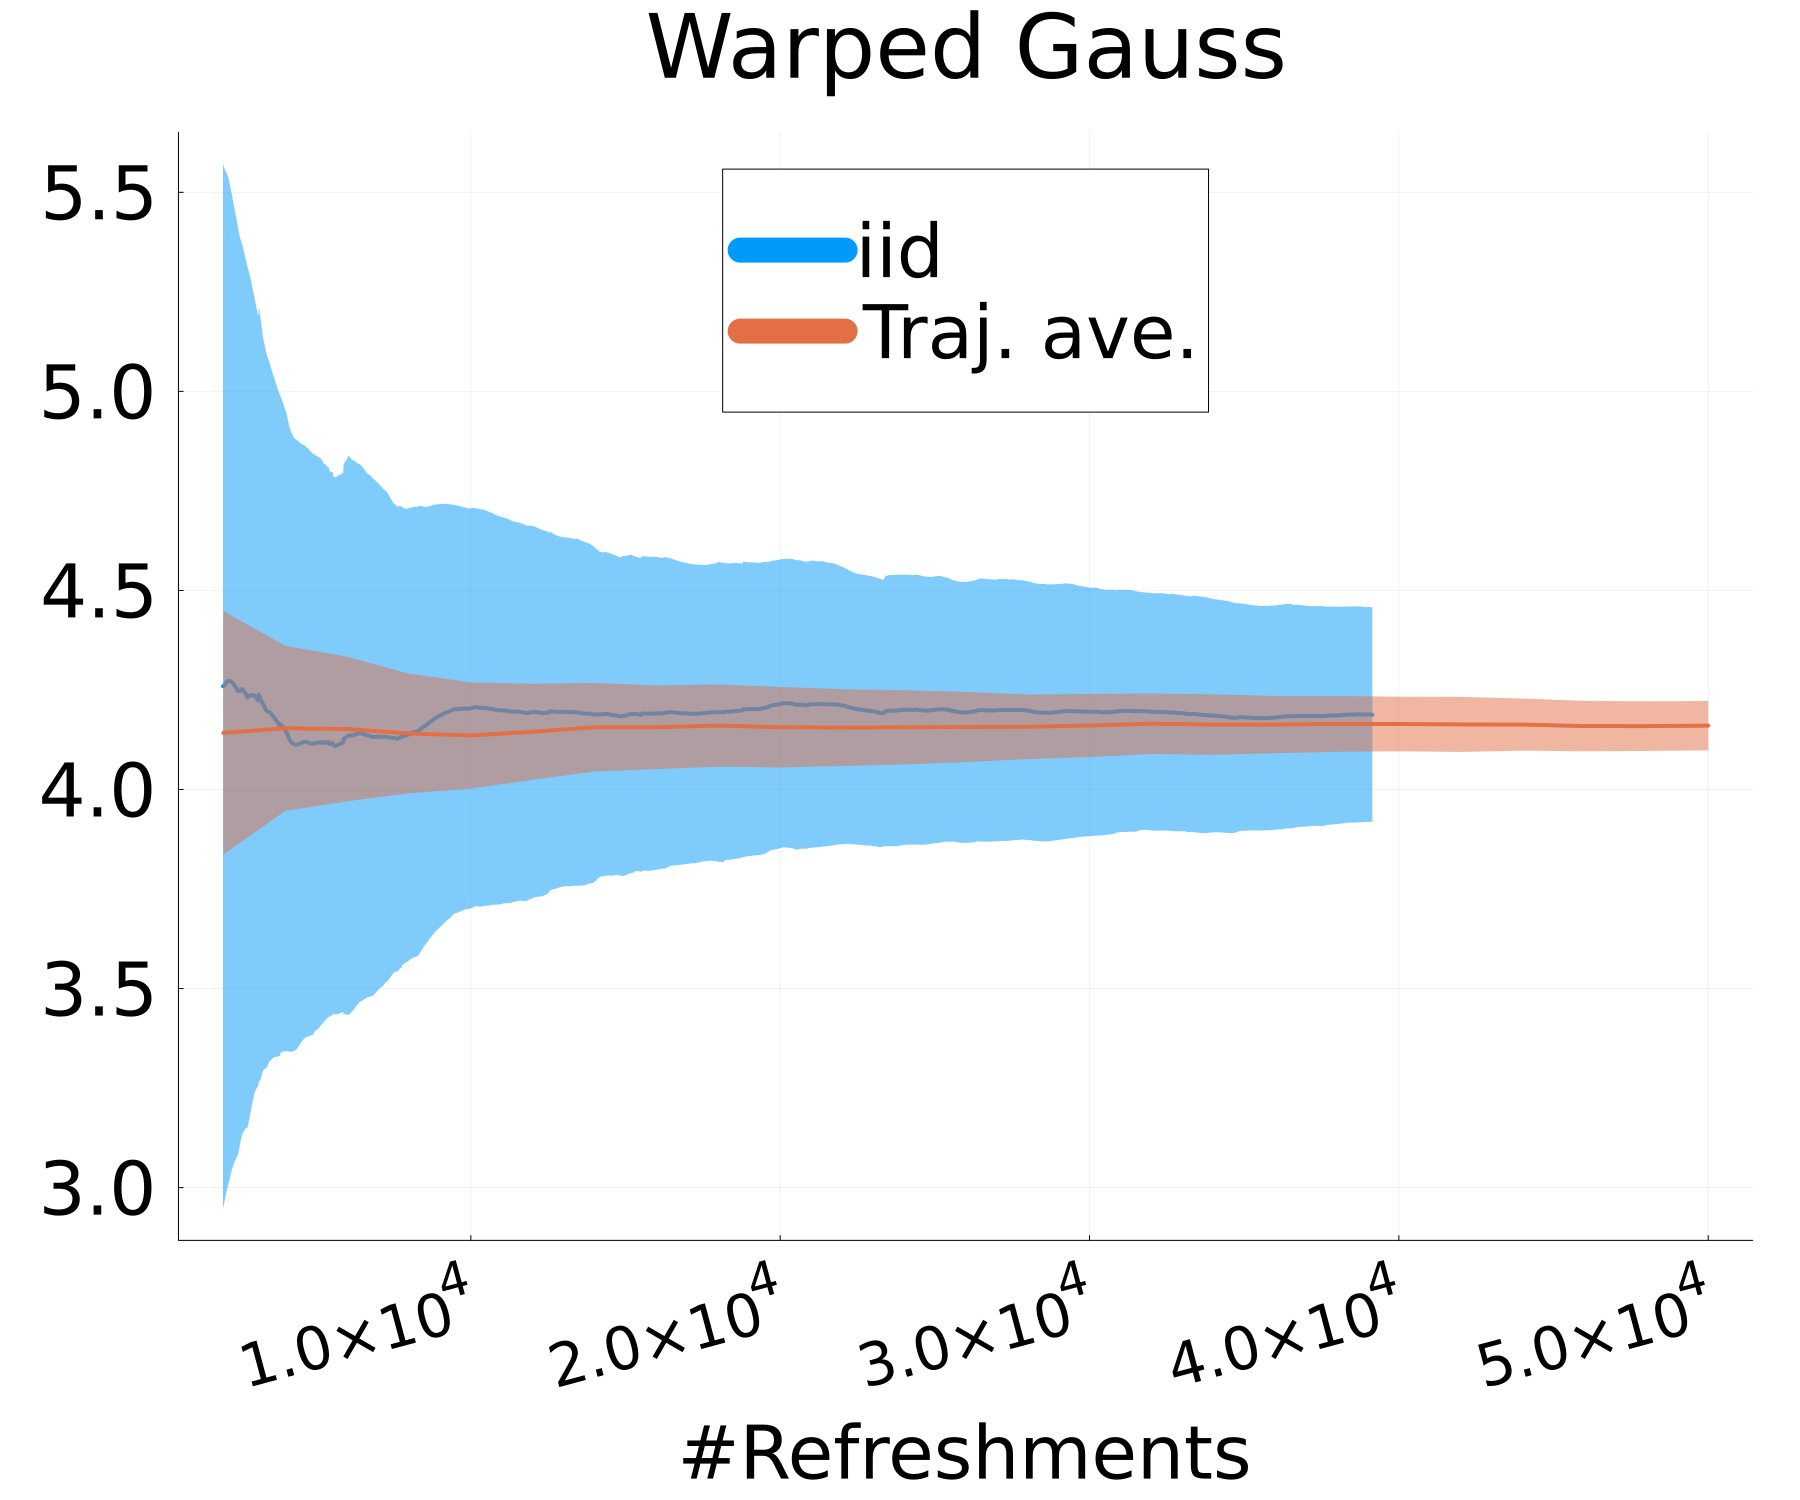
Figure 6 presents a comparison of the uncertainty involved in estimating the expectations of a test function for both MixFlow iid and MixFlow single. Specifically, it examines the streaming estimation of , where , based on samples generated from MixFlow iid and MixFlow single under flow map evaluations over 10 independent trials. Note that we assess computational cost via the number of flow map evaluations, not by the number of draws, because the cost per draw is random in MixFlow iid (due to ), while the cost per draw is fixed to evaluations for the trajectory estimate in MixFlow single. The results indicate that, given equivalent computational resources, the trajectory-averaged estimates generally exhibit lower variances between trials than the naïve i.i.d. Monte Carlo estimate. This observation validates Proposition 3.1.
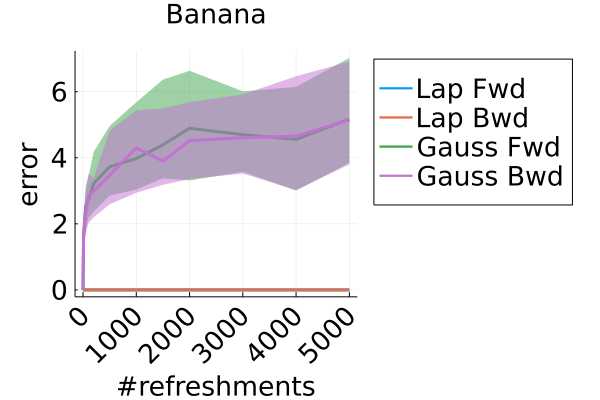
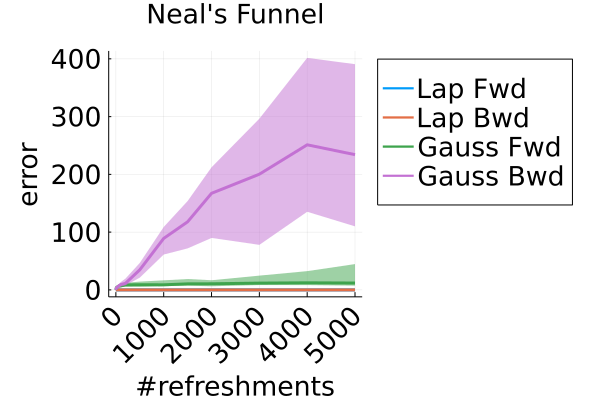
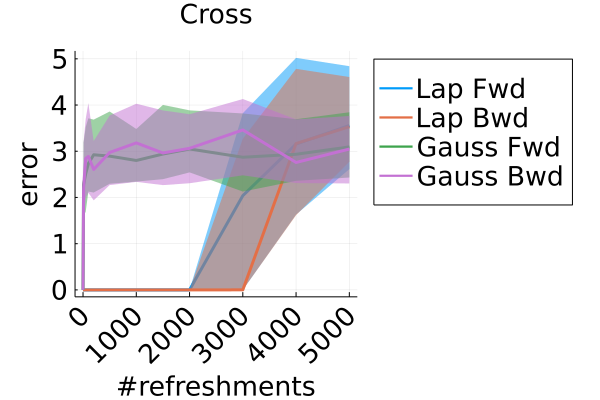
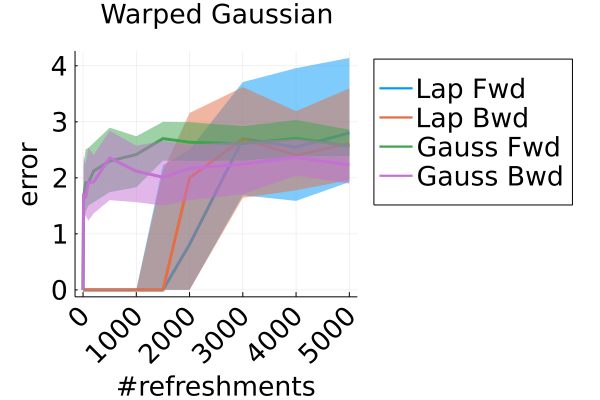
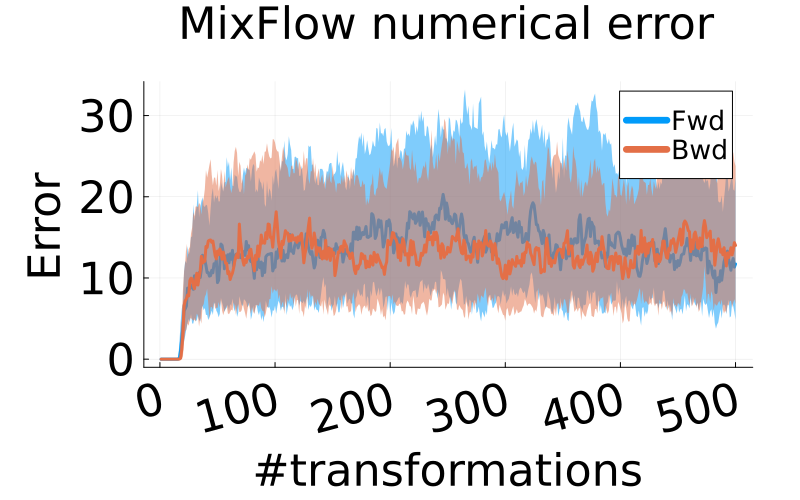
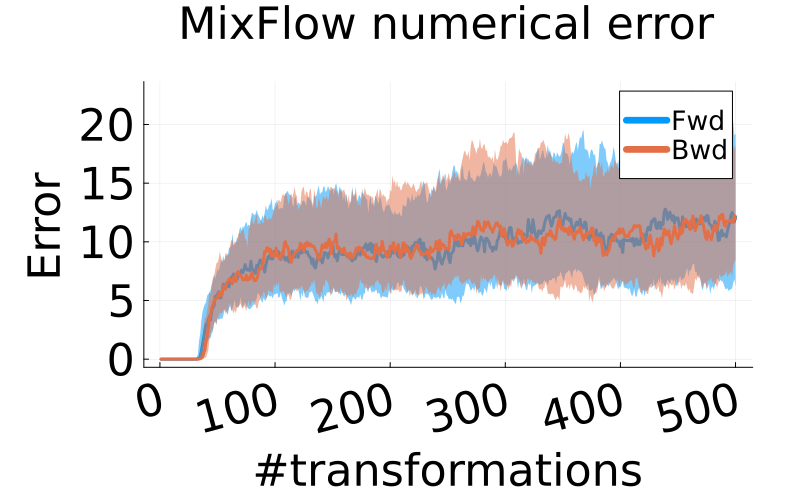
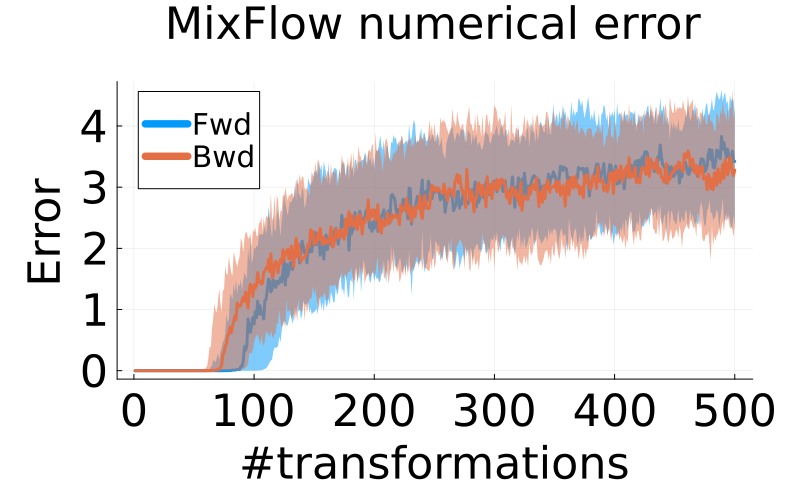
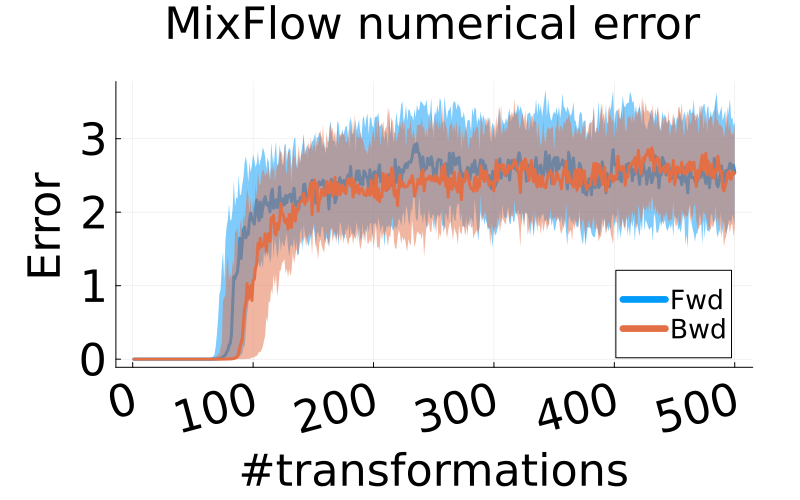
Figure 7 shows why we opted to use a Laplace momentum distribution as opposed to a Gaussian momentum. In particular, the numerical error of composing and (denoted as “Bwd” and “Fwd” in the legend, respectively) indicate that the flow using the Laplace momentum is more reliably invertible for larger numbers of refreshments than the flow with a Gaussian momentum. Figure 8 uses a high-precision (256 bit) floating point representation to further illustrate the rapid escalation of numerical error when evaluating forward and backward trajectories on Gaussian Hamiltonian MixFlows. For all four synthetic examples, after approximately 100 flow transformations, MixFlows with Gaussian momentum exhibits an error on the scale of the target distribution itself (per the contour plots (d)-(g) in Figure 1). This may be due to the fact that the normal has very light tails; for large momentum values in the right tail, the CDF is , which gets rounded to exactly 1 in floating point representation. Our implementation of the CDF and inverse CDF was fairly naïve, so it is possible that stability could be improved with more care taken to prevent rounding error. We leave a more careful examination of this error to future work; for this work, using a Laplace distribution momentum sufficed to maintain a low numerical error.
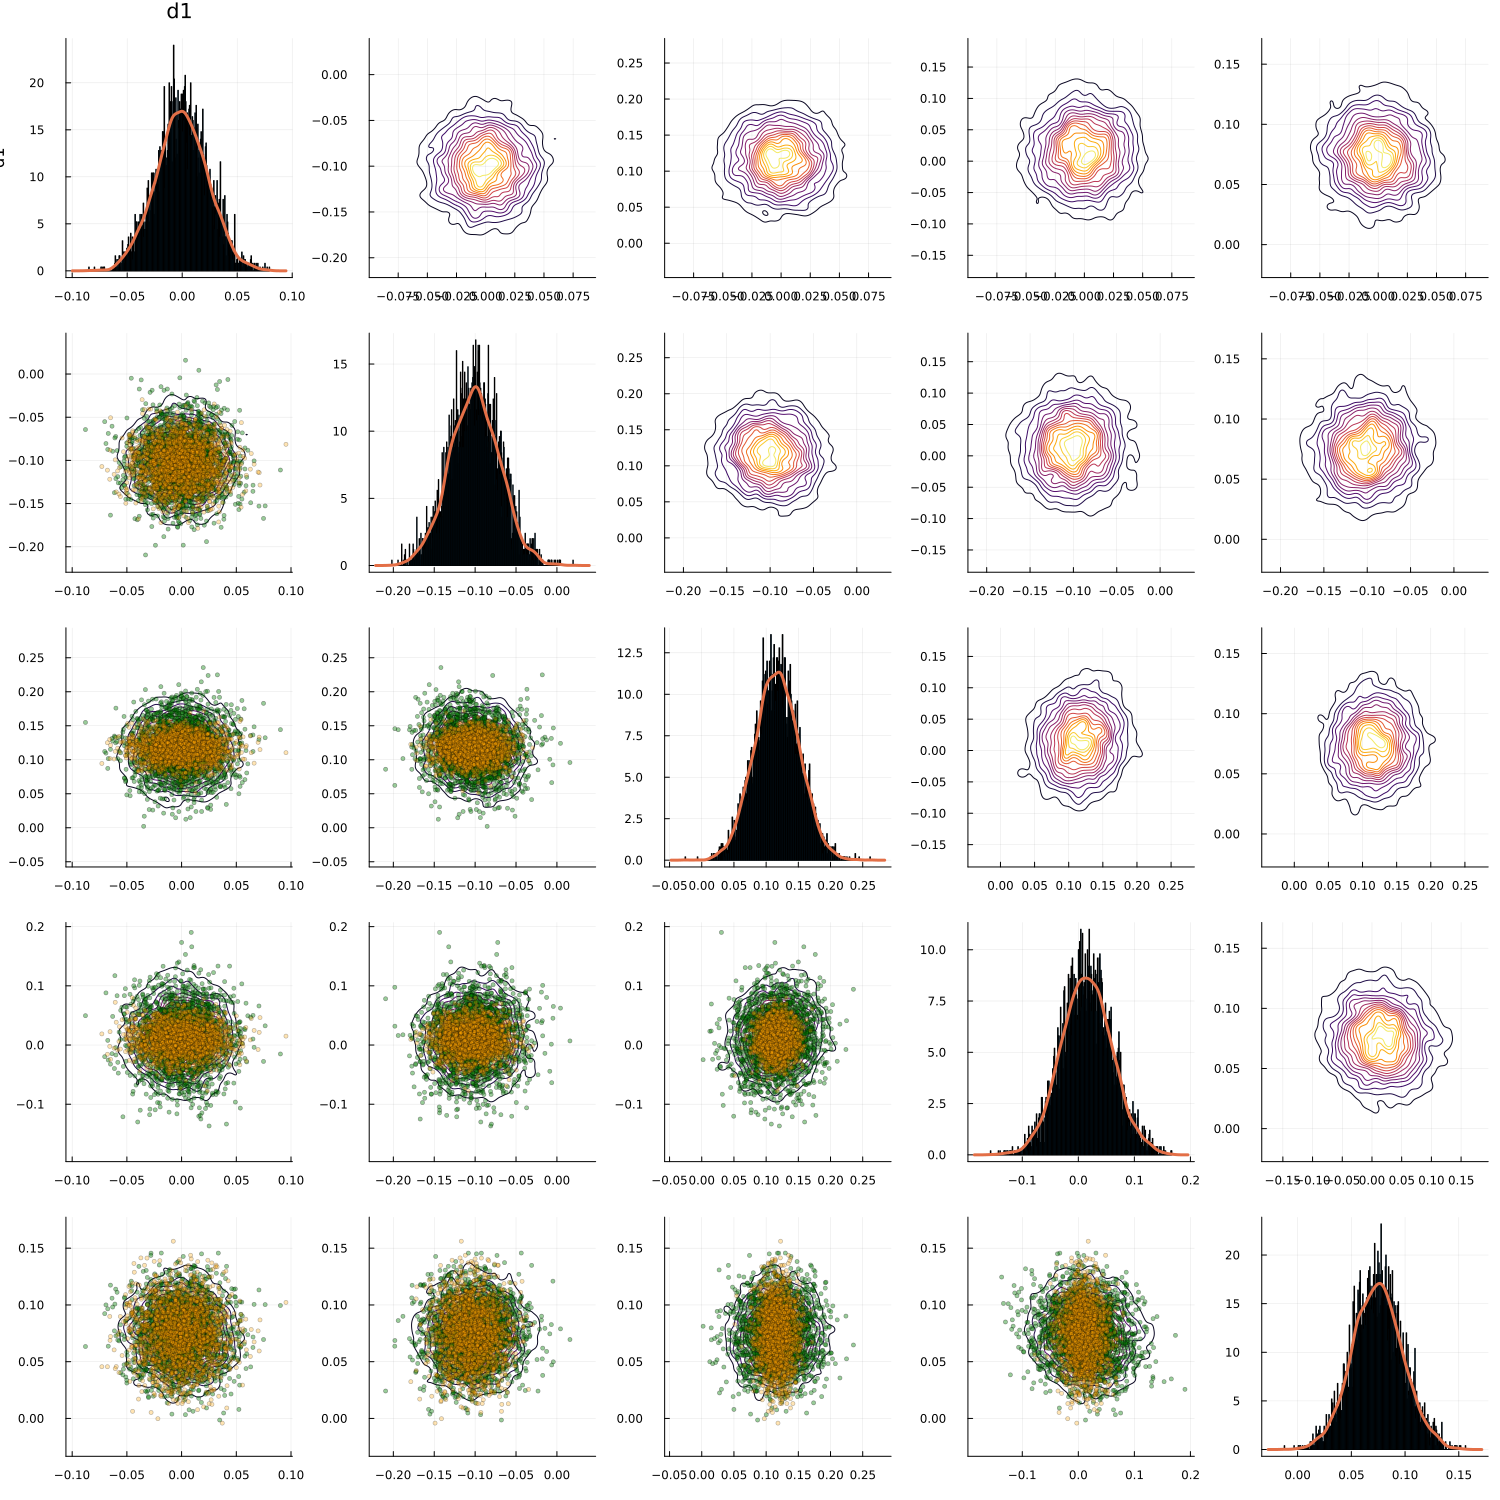
Finally, Figure 9 provides a more comprehensive set of sample histograms for these experiments, showing the -, -, and -marginals. It is clear that MixFlow generates samples for each variable reliably from the target marginal.
E.3 Higher-dimensional synthetic experiment
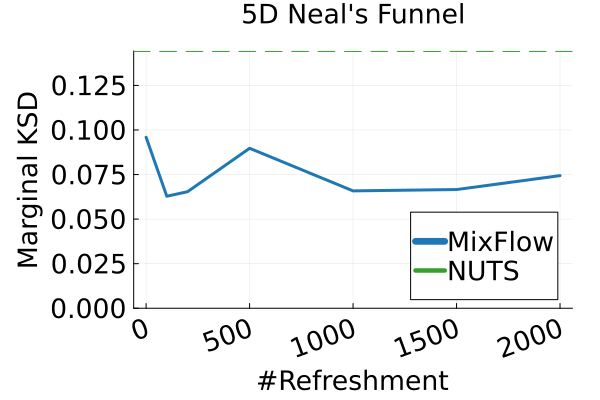
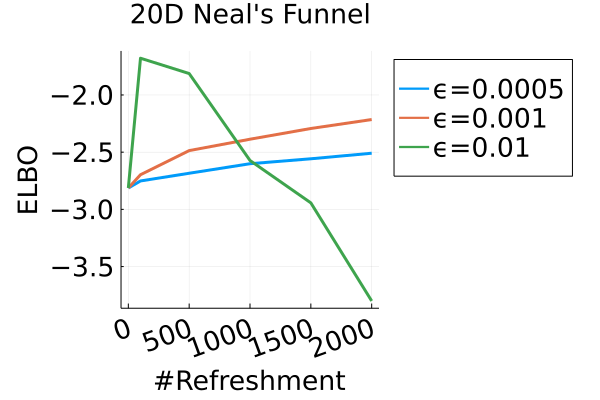
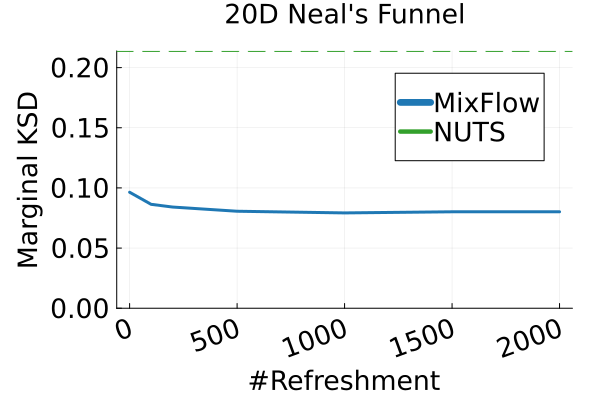
We also tested two higher dimensional Neal’s funnel target distributions of where . In particular, we used the target distribution
| (73) |
with . We use leapfrogs between refreshments and when , and leapfrogs between refreshments and when (Figures 10(a) and 10(c) shows the ELBO comparison used to tune the step size ). Figures 10(b) and 10(d) confirm via the KSD that the method performs as well as NUTS in higher-dimensional cases.


E.4 Additional experiments for synthetic examples





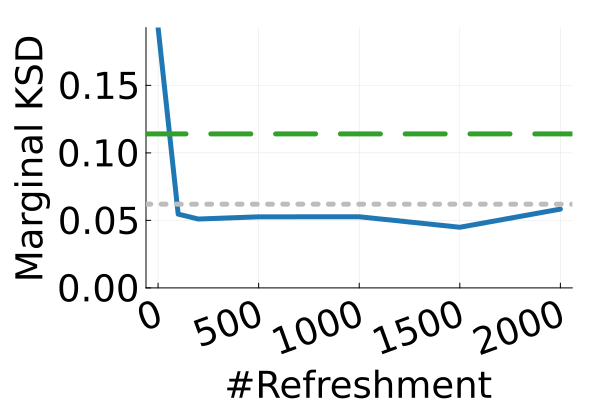
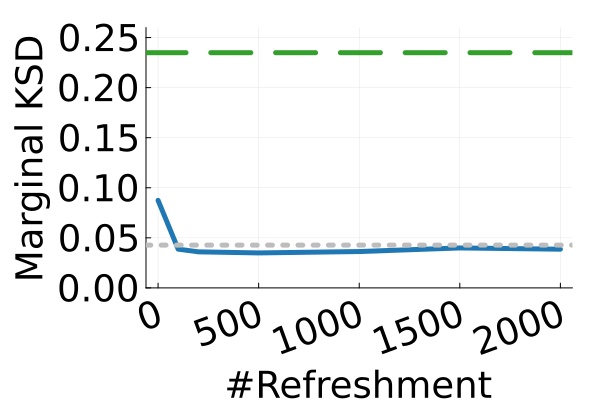
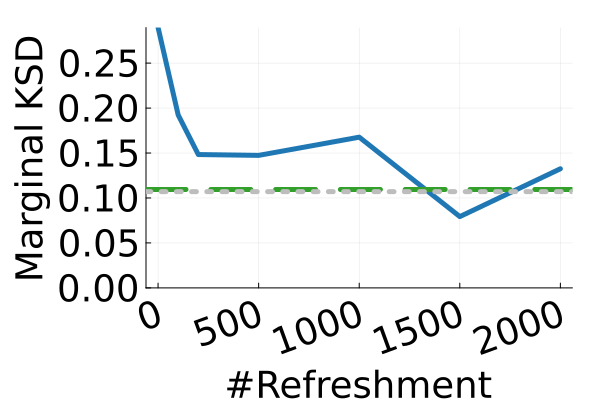
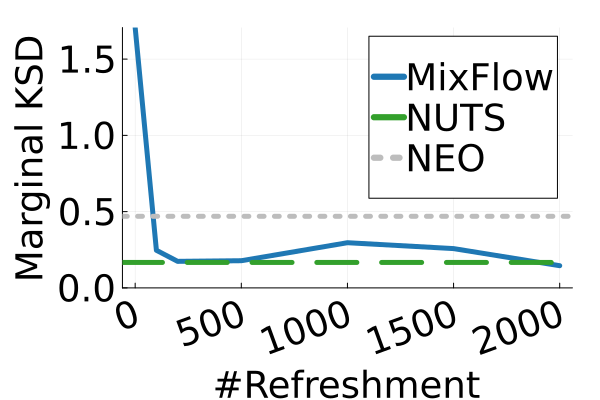
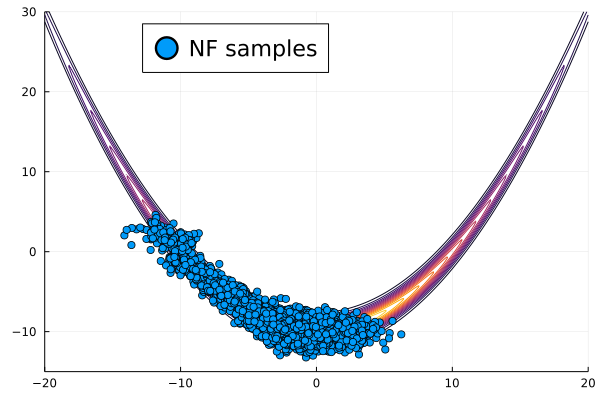
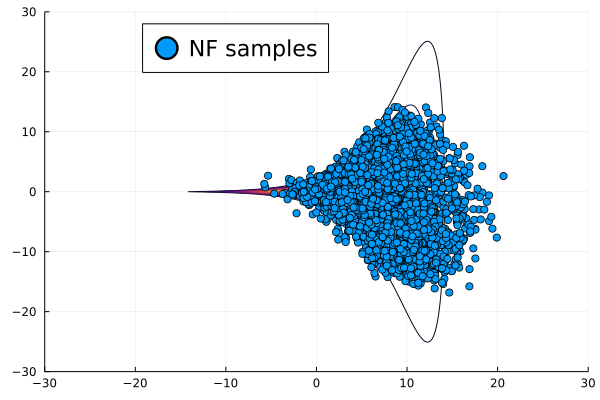
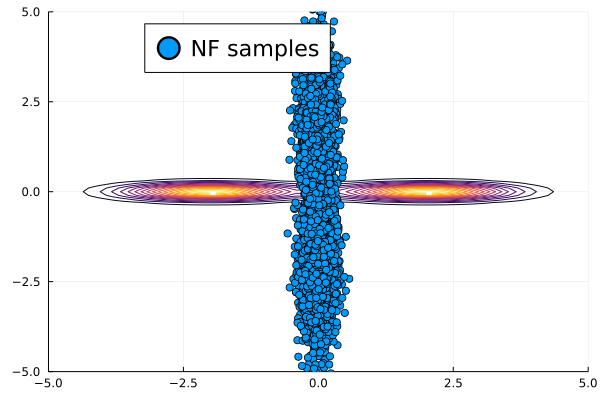
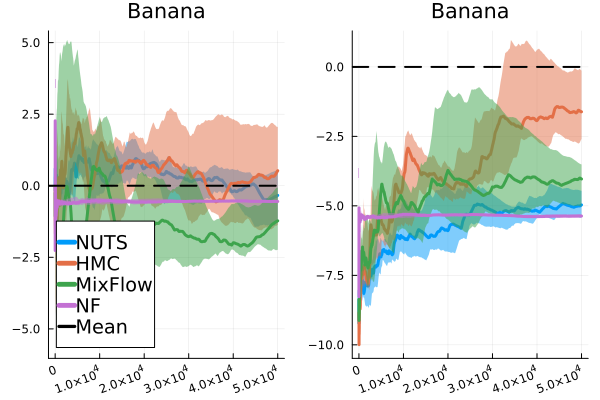
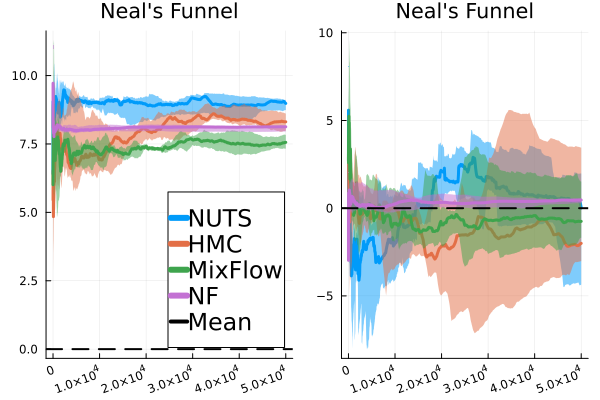
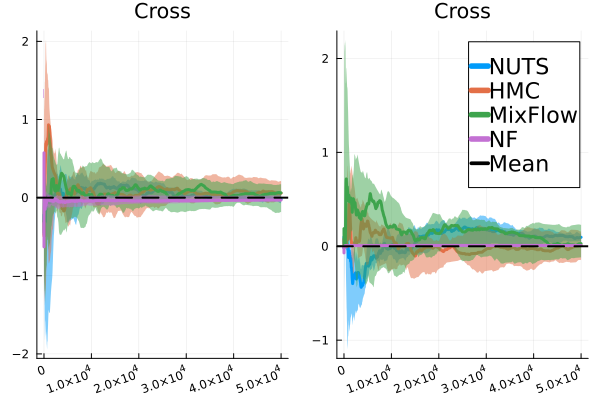
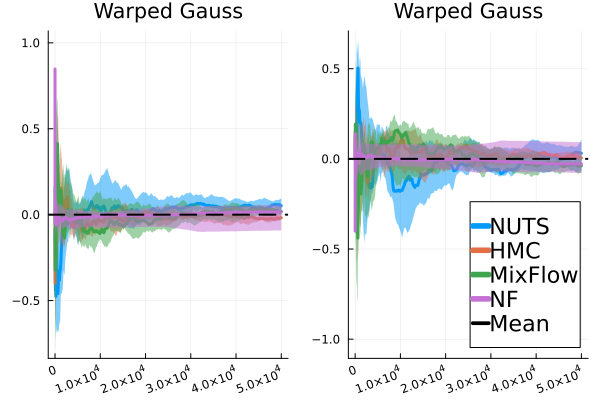
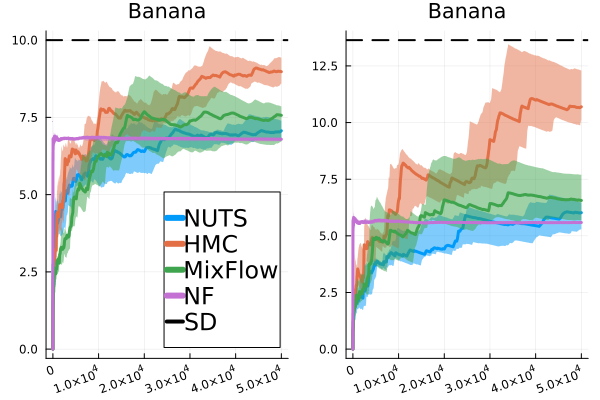
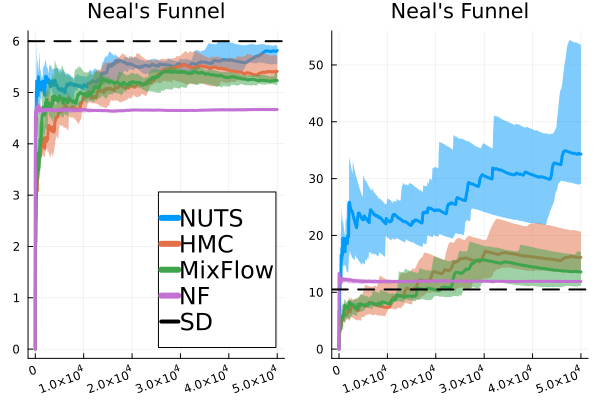
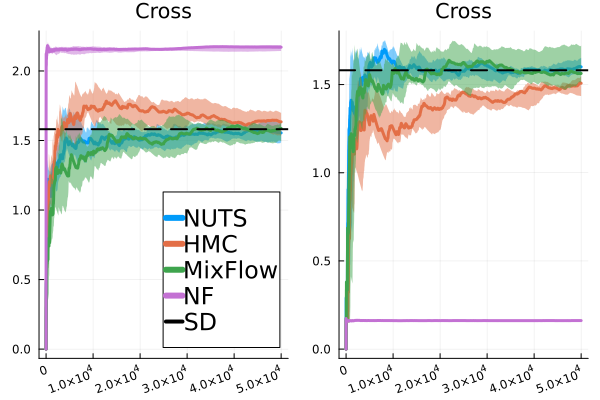
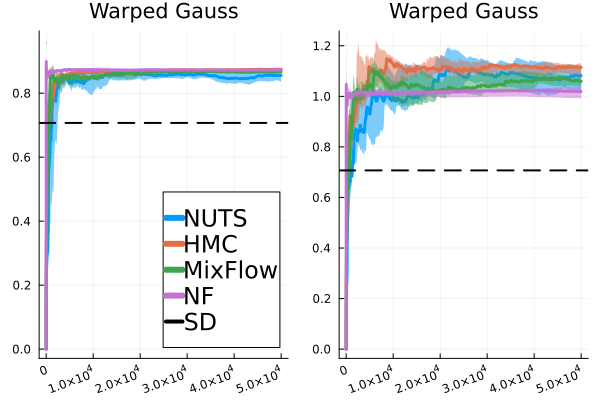
In this section, we provide additional comparisons of MixFlow against NUTS, HMC, NEO and a generic normalizing flow method—planar flow (NF) (Rezende & Mohamed, 2015b) on all four synthetic examples in Section E.2. For this set of experiments, all of the settings for MixFlow are the same as outlined in Section E.2. HMC uses the same leapfrog step size and number of leapfrogs steps (between refreshments) as MixFlow. For NF, Planar layers (Rezende & Mohamed, 2015b) that contain parameters to be optimized (9 parameters for each Planar layer of a -dimensional Planar flow) are used unless otherwise stated. We train NF using ADAM until convergence ( iterations except where otherwise noted) with the initial step size set to . And at each step, samples are used for gradient estimation. The initial distribution for MixFlow, NF and NUTS is set to be the mean-field Gaussian approximation, and HMC and NUTS are initialized using the learned mean of the mean-field Gaussian approximation. All parameters in NF are initialized using random samples from the standard Gaussian distribution.
Figure 11 compares the sliced log density of tuned MixFlow and the importance sampling proposal of tuned NEO, visualized in a similar fashion as Figure 1 in Section 6.1. It is clear that NEO does not provide a high-quality density approximation, while the log density of MixFlow visually matches the target. Indeed, unlike our method, due to the use of a nonequilibrium dynamic, NEO does not provide a similar convergence guarantee of its proposal distribution as simulation length increases.
Figure 12 presents comparisons of the marginal sample qualities of MixFlow to NUTS and NEO—both are exact MCMC methods. Results show that MixFlow produces comparable marginal sample quality, if not slightly better, than both MCMC methods. Note that it involves a nontrivial tuning process to achieve the displayed performance of NEO. Concrete tuning strategies are explained in the beginning of Appendix E. In fact, finding a good combination of discretization step, friction parameter, simulation length, and mass matrix of momentum distribution is necessary for NEO to behave reasonably; Table 4 summarizes the performance of NEO under various settings for both synthetic and real data experiments. The standard deviation of marginal sample KSD can change drastically across different settings, meaning that the marginal sample quality can be sensitive to the choice of hyperparameters. Moreover, due to the usage of an unstable Hamiltonian dynamics (with friction), one must choose hyperparameters carefully to avoid NaN values. The last column of Table 4 shows the number of hyperparameter combinations that lead to NaN values during sampling.
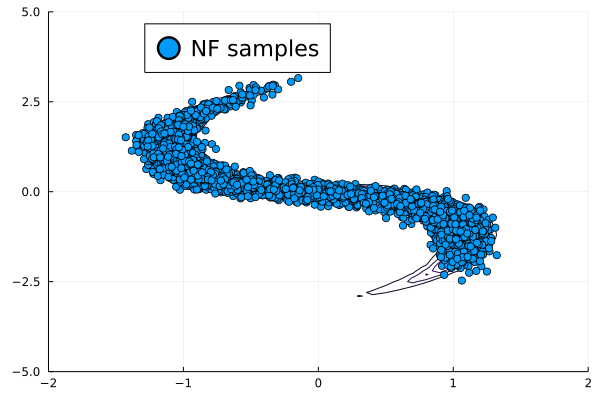
Figure 5(b) compares the joint ELBO values across various leapfrog step sizes for MixFlow against that of NF. We see that in all four examples, NF produces a smaller ELBO than MixFlow with a reasonable step size, which implies a lower quality target approximation. Indeed, Figure 13 shows that the trained NFs fail to capture the shape of the target distributions. Although one may expect the performance of NF to improve if it were given more layers, we will show that this is not the case in a later paragraph.
Figure 14(a) compares the sampling efficiency of MixFlow against NUTS, HMC, and NF. We see that MixFlow iid is the slowest, because each sample is generated by passing through the entire flow. However, we see that by taking all intermediate samples as in MixFlow single, we can generate samples just as fast as NUTS and HMC. On the other hand, while NF is fastest for sampling, it requires roughly minutes for training, which alone allows MixFlow single, NUTS, and HMC to generate over million samples in these examples. A more detailed discussion about this trade-off for NF is presented later.
Figure 14(b) further shows the computational efficiency in terms of effective samples size (ESS) per second. The smaller per second ESS of MixFlow iid is due to its slower sampling time. However, we emphasize that these samples are i.i.d.. NUTS overall achieves a higher per second ESS. NUTS is performant because of the much longer trajectories it produces (it only terminates once it detects a “U-turn”). This is actually an illustration of a limitation of the ESS per unit time as a measurement of performance. Because NUTS generates longer trajectories, it has a lower sample autocorrelation and a higher ESS; but Figure 15 shows that the actual estimation performance of NUTS is comparable to the other methods. Note that it is also possible to incorporate the techniques used in NUTS to our method, which we leave for future work.
As mentioned above, ESS mainly serves as a practical index for the relative efficiency of using a sequence of dependent samples, as opposed to independent samples, to estimate certain summary statistics of the target distribution. In this case, MixFlow single can be very useful. Figure 15 demonstrate the performance of MixFlow single, NUTS, HMC, and NF when estimating the coordinate-wise means and standard deviations (SD) of target distributions. We see that MixFlow single, NUTS, and HMC generally show similar performance in terms of convergence speed and estimation precision. While NF converges very quickly due to i.i.d. sampling, it does seem to struggle more at identifying the correct statistics, particularly the standard deviation, given its limited approximation quality. It is worth noting that, unlike MixFlow and general MCMC methods, sample estimates of target summaries obtained from NF are typically not asymptotically exact, as the sample quality is fundamentally limited by the choice of variational family and how well the flow is trained.
Finally, we provide an additional set of results for NF (Figure 16), examining its performance as we increase the number of planar layers (). All settings for NF are identical to the above, except that we increase the optimization iteration to to ensure the convergence of flows with increased numbers of layers. As demonstrated in the second and third column of Figure 16, both training time and sampling time scale with the number of layers roughly linearly. Although a trained NF is still generally faster in sample generation (see also Figure 14(a)), for these synthetic examples with -dimensional joint target distributions, training time can take up to minutes. More importantly, the corresponding target approximations of NF are still not as good as those of MixFlow in all four examples, even when we increase the number of layers to , which corresponds to optimizing parameters from the flow. One may also notice from Figure 16 that a more complex normalizing flow does not necessarily lead to better performance. This is essentially because the (usually non-convex) KL optimization problem of standard NF becomes more complex to solve as the flow becomes more flexible. As a result, even though theoretically, NF becomes more expressive with more layers, there is no guarantee on how well it approximates the target distribution. In contrast, MixFlow is optimization-free and is asymptotically exact—with a proper choice of hyper-parameter, more computation typically leads to better performance (Figure 5(b)). With the minutes training time of NF, MixFlow iid can generate i.i.d. samples and MixFlow single can generate over million samples, both of which are more than sufficient for most estimations under these target distributions.


E.5 Real data examples
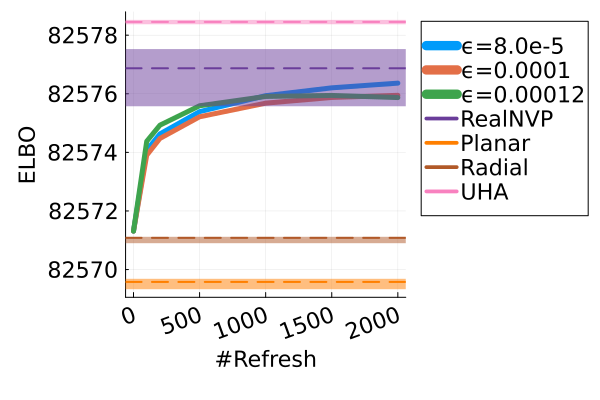
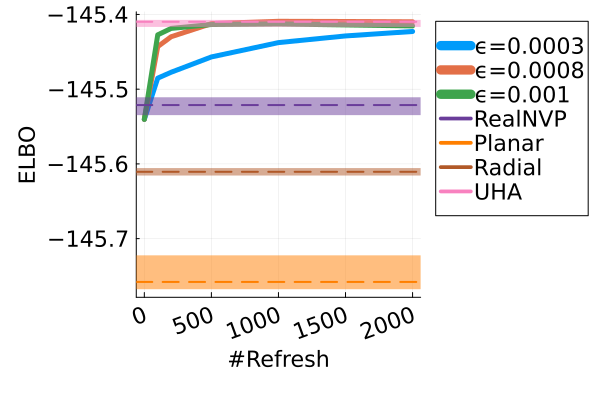
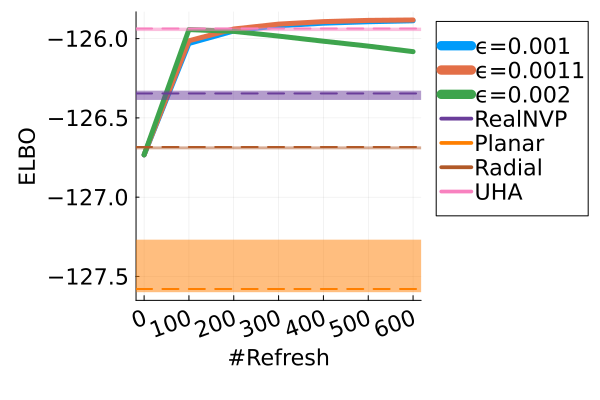
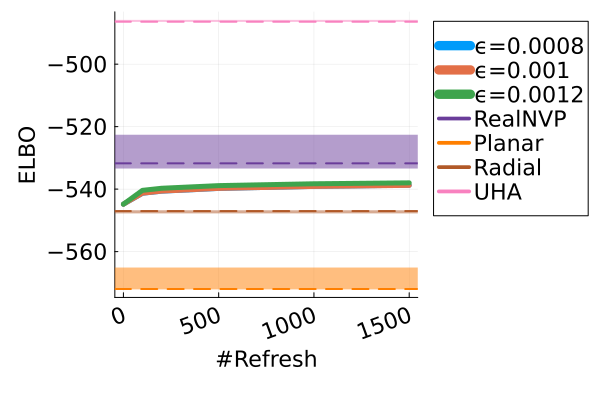
All settings for MixFlow, NUTS, NEO and HMC are identical to those in synthetic examples. All NFs are trained using ADAM for iterations with initial step size set to be . We remark that comparison NEO is not included for high dimensional sparse regression example—the most challenging example—due to its high consumption of RAM, which hits the ceiling of our computation resources. Overall we observe similar phenomenons as for synthetic examples Section E.2. Additionally, we include comparison to UHA on real data examples. The tuning procedure of UHA involves architectural search (i.e., leapfrog steps between refreshments, and number of refreshments), and hyperparameter optimization (i.e., leapfrog step size, and tempering path). We choose among the combination of several fixed architectural settings of leapfrog steps between refreshments (), and number of refreshment (), and optimize hyperparameters using ADAM for iterations (each gradient estimate is based on 5 independent samples); each setting is repeated for times. Table 5 presents median, IQR of the resulting ELBOs of UHA under different architectural settings. We pick the best settings for UHA based on the ELBO performance and compare UHA under the selected settings with our method in terms of target approximation quality and marginal sample quality. Both ELBO and KSD of UHA are estimated using samples.
Figure 17 offers a comparison of the ELBO performance between UHA and MixFlow. While MixFlow demonstrates similar or superior ELBO performance in the linear regression, logistic regression, student-t regression, and sparse regression problems, it is outperformed by UHA in the remaining three real data examples. The higher ELBO of UHA in these examples might be due to its incorporation of annealing, which facilitates exploration of complex target distributions. We leave studying the use of annealing in MixFlows to future work.
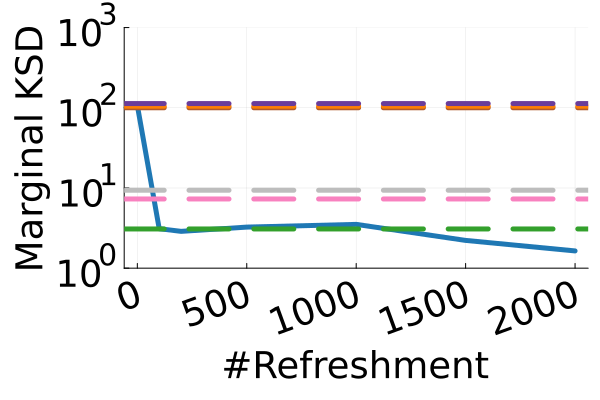
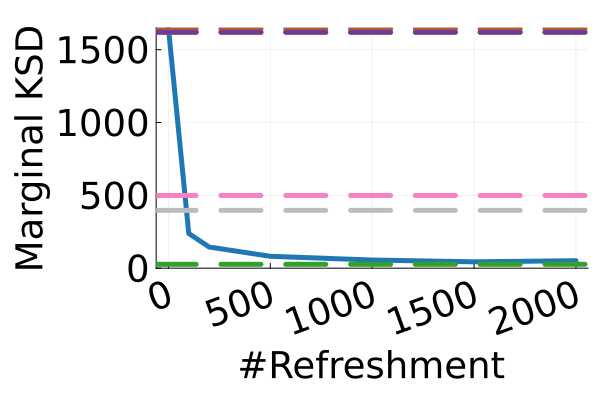
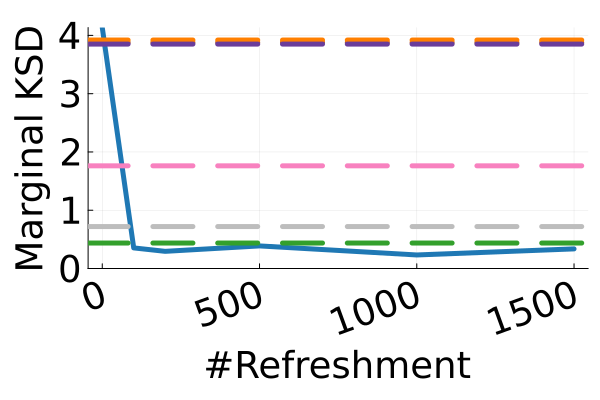
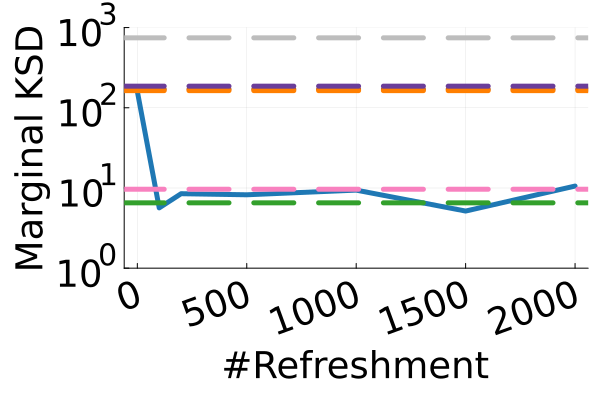
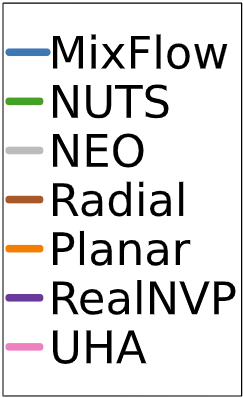
However, it is essential to note that for variational methods that augment the original target space, a higher ELBO does not necessarily equate to improved marginal sample quality. As demonstrated in Figure 18, the marginal sample quality of UHA, as evaluated by marginal KSD, is worse than that of MixFlow and the two Monte Carlo methods (NUTS and NEO), although it surpasses that of parametric flows (e.g. RealNVP).
It is also worth noting that tuning augmentation methods like UHA can be very expensive. For instance, in the Student-t regression problem, UHA required 20 minutes ( seconds) to run optimization steps, with each gradient estimated using 5 Monte Carlo samples. This is approximately 40 times slower than RealNVP, which required around 10 minutes for optimization steps with stochastic gradients based on 10 Monte Carlo samples. Conversely, evaluating one ELBO curve (averaged over independent trajectories) for MixFlow across six different flow lengths (i.e., flow length = 100, 200, 500, 1000, 1500, 2000) only took 8 minutes, while adapting NUTS with iterations was completed within a few seconds.
E.5.1 Bayesian linear regression
We consider two Bayesian linear regression problems, with both a standard normal prior and a heavy tail prior using two sets of real data. The two statistical models take the following form:
| (74) | ||||
| (75) |
where is the response and is the feature vector for data point . For linear regression problem with a normal prior, we use the Boston housing prices dataset (Harrison Jr. & Rubinfeld, 1978). Dataset available in the MLDatasets Julia package at https://github.com/JuliaML/MLDatasets.jl. containing suburbs/towns in the Boston area; the goal is to use suburb information to predict the median house price. We standardize all features and responses. For linear regression with a heavy-tail prior, we use the communities and crime dataset (U.S. Department of Justice Federal Bureau of Investigation, 1995), available at http://archive.ics.uci.edu/ml/datasets/Communities+and+Crime. The original dataset contains attributes that potentially connect to crime; the goal is to predict per-capita violent crimes using the information of the community, such as the median family income, per capita number of poluce officers, and etc. For the data preprocessing, we drop observations with missing values, and using Principle component analysis for feature dimension reduction; we selected principal components with leading eigenvalues. The posterior dimensions of the two linear regression inference problems are and , repsectively.
E.5.2 Bayesian generalized linear regression
We then consider two Bayesian generalized linear regression problems—a hierachical logistic regression and a poisson regression:
| Logis. Reg.: | (76) | |||
| (77) | ||||
| Poiss. Reg.: | (78) | |||
| (79) |
For logistic regression, we use a bank marketing dataset (Moro et al., 2014) downsampled to data points. Original dataset is available at https://archive.ics.uci.edu/ml/datasets/bank+marketing. the goal is to use client information to predict whether they subscribe to a term deposit. We include 8 features from the bank marketing dataset (Moro et al., 2014): client age, marital status, balance, housing loan status, duration of last contact, number of contacts during campaign, number of days since last contact, and number of contacts before the current campaign. For each of the binary variables (marital status and housing loan status), all unknown entries are removed. All features of the dataset are also standardized. Hence the posterior dimension of the logistic regression problem is and the overall state dimension of the logistic regression inference problems are 19.
For Poisson regression problem, we use an airport delays dataset with features and data points (subsampled), resulting a -dimensional posterior distribution. The airport delays dataset was constructed using flight delay data from http://stat-computing.org/dataexpo/2009/the-data.html and historical weather information from https://www.wunderground.com/history/. relating daily weather information to the number of flights leaving an airport with a delay of more than 15 minutes. All features are standardized as well.
E.5.3 Bayesian Student-t regression
We also consider a Bayesian Student-t regression problem, of which the posterior distribution is heavy-tail. The Student-t regression model is as follows:
| (80) |
In this example, we use the creatinine dataset (Liu & Rubin, 1995), containing a clinical trial on male patients with covariates. Original dataset is available in https://github.com/faosorios/heavy/blob/master/data/creatinine.rda. The 3 covariates consist of body weight in kg(WT), serum creatininte concentration (SC), and age in years. The goal is to predict the endogenous cretinine clearance (CR) using these covariates. We apply the data transformation recommended by Liu & Rubin (1995) by transferring response into , and transferring covariats into , , .
E.5.4 Bayesian sparse regression
Finally, we compare the methods on the Bayesian sparse regression problem applied to two datasets: a prostate cancer dataset containing covariates and observations, and a superconductivity dataset (Hamidieh, 2018), containing features and observations (subsampled). The prostate cancer dataset is available at https://hastie.su.domains/ElemStatLearn/datasets/prostate.data. The superconductivity dataset is available at https://archive.ics.uci.edu/ml/datasets/superconductivty+data. The model is as follows:
| (81) | |||
| (82) |
For both two datasets, we set . The resulting posterior dimension for both datasets are and respectively. When data information is weak, the posterior distribution in this model typically contains multiple modes (Xu & Campbell, 2022). We standardize the covariates during the preprocessing procedure for both datasets.
E.5.5 Additional experiment for real data examples
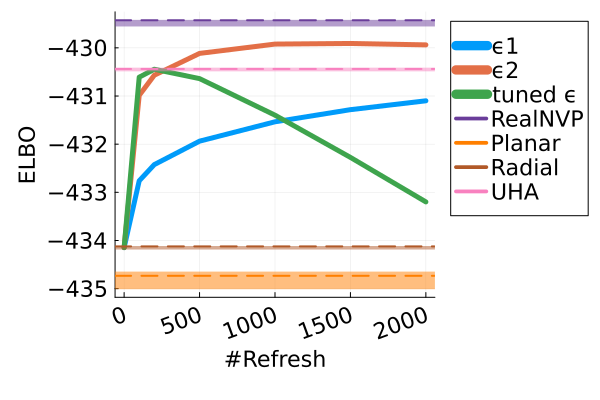
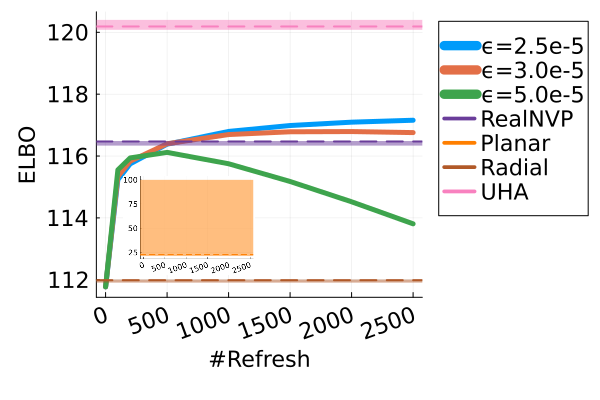
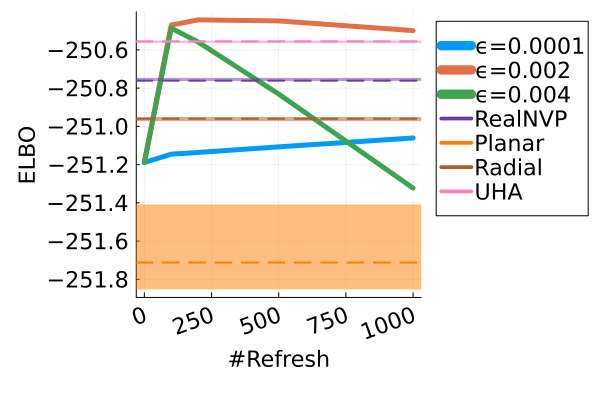
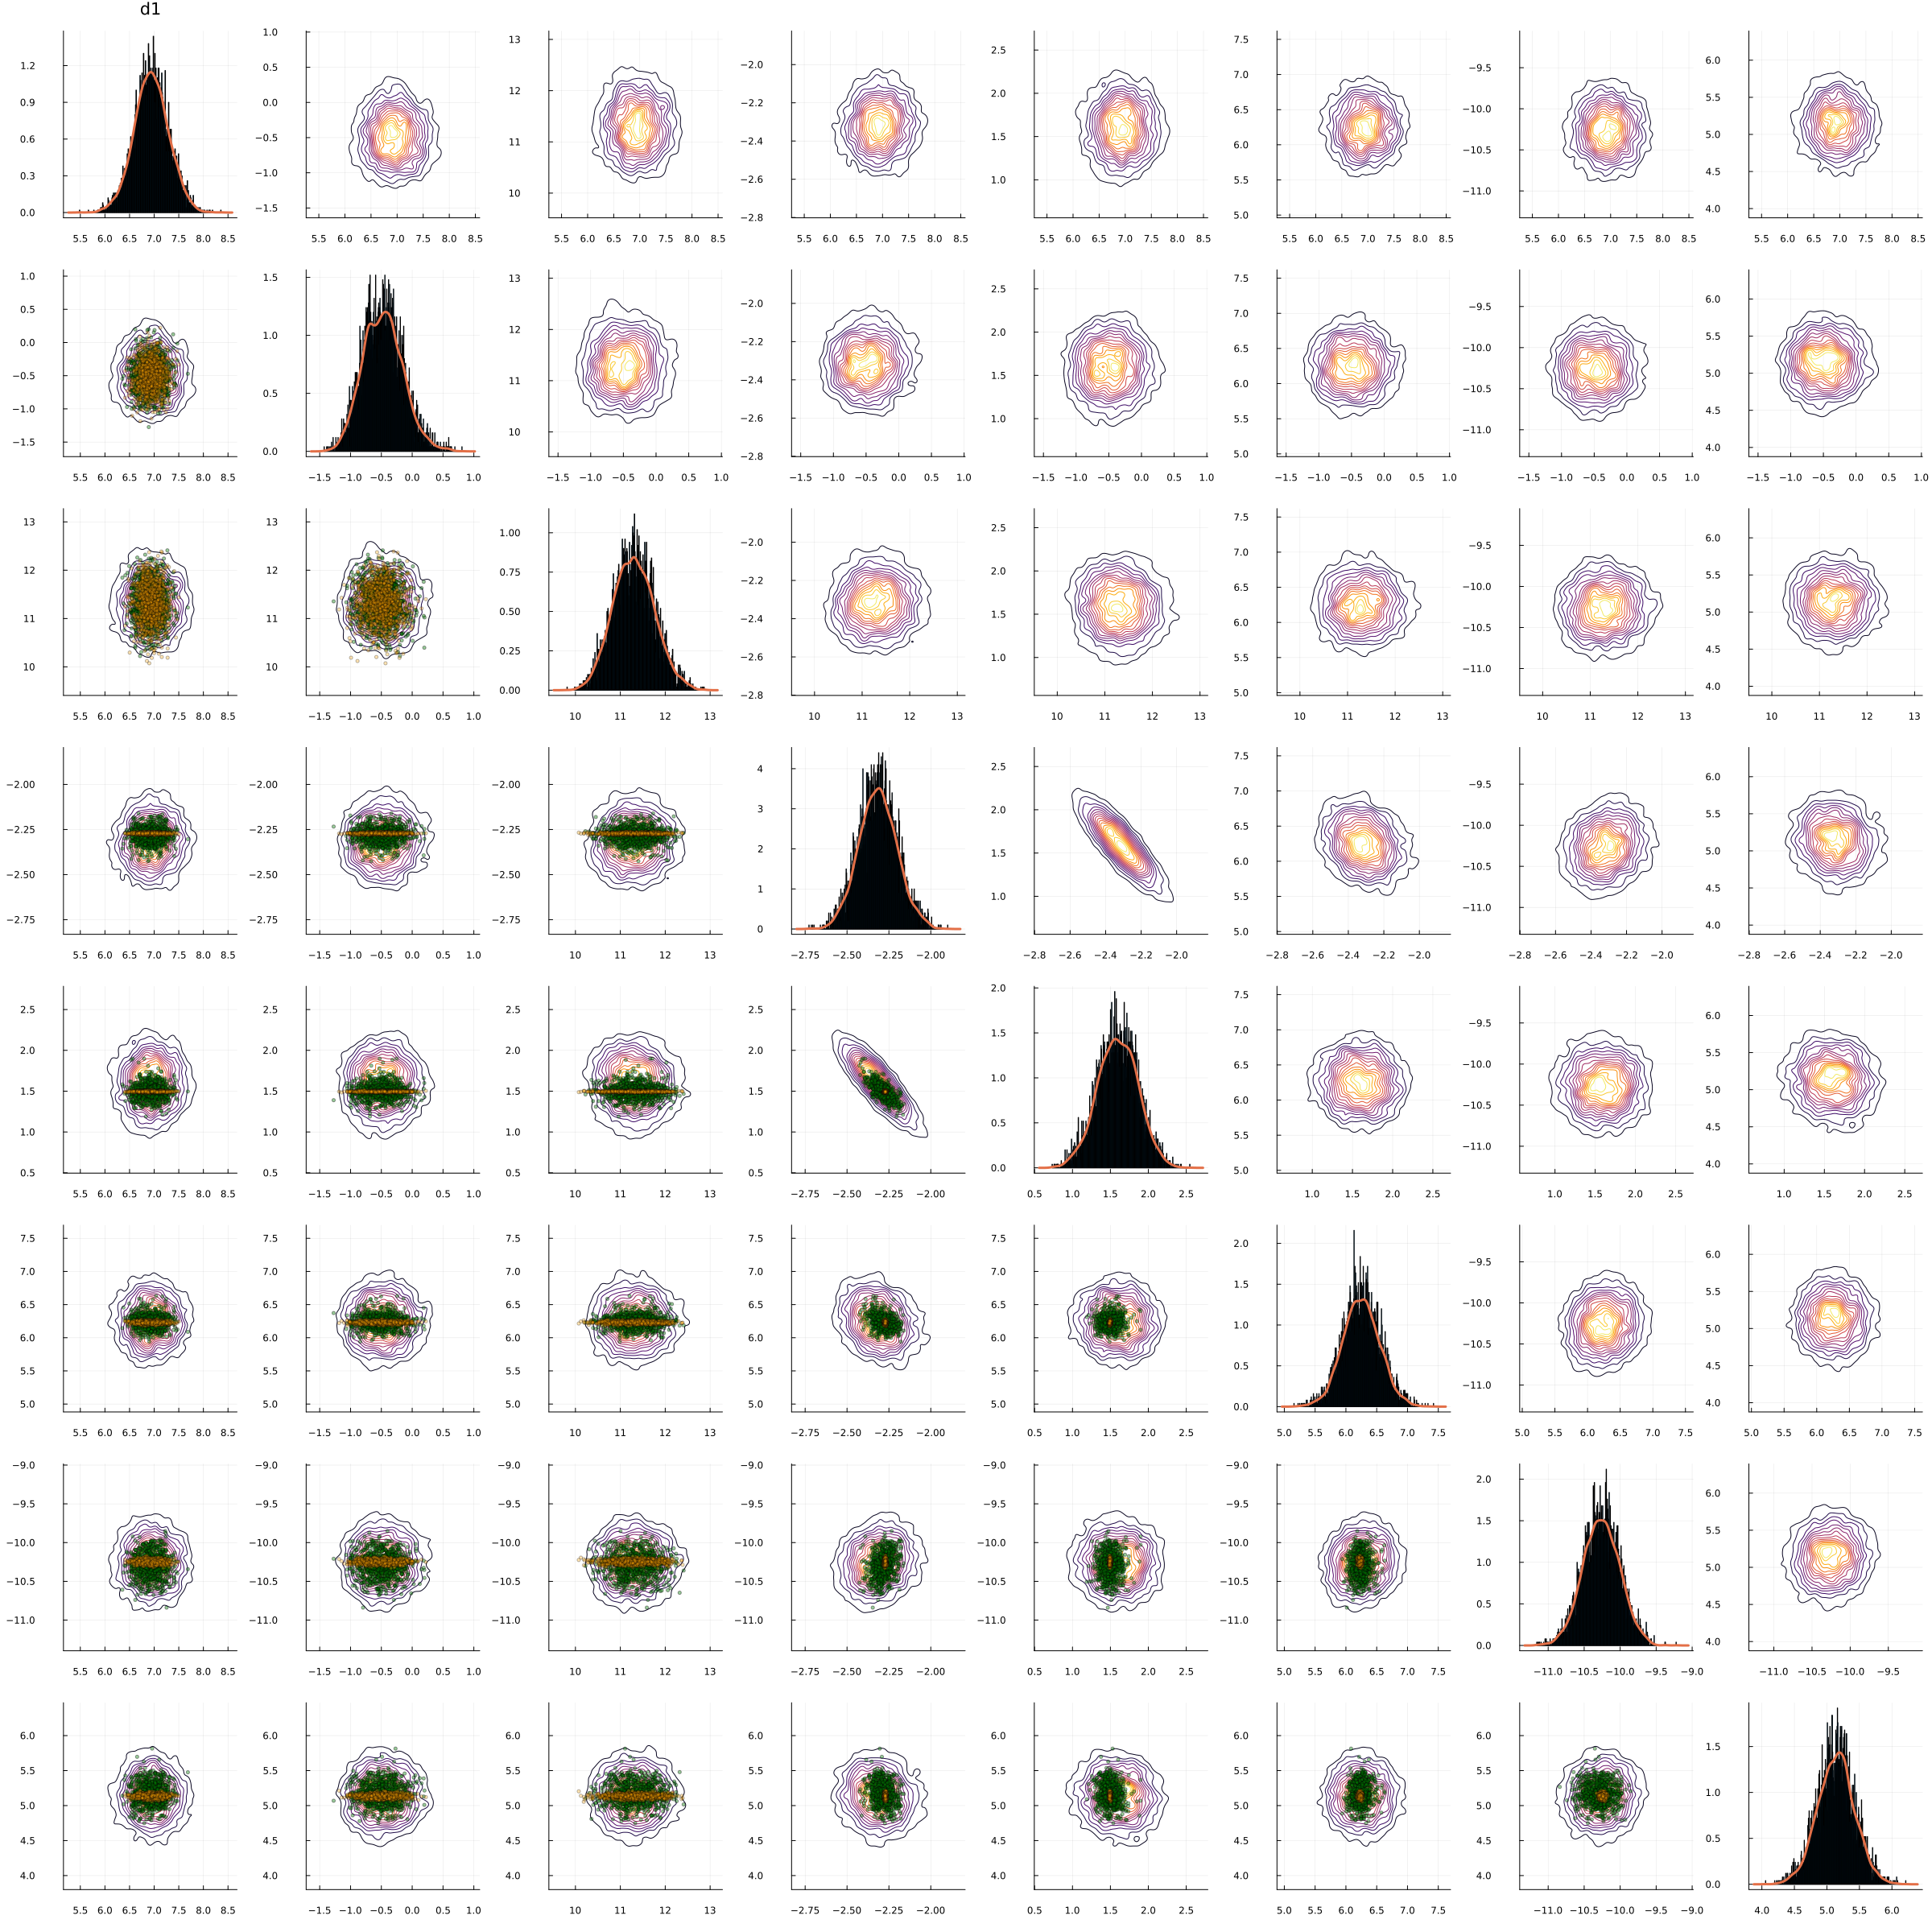
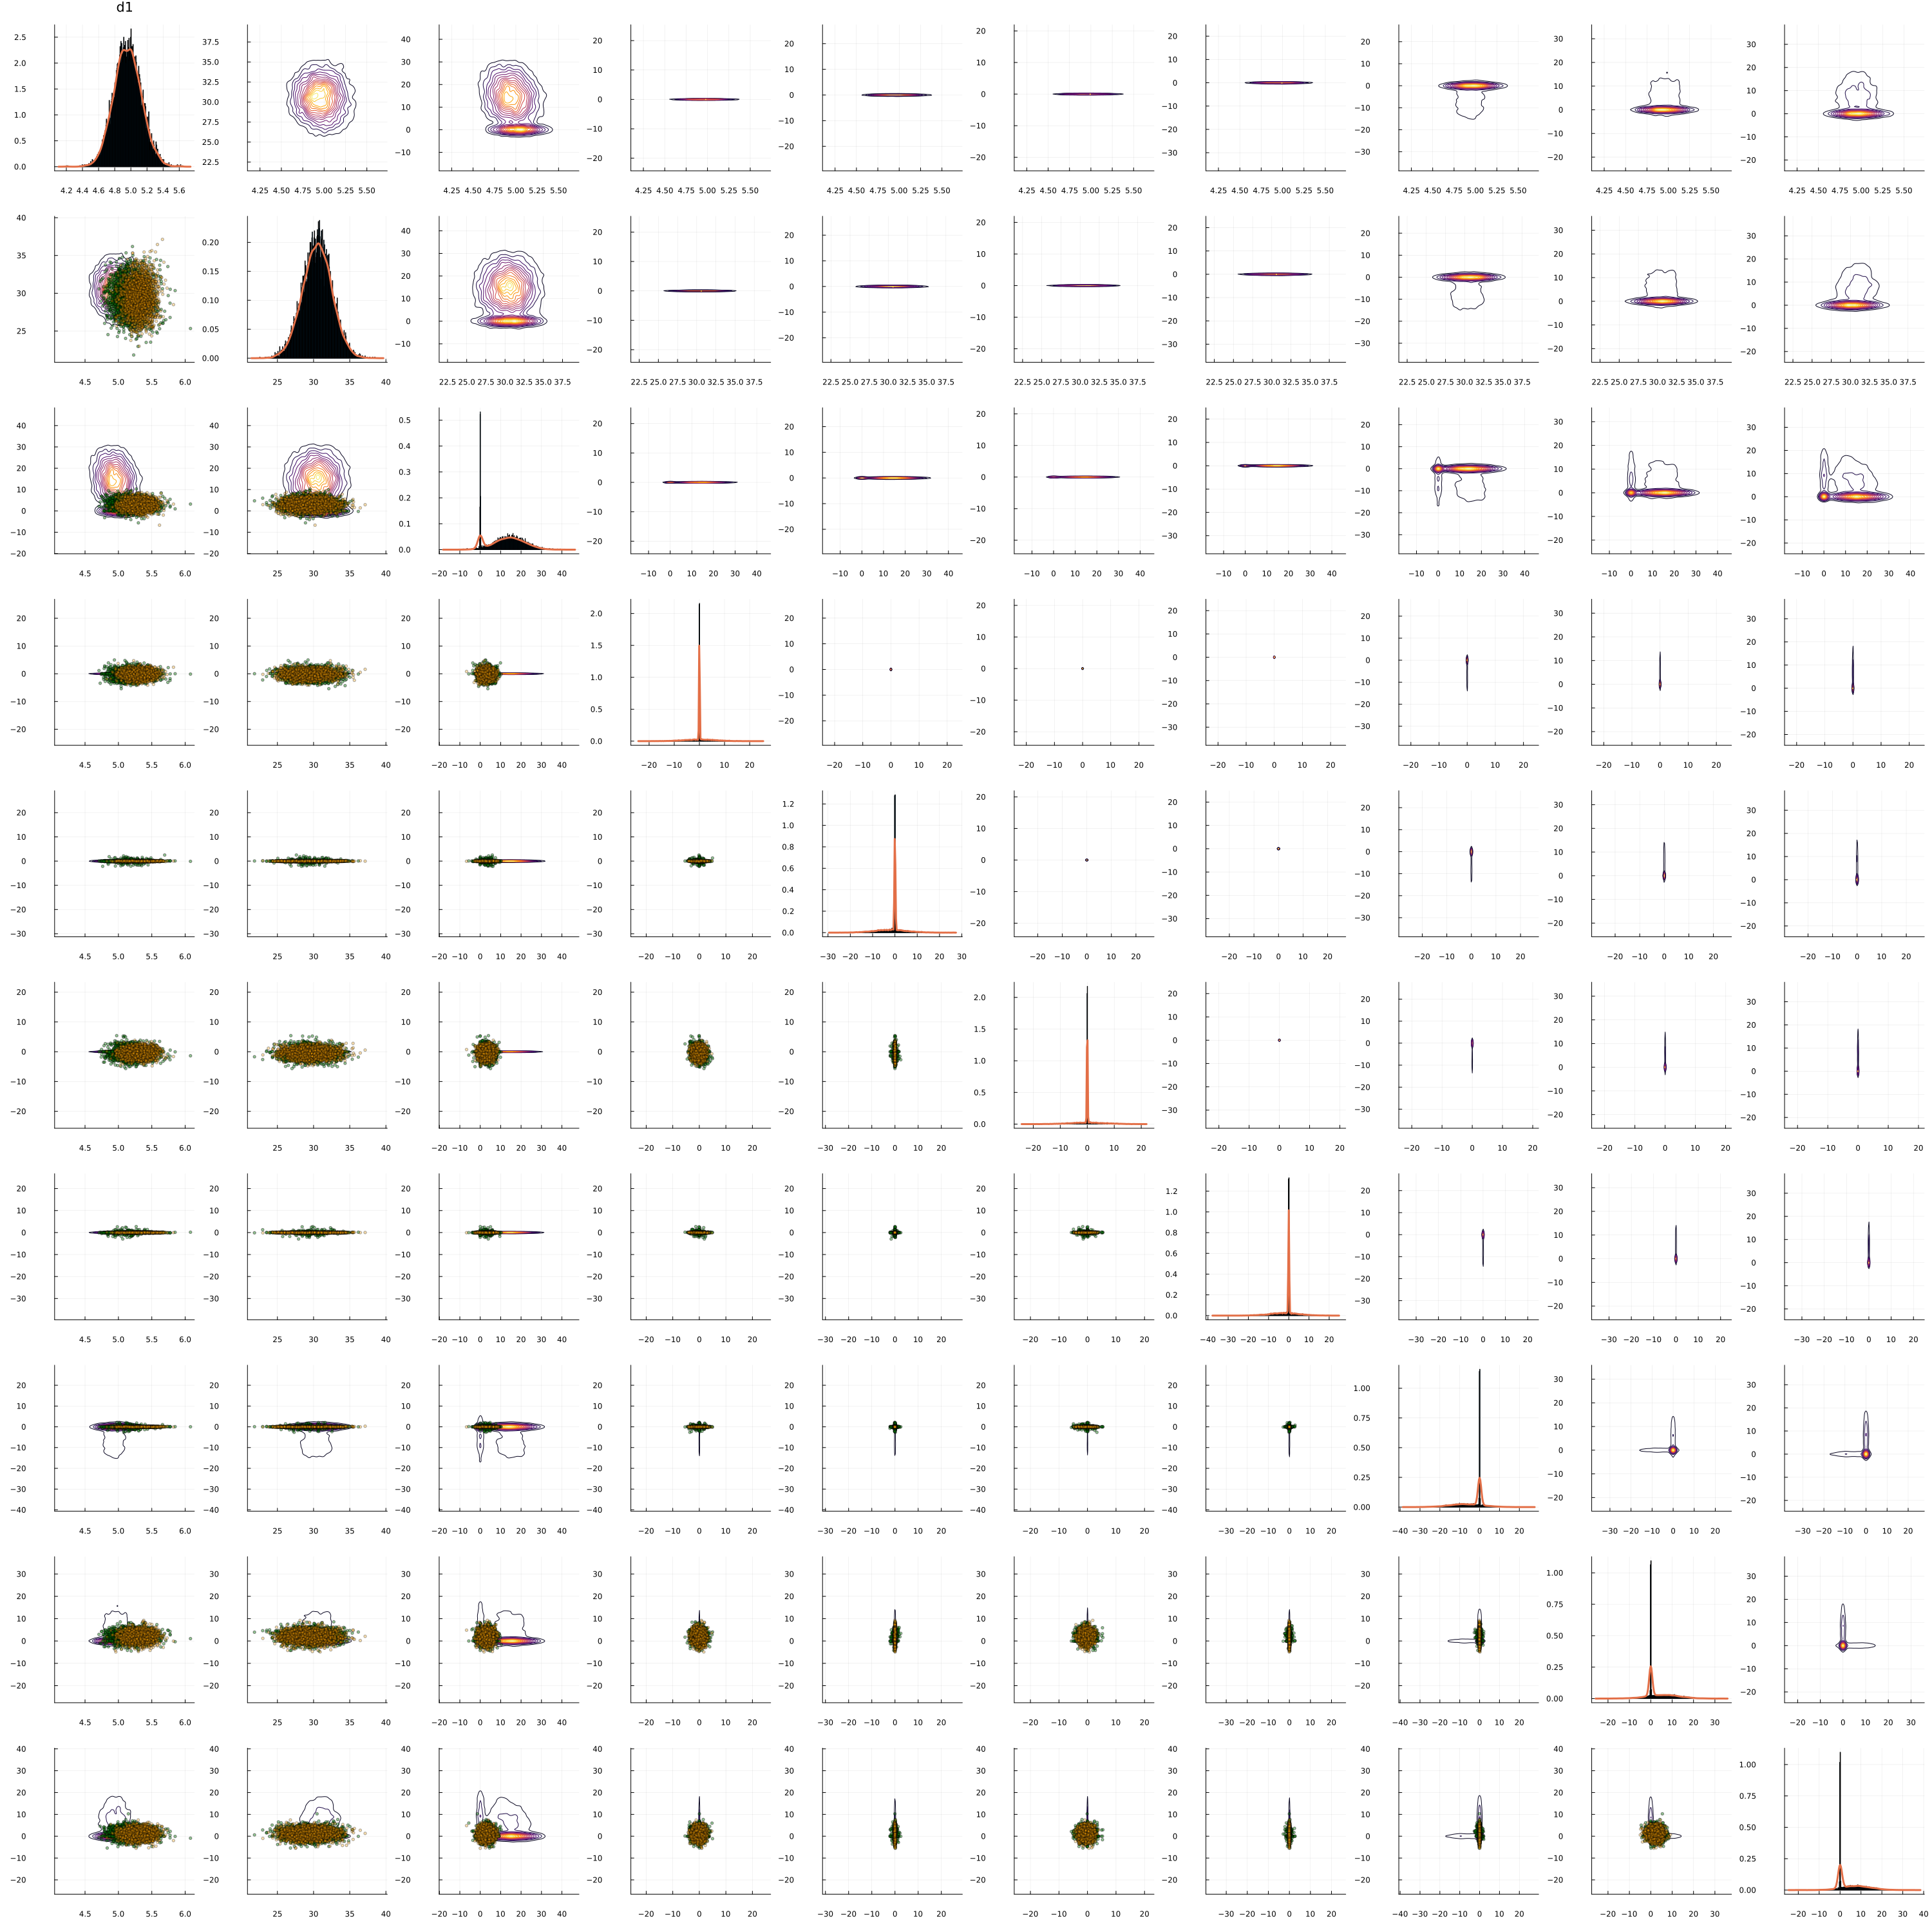
| MixFlow | |||||
| STEPSIZE | #LEAPFROG | #REFRESHMENT | ELBO | #SAMPLE | |
| Lin Reg | 0.0005 | 30 | 2000 | -429.98 | 1000 |
| Lin Reg Heavy | 0.000025 | 50 | 2500 | 117.1 | 1000 |
| Log Reg | 0.002 | 50 | 1500 | -250.5 | 1000 |
| Poiss Reg | 0.0001 | 50 | 2000 | 82576.9 | 1000 |
| Student t Reg | 0.0008 | 80 | 2000 | -145.41 | 1000 |
| Sparse Reg | 0.001 | 30 | 600 | -125.9 | 1000 |
| Sparse Reg High Dim | 0.0012 | 50 | 2000 | -538.36 | 2000 |
| RealNVP | |||||
| #LAYER | #HIDDEN | MEDIAN | IQR | #NAN | |
| Lin Reg | 5 | 15 | -429.43 | (-429.56, -429.42) | 0 |
| Lin Reg | 10 | 15 | -429.41 | (-429.43, -429.36) | 1 |
| Lin Reg Heavy | 5 | 52 | 116.47 | (116.34, 116.49) | 0 |
| Lin Reg Heavy | 8 | 52 | 116.65 | (116.56, 116.73) | 3 |
| Lin Reg Heavy | 10 | 52 | 116.26 | (116.11,116.41) | 3 |
| Log Reg | 5 | 9 | -250.76 | (-250.76, -250.75) | 3 |
| Log Reg | 8 | 9 | -250.65 | (-250.75, -250.64) | 2 |
| RealNVP | |||||
| #LAYER | #HIDDEN | MEDIAN | IQR | #NAN | |
| Poiss Reg | 3 | 16 | 82576.87 | (82575.57, 82577.53) | 1 |
| Poiss Reg | 5 | 16 | 82580.77 | (82580.13, 82583.72) | 2 |
| Poiss Reg | 8 | 16 | N/A | N/A | 5 |
| Student t Reg | 5 | 4 | -145.52 | (-145.53, -145.51) | 0 |
| Student t Reg | 10 | 4 | -145.52 | (-145.52, -145.49) | 0 |
| RealNVP | |||||
| #LAYER | #HIDDEN | MEDIAN | IQR | #NAN | |
| Sparse Reg | 5 | 10 | -126.33 | (-126.36, -126.32) | 0 |
| Sparse Reg | 8 | 10 | -126.35 | (-126.36, -126.33) | 1 |
| Sparse Reg High Dim | 5 | 20 | -531.75 | (-533.41, -522.60) | 0 |
| Sparse Reg High Dim | 8 | 20 | N/A | N/A | 5 |
| MixFlow | |||||
| STEPSIZE | #LEAPFROG | #REFRESHMENT | ELBO | #SAMPLE | |
| Lin Reg | 0.0005 | 30 | 2000 | -429.98 | 1000 |
| Lin Reg Heavy | 2.50E-05 | 50 | 2500 | 117.1 | 1000 |
| Log Reg | 0.002 | 50 | 1500 | -250.5 | 1000 |
| Poiss Reg | 0.0001 | 50 | 2000 | 82576.9 | 1000 |
| Student t Reg | 0.0008 | 80 | 2000 | -145.41 | 1000 |
| Sparse Reg | 0.001 | 30 | 600 | -125.9 | 1000 |
| Sparse Reg High Dim | 0.0012 | 50 | 2000 | -538.36 | 2000 |
| PlanarFlow | |||||
| #LAYER | MEDIAN | IQR | #NAN | ||
| Lin Reg | 5 | -434.73 | (-435.01, -434.65) | 0 | |
| Lin Reg | 10 | -438.79 | (-439.25, -436.77) | 0 | |
| Lin Reg | 20 | -442.4384675 | (-444.64, -440.93) | 0 | |
| Lin Reg Heavy | 5 | 79.65 | (-75.92, 99.10) | 0 | |
| Lin Reg Heavy | 10 | 23.13 | ( 21.29, 100.10) | 0 | |
| Lin Reg Heavy | 20 | -879.1909019 | (-1641.19, -392.80) | 0 | |
| Log Reg | 5 | -251.71 | (-251.85, -251.41) | 0 | |
| Log Reg | 10 | -251.8 | (-252.03, -251.80) | 0 | |
| Log Reg | 20 | -252.0937812 | (-252.20, -251.93) | 0 | |
| PlanarFlow | |||||
| #LAYER | MEDIAN | IQR | #NAN | ||
| Poiss Reg | 5 | 82569.58 | (82569.33, 82569.68) | 0 | |
| Poiss Reg | 10 | 82568.49 | (82568.12, 82569.57) | 0 | |
| Poiss Reg | 20 | 82566.40441 | (82552.57, 82568.05) | 2 | |
| Student t Reg | 5 | -145.69 | (-145.71, -145.64) | 0 | |
| Student t Reg | 10 | -145.72 | (-145.73, -145.69) | 0 | |
| Student t Reg | 20 | -145.7579931 | (-145.77, -145.72) | 0 | |
| PlanarFlow | |||||
| #LAYER | MEDIAN | IQR | #NAN | ||
| Sparse Reg | 5 | -127.58 | (-127.60, -127.42) | 0 | |
| Sparse Reg | 10 | -127.75 | (-127.87, -127.68) | 0 | |
| Sparse Reg | 20 | -127.6677415 | (-128.48, -127.65) | 0 | |
| Sparse Reg High Dim | 5 | -571.97 | (-572.09, -565.10) | 0 | |
| Sparse Reg High Dim | 10 | -571.7 | (-573.22, -565.55) | 0 | |
| Sparse Reg High Dim | 20 | -577.1338885 | (-580.30, -569.39) | 0 | |
| MixFlow | |||||
| STEPSIZE | #LEAPFROG | #REFRESHMENT | ELBO | #SAMPLE | |
| Lin Reg | 0.0005 | 30 | 2000 | -429.98 | 1000 |
| Lin Reg Heavy | 2.50E-05 | 50 | 2500 | 117.1 | 1000 |
| Log Reg | 0.002 | 50 | 1500 | -250.5 | 1000 |
| Poiss Reg | 0.0001 | 50 | 2000 | 82576.9 | 1000 |
| Student t Reg | 0.0008 | 80 | 2000 | -145.41 | 1000 |
| Sparse Reg | 0.001 | 30 | 600 | -125.9 | 1000 |
| Sparse Reg High Dim | 0.0012 | 50 | 2000 | -538.36 | 2000 |
| RadialFlow | |||||
| #LAYER | MEDIAN | IQR | #NAN | ||
| Lin Reg | 5 | -434.14 | (-434.36, -434.12) | 0 | |
| Lin Reg | 10 | -434.12 | (-434.19, -434.12) | 0 | |
| Lin Reg | 20 | -433.82 | (-434.21, -433.73) | 0 | |
| Lin Reg Heavy | 5 | 111.99 | (111.91, 112.01) | 0 | |
| Lin Reg Heavy | 10 | 111.99 | (111.89 , 112.00) | 0 | |
| Lin Reg Heavy | 20 | 111.7 | (111.61, 111.71) | 0 | |
| Log Reg | 5 | -251.33 | (-251.49, -251.31) | 0 | |
| Log Reg | 10 | -251.17 | (-251.21 , -251.06) | 0 | |
| Log Reg | 20 | -250.96 | (-250.97, -250.95) | 0 | |
| RadialFlow | |||||
| #LAYER | MEDIAN | IQR | #NAN | ||
| Poiss Reg | 5 | 82570.5 | (82570.19, 82570.57) | 0 | |
| Poiss Reg | 10 | 82571.02 | (82570.76 , 82571.05) | 0 | |
| Poiss Reg | 20 | 82571.08 | (82570.90, 82571.12) | 0 | |
| Student t Reg | 5 | -145.61 | (-145.62, -145.61) | 0 | |
| Student t Reg | 10 | -145.59 | (-145.60, -145.59) | 0 | |
| Student t Reg | 20 | -145.58 | (-145.60, -145.57) | 0 | |
| RadialFlow | |||||
| #LAYER | MEDIAN | IQR | #NAN | ||
| Sparse Reg | 5 | -127.28 | (-127.37, -127.27) | 0 | |
| Sparse Reg | 10 | -127 | ( -127.03, -126.88) | 0 | |
| Sparse Reg | 20 | -126.68 | ( -126.69, -126.61) | 0 | |
| Sparse Reg High Dim | 5 | -548.05 | (-548.54, -547.98) | 0 | |
| Sparse Reg High Dim | 10 | -547.2 | (-547.74, -547.16) | 0 | |
| Sparse Reg High Dim | 20 | -547.03 | (-547.78, -546.76) | 0 | |
| MIXFLOW KSD | MIN. KSD | AVG. KSD | SD. KSD | #FAIL | |
|---|---|---|---|---|---|
| banana | 0.06 | 0.06 | 1.3 | 1.69 | 7/24 |
| cross | 0.13 | 0.11 | 2.78 | 3.09 | 12/24 |
| Neal’s funnel | 0.04 | 0.04 | 0.76 | 1.84 | 6/24 |
| warped Gaussian | 0.15 | 0.23 | 0.55 | 0.25 | 0/14 |
| linear regression | 1.64 | 9.37 | 143.56 | 84.16 | 18/24 |
| linear regression (heavy tail) | 51.43 | 396.97 | 1589.71 | 599.47 | 18/24 |
| logistic regression | 0.34 | 0.72 | 19.28 | 11.7 | 18/24 |
| Poisson regression | 10.57 | 639.08 | 1642.81 | 670.8 | 18/24 |
| t regression | 0.11 | 0.15 | 4.79 | 5.03 | 12/24 |
| sparse regression | 0.44 | 1.26 | 43.83 | 25.58 | 18/24 |
| #LFRG | #REF | MEDIAN | IQR | #SAMPLE | |
|---|---|---|---|---|---|
| Lin Reg | 10 | 5 | -430.438 | (-430.488, -430.411) | 5000 |
| Lin Reg | 20 | 5 | -430.589 | (-430.596, -430.541) | 5000 |
| Lin Reg | 50 | 5 | -432.215 | (-432.268, -432.146) | 5000 |
| Lin Reg | 10 | 10 | -430.468 | (-430.511, -430.457) | 5000 |
| Lin Reg | 20 | 10 | -431.404 | (-431.441, -431.202) | 5000 |
| Lin Reg | 50 | 10 | -432.462 | (-432.56, -432.327) | 5000 |
| Lin Reg Heavy | 10 | 5 | 120.188 | (120.08, 120.401) | 5000 |
| Lin Reg Heavy | 20 | 5 | 119.126 | (118.806, 119.796) | 5000 |
| Lin Reg Heavy | 50 | 5 | 119.134 | (118.994, 119.247) | 5000 |
| Lin Reg Heavy | 10 | 10 | 118.222 | (118.125, 118.245) | 5000 |
| Lin Reg Heavy | 20 | 10 | 118.191 | (118.151, 118.202) | 5000 |
| Lin Reg Heavy | 50 | 10 | 118.059 | (117.718, 118.175) | 5000 |
| Log Reg | 10 | 5 | -250.588 | (-250.607, -250.553) | 5000 |
| Log Reg | 20 | 5 | -250.555 | (-250.565, -250.551) | 5000 |
| Log Reg | 50 | 5 | -250.601 | (-250.64, -250.567) | 5000 |
| Log Reg | 10 | 10 | -250.643 | (-250.662, -250.584) | 5000 |
| Log Reg | 20 | 10 | -250.578 | (-250.615, -250.563) | 5000 |
| Log Reg | 50 | 10 | -250.913 | (-251.006, -250.839) | 5000 |
| Poiss Reg | 10 | 5 | 82578.439 | (82578.43, 82578.459) | 5000 |
| Poiss Reg | 20 | 5 | 82578.453 | (82578.372, 82578.522) | 5000 |
| Poiss Reg | 50 | 5 | 82578.421 | (82578.342, 82578.465) | 5000 |
| Poiss Reg | 10 | 10 | 82578.45 | (82578.435, 82578.488) | 5000 |
| Poiss Reg | 20 | 10 | 82578.449 | (82578.368, 82578.458) | 5000 |
| Poiss Reg | 50 | 10 | 82578.369 | (82578.322, 82578.414) | 5000 |
| Student t Reg | 10 | 5 | -145.46 | (-145.461, -145.438) | 5000 |
| Student t Reg | 20 | 5 | -145.424 | (-145.451, -145.423) | 5000 |
| Student t Reg | 50 | 5 | -145.427 | (-145.43, -145.421) | 5000 |
| Student t Reg | 10 | 10 | -145.441 | (-145.454, -145.404) | 5000 |
| Student t Reg | 20 | 10 | -145.439 | (-145.466, -145.411) | 5000 |
| Student t Reg | 50 | 10 | -145.41 | (-145.417, -145.407) | 5000 |
| Sparse Reg | 10 | 5 | -125.936 | (-125.953, -125.931) | 5000 |
| Sparse Reg | 20 | 5 | -125.954 | (-125.981, -125.944) | 5000 |
| Sparse Reg | 50 | 5 | -126.279 | (-126.28, -126.226) | 5000 |
| Sparse Reg | 10 | 10 | -125.978 | (-125.988, -125.931) | 5000 |
| Sparse Reg | 20 | 10 | -126.032 | (-126.057, -125.961) | 5000 |
| Sparse Reg | 50 | 10 | -126.557 | (-126.559, -126.525) | 5000 |
| Sparse Reg High Dim | 10 | 5 | -501.201 | (-501.201, -500.778) | 5000 |
| Sparse Reg High Dim | 20 | 5 | -499.467 | (-499.471, -499.387) | 5000 |
| Sparse Reg High Dim | 50 | 5 | -498.968 | (-499.001, -498.656) | 5000 |
| Sparse Reg High Dim | 10 | 10 | -488.7 | (-488.799, -488.561) | 5000 |
| Sparse Reg High Dim | 20 | 10 | -487.216 | (-487.662, -487.042) | 5000 |
| Sparse Reg High Dim | 50 | 10 | -486.423 | (-486.477, -485.83) | 5000 |