Model-based assessment of the risks of viral transmission in non-confined crowds
Abstract
This work assesses the risks of Covid-19 spread in diverse daily-life situations involving crowds of maskless pedestrians, mostly outdoors. More concretely, we develop a method to infer the global number of new infections from patchy observations, by coupling ad hoc spatial models for disease transmission via respiratory droplets to detailed field-data about pedestrian trajectories and orientations. This allows us to rank the investigated situations by the infection risks that they present; importantly, the obtained hierarchy of risks is very largely conserved across transmission models: Street cafés present the largest average rate of new infections caused by an attendant, followed by busy outdoor markets, and then metro and train stations, whereas the risks incurred while walking on fairly busy streets are comparatively quite low. While our models only approximate the actual transmission risks, their converging predictions lend credence to these findings. In situations with a moving crowd, density is the main factor influencing the estimated infection rate. Finally, our study explores the efficiency of street and venue redesigns in mitigating the viral spread: While the benefits of enforcing one-way foot traffic in (wide) walkways are unclear, changing the geometry of queues substantially affects disease transmission risks.
keywords:
Covid-19 , Viral transmission , Pedestrian crowds , Epidemiology[iLM]organization=Institut Lumière Matière, CNRS & Université Claude Bernard Lyon 1,city=Villeurbanne, postcode=F-69622, country=France
[IMAG]organization=Institut Montpelliérain Alexander Grothendieck, CNRS, University of Montpellier,city=Montpellier, postcode=F-34095, country=France
[ENTPE]organization=École nationale des travaux publics de l’État (ENTPE), Université de Lyon,city=Vaulx-en-Velin, postcode=F-69518, country=France
1 Introduction
Efficient collective action to curb the spread of epidemics in general, and of the current Covid-19 pandemic in particular, requires input from a variety of disciplinary fields, from microscale fluid dynamics (to understand the propagation of virus or bacteria-laden droplets [1, 2]) to macroscale epidemiology. At present, the weak link between these two scales hinders the prediction of how the SARS-CoV-2 virus at the origin of the pandemic spreads in a given crowd.
Gatherings of people are encountered both in enclosed spaces (such as restaurants, offices, private accommodation or fitness centers), where statistical data may be insightful a posteriori from an epidemiological standpoint [3, 4, 5, 6], as well as in non-confined environments. Most Covid-19 oubreaks are certainly associated with indoor settings [7], but nonetheless a minority of infections – at least a few percent, as a tentative estimate [8, 5, 9, 6] – reportedly originate outdoors (e.g., in beer gardens [10] and other outdoor gatherings [7], during casual friendly encounters [6], or while jogging [11]) or in mixed indoor/outdoor settings (e.g., on building sites [12]). Despite their secondary role, viral transmissions amidst outdoor crowds may change the fate of an epidemic when the effective reproduction number is close to unity. Moreover, they raise a specific challenge because they are inherently hard to trace and document, but also hard to circumscribe, as they bring together unrelated people222As of March 2021, more than on third of new cases in France were wholly unaware of how they were infected [6].. These difficulties are a hurdle to the control of outbreaks.
Accordingly, recommendations to wear a face covering outside have been issued far and wide. Some cities in China, France, part of Germany, Italy, Poland, Portugal, Singapore, South Korea, Spain, some Swiss cantons, and a number of US states, among others, have put in place mask mandates for some, or all, outdoor activities. Let us say from the outset that mask-related policies may have a broader impact than their chief purpose of physically warding off infections [13, 14, 15]: Widespread usage of face coverings attracts every one’s attention to the health situation and may thus promote stronger vigilance and abiding by other sanitary measures. Furthermore, these policies are constrained by the legal possibilities in place in each country, the indirect consequences of the measures, public perception, and an imperative of simplicity. On the downside, there is some discomfort associated with wearing a mask and it might still be too early to assess the psychological impact of being surrounded by covered faces.
Thus, a proper assessment of the risks of infections incurred by maskless crowds in diverse non-confined spaces is much needed, especially at a time when mask mandates are about to be, or have been, lifted. Not only can it provide more objective foundations to public policies, but it is instrumental in better targeting the situations where risks are highest and masks are most crucial, thus justifying stricter local control, and determining if (and where) it makes sense to restrict pedestrian mobility on streets and sidewalks. It will also be central to the safe revival of outdoor mass events, which are currently suspended in various countries, notably European ones.
For the time being, there remains a gap between the thriving experimental and computational studies focused on measuring the emission and propagation of respiratory droplets [16, 17, 18, 19, 20, 2, 21, 22, 23] and the investigations of disease spread at larger scales [24, 25, 26]. The former have shed light on the complex, turbulent dynamics that take place inside the exhaled puff and called into question both the binary distinction between falling droplets and tinier airborne aerosols [2, 27], and the scientific basis of the 2-meter social distancing rule [28, 29, 30, 27]. However, the translation of these results into epidemiological predictions relevant for policy-making [31, 32] is uneasy, and trailing. Poles apart from these microscopic studies, risk assessments at the scale of a facility or venue by means of agent-based pedestrian simulations [33, 26, 34] or large-scale experiments [35] resort to particularly crude assumptions with regard to viral transmission. Often, an individual is considered exposed to the disease when he or she comes in a given radius (e.g., 2 meters) around an infected person, regardless of their orientations, overlooking that their head orientations control the direction in which respiratory droplets are expelled. Moreover, pedestrian dynamics models are hardly designed to reproduce fine observables such as precise inter-pedestrian spacings with any reliability, neither in usual times nor in times of pandemic, when pedestrian behaviors and trajectories are altered to reduce infection risks [36, 37].
To overcome these strong limitations, we collected detailed field data333The processed field data are freely available on the Zenodo public repository, with the DOI: 10.5281/zenodo.4527462. The Python scripts used to analyze the data can be obtained by request to the authors., during the pandemic in France, about pedestrian separations and orientations in diverse situations (hereafter called scenarios), either outdoors or in large, ventilated indoor facilities, and we developed a mathematically sound method to infer the rate of new infections in each scenario from our partial observations. The method rests on simple ad hoc models for viral transmissions, which we introduce and fit to droplet emission data and existing exposure studies. While these models are individually only coarse approximations of the reality, they all converge towards a fairly robust ranking of the scenarios in terms of infection risks. The proposed framework is also useful to quantify the effect of enhanced physical distancing and to assess the mitigation efficiency of redesigning certain premises (one-way footpaths, queues, etc.).
2 Methods
While one can rely on estimated numbers of contacts between people to model the spread of an epidemic at regional or national scales [24, 25], more detailed information about the viral transmission route and the interactions between people is required to gauge how a virus will propagate in a given crowd. Although small respiratory droplets may evaporate into airborne residues that can accumulate in the air and potentially travel long distances, short-range transmission is widely believed to prevail in non-confined environments, at least for influenza and the coronavirus [38, 19, 21]. These droplets are exhaled when breathing, talking, shouting, panting, coughing or sneezing, mostly through the mouth but also through the nose [18, 16]; the focus must thus be put on their transport.
2.1 Modeling viral transmission via respiratory droplets
In principle, the instantaneous transmission rate due to droplets emitted at by a contagious individual and inhaled at by a ‘receiver’ reads
| (1) |
where the characteristic time for infection at a given distance in front of the index patient is related to the specifics of the disease (namely, the viral titer in the respiratory fluid and the minimal infectious dose ), whereas the function accounts for the fluid dynamics of droplet emission and transport. Its parameters , , and will be clarified in the following. Unfortunately, an accurate derivation of from the fluid dynamics of droplet and aerosol propagation in these scenarios would not only be extremely demanding computationally, but also hinge on very specific information that is neither available [39] nor transferable between situations, e.g., ambient air flows [29, 40], wind speed [23], humidity [27], and speech details [18].
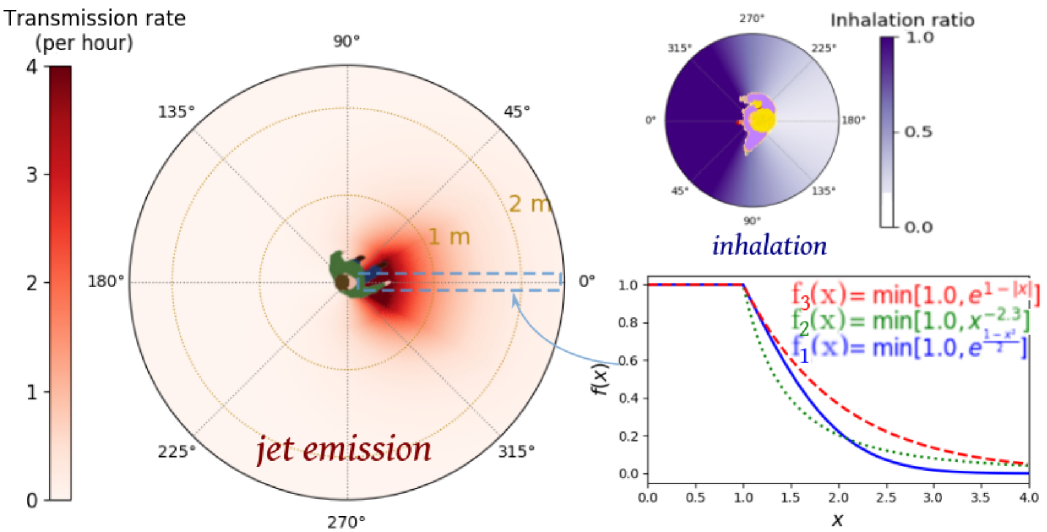
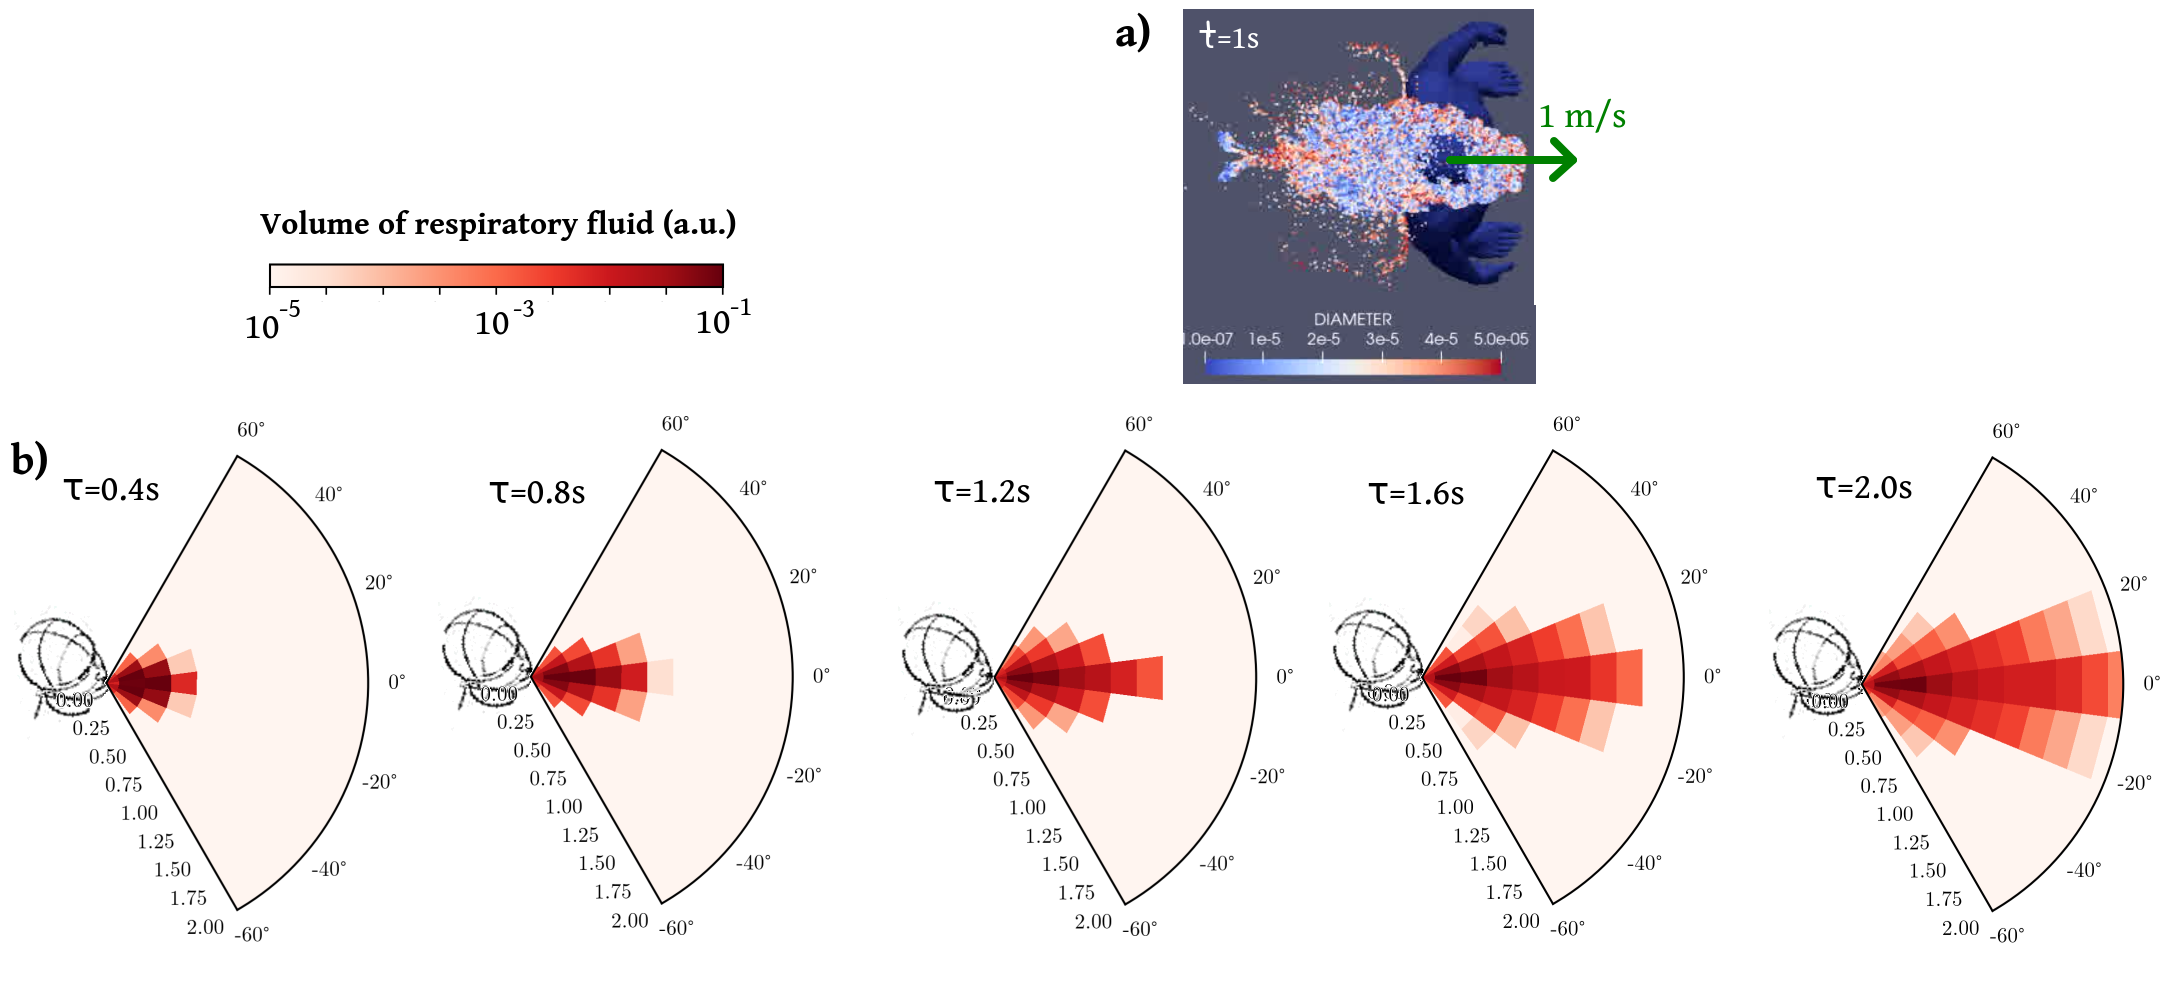
Therefore, we opted for the development of coarser-grained, ad hoc models that notably overlook propagation delays and ambient air flows. (Relaxing the former hypothesis does not alter our main findings, as we show in Appendix D by bringing back into play more realistic transmission dynamics (see Fig. S5); on the other hand, ambient air flows may only be neglected if there is very little or no wind, in which case the exhaled puff is expected to be fairly similar indoors and outdoors in the short range.) With the insight into droplet propagation gained from computational studies as well as experiments on expiration and inhalation [20, 41, 23, 2, 16, 30], the disease transmission rate thus boiled down to a function that decreases with the horizontal distance between the individuals’ heads and the orientations and of the emitter’s and receiver’s heads relative to the direction of the vector that connects them (note that droplet emission and inhalation are not symmetric [20]).
More precisely, assuming that these variables can be decoupled, we write the instantaneous transmission rate as
| (2) |
where is a function such that and decays rapidly for . To be concrete, we tested the following three functions,
Because of the limited accuracy of our positional measurements and the uncertainties about very near field transmission, the peaks of these functions are leveled at , viz., for . We then defined a family of plausible parameter sets for the functions, namely, , , , and in Eq. 2) as well as in . The parameters were bounded using a broad scope of available empirical data, which suggest a characteristic distance , an infection time (at ) between a dozen minutes and an hour, and an exponent (more details are given in Appendix B), and within these plausible bounds we explored different sets of values, listed in Table 1. The parameter sets thus span the entire spectrum from highly contagious (‘pessimistic’) to only mildly contagious (‘optimistic’).
An example of such a function is depicted in Fig. 1. The spatial decay of the transmission function is such that becomes negligible past a few meters, except for the worst-case model describing uncovered sneezes [17]. The typical time for infection in the event of a close ( face-to-face contact lies between 5 minutes (an extremely pessimistic estimate) and 30 minutes (except for sneezes), consistently with the epidemiological literature on SARS-CoV-2, outbreak reports and exposure case studies [15, 12, 42, 43, 44, 45, 30].
| (min) | (m) | |||
|---|---|---|---|---|
| Optimistic | 30 | 0.3 | 22.5∘ | 45∘ |
| Moderately optimistic | 15 | 0.5 | 30∘ | 60∘ |
| Standard | 10 | 0.5 | 30∘ | 60∘ |
| Pessimistic | 10 | 0.75 | 45∘ | 60∘ |
| Very pessimistic | 7.5 | 1 | 45∘ | 60∘ |
| Extremely pessimistic | 5 | 1 | 45∘ | 90∘ |
| Uncovered sneezes | 1.7 | 1.5 | 22.5∘ | 60∘ |
The resulting models are representative of a disease that may be transmitted to multiple individuals within an hour in unfavorable cases [8, 46], but generally requires close and prolonged contacts for transmission: Even in households, reported attack rates lie in the range 5%-30%[47], often around 15% [48, 49, 50]; moreover, casual episodic contacts at work or in the community, even face to face, do not necessarily trigger an outbreak [48, 43]. More quantitatively, the spatial decay described by the fairly optimistic models agrees well with the decay of the concentration of droplets emitted by a coughing subject [41] (see Fig. S3). The reliability of the transmission models is further tested by mimicking a journey aboard a Chinese train (overlooking its confined nature), where transmission risks for passengers who sat close to an infected traveler were recently assessed using trip records [4]. Overall, the simulated results, detailed in Appendix B, are compatible with the empirical data; the models featuring the most optimistic parameters display the best concordance. Finally, let us mention that the order of magnitude of the parameters (especially the most optimistic ones) is consistent with the putative minimal infectious dose of SARS-CoV-2, estimated to be order 100 particles [51], granted that most exhaled droplets contain 0 or 1 viral copy [52] (see Appendix B).
Although these pieces of evidence favor the optimistic end of the parameter spectrum, our study is conducted with the whole gamut of plausible model parameters. This variety better reflects our current uncertainty with regard to the transmission of SARS-CoV-2, but also the established inter-individual and inter-case variability [16, 18], depending on physiology, talking characteristics [53], viral mutations, etc.
2.2 Field measurements and inference of the rate of new infections
We used a privacy-respective setup to film pedestrian flows and crowds in diverse scenarios in a discrete and passive way with a TomTom Bandit camera covered with a thin plastic layer (to deteriorate the quality of the image) and installed in a zenithal position. This privacy-respective setup was approved by the Data Protection Officer of the French National Centre for Scientific Research (CNRS).
After some pre-processing with the FFMpeg software to correct the ’fish-eye’ effect, downsample the video, and select the area of interest (from to ), the positions and head orientations of all pedestrians were manually tracked at a rate of 2 frames per second (fps) with the help of a dedicated Python software; linear interpolation then increased the rate to 10 fps. The estimated experimental error on the positions is typically below or around 20 cm, while that on the head orientations is lower than in most videos.
Because of the limited field of view, some interactions with off-camera people were missed, especially at large separations. We compensated for this by appraising the fraction of interactions thus lost as a function of their range, under the assumption of homogeneous density, and reweighting the detected contacts accordingly. We checked that this rescaling method successfully restores the genuine contact distribution, up to contact distances close to the size of the field of view (Fig. S2 in Appendix A).
Besides, we were able to identify and keep track of groups of pedestrians (i.e., co-walkers who appear to be relatives, co-workers, or friends) by visual inspection. Overall, close to 5,000 pedestrian trajectories were thus obtained. Pixel coordinates were converted into real-world coordinates with a geometric formula whose parameters are fit thanks to predefined calibration points at pedestrian height (see Appendix A).
For each scenario the time and space-resolved pedestrian measurements are then coupled to the above transmission models. This directly yields the instantaneous rate, abbreviated as , at which a supposedly infected index patient , that we will call Iago, transmits the disease to other pedestrians j around him via virus-laden droplets. Under the independent action hypothesis (IAH) [54, 55], each inhaled virus is equally likely to lead to an infection, with no cooperation or antagonism between viruses. It follows that, over the time interval over which Iago was filmed, he infected a number of other people (leaving aside his fellow group members , whose possible infection is not specifically related to the scenario, except at the cafés), given by a Wells-Riley-like equation [56], viz.
| (3) |
where is the probability that is susceptible (i.e., not already infected) at the beginning of the observation interval, and is the cumulative transmission risk [57].
It is worth noticing that the IAH implies that infections are a stochastic process without threshold: Any encounter can potentially result in a new case, and multiple short interactions with various people are as risky as a single long one, and even riskier because, once infected, agent j can no longer be infected, viz., . This saturation of the risk complicates the evaluation of even if we assume that all pedestrians except Iago’s group of co-walkers are initially susceptible, because our videos only record part of Iago’s wandering and may thus miss earlier off-camera interactions. Nonetheless, rigorous upper and lower bounds on can be set by noticing that, on the one hand, and that, on the other hand, cannot be larger than the number of people actually infected by Iago, which is related to (see Appendix C). Finally, for comparison purposes, is recast into an hourly rate of new infections with , assuming that the recorded videos are representative. As this rate is very sensitive to the chosen characteristic time for infection , which exhibits great variability, we will mostly present results rescaled by , which is equivalent to setting and showing the number of new cases over a time interval .
Static scenarios – namely, the cafés and waiting lines – are handled slightly differently, because then Iago’s neighbors do not change significantly as time passes, in which case we set and in Eq. 3. In a nutshell, the proposed framework enables us to quantitatively translate patchy observations, with undetected contacts, into an estimated global risk of viral spread.
3 Results
3.1 Ranking of scenarios by the risks of new infections
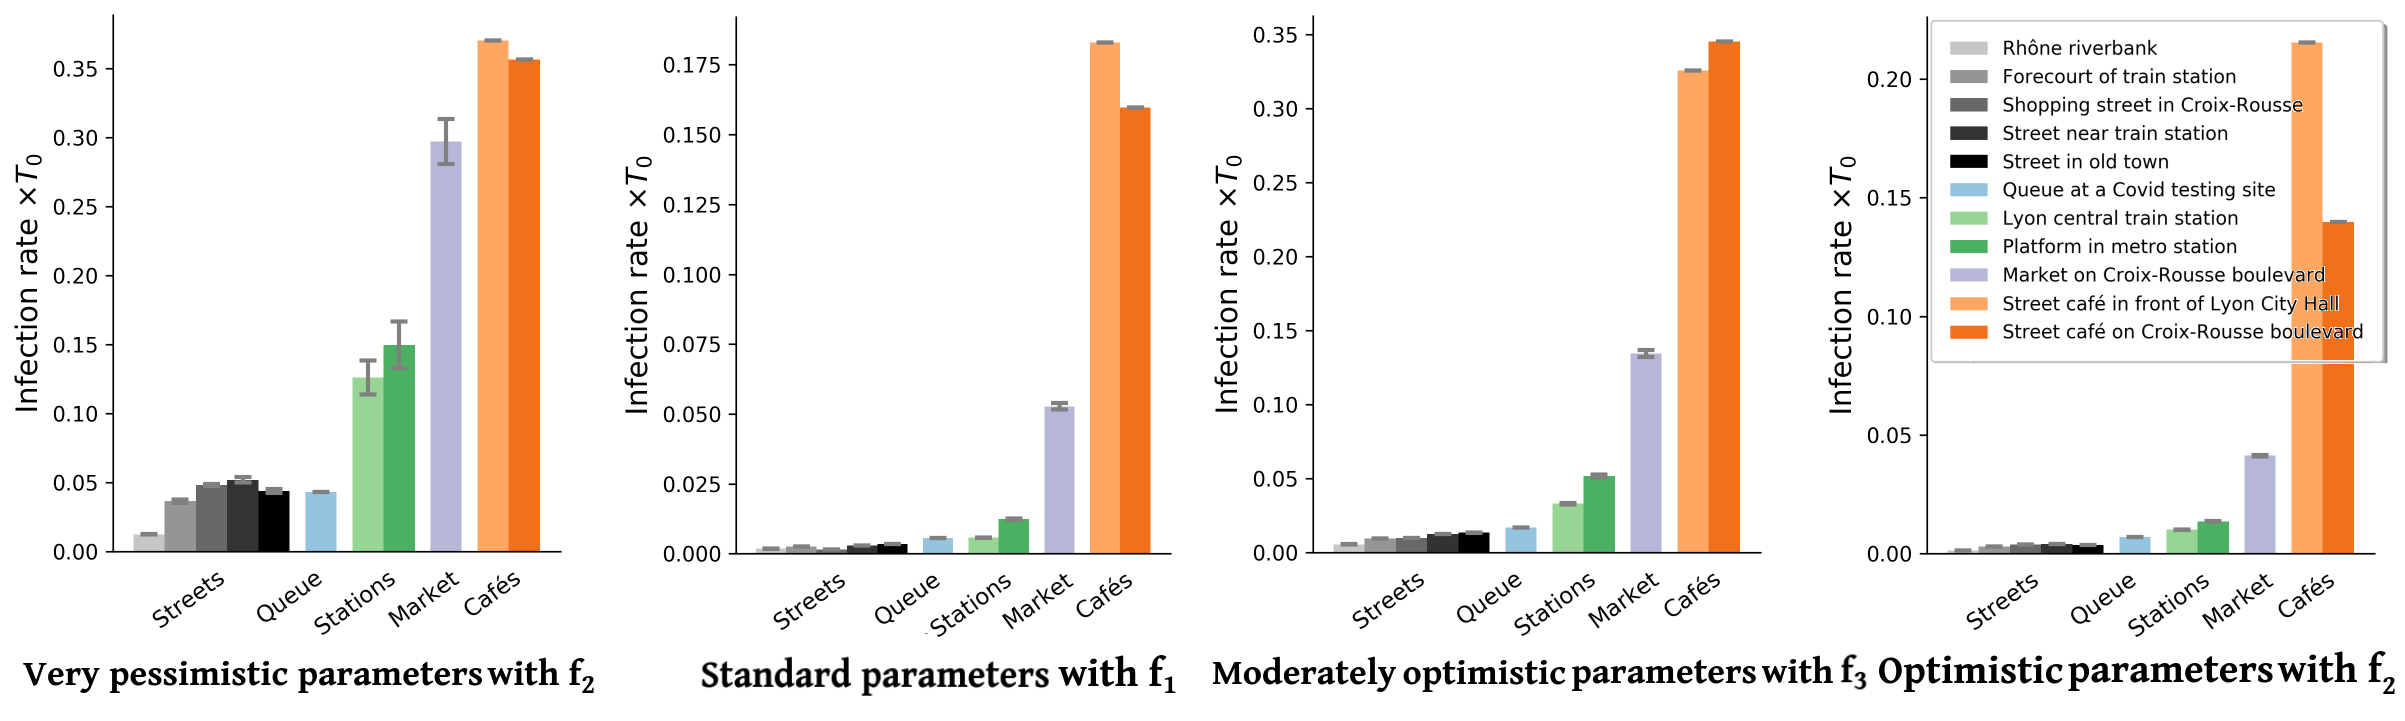
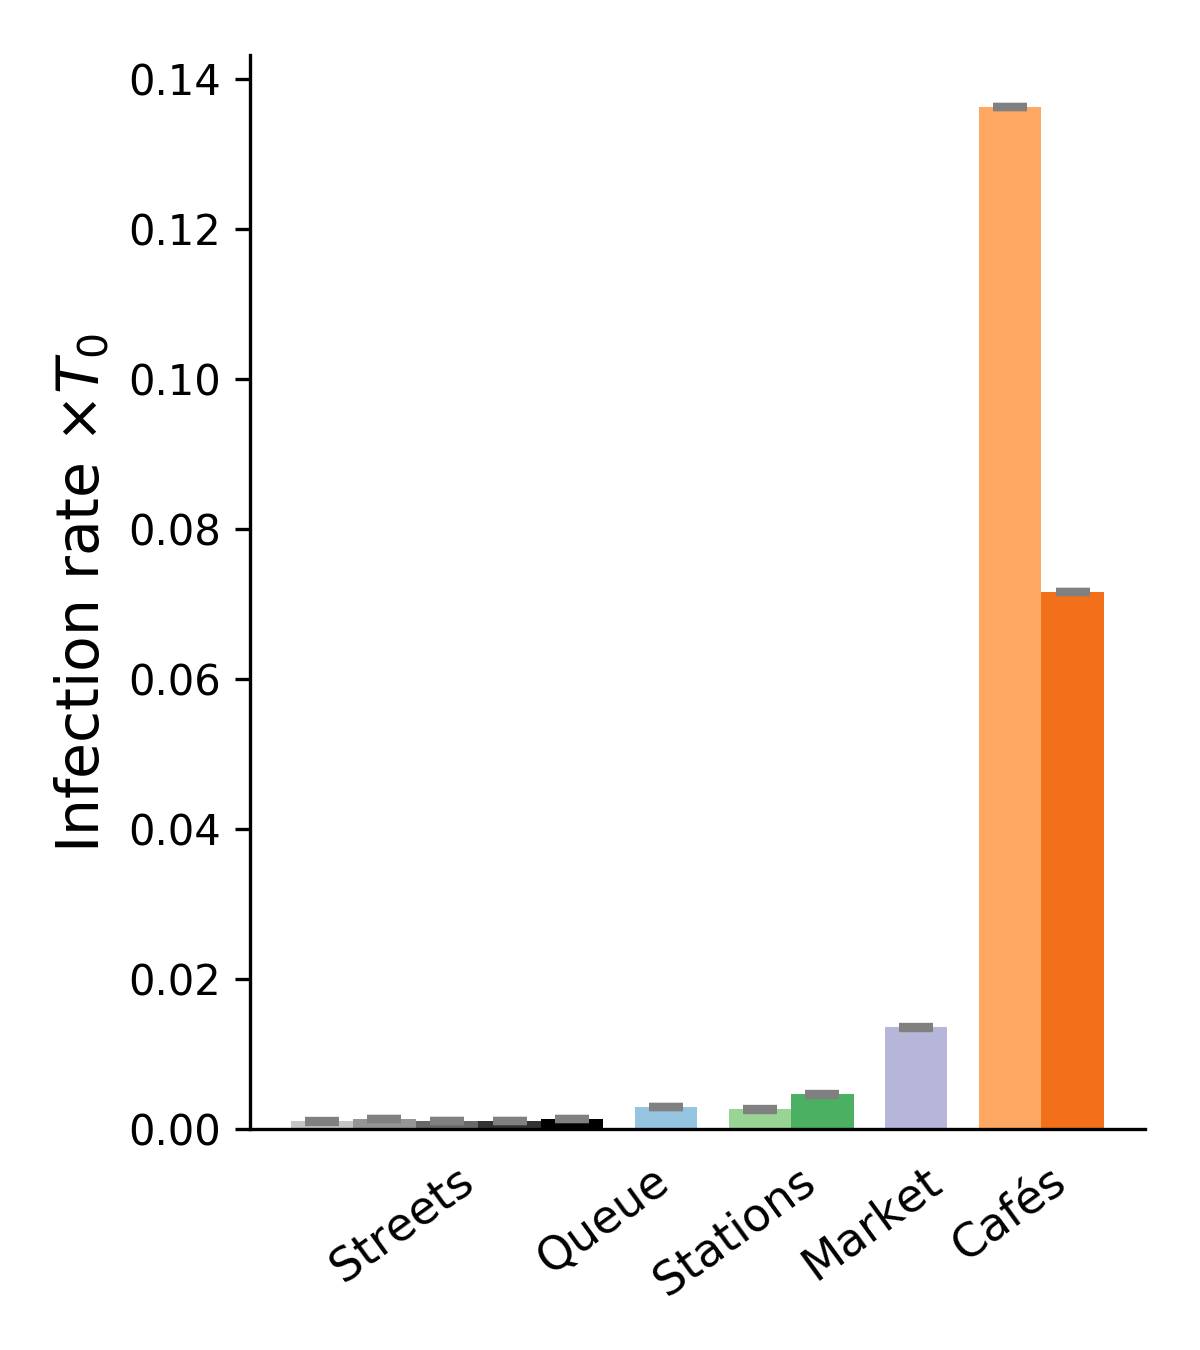
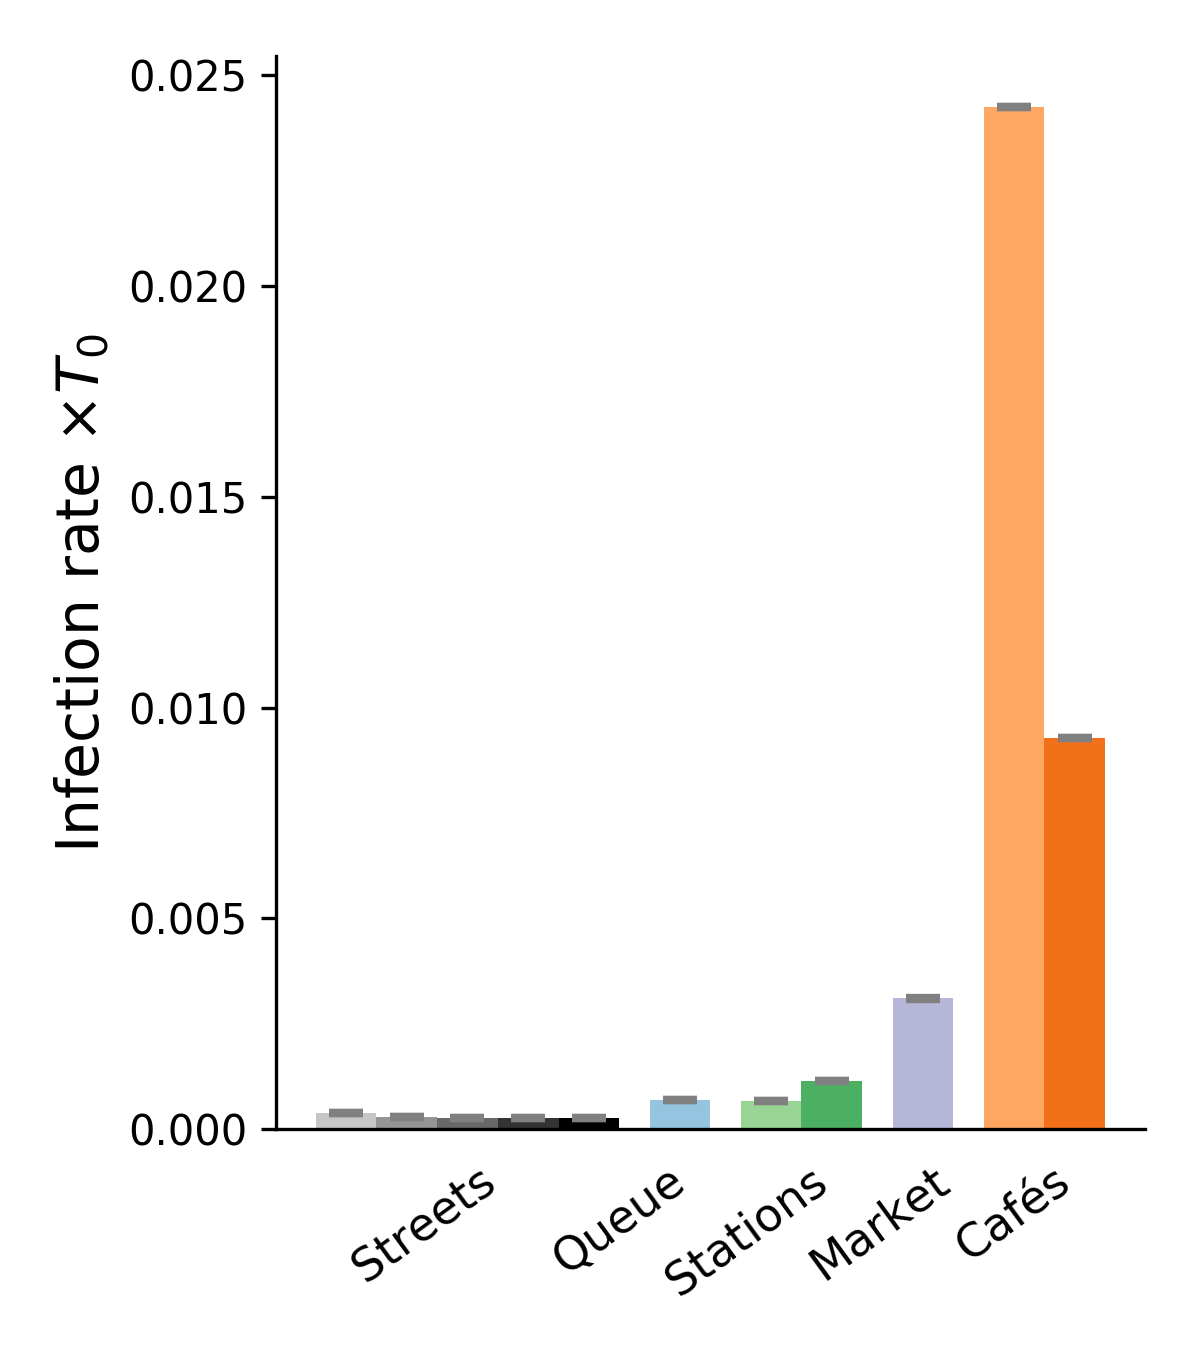
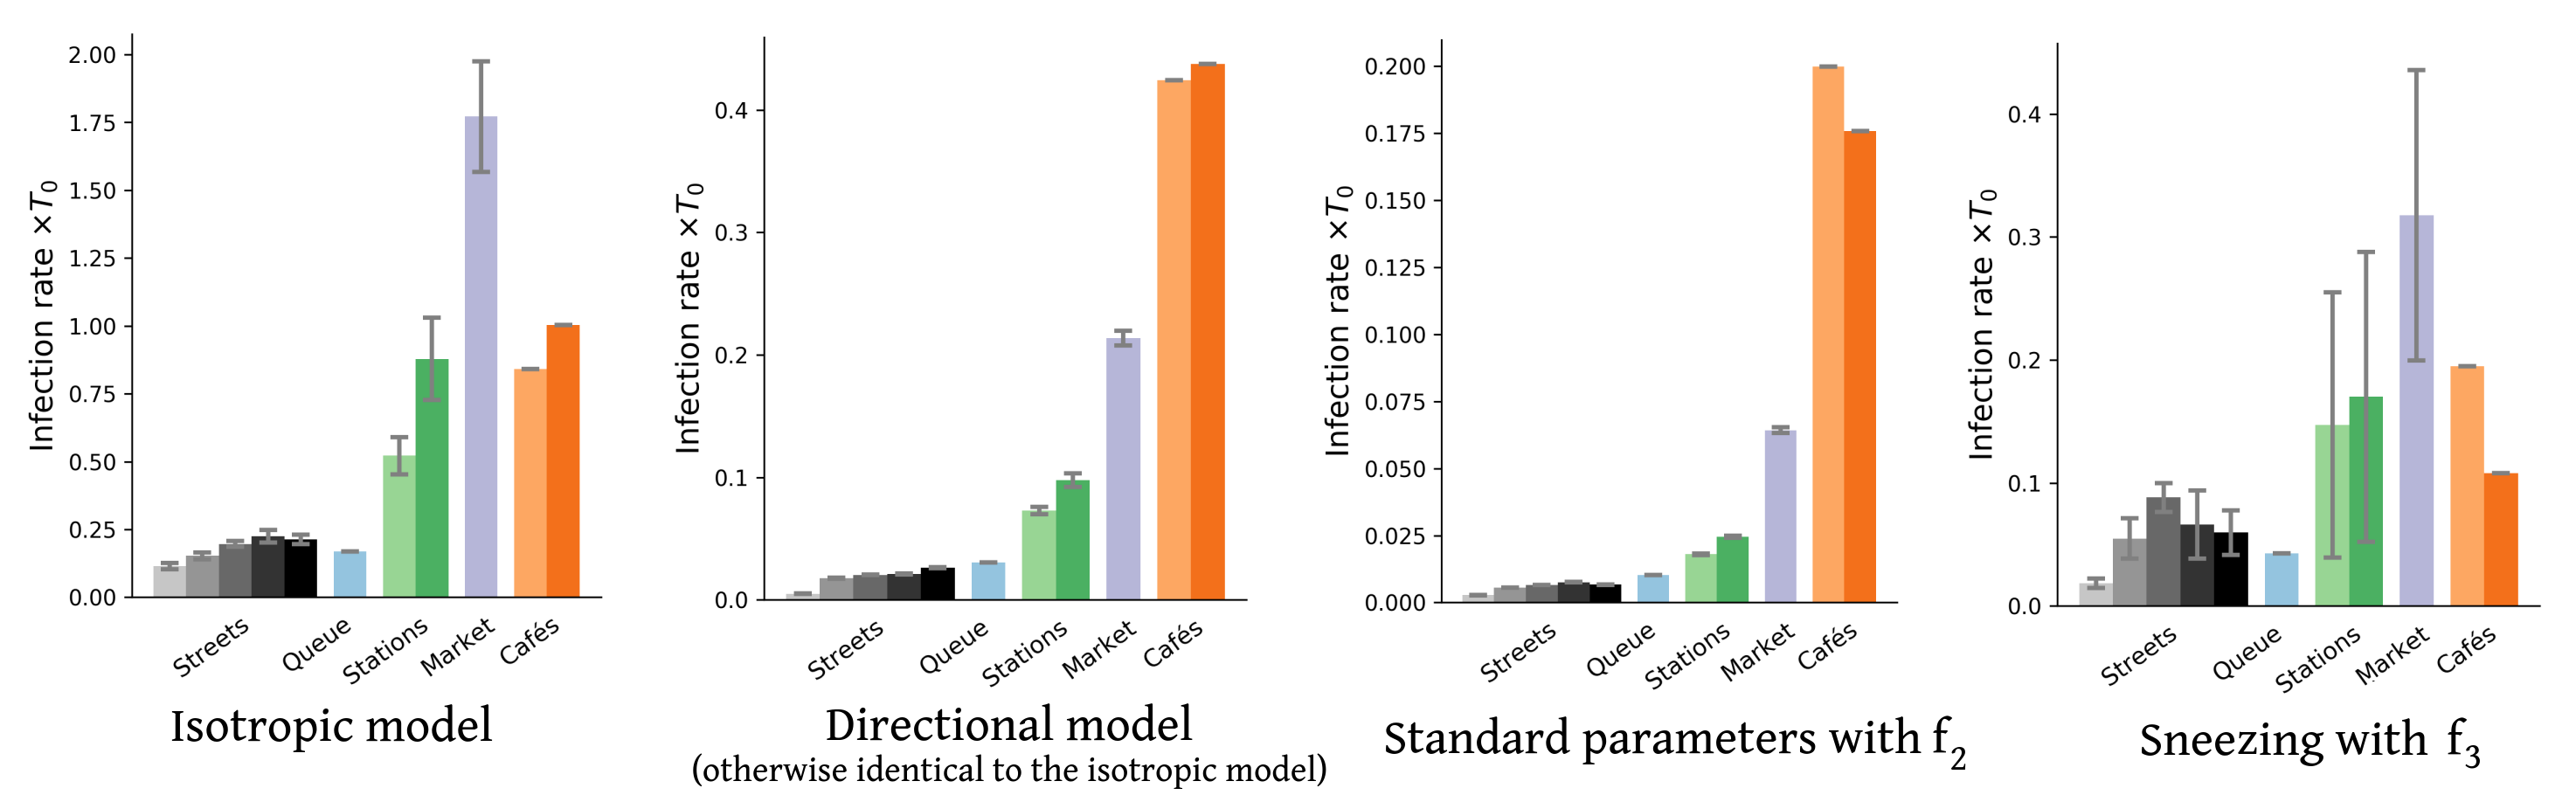
Inserting the collected field data into this framework, we obtain upper and lower bounds on the mean rate of new infections per hour for each scenario and each transmission model. Figure 2 presents a sample of results for four of these models (also see Figs. S6-S8 for the results obtained with other models). These results confirm the efficiency of the proposed bound-setting method, as the bounds are found to confine to a narrow interval. Most importantly, the ranking of the different scenarios turns out to be robust, that is to say, largely preserved across models. This is our first major result.
Pursuing the analysis of Fig. 2, we observe that street cafés present the highest risks in terms of the mean number of new infections per hour, even though their tables were more spaced when the videos were shot than before the pandemic. These infections at cafés are easily rationalized by the close, face-to-face interactions between people sharing a table, let alone the increased emission of droplets associated with lively discussions and eating, which is overlooked here. This result is in line with case reports of high risks of viral transmission while dining and drinking (indoors or outdoors, unspecifically) [3, 46, 57, 6]. Next in line among the observed scenarios comes the outdoor market alley. Despite its high average density , this scenario never matches the level of risk at cafés, bar with the very pessimistic parameters corresponding to high contagiousness. Further down the list, crowd density explains the considerably higher risks at train and metro stations () than on fairly busy streets in Lyon () and, to an even larger extent, the riverbank walkway that we filmed. Somewhat intriguingly, the estimated infection rate may be as large, or even larger, at the observed testing site in Lyon than it is on these streets, although the overall density there is low and attendants were strictly asked to stay 2 meters apart from each other; yet, their relative proximity was prolonged over considerable time and, besides, they tended to turn and pace around a bit while waiting. One should however bear in mind that our models estimate the risks of viral transmission if no face mask is worn, whereas everybody was wearing a mask at the testing site that we filmed.
3.2 Rates of new infections
Besides the robustness of this qualitative ranking of scenarios, largely maintained across parameter sets, on a more quantitative note we observe that the infection rates are always (except with the worst-case models) at least 10 times scantier in the investigated streets than at cafés, even without taking into account that talking and eating augment droplet emissions. In addition, the pessimistic estimates are generally at most a factor 10 larger than the (possibly more relevant) most optimistic ones. Thus, it is reasonable to conclude from those estimated values, that contagious Iago will infect a number of order 1 person roughly speaking if he sits at a café for one hour, whereas he would probably cause significantly less than new infections if he spent this time walking on a fairly busy street.
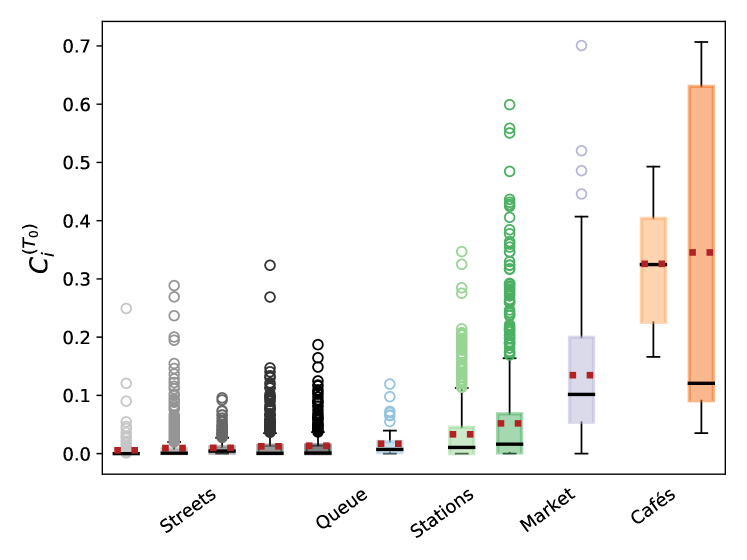
Nonetheless, these average rates brush aside the variety of pedestrian contacts in the different scenarios, which is better reflected in the box plots of Fig. 3. The figure shows that, while the scenarios involving a moving crowd cause fewer infections than cafés on average, their rates of infections are more dispersed and, unlike cafés, they feature many values that significantly deviate from the bulk, both at and at high-, the latter being pedestrians that fortuitously turn into super-spreaders because of their pattern of on-street contacts. As we shall see below, the blame does not necessarily rest on the pedestrian, but rather on the ebbs and flows of crowding in each observed situation.
Prior to that, let us remark that accounting for the directionality of droplet propagation and describing the orientations of pedestrians’ heads had a marked effect on our results. Indeed, not only does an isotropic transmission model overestimate risks in crowds by a factor of at least 10 in comparison to its directional counterpart, but it also alters the ranking of scenarios: It predicts considerably more infections at the outdoor market than at the cafés (Fig. S8). Otherwise, such an inversion (along with high risk estimates) is only found for our worst-case transmission models, in particular the model that we introduced to mimic the effect of a contagious patient sneezing every few minutes without covering his or her sneezes. On the other hand, allowing infections within groups, as we did for the cafés, does not dramatically change the picture, even though it substantially heightens the risks associated with sparse situations, for instance, the riverbank walkway. This is not surprising because in these situations close contacts mostly occur between group members.
3.3 Key determinants of the transmission rate
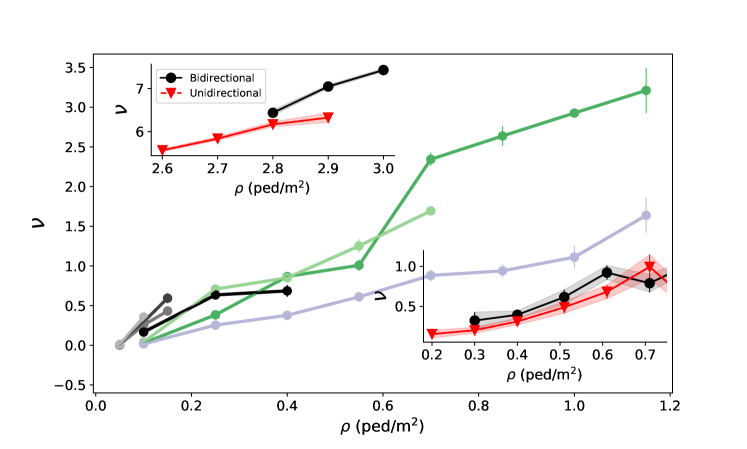
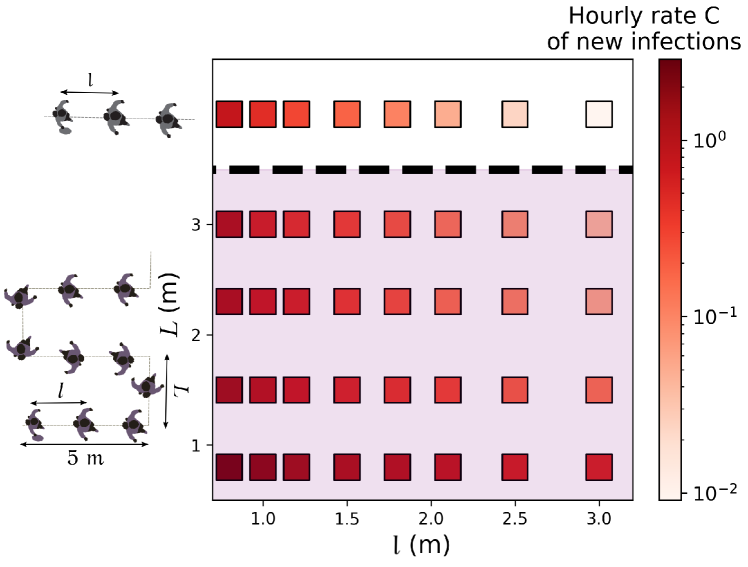
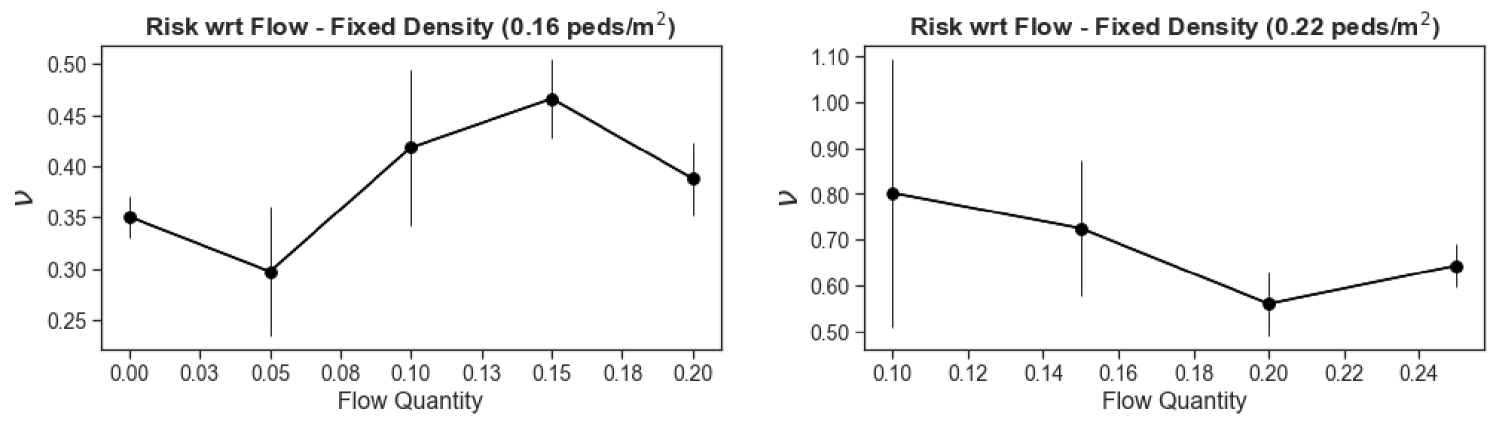
To better understand the observed disparities, we need to identify the key variables that determine the level of risk. Figure 4 confirms the intuition that the instantaneous pedestrian density is a major determinant of the rate of viral transmission (where the average is taken over all pedestrians observed at time t), in that it controls how close each pedestrian is to their counterparts. (Note that all time-dependent variables have been averaged over intervals of two seconds, to reduce the statistical noise.) The variation of with looks similar across scenarios, but is not strictly identical, which indicates that other scenario-dependent variables affect the transmission rate . Furthermore, these variations become more muddled as one turns to more optimistic parameter sets, which is consistent with the idea that one then probes the configuration of the crowd at finer length-scales, owing to the shorter transmission range. The total pedestrian flow rate could in principle play a role; however, we found that does not follow any clear trend with this flow rate at fixed density (Fig. S9).
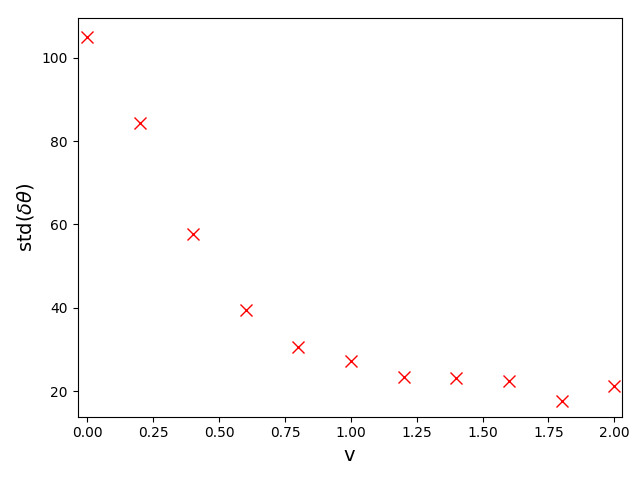
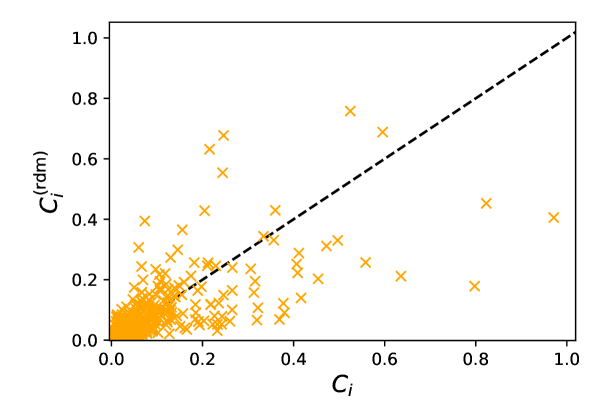
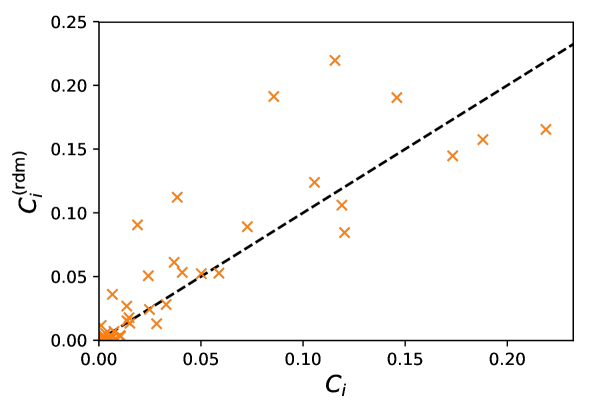
On the other hand, head orientations naturally have some bearing on the risks of infection, as evinced by the failure of isotropic transmission models to reproduce our results444We think that this is largely due to the discrepancy between the face-to-face orientations at cafés (which facilitate transmission) and the more or less random orientations e.g. at a market., but we now show that in non-static scenarios these orientations can be practically inferred using only the trajectories. To do so, we notice that the head orientations of walking pedestrians (speed ) are approximately normally distributed around their walking direction, with a standard deviation around , and decorrelate over one second. Therefore, we choose to ascribe angular orientations randomly drawn from this normal distribution to walkers, while their stationary counterparts () are considered purely randomly oriented; the random values are refreshed every second. Quite interestingly, this simple reconstruction of head orientations yields mean infection rates per hour that agree very well with the values computed with the bona fide orientations, with a relative difference generally lower than 15%, regardless of the transmission model. The correspondence between the individual values for each pedestrian is of course imperfect with this method, but overall the differences are not extremely large (Fig. S10). These observations are particularly relevant to bolster risk assessments based on observed or (reliably) simulated pedestrian datasets in which head orientations are missing, as they most often are.
4 Discussion
4.1 Insight into the risk in the scenarios under study
The spatial resolution of our empirical data and models provides deeper insight into the circumstances of infection in the above scenarios; it can contribute to the debate about what physical distance should be prescribed between pedestrians in non-confined environments, and whether 2 meters or ’6 feet’ are enough from an epidemiological perspective [29, 28]. Admittedly, the answer will heavily rest on the transmission model (which was here established in an ad hoc way), but the statistics of inter-pedestrian contacts in the scenario also play a large role. Using the cumulative rate of transmission as a proxy for the incurred risk, we find that its dominant contribution comes from interactions within a distance of 1 meter (for instance, 70% at Bellecour metro station, with ModOpt3), whereas transmission beyond 2 meters, albeit possible, accounts for only a few percent of the risk (5% at Bellecour), at most. Importantly, here and throughout the paper, risks have been quantified by the number of new cases expected in each setting; this choice is relevant at the collective scale, for policy-making, but not for the evaluation of the risks incurred by an individual in the crowd.
4.2 Mitigation efficiency of redesigns
Beyond this debate, the framework introduced here opens the door to evaluating the mitigation efficiency of hypothetical redesigns of streets and venues, consisting e.g. in enforcing one-way circulation on footpaths, a sitting plan at cafés, or increased spacing in queues. Since circulation plans have flourished during the pandemic, let us first explore the impact of one-way vs. two-way foot traffic on sidewalks and pedestrian streets.
To avoid potential situational biases, the question is investigated by separating the periods of time (binned in two-second intervals) when the flow was unidirectional from those when there were pedestrians going in both directions, in each given scenario – the market alley in the bottom right inset of Fig. 4. Since the transmission risks were found to depend on density, but not on the total flow rate (i.e., the sum of the directional flow rates across sections perpendicular to the main flow), we perform a comparison at fixed density. Our data (inset of Fig. 4) reveal only little benefit to switching from two-way to one-way traffic in our wide-path scenarios. To further test this somewhat surprising finding, we exploit the controlled experiments performed a few years ago by the German BaSiGo team555These extensive datasets are openly available under: https://ped.fz-juelich.de/db/doku.php to study unidirectional and bidirectional pedestrian flows in 4 to 5-meter-wide corridors [58]; head orientations are reconstructed as explained above. The results, shown in the top left inset of Fig. 4, are in line with the aforementioned finding: In wide walkways, switching from two-way flow to one-way flow seems to (at best) reduce the risks only moderately, probably because head-on ’collisions’ are rare in these self-organized flows.
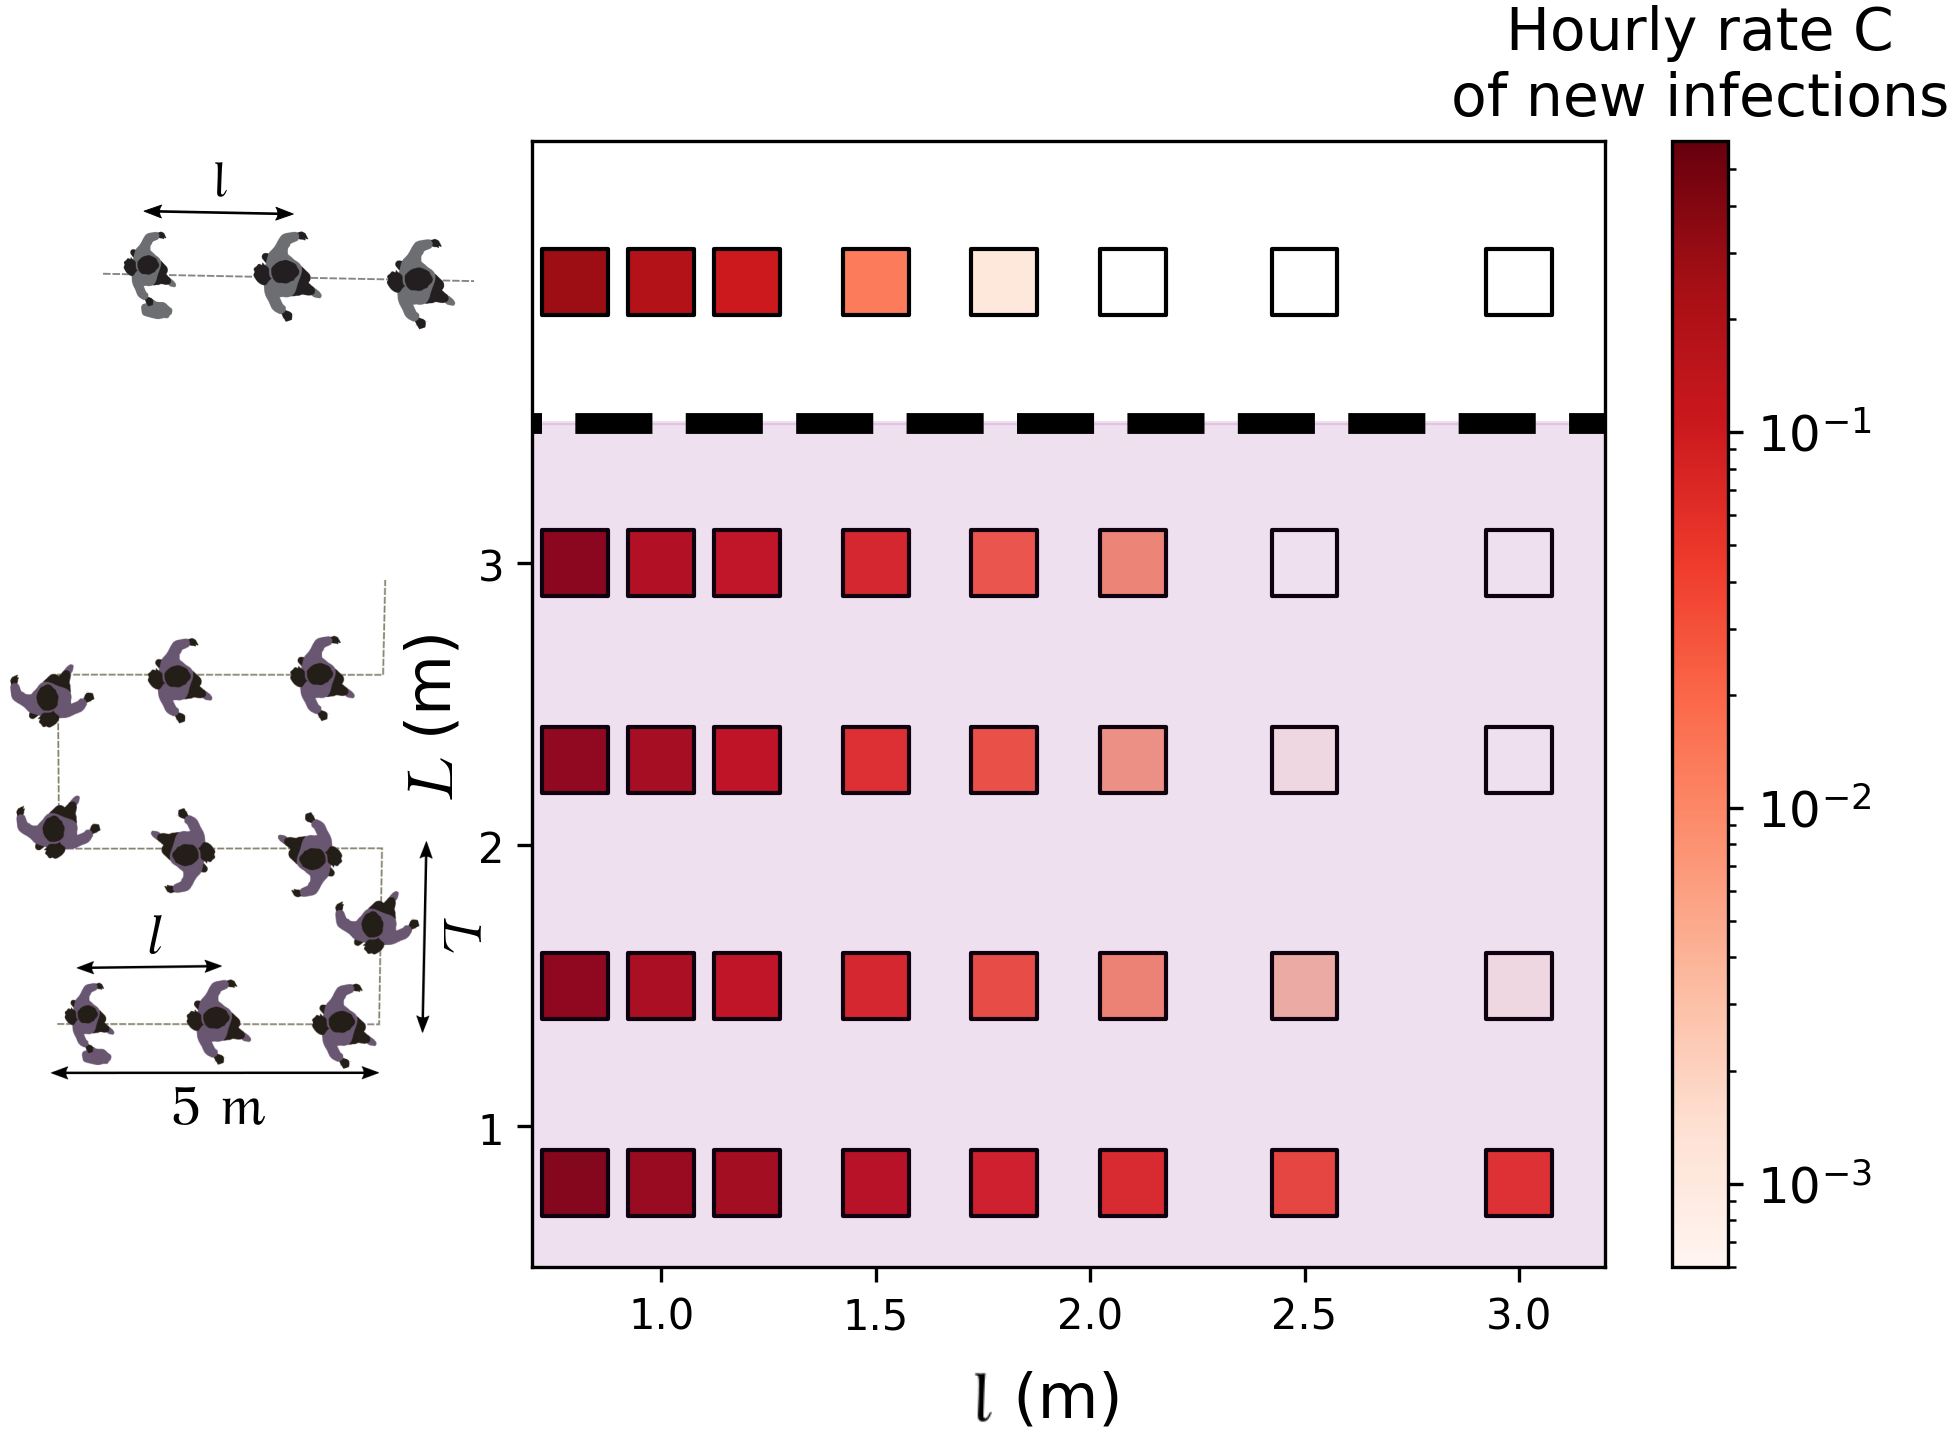
Next, we turn to queues and study how their arrangement affects transmission risks. On the basis of our observations at a testing site, we modeled a queue as a line of more or less equally spaced people, swaying in a rectangle around their central spot and whose head orientations are normally distributed (with a standard deviation of ) around the queuing axis 75% of the time and purely random for the remaining 25% of the time, due to people turning around or having a look around. Both the positions and orientations are refreshed every second. Albeit simplistic 666The observed scenario is significantly more complex than its reconstruction: It actually features two different, not strictly linear queues, one outdoors and one indoors, as well as a few people who are not queuing., the reconstructed queuing scenario is comparable with our actual observations as far as the estimated infection rates are concerned; these estimates with and without reconstruction differ by less than 50% for any of our models – except the most optimistic ones, which bestow special importance to rare contact events that are overlooked in the reconstitution.
Figures 5 and S7 illustrate the extent to which predicted infection rates vary when the spacing between queuing people or the queuing geometry are modified. Naturally, the risks are minimal in the case of the linear queue with the largest spacing between individuals, whereas they are maximized for winding, S-shaped queues with very close rows and individuals standing right behind each other within each row. Since people cannot be expected to keep their heads strictly in the direction of the queue, there appears to be no smart solution to have at the same time minimal risks and a very compact queue; given the results of Fig. 5 and S7, a simple practical recommendation for S-shaped queues is to keep a little more space between rows than the actual spacing between individuals in each row.
4.3 Current limitations and perspectives
In summary, the foregoing risk assessments in non-confined environments can guide public decisions in times of pandemic, in that (irrespective of the transmission parameters that are used) they confirm the risks of infection incurred at cafés [3] and underline the key role of pedestrian density in determining the rate of viral transmission in moving crowds without masks. Fairly busy streets, with densities up to , are found to present risks that are not completely negligible, but comparatively quite low, and these risks will manifestly reach even lower values for less busy streets. This suggests that the scant reports of outbreaks in outdoor walking crowds are not only due to the intricacy of tracing back these infections (due to unidentified contacts, recall biases, etc.), but also to the limited transmission of the virus in these conditions, even without face coverings. Nevertheless, this remark does not apply to very crowded settings such as markets or metro and train stations, which deserve particular attention. Furthermore, our model-based approach has enabled us to explore the efficiency of street and venue redesigns in mitigating the viral spread. For wide walkways, we have not found clear benefits to switching from two-way foot traffic to one-way traffic. For queues, increasing the space between individuals naturally reduces transmission risks; in the case of an S-shaped queue, a simple rule that could be enforced in practice is to keep a little more space between rows than between individuals in each row.
Given that our study pioneers the coupling of empirical crowd data to spatial models of viral transmission at mesoscales, it undoubtedly suffers from some limitations. To start with, the empirical data could be extended to include more scenarios and longer footage.
Perhaps more crucially, the transmission model should be refined. The models used in this study are admittedly overly simple, even though this problem was partly warded off by ensuring the robustness of our qualitative conclusions across diverse model variants, including a spatio-temporal model. More sophisticated models, which may differentiate transmission rates as a function of people’s activity (reflecting known variations in droplet emission [18, 20]) and account for the effect of the wind [23] and ambient air flows, will afford more accurate estimation of the rate of new infections. In addition, fluid dynamics simulations of long-range aerosol propagation would make it possible to study enclosed spaces with poor ventilation, where our current models that discard the airborne transmission route can only provide lower bounds on infection risks.
Another task is to generalize the transmission models to people who are (adequately or inadequately) wearing a mask [13], in order to determine how serious an issue very crowded streets really are in current times. It would be straightforward to account for the particle filtration efficiency of masks in the present framework, by simply multiplying the transmission rates by a reduction factor (say, for cloth masks, % for surgical masks and for N95 masks [41, 47], if only the emitters have their face covered), but masks are probably even more efficient, because they also reduce the reach of the exhaled puff [14, 40], thereby probably shortening the range of transmission of droplets [41].
Acknowledgments
We are grateful to Isabelle Sabran (Ville de Lyon), Jessica Magraner (Cour d’appel de Lyon), and Frédéric Laurent (Hospices Civils de Lyon) for facilitating our collection of data with our privacy-respective cameras and to the French MODCOV19 initiative for supporting part of this work. We also thank Cécile Appert-Rolland for lending us some material and Marina Nicolas for proofreading. This work was funded by Agence Nationale de la Recherche (ANR-20-COV1-0003) under project name SeparationsPietons. The setup of the CFD simulations discussed in Appendix D was designed collectively, with P. Bénard, G. Lartigue, V. Moureau (CORIA Rouen, France), G. Balarac, P. Bégou (LEGI Grenoble, France), Y. Dubief (Univ. Vermont, USA) and R. Mercier (Safran Tech, France). CFD simulations were performed using HPC resources from GENCI-TGCC. SM also acknowledges the support of Agence Nationale de la Recherche (ANR-21-CO15-0002, TransporTable).
Appendix A Empirical observations of pedestrian crowds
Video acquisition and processing
Videos of crowds were acquired from a top view in the non-confined settings described in Table 1, in a discrete and passive way that allowed us to observe natural behavior as pedestrians were mostly unaware of being filmed.
| Scenario / Location | Date and time | Comments | Number of tracked pedestrians | Mean Density (ped/m2) |
| Pedestrian banks of the Rhône river, close to the Morand Bridge | Friday, July 3rd 2020, 4pm-5pm | Sunny and windy day | 164 | 0.042 |
| Plaza in front of Perrache hub (Hall - Level 1) | Friday, July 17th 2020, 9am-10am | Nice weather | 1021 | 0.038 |
| Part-Dieu train station - Ground level/passage area (indoors) | Friday, July 17th 2020, 11:20am-12:40pm | Sunny day | 875 | 0.22 |
| Busy street - Under the Passerelle Bouchut | Wednesday, July 29th 2020, 12pm-1pm | Hot and sunny day | 800 | 0.05 |
| Bellecour subway station - Platform of Line D (indoors) | Tuesday, July 28th 2020, 3pm-4pm | Hot and sunny day | 849 | 0.26 |
| Croix-Rousse boulevard - street cafés | Friday, September 11th 2020, 6:30pm-7pm | Nice weather | 13 | / |
| Grande rue de la Croix Rousse (shopping street) | Saturday, January 16th 2021, 11am-12pm | Cold and cloudy day | 420 | 0.06 |
| Saint-Jean street in the Old Town of Lyon | Monday, September 21st 2020, 1pm-2pm | Hot and cloudy day | 481 | 0.11 |
| Place des Terreaux - Bar/Restaurant terraces | Thursday, October 8th 2020, 5:40pm-6pm | Sunny day, cool weather | 30 | / |
| Croix-Rousse - Main market alley | Sunday, October 18th 2020, morning | Sunny day | 183 | 0.46 |
| COVID-19 testing site | Monday, October 19th 2020, 8:30am-10:30am | Outdoor waiting lines (cold day) - Indoor waiting lines (sport arena) | 66 | / |
After correcting for lens deformation, the trajectories and head orientations were extracted by extensive manual tracking with the help of a dedicated Python script and a touch screen. The pixel coordinates are converted into real-world coordinates using the following geometric relation,
where , is the angle between the camera axis and the vertical direction (we systematically found , reflecting the top view used in virtually all videos). Here, the and coordinates are defined in a frame that has been conventiently rotated in the horizontal plane so that one of its axes coincides with the horizontal projection of the camera axis; these coordinate systems are connected to and , respectively, by rotations in Euclidean space. The unknown parameters in this relation (i.e., the angles of these rotations, , , and ) are estimated by fitting at least 4 calibration points at predefined positions, where a team member stood in each scenario.
The expected uncertainty on positions created by failing to account for height differences () between individuals is expected to be around in the present conditions, where is the angle in which the pedestrian was filmed with respect to the vertical. In practice, by double-tracking some test pedestrians, we estimate that the uncertainty is typically below or around 20 cm. The same method allowed us to evaluate the standard deviation of the error on head orientations to . Some videos, especially for the static scenarios, were filmed from a more distant viewpoint, in which case the error on the orientations is likely to be larger.
The accuracy of the head orientations extracted from the videos, especially in moving crowds, is also supported by the study of the angular difference between the head orientations and the walking direction of pedestrians. Since we expect that on average, we are interested in the standard deviation of , which we plot as a function of the walking speed in Fig. S1. We observe that head orientations tend to align more and more with the walking direction of pedestrians as they walk faster and the standard deviation smoothly reaches values around at relatively high speeds, which confirms the accuracy of our tracking.
Contact rescaling to compensate for undetected interactions
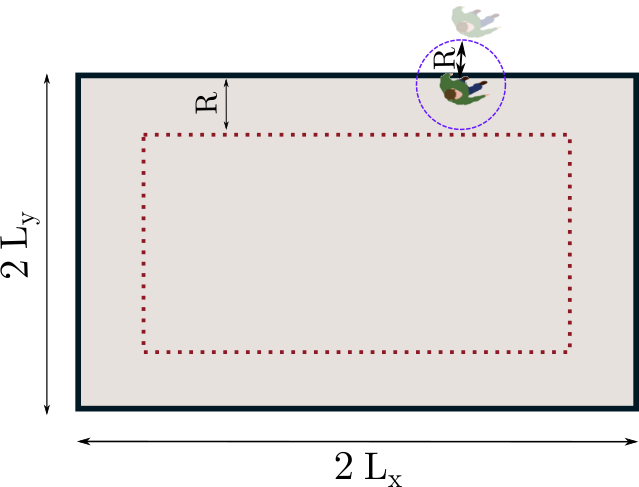
The finite field of view of the camera results in some missed interactions with off-camera people. We can estimate the fraction of missed contacts depending on the separation distance under an assumption of uniform density. This is achieved numerically by randomly placing points (pedestrians) in an area with the same dimensions as the view field and testing if secondary points inserted at a distance of the first one in a random direction are inside or outside the area. Then, all detected interactions are multiplied by a factor to compensate for those that went undetected; for practical purposes, we set a maximal value (20) to this factor, to avoid excessive amplification of the statistical noise at large separation distances .
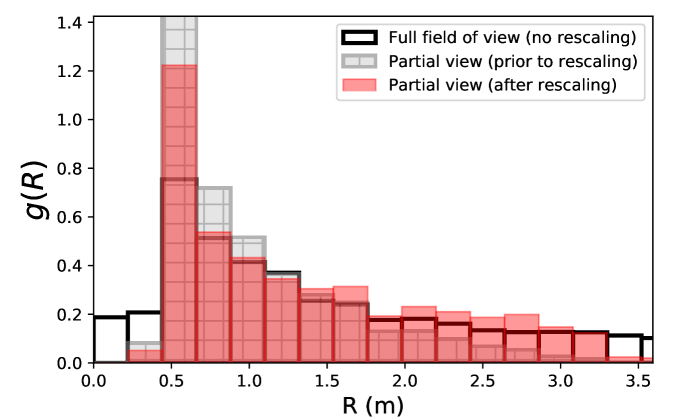
This method is put to the test by focusing on a small area of dimensions 3 m3 m in the view field of a given scenario and computing the radial distribution function of contacts (i.e., where is the number of contacts of range ) in the ’partial’ field before and after applying the rescaling method. Figure S2 demonstrates the efficiency of the method: After rescaling, gets much closer to the distribution measured in the original field of view (up to statistical noise, since only a fraction of the people are then observed).
Appendix B Ad hoc models for viral transmission
This supplementary section details and discusses the ad hoc functions that were introduced to model the transmission rate , defined such that is the probability for a susceptible individual to be infected by the index patient over the interval .
Specification of transmission models
We start by recalling the generic expression chosen for these functions (Eq. 3 of the main paper),
| (S1) |
emphasizing that and are the orientations of the pedestrians’ heads, hence mouths and noses, relative to the vector that connects them, in the horizontal plane, i.e., irrespective of the difference in height. Accordingly, corresponds to a face-to-face interaction.
The formulation of Eq. S1 is arbitrary to a large extent, but its main features are derived from experimental and numerical data. Experimental images of inhalation [59] and expiratory emissions during breathing, speaking [20], or coughing [17], as well as computational fluid dynamics simulations [19, 23, 20], brought to light strong directed transport of respiratory droplets overs tens of centimeters, reaching a couple of meters; the exhaled cloud is mostly enclosed in a cone of half-angle between and at most, depending on the speech conditions [20], thus pointing to a significantly smaller characteristic angle . In passing, note that such conical propagation is well described by Eq. S1, in which and are decoupled. Inhalation is also directional, but, as ambient air from all around the mouth will be breathed in [20], we have systematically considered that its directionality was less marked, i.e., (see Table 1 of the main paper).
Regarding the characteristic distance , a review of 172 observational studies [45] tentatively suggests that keeping a physical distance of 1 meter reduces the infection risk from 13% (very close contact) to 3% and down to 1.5% if a distance of 2 meters is maintained, although there is very large dispersion in the data. In the UK, the Scientific Advisory Group on Emergencies (SAGE) asserts that physically distancing by 2 meters instead of 1 reduces the risks by a factor between 2 and 10 [15]. This translates into an exponent in function , a value if one uses function or if one uses function . However, at larger physical distances, contacts may have been less in a face-to-face orientation or shorter in duration, so these ranges ought to be taken with a grain of salt. Chen et al.’s theoretical work rather suggests for talking and for coughing (see Fig. 7 of [19]). In any event, our goal is to consider a family of parameter sets spanning the whole range between those for which viral transmission is more likely (conservative, or ‘pessimistic’, approach) and those for which it more seldom occurs (‘optimistic’, i.e., predicting fewer infections).
As for the time parameter, it is most easily expressed as which is the characteristic duration for infection at a distance . Contact tracing routines generally consider a threshold duration between 5 and 15 minutes. Nonetheless, this value may be at the safe end of the spectrum, as exposure case studies have only reported very few cases with contacts lasting less than 15 minutes.
Finally, we also modeled uncovered sneezes, which are longer ranged than other expiratory events but also highly directional [17]. Even though the emitted jet is reported to reach 7 or 8 meters, not all droplets are expected to travel this far, as seen in the experimental images of [17]. Accordingly, we settled for , which means that the risk at a distance of 7 meters is 1% of that at 50 cm with the function, 3% with , but close to zero with .
There is no denying that the foregoing ad hoc models and their parameters are but coarse approximations of the reality: They do not account for the effect of wind, ventilation, or humidity [23], nor do they describe the dynamics of exhaled jets and the time lag due to their propagation. Perhaps more importantly, the variability in droplet emission and viral shedding between individuals is overlooked, as is their dependence on their activity (breathing through the nose or the mouth, panting, talking loud, coughing, etc.), which is known to have a major impact [60, 16, 18]. However, since virtually all scenarios under consideration (with the exception of the cafés) involve similar activities, i.e., very moderate physical activity and limited talking, we expect our approach to hold in a statistical sense, although different index patients may be associated with different parameter sets in the model. The characteristic duration is set by noting that a single sneeze may expel 10 times as many respiratory droplets as 5 minutes of talking [52], but generally does not occur more than once every few minutes. This is particularly true if the focus is on uncovered sneezes. Accordingly, as a worst-case estimate, we set .
Consistency with the current knowledge about infection risks and droplet emission
Let us now examine to what extent case reports may support the proposed models.
Generally, outbreak reports do not specify the very precise circumstances of the infections. Still, the attack rates in diverse settings are useful indications. Indeed, within households, reported attack rates range from 5% to 30% [47], for instance around 15% in [48, 49, 50]. At work or in the community, casual episodic contacts, even face to face, do not necessarily trigger an outbreak of cases [48, 43]. Furthermore, it was reported that at Solano County hospital (California, US) the majority of healthcare personnel did not get infected despite spending 10 to 50 minutes in the same room as a Covid patient, often within 2 meters and with no facial mask [44]. All these pieces of evidence hint at an average time for infection in a close face-to-face contact that is probably longer than minutes.
Another general indication comes from the basic reproductive number in the pre-pandemic context, which was around . Contact pattern data in this usual, pre-pandemic context imply that only 7% of contacts lasting longer than 15 minutes lead to an infection [35]. To translate this probability of infection into parameter values for our model, we need to make some assumptions about how long and how close these interactions were actually. We shall assume that prolonged contacts were typically 20 minutes long in a face-to-face setting and we will leave aside possible differences in height. Then, if the contact distance is only 50 cm, this yields a characteristic time for infection of a couple of hours. If the contact distance is only 80 cm, is found to be between 20 minutes and 2 hours, depending on the functional choice , or and the chosen value for . Thus, this gives credence to the ‘optimistic’ end of our parameter spectrum.
Further insight is provided by empirical measurements of the particle number concentration of the respiratory droplets exhaled by a (healthy) subject [41]. The concentration of droplets of sizes was measured at different distances in front of a subject during coughing, with and without face covering. In Fig. S3, we compare the spatial decay of these measurements (without face covering) to the predictions of some of our transmission models. Excellent agreement is found with the moderately optimistic and standard models combined with . Yet, one should bear in mind that the measurements were made while the subject was coughing, which may increase the transmission range. Therefore, these data once again support the most optimistic of our transmission models.
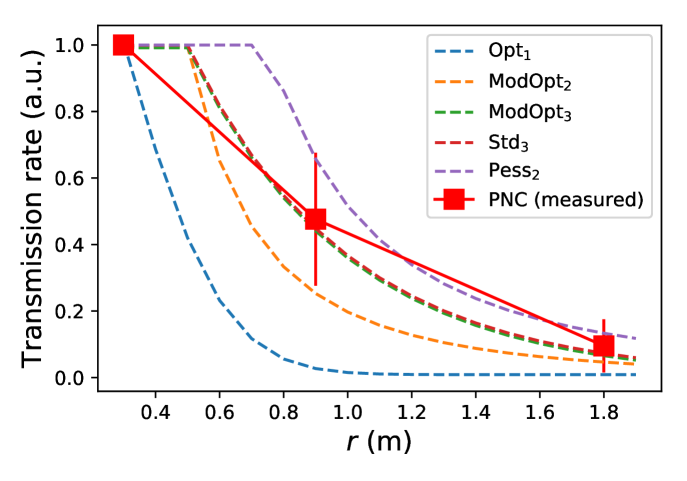
The following abbreviations are used: Opt1 (optimistic parameters combined with ), ModOpt2 (moderately optimistic parameters combined with ), ModOpt3 (moderately optimistic parameters combined with ), Std3 (standard parameters combined with ), Pess2 (pessimistic parameters combined with ).
Order of magnitude of droplet emission
One may also wonder how compatible the model parameters are with the current fundamental knowledge about droplet emission. Exhaled droplets are very broadly distributed in size around a mean value of and contain viral copy (mostly zero or one copy) per droplet [52]. Talking for five minutes, or coughing once in these 5 minutes (which is a relevant frequency according to coughing statistics [2]) will expel about droplets. It is difficult to estimate what fraction of these will be breathed in by a person standing 50 cm apart, but, following the reasoning of [20], droplets should be diluted by a factor at this distance, so it is reasonable to estimate that at most a few () of the droplets will be inhaled, a significant fraction () of which may deposit in the nasopharynx, where they are most likely to lead to an infection [51]. Assuming an infectious dose of particles [51], i.e., that only one in a hundred virions will successfully invade a host cell and replicate, one arrives at a characteristic time for infection of several hours ). Notwithstanding how rough an estimate this is, it is worth noticing that it is once again rather in line with the very optimistic end of our spectrum of plausible values.
As a matter of fact, on the basis of a similar, but more rigorous reasoning, Yang et al. derived shorter infection times , but their explicitly conservative approach assumes constant speech and rests on the idea that any inhaled droplet reaches zones where viral penetration in the cellular tissue is possible [30].
Direct comparison with the collated statistics of infections aboard Chinese trains
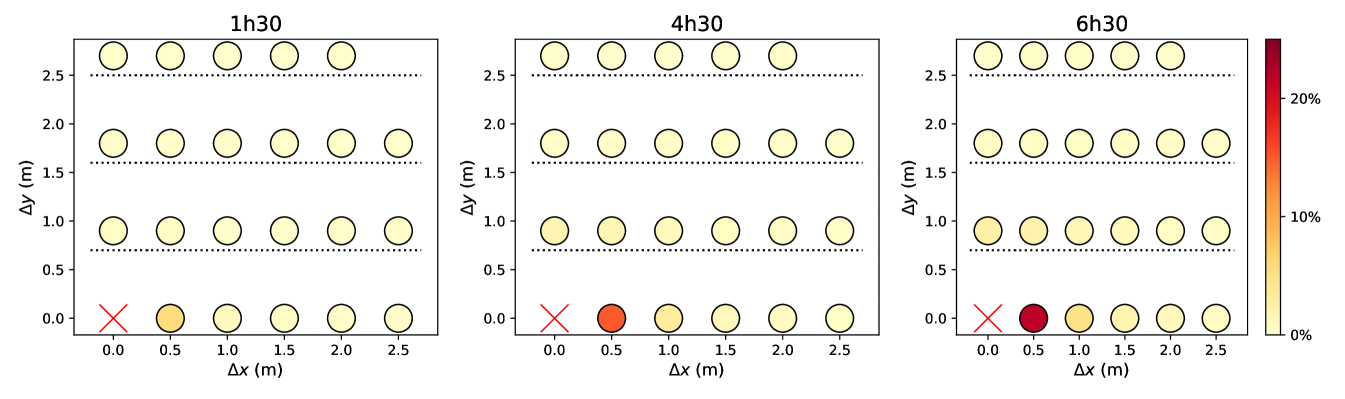
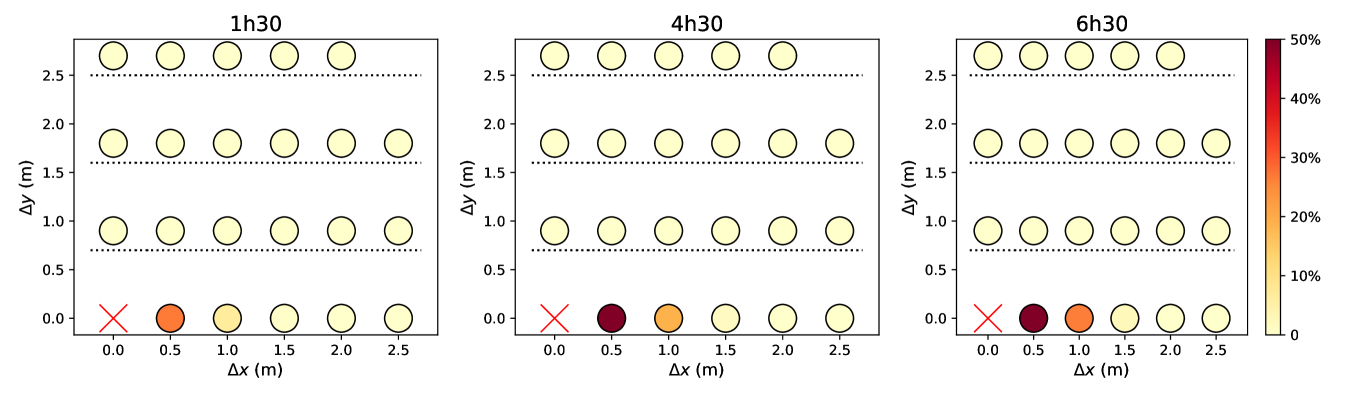
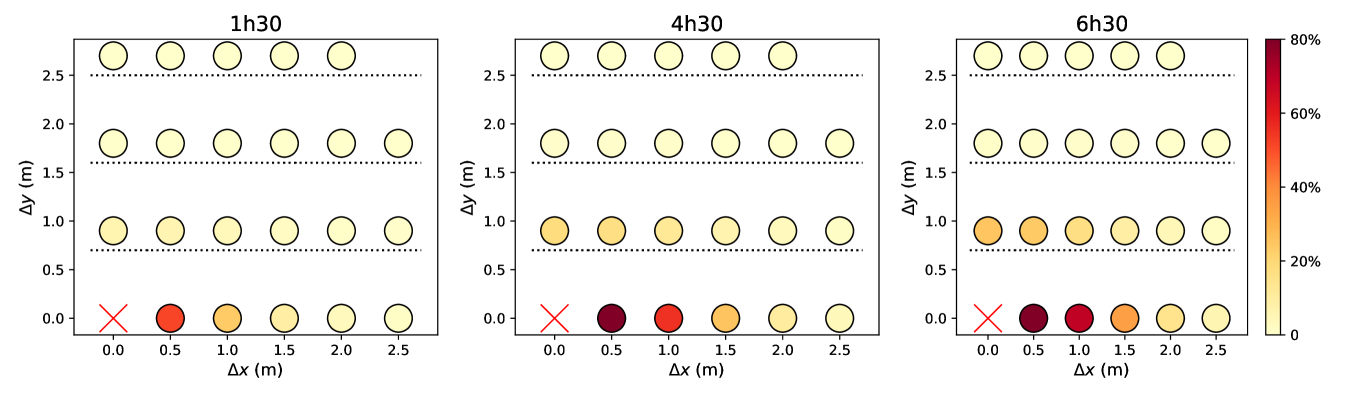
It is generally difficult to test transmission models against empirical data related to Covid-19 cases in a statistically meaningful way because the detailed interactions between the index patient and his or her contacts are seldom known. However, Hu et al.’s study of transmission risks among train passengers in China [4] provides a virtually unique opportunity to attempt such a direct comparison. Indeed, Hu et al. were able to retrieve the trip record of confirmed Covid-19 patients who had traveled on a train in the 14 days before the onset of the illness, between December 2019 and late February 2020. Having access to the detailed seating plan on their train coaches, the researchers then tracked reported Covid-19 cases among co-travelers and computed the infection probability depending on the distance (expressed as a number of rows and columns) between the index patients and the contacts. A marked increase in the infection risk was found for people seated in the same row as the index patient, especially in adjacent seats, for more than a couple of hours.
Leaving aside the fact that a train coach is an enclosed (but usually ventilated) space, the transmission models introduced above can be applied to these settings. Distances between seats and rows are precisely known. The central aisle is counted as one seat, as in the original study [4], while the barrier to transmission created by seat rows (and represented by dashed lines in Fig. S4) is arbitrarily considered to have an effect comparable to an additional distance of 1 meter. In the light of our empirical measurements on moving and queuing crowds (see the main text), the passengers’ head orientation is assumed to be normally distributed around the axial direction, with a standard deviation of ; we consider that the seated position suppresses the rotations of the whole torso that are occasionally observed in standing pedestrians.
Figure S4 presents the probabilities of infection evaluated on this basis using three different transmission models on the optimistic side of the parameter spectrum, with the help of Eq. S3. These results are directly confronted with Fig. 2 of [4]; the three of them are found to compare well as far as both the evolution of the risks with co-travel duration and their spatial pattern are concerned.
A note of caution should nevertheless be made about the absolute values of infection probabilities, which peak at about 10% in [4], compared to 25% to 80% here. This very notable difference may largely be due to the fact that all trips of the index patient in the two weeks before his or her diagnosis are taken into account in [4] whereas it is very unlikely that the patient was contagious during all this period. If the contagious period before the onset of symptoms spans two to three days [61, 47], i.e., about 15% to 20% of the two-week period, then applying this 15-20% ratio to the simulated infection probabilities yields values that become comparable to those reported by [4]. These pieces of evidence thus give credence to our transmission models coupled with optimistic parameter sets.
Another caveat should however be mentioned regarding Hu et al.’s work [4]: The researchers admit that they were not able to distinguish relatives from unrelated people in their data. Therefore, part of the reported infections may not have taken place aboard the train, but elsewhere.
O
M
M
ptimistic parameters combined with :
 oderately optimistic parameters combined with :
 oderately optimistic parameters combined with (ModOpt3):
Appendix C Transmission
Our study relies on the independent action hypothesis introduced by Druett in the early 1950s [54] and partially validated by Zwart in virus-insect pathosystems a decade ago [55]. It posits that there is no minimal infectious dose and that one can overlook cooperative or antagonistic interactions between virions in the host system and assign to each of them a finite probability (here denoted by ) to cause an infection. This yields a Wells-Riley-like equation [56] for the time evolution of the contagion status of (initially susceptible) agent , Juliette, infected by index patient , Iago ( is the probability that Juliette is infected), viz.,
| (S2) | |||||
| (S3) |
where is the risk transmission rate, is the minimal infectious dose, and is the number of viral copies exchanged between Iago and Juliette per unit time around time . Accordingly, if Iago was filmed between time and time , the number of new infections that were actually witnessed (or ’event ’ in the terminology of [57]) can be estimated to
| (S4) | |||||
where contains Iago and all other agents that we visually identified as members of his group (family, friends, etc.) and is the probability that Juliette was already infected at . Note that similar assumptions about the rate of infections were made in a recent paper that we came across just before submission [57]. Let us emphasize in particular that intra-group infections are discarded here, because group members are likely to have been infected outside the scenario of interest, whereas our purpose is to estimate new infections in the scenario.
Scenarios involving a moving crowd
To compute Eq. S4, an issue must be overcome. Indeed, due to their limited temporal and spatial span, our observations may not capture all interactions between Iago and other pedestrians, in the non-static scenarios. Therefore, the infection status at is difficult to evaluate. To circumvent the issue, we derive upper and lower bounds on that do not require specific information about the .
The upper bound is straightforward, because by definition, which implies that . This value can be converted into an hourly rate of new infections, , by multiplying it with .
The lower bound requires more careful examination, wherein we will set a maximal value to the number of people that have already been infected at , under the hypothesis that only Iago is contagious on the premises. Let be the group of unrelated pedestrians j with whom Iago came in contact while filmed, so that this number reads . If Iago and Juliette (j) are unrelated, it is sensible to consider that they have not been close to one another for more than a duration in the global scenario (we will set for most scenarios), viz.,
| (S5) |
where is our upper-bound estimate for the number of infections during . Note that the foregoing inequality manifestly holds if Iago and Juliette’s interaction took place in the interval , but it will also hold should the interaction have occurred earlier, provided that our video is representative. Indeed, under this proviso, Juliette is equally likely to have already been infected at as any random pedestrian in Iago’s vicinity in the interval (note that these random pedestrians are more numerous than those observed in , because it was almost always verified that ). It follows from Eq. S5 that
One is thus left with an optimization under constraints, wherein one has to minimize (i.e., find a lower bound for)
| (S6) |
under the following constraints on the variables ,
This optimization problem may for instance be solved using Lagrange’s multipliers. The minimum is reached at such that for all , except
-
1.
the indices exhibiting the highest values , which are set to ,
-
2.
, which is set to .
In other words, this boils down to treating as infected the unrelated people who interacted most closely with Iago on the video. The lower bound that we were seeking is obtained by computing Eq. S6 with the above , which concludes our search.
Finally, let us note that the foregoing reasoning can easily be extended to a population with partial immunity, by replacing the initial conditions with , where is the fraction of immunized people.
Static scenarios
In the ’static’ scenarios, i.e., the streets cafés and the queue, interactions are less changing. Therefore, we consider that the interactions that are observed on the videos are prolonged over the whole period of study, i.e., 1 hour to get an hourly rate. Accordingly, the risk increments in Eq. S3 are simply multiplied by , where generally coincides with the duration of the video, and the hourly rate of new infections is given by
A remark should be made here. The sum is not restricted to people that are unrelated to Iago, contrary to the case of moving crowds, and we assume that everybody apart from Iago is initially susceptible, . Indeed, infections at a café are counted starting from the moment when people meet and sit together. Besides, on these videos, we are not able to distinguish Iago’s household members (who may have been infected beforehand) from his other relatives or friends, so everybody is assumed initially susceptible.
Appendix D Dynamic model of viral transmission
The main text of this paper focused on a family of ad hoc models of viral transmission that overlook the propagation dynamics of respiratory droplets. In this supplemental section, we generalize our methodology by considering dynamical transmission models derived from microscopic fluid dynamics computations of droplet propagation. This will allow us to ascertain that our main findings remain valid with more realistic transmission models and, in particular, that the differences in the estimated infection risks between scenarios are not an artifact due to our simple models, but arise from intrinsic differences between the scenarios. Admittedly, the more realistic models used in this section also suffer from some inaccuracies, by accounting neither for the wind nor for differences in walking speeds, in activity (speech, cough), and so on; a more exhaustive study including these effects is differed to a subsequent publication. Still, they tend to bolster the robustness of our main results.
The propagation of droplets emitted during a pedestrian’s breathing cycle is simulated with the CFD (Computational Fluid Dynamics) software YALES2 [62] (https://www.coria-cfd.fr/index.php/YALES2), already used in the context of the transport of respiratory droplets [20, 30]. We first compute the air flow field around a standing person () and the flow field around a pedestrian walking at speed , separately. In the latter case, the simulation is performed in the moving frame of the walker, so that the difference of speed between the pedestrian and the ambient air is mimicked by a uniform airflow at opposite to the walking velocity (the person thus remains static and body motion is not accounted for). The pedestrian is breathing out through the mouth with a breathing period of 3 s, with 1.5 s of exhaling and inhaling times, and an exhaled flow rate of 20 L/min, which is representative of mild exercise. The mouth region delimited by the lips has an area of 5 cm2, approximately. Uniform flow is imposed at exhalation, with a flow along the walking direction. The boundaries of the domain are typically 2 m away from the walker; the grid is fully tetrahedral, with a mesh size as low as 5 mm in the vicinity of the head and a uniform mesh size of 8 mm in the rest of the region of interest where droplets flow. This is dealt with automatic mesh refinement [63] which adapts the mesh size along the course of the calculation.
Then, we simulate the propagation of respiratory droplets of various diameters in these flow fields, as illustrated in the top view of Fig. S5(a). As the issue of droplet evaporation is still debated and its impact may have been overestimated in the past [27], we chose not to account for evaporation here. As a first approximation, we thus performed simulations at constant temperature, so that incompressible Navier-Stokes equations are solved, with a uniform kinematic viscosity of . Buoyancy effects are thus neglected, but they are not expected to dominate in this configuration where rapid mixing occurs between the exhaled air and the ambient air. We use Large-Eddy Simulations with the so-called sigma subgrid model [65] and the numerical method is identical to the one recently used by Abkarian et al. [20] for simulations of the flow generated by speech. The simulation is run for several cycles (e.g., 7 cycles, i.e., 21 s, for the walking pedestrian): the flow is established during the first 3 cycles and only the subsequent cycles are used to compute the coarse-grained transmission rates.
Another issue is also prickly, that of the sizes of exhaled droplets. Widely different distributions of sizes can be found in the literature, leading to widely different travel ranges [39]. Here, we arbitrarily selected Johnson et al.’s [64] data and focused on the breathing mode, for which the distribution of droplet diameters is log-normal and its cumulative function obeys
| (S7) |
where and .
Provided that exhaled droplets have an equal concentration of viral copies, the disease transmission rate due to droplets shed at and inhaled at is proportional to the mass concentration of droplets at the receiver’s position at , relative to the emitter’s position at , within a -thick horizontal slice centered on the emitter’s mouth. The spatio-temporal evolution of this rate is symmetrized and coarse-grained by binning the data into of duration 0.2 s and polar cells of radial length 20 cm. The question of the number of emitted droplets and that of the viral load are eluded by setting a characteristic infection time of 10 min for someone standing face-to-face with a static emitter at a distance . Finally, the effect of the inhaler’s head orientation is accounted for by multiplying this rate by a factor , as in our standard models coupled with . This dependence is not established on the basis of CFD simulations; doing so would entail several additional complications.
The resulting coarse-grained rates are found to display a fairly similar spatio-temporal pattern for the standing emitter and for the walking one, shown in Fig. S5(b) in the laboratory frame, except that in the former case the propagation is slower and shorter-ranged (in the laboratory frame) whereas the risk induced by the walker is more diffuse in space.
Coupling the dynamic models777 For the street cafés and the queuing scenario, since most people are static, we simplified the model by integrating the dynamic transmission rates over the time delay , viz., . to our field data yields the ranking of scenarios by the risks they present that is displayed in Fig. S6. Here, as a first approach, we have made the choice to apply
the same model to all scenarios in each panel of Fig. S6 [be it the ‘standing’ one on the left panel or the ‘moving’ one on the right panel], irrespective of the individual walking velocities. We agree that this choice is questionable, but at present we are unable to assign a speed-adjusted emission model to each pedestrian and all moving scenarios involve people walking at different speeds and a significant fraction of nearly static ones. Albeit questionable, our choice has the merit of not resting on an arbitrary, scenario-specific mingling of the transmission models.
The main conclusion to be drawn from Fig. S6 is that the hierarchy of risks (dominated by street cafés888Incidentally, the intriguing discrepancy between the two street café scenarios also owes to this short transmission range, whereby the crowd’s configuration is probed at fine length scales; a similar tendency could already be observed with our optimistic models., with fairly busy streets very far behind) is identical to that found with our ad hoc models. Besides, we have checked that varying the characteristic time (within reasonable bounds) does not alter the results much: Increasing it from 10 min to 20 min, for instance, more or less uniformly halves the predicted infection rates. These observations invite us to take the predicted rate values with a pinch of salt, given their sensitivity to a variety of details, but above all they further bolster the relative scenario rankings put forward in the paper.
Finally, we revisited our predictions regarding the effect of the queuing geometry in the light of these more realistic models. For this purpose, the rate of new infections in a queue were computed afresh, depending on its geometry and using the CFD transmission model for standing people (), integrated over time delays, as the queuing pedestrians are mostly static. The results are presented in Fig. S7 and, once again, are qualitatively very similar to those obtained previously, even though quantitatively smaller rates are found.
Appendix E Additional figures
References
- [1] R. Mittal, R. Ni, J.-H. Seo, The flow physics of covid-19, Journal of fluid Mechanics 894 (2020).
- [2] L. Bourouiba, The fluid dynamics of disease transmission, Annual Review of Fluid Mechanics 53 (2020).
- [3] S. Chang, E. Pierson, P. W. Koh, J. Gerardin, B. Redbird, D. Grusky, J. Leskovec, Mobility network models of covid-19 explain inequities and inform reopening, Nature (2020) 1–8.
- [4] M. Hu, H. Lin, J. Wang, C. Xu, A. J. Tatem, B. Meng, X. Zhang, Y. Liu, P. Wang, G. Wu, et al., The risk of covid-19 transmission in train passengers: an epidemiological and modelling study, Clinical Infectious Diseases (2020).
- [5] Q. J. Leclerc, N. M. Fuller, L. E. Knight, S. Funk, G. M. Knight, C. C.-. W. Group, et al., What settings have been linked to sars-cov-2 transmission clusters?, Wellcome Open Research 5 (83) (2020) 83.
- [6] S. Galmiche, T. Charmet, L. Schaeffer, R. Grant, A. Fontanet, J. Paireau, S. Cauchemez, O. Chény, C. Platen, A. Maurizot, et al., Etude des facteurs sociodémographiques, comportements et pratiques associés à l’infection par le sars-cov-2 (comcor) (march 2021), Tech. rep., Institut Pasteur; Caisse Nationale d’Assurance Maladie; IPSOS (2021).
- [7] T. C. Bulfone, M. Malekinejad, G. W. Rutherford, N. Razani, Outdoor transmission of sars-cov-2 and other respiratory viruses: A systematic review, The Journal of infectious diseases 223 (4) (2021) 550–561.
- [8] Y. Shen, C. Li, H. Dong, Z. Wang, L. Martinez, Z. Sun, A. Handel, Z. Chen, E. Chen, M. H. Ebell, et al., Community outbreak investigation of sars-cov-2 transmission among bus riders in eastern china, JAMA Internal Medicine (2020).
- [9] M. Weed, A. Foad, Rapid scoping review of evidence of outdoor transmission of covid-19, medRxiv (2020).
-
[10]
D. Farrington,
Video
shows packed beer garden at pub at centre of covid-19 outbreak, Express and
Star (Jul 2020).
URL https://www.expressandstar.com/news/health/coronavirus-covid19/2020/07/29/dozens-queue-to-be-tested-for-coronavirus-after-outbreak-at-stone-pub/ -
[11]
A. Giuffrida, P. Beaumont,
Coronavirus:
inquiry opens into hospitals at centre of italy outbreak, The Guardian (Feb
2020).
URL https://www.theguardian.com/world/2020/feb/26/coronavirus-inquiry-opens-into-hospitals-at-centre-of-italy-outbreak - [12] E. C. for Disease Prevention, Control, Covid-19 clusters and outbreaks in occupational settings in the eu/eea and the uk, Technical report, European Centre for Disease Prevention and Control (August 2020).
- [13] N. H. Leung, D. K. Chu, E. Y. Shiu, K.-H. Chan, J. J. McDevitt, B. J. Hau, H.-L. Yen, Y. Li, D. K. Ip, J. M. Peiris, et al., Respiratory virus shedding in exhaled breath and efficacy of face masks, Nature medicine 26 (5) (2020) 676–680.
- [14] P. Bahl, S. Bhattacharjee, C. de Silva, A. A. Chughtai, C. Doolan, C. R. MacIntyre, Face coverings and mask to minimise droplet dispersion and aerosolisation: a video case study, Thorax 75 (11) (2020) 1024–1025.
- [15] S. A. G. on Emergencies, Transmission of sars-cov-2 and mitigating measures (june 4th, 2020), Tech. rep., Scientific Advisory Group for Emergencies (SAGE) of the United Kingdom (2020).
- [16] L. Morawska, G. Johnson, Z. Ristovski, M. Hargreaves, K. Mengersen, S. Corbett, C. Y. H. Chao, Y. Li, D. Katoshevski, Size distribution and sites of origin of droplets expelled from the human respiratory tract during expiratory activities, Journal of Aerosol Science 40 (3) (2009) 256–269.
- [17] L. Bourouiba, E. Dehandschoewercker, J. W. Bush, Violent expiratory events: on coughing and sneezing, Journal of Fluid Mechanics 745 (2014) 537–563.
- [18] S. Asadi, A. S. Wexler, C. D. Cappa, S. Barreda, N. M. Bouvier, W. D. Ristenpart, Aerosol emission and superemission during human speech increase with voice loudness, Scientific reports 9 (1) (2019) 1–10.
- [19] W. Chen, N. Zhang, J. Wei, H.-L. Yen, Y. Li, Short-range airborne route dominates exposure of respiratory infection during close contact, Building and Environment (2020) 106859.
- [20] M. Abkarian, S. Mendez, N. Xue, F. Yang, H. A. Stone, Speech can produce jet-like transport relevant to asymptomatic spreading of virus, Proceedings of the National Academy of Sciences 117 (41) (2020) 25237–25245.
- [21] L. Bao, H. Gao, W. Deng, Q. Lv, H. Yu, M. Liu, P. Yu, J. Liu, Y. Qu, S. Gong, et al., Transmission of sars-cov-2 via close contact and respiratory droplets among hace2 mice, The Journal of Infectious Diseases (2020).
- [22] T. Li, Y. Liu, M. Li, X. Qian, S. Y. Dai, Mask or no mask for covid-19: A public health and market study, PloS one 15 (8) (2020) e0237691.
- [23] Y. Feng, T. Marchal, T. Sperry, H. Yi, Influence of wind and relative humidity on the social distancing effectiveness to prevent covid-19 airborne transmission: A numerical study, Journal of aerosol science (2020) 105585.
- [24] N. Ferguson, D. Laydon, G. Nedjati-Gilani, N. Imai, K. Ainslie, M. Baguelin, S. Bhatia, A. Boonyasiri, Z. Cucunubá, G. Cuomo-Dannenburg, et al., Report 9: Impact of non-pharmaceutical interventions (npis) to reduce covid19 mortality and healthcare demand, Imperial College London 10 (2020) 77482.
- [25] L. Ferretti, C. Wymant, M. Kendall, L. Zhao, A. Nurtay, L. Abeler-Dörner, M. Parker, D. Bonsall, C. Fraser, Quantifying sars-cov-2 transmission suggests epidemic control with digital contact tracing, Science 368 (6491) (2020).
- [26] T. Harweg, D. Bachmann, F. Weichert, Agent-based simulation of pedestrian dynamics for exposure time estimation in epidemic risk assessment, arXiv preprint arXiv:2007.04138 (2020).
- [27] K. L. Chong, C. S. Ng, N. Hori, R. Yang, R. Verzicco, D. Lohse, Extended lifetime of respiratory droplets in a turbulent vapor puff and its implications on airborne disease transmission, Physical Review Letters 126 (3) (2021) 034502.
- [28] L. Morawska, D. K. Milton, It is time to address airborne transmission of coronavirus disease 2019 (covid-19), Clinical Infectious Diseases (2020).
-
[29]
N. R. Jones, Z. U. Qureshi, R. J. Temple, J. P. J. Larwood, T. Greenhalgh,
L. Bourouiba, Two metres or
one: what is the evidence for physical distancing in covid-19?, BMJ 370
(2020).
arXiv:https://www.bmj.com/content/370/bmj.m3223.full.pdf, doi:10.1136/bmj.m3223.
URL https://www.bmj.com/content/370/bmj.m3223 - [30] F. Yang, A. A. Pahlavan, S. Mendez, M. Abkarian, H. A. Stone, Towards improved social distancing guidelines: Space and time dependence of virus transmission from speech-driven aerosol transport between two individuals, Physical Review Fluids 5 (12) (2020) 122501.
- [31] V. Vuorinen, M. Aarnio, M. Alava, V. Alopaeus, N. Atanasova, M. Auvinen, N. Balasubramanian, H. Bordbar, P. Erästö, R. Grande, et al., Modelling aerosol transport and virus exposure with numerical simulations in relation to sars-cov-2 transmission by inhalation indoors, Safety Science 130 (2020) 104866.
- [32] F. Poydenot, I. Abdourahamane, E. Caplain, S. Der, J. Haiech, A. Jallon, I. Khoutami, A. Loucif, E. Marinov, B. Andreotti, Risk assessment for long and short range airborne transmission of sars-cov-2, indoors and outdoors, using carbon dioxide measurements, arXiv preprint arXiv:2106.09489 (2021).
- [33] Y. Xiao, M. Yang, Z. Zhu, H. Yang, L. Zhang, S. Ghader, Modeling indoor-level non-pharmaceutical interventions during the covid-19 pandemic: a pedestrian dynamics-based microscopic simulation approach, arXiv preprint arXiv:2006.10666 (2020).
- [34] V. Romero, W. D. Stone, J. D. Ford, Covid-19 indoor exposure levels: An analysis of foot traffic scenarios within an academic building, Transportation Research Interdisciplinary Perspectives 7 (2020) 100185.
- [35] S. Moritz, C. Gottschick, J. Horn, M. Popp, S. Langer, B. Klee, O. Purschke, M. Gekle, A. Ihling, R. Mikolajczyk, The risk of indoor sports and culture events for the transmission of covid-19 (restart-19), medRxiv (2020).
- [36] C. A. Pouw, F. Toschi, F. van Schadewijk, A. Corbetta, Monitoring physical distancing for crowd management: Real-time trajectory and group analysis, PloS one 15 (10) (2020) e0240963.
- [37] E. Ronchi, R. Scozzari, M. Fronterrè, A risk analysis methodology for the use of crowd models during the covid-19 pandemic, Tech. Rep. 3235, Lund University, Department of Fire Safety Engineering, lUTVDG/TVBB (2020).
- [38] S. Freeman, A. Eykelbosh, Covid-19 and outdoor safety: Considerations for use of outdoor recreational spaces, National Collaborating Centre for Environmental Health (2020).
- [39] M. Rosti, S. Olivieri, M. Cavaiola, A. Seminara, A. Mazzino, Fluid dynamics of covid-19 airborne infection suggests urgent data for a scientific design of social distancing, Scientific reports 10 (1) (2020) 1–9.
- [40] R. K. Bhagat, M. D. Wykes, S. B. Dalziel, P. Linden, Effects of ventilation on the indoor spread of covid-19, Journal of Fluid Mechanics 903 (2020).
- [41] L. Li, M. Niu, Y. Zhu, Assessing the effectiveness of using various face coverings to mitigate the transport of airborne particles produced by coughing indoors, Aerosol Science and Technology (2020) 1–11.
- [42] S. P. France, Covid-19 point épidémiologique hebdomadaire du 03 décembre 2020, Technical report, Santé Publique France (December 2020).
- [43] R. M. Burke, S. Balter, E. Barnes, V. Barry, K. Bartlett, K. D. Beer, I. Benowitz, H. M. Biggs, H. Bruce, J. Bryant-Genevier, et al., Enhanced contact investigations for nine early travel-related cases of sars-cov-2 in the united states, medRxiv (2020).
- [44] A. Heinzerling, P. M. J. Stuckey, T. Scheuer, K. Xu, K. M. Perkins, H. Resseger, S. Magill, J. R. Verani, S. Jain, M. Acosta, et al., Transmission of covid-19 to health care personnel during exposures to a hospitalized patient-solano county, california, february 2020, Tech. rep., US Centers for Disease Control and Prevention (April 2020).
- [45] D. K. Chu, E. A. Akl, S. Duda, K. Solo, S. Yaacoub, H. J. Schünemann, A. El-harakeh, A. Bognanni, T. Lotfi, M. Loeb, et al., Physical distancing, face masks, and eye protection to prevent person-to-person transmission of sars-cov-2 and covid-19: a systematic review and meta-analysis, The Lancet (2020).
- [46] Y. Li, H. Qian, J. Hang, X. Chen, L. Hong, P. Liang, J. Li, S. Xiao, J. Wei, L. Liu, et al., Evidence for probable aerosol transmission of sars-cov-2 in a poorly ventilated restaurant, medRxiv (2020).
- [47] Y. M. Bar-On, R. Sender, A. I. Flamholz, R. Phillips, R. Milo, A quantitative compendium of covid-19 epidemiology, arXiv preprint arXiv:2006.01283 (2020).
- [48] S. Y. Park, Y.-M. Kim, S. Yi, S. Lee, B.-J. Na, C. B. Kim, J.-i. Kim, H. S. Kim, Y. B. Kim, Y. Park, et al., Coronavirus disease outbreak in call center, south korea, Emerging Infectious Disease journal 26 (2020).
- [49] Y. J. Park, Y. J. Choe, O. Park, S. Y. Park, Y.-M. Kim, J. Kim, S. Kweon, Y. Woo, J. Gwack, S. S. Kim, et al., Contact tracing during coronavirus disease outbreak, south korea, 2020, Emerging infectious diseases 26 (10) (2020) 2465–2468.
- [50] R. M. Burke, Active monitoring of persons exposed to patients with confirmed covid-19—united states, january–february 2020, MMWR. Morbidity and mortality weekly report 69 (2020).
- [51] S. Basu, Close-range exposure to a covid-19 carrier: transmission trends in the respiratory tract and estimation of infectious dose, medRxiv (2020).
- [52] W. C. Poon, A. T. Brown, S. O. Direito, D. J. Hodgson, L. Le Nagard, A. Lips, C. E. MacPhee, D. Marenduzzo, J. R. Royer, A. F. Silva, et al., Soft matter science and the covid-19 pandemic, Soft matter 16 (36) (2020) 8310–8324.
- [53] G. Buonanno, L. Morawska, L. Stabile, Quantitative assessment of the risk of airborne transmission of sars-cov-2 infection: prospective and retrospective applications, Environment International 145 (2020) 106112.
- [54] H. Druett, Bacterial invasion, Nature 170 (4320) (1952) 288–288.
- [55] M. P. Zwart, L. Hemerik, J. S. Cory, J. A. G. de Visser, F. J. Bianchi, M. M. Van Oers, J. M. Vlak, R. F. Hoekstra, W. Van der Werf, An experimental test of the independent action hypothesis in virus–insect pathosystems, Proceedings of the Royal Society B: Biological Sciences 276 (1665) (2009) 2233–2242.
- [56] G. N. Sze To, C. Y. H. Chao, Review and comparison between the wells–riley and dose-response approaches to risk assessment of infectious respiratory diseases, Indoor air 20 (1) (2010) 2–16.
- [57] P. Tupper, H. Boury, M. Yerlanov, C. Colijn, Event-specific interventions to minimize covid-19 transmission, Proceedings of the National Academy of Sciences (2020).
- [58] S. Cao, A. Seyfried, J. Zhang, S. Holl, W. Song, Fundamental diagrams for multidirectional pedestrian flows, Journal of Statistical Mechanics: Theory and Experiment 2017 (3) (2017) 033404.
- [59] J. Laverge, M. Spilak, A. Novoselac, Experimental assessment of the inhalation zone of standing, sitting and sleeping persons, Building and environment 82 (2014) 258–266.
- [60] K. P. Fennelly, Particle sizes of infectious aerosols: implications for infection control, The Lancet Respiratory Medicine (2020).
- [61] M. Cevik, J. Marcus, C. Buckee, T. Smith, Sars-cov-2 transmission dynamics should inform policy, Available at SSRN 3692807 (2020).
- [62] V. Moureau, P. Domingo, L. Vervisch, Design of a massively parallel cfd code for complex geometries, Comptes Rendus Mécanique 339 (2-3) (2011) 141–148.
- [63] P. Benard, G. Balarac, V. Moureau, C. Dobrzynski, G. Lartigue, Y. d’Angelo, Mesh adaptation for large-eddy simulations in complex geometries, International journal for numerical methods in fluids 81 (12) (2016) 719–740.
- [64] G. Johnson, L. Morawska, Z. Ristovski, M. Hargreaves, K. Mengersen, C. Y. H. Chao, M. Wan, Y. Li, X. Xie, D. Katoshevski, et al., Modality of human expired aerosol size distributions, Journal of Aerosol Science 42 (12) (2011) 839–851.
- [65] F. Nicoud, H. B. Toda, O. Cabrit, S. Bose, J. Lee, Using singular values to build a subgrid-scale model for large eddy simulations, Physics of fluids 23 (8) (2011) 085106.