subject
Article \Year2021 \MonthJanuary \Vol60 \No1 \DOI10.1007/s11432-016-0037-0 \ArtNo000000 \ReceiveDateJanuary 11, 2021 \AcceptDateApril 6, 2021
Modeling the arc and ring structures in the HD 143006 disk
yliu@pmo.ac.cn
Liu, Y.
Liu, Y.; Flock, M; Fang, M.
Modeling the arc and ring structures in the HD 143006 disk
Abstract
Rings and asymmetries in protoplanetary disks are considered as signposts of ongoing planet formation. In this work, we conduct three-dimensional radiative transfer simulations to model the intriguing disk around HD 143006 that has three dust rings and a bright arc. A complex geometric configuration, with a misaligned inner disk, is assumed to account for the asymmetric structures. The two-dimensional surface density is constructed by iteratively fitting the ALMA data. We find that the dust temperature displays a notable discontinuity at the boundary of the misalignment. The ring masses range from 0.6 to that are systematically lower than those inferred in the younger HL Tau disk. The arc occupies nearly 20% of the total dust mass. Such a high mass fraction of dust grains concentrated in a local region is consistent with the mechanism of dust trapping into vortices. Assuming a gas-to-dust mass ratio of 30 that is constant throughout the disk, the dense and cold arc is close to the threshold of being gravitationally unstable, with the Toomre parameter . Nevertheless, our estimate of relies on the assumption for the unknown gas-to-dust mass ratio. Adopting a lower gas-to-dust mass ratio would increase the inferred value. Follow-up high resolution observations of dust and gas lines are needed to clarify the origin of the substructures.
keywords:
protoplanetary disks, radiative transfer, planet formation97.82.Jw, 95.30.Jx, 97.82.Fs
1 Introduction
To date, there are more than 4000 exo-planets discovered using various techniques, such as radial velocity, transit surveys, and a recently developed method based on disk kinematics [1, 2, 3, 4]. How exactly these planets form remains one of the major questions in modern astrophysics. One direct way to solve the problem is to image the (proto)planets that are still in the making within their natal disks, as they can provide clear insights on where, when, and how planets are born. Unfortunately, such observations are very challenging because the embedded planets are much fainter in the optical/infrared regime compared to the host central star, and even to the emission knots, if present, from the disk material in the vicinity of the planet. Consequently, only a few young stars have been claimed to harbour (proto)planets so far [5, 6], and most of them still require further confirmation [7, 8, 9].
Nowadays, infrared and millimeter images of disks, taken by the Very Large Telescope Spectro-Polarimetric High-contrast Exoplanet REsearch (VLT/SPHERE) and Atacama Large Millimeter/submillimeter Array (ALMA), are able to achieve angular resolutions on the order of [10], corresponding to spatial scales of at the distance of nearby star formation regions (, for instance Taurus). The accumulating SPHERE and ALMA surveys have revealed a variety of disk substructures, such as rings [11, 12, 13], gaps [14, 15, 16], spirals [17, 18, 19, 20], and arcs [21, 22, 23, 24]. The interaction between the disk and embedded planets is one of the proposed explanations for the formation of these features [25]. The properties of substructures together with the disk morphology can be used to constrain the parameters of the embedded planets [26, 27]. Alternative mechanisms, which can produce substructures without planets, include zonal flows generated by the magnetorotational instability turbulence [28, 29], fast pebble growth near condensation fronts of volatiles [30], operation of a secular gravitational instability [31], and the pile-up of drifting pebbles [32, 33]. In these scenarios, disk substructures may play a role of dust trapping, which on the one hand prevents dust particles from rapid inwards drift [34], and on the other hand promotes grain growth and concentration to form planetesimals [35].
It is of particular interest to investigate the properties and stability of disk substructures, because such efforts help to understand how the disk evolves and for what timescales the substructures will impact the process of planet formation. Arcs, or their analogs, e.g., crescents and horseshoes, are often interpreted as vortices arising from the Rossby wave instability (RWI) at the edge of a gap created by a young planet [21, 36]. Some numerical simulations show that, in weakly turbulent disks, vortex-driven arcs and rings might survive for more than planetary orbits, and even for disk evolutionary timescales () [37, 38, 33]. However, observational constraints on the strength of turbulence exist for only a few disks [39, 40].
Rings and arcs in some cases appear extraordinarily far from the central star [22, 41]. In such cold and dense regions, gravitational instability may start to operate, which in turn complicates the determination for the fate of substructures. HD 143006 stands out from this disk category because of its complex geometry and very bright arc outside of the millimeter dust disk [41, 24]. This is a G7 young star located in the Upper Scorpius association at a distance of 166 pc [42, 43]. Its effective temperature and luminosity are and , respectively [44, 13]. Comparing the location in the Hertzsprung-Russell diagram with models of pre-main-sequence evolutionary tracks returns a stellar mass of , and an age of [13]. In this work, we focus on this intriguing object, and conduct three-dimensional radiative transfer modeling of the spectral energy distribution (SED), and high resolution infrared and millimeter images, with the goal of constraining the dust density and temperature distributions. On the basis of the modeling result, we investigate the properties and gravitational stability of the substructures.
2 Observational data
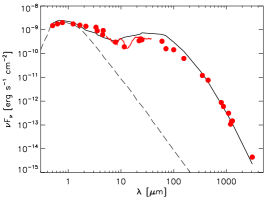
The SED has been widely used to constrain the grain size distribution and overall structure of the disk [45]. We compiled the photometry of HD 143006 from the GAIA [43], 2MASS [46], WISE [47], and IRAS catalogs [48]. In addition, individual flux measurements from optical to millimeter regimes reported in the literature are also collected [49, 50, 51, 52, 44, 13]. As shown in fig. 1, the SED shows a clear dip at , suggesting that substructures (e.g., gaps) exist in the distribution of micron-sized dust grains. A linear fit to the data points longer than results in a millimeter spectral index of , which yields a dust opacity slope of 0.9 under an assumption of optically thin emission in the Rayleigh-Jeans limit [53, 54]. This value is lower than that of the interstellar medium dust (i.e., ), indicating that dust grains in the disk have already grown to millimeter sizes [55, 56].
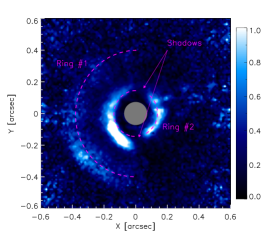
Using the VLT/SPHERE instrument, Benisty et al. [41] observed HD 143006 at an angular resolution of . fig. 2 shows the J-band () polarized intensity, which traces the scattered light from micron-sized dust grains populating the disk’s surface layer [41]. The disk reveals a strong east/west brightness asymmetries, and two rings. The outer Ring #1 extends from to , and appears obscure in the western side. The inner Ring #2 has a central position of . Along the azimuthal direction, its brightness is not continuously distributed, but shows two shadows at and . These prominent features are indicative of a complex disk configuration with a misaligned inner disk [57]. The clear signature of flux depletion between rings (i.e., in the gap) and also in the central cavity is consistent with the dip shown in the mid-infrared SED.
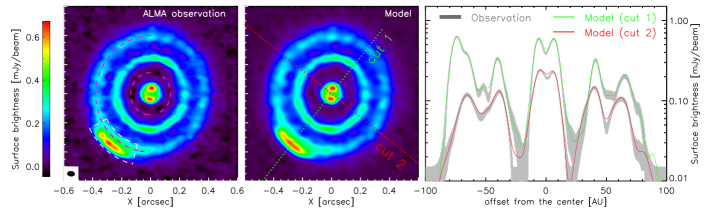
HD 143006 was selected as one of the 20 disks observed in the Disk Substructures at High Angular Resolution Project (DSHARP) [13]. With an angular resolution of , the 1.25 mm continuum image obtained with ALMA is resolved into three rings (B8, B40, and B64) at radial locations of , and respectively, see the left panel of fig. 3. Note that the nomenclature of these rings is directly taken from Pérez et al. [24]. Unlike the J-band scattered light, millimeter dust rings are broadly symmetric, except that the innermost B8 ring features two peaks along a PA of . Ring #2 identified in the SPHERE image lies closer to the central star than the B40 ring, whereas the position of the SPHERE Ring #1 matches well with the B64 ring. The most distinct feature in the ALMA image is the bright arc in the southeast, located just exterior to the B64 ring, and extends from to in the azimuthal direction. This arc has a counterpart in the SPHERE image, but it shows a broader radial and azimuthal extent.
3 Radiative transfer modeling
The origin of the rich substructures of HD 143006 is yet not fully understood. Hydrodynamic simulations demonstrate that an inclined equal mass binary causes disc breaking into two distinct annuli, with the resulting inner disk misaligned with the outer region [58, 41]. This scenario can produce azimuthal asymmetries shown in the scattered light. Ballabio et al. [59] found that besides an inclined binary, a planetary companion located at is required to simultaneously explain the morphological features in the scattered light and the millimeter dust rings. We do not attempt to re-investigate the same story. Instead, we are interested to constrain the temperature and density distribution of the disk with detailed radiative transfer modeling, and to infer the properties of the substructures.
3.1 Disk configuration
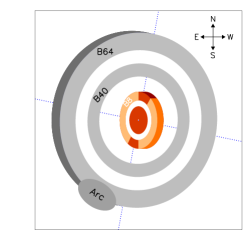
fig. 4 shows the configuration of our model. The inner and outer disks do not share the same geometry. They are misaligned with an angle of , which can be roughly constrained by the location of the shadows [57]. The near side of the outer disk is in the east, whereas the western part of the inner disk is closer to us. The inclination and position angle of the outer disk are and , respectively [60], while for the inner disk we adopt an inclination of , and PA of . The border between the inner and outer disks is fixed to , which is not well constrained. table 1 summarizes the values of these geometric parameters that are all kept constant in the fitting process for simplicity.
3.2 Dust density distribution
To account for the complex geometry of the HD 143006 disk, we introduce three-dimensional radiative transfer models that include two distinct dust grain populations, i.e., a small grain population (SGP) and a large grain population (LGP). The model is established under the spherical coordinates. The resolution in the radial (), poloidal (), and azimuthal directions () are 256, 1024, and 181 cells, respectively. Grid refinement is considered in the vicinity of the border () between the inner and outer disks as well as the location of the rings. This is done to ensure a smooth transition from optically thin to thick cells, meaning that these disk regions are well resolved by the grid.
The inner and outer radii, and total dust mass of the disk are denoted as , and , respectively. The SGP occupies of the total dust mass, and its scale height follows a power-law profile:
| (1) |
The parameter quantifies the disk flaring, and stands for the scale height at . Conversely, the LGP dominates the dust mass, i.e., , and is concentrated close to the midplane with a scale height of , where the settling parameter . Such a vertical stratification of grain size distributions has been commonly used to mimic the effect of dust settling in protoplanetary disks [61, 62, 63]. Observationally, it is difficult to constrain the total mass of small grains characterized by , because infrared observations only probe a portion of small grains in the surface layer of the disk. The parameter is highly related to the strength of turbulence that is poorly constrained from observations [39]. In our models, , and work together to define the scale height of millimeter dust grains that basically determines the characteristic temperature of millimeter continuum emission. As and are treated as free parameters (see section 3.5.1), the effect of a mild change to on the millimeter continuum can be roughly compensated by according variations in and/or that result in a similar millimeter dust scale height. Therefore, to reduce the total number of free parameters, was fixed during the fitting procedure. We directly took the values for and that were adopted in the literature modeling of protoplanetary disks [64, 65, 63].
The volume density of the dust grains is parameterized as
| (2) |
| (3) |
where is the dust surface density profile, and varies both in the radial and azimuthal axis. Previous studies on axisymmetric disks usually parameterize with an analytic formula, for example a power law or a power law plus an exponential taper [66, 64]. However, in radiative transfer models, linking such smooth (or clean) surface densities to high resolution ALMA images is impractical because the wealth of fine-scale features and asymmetries are extremely hard to be captured. Instead, to construct the surface density profile particularly for HD 143006, we develop an iterative fitting loop (see section 3.5.2), which is improved upon the algorithm that has been successfully applied to a few other targets [63].
According to eqs. 2 and 3, SGP and LGP follow a same surface density pattern. In principle, the distributions of small and large grains are different, because large grains gradually decouple from the gas as the disk evolves, while small grains are expected to be well-mixed with the gas. Generally, one can scale down the gas distribution to represent the surface density profile of SGP. However, constraining the gas surface density requires high resolution and high sensitivity observations of multiple gas lines [67], which are currently not available for HD 143006. Moreover, although the quality of the SPHERE data is high, translating polarized scattered light map to surface densities is not straightforward, because the morphology and intensity of infrared polarization are highly dependent on the polarization efficiency, e.g., grain composition, shape and size distribution. Unfortunately, until now, we have poor knowledge on these dust properties in protoplanetary disks. Since our work focuses more on the ALMA data that probe large dust grains, for simplicity, we assumed that the surface densities of small and large grains follow the same profile. Such an assumption is not expected to have a significant impact on the properties (e.g., mass, millimeter optical depth, and Toomre Q parameter) of the disk substructures that will be derived and discussed in section 4.
| Parameter | Explored values | Best fit | Comment |
|---|---|---|---|
| [K] | 5623 | 5623 | fixed |
| 3.8 | 3.8 | fixed | |
| [pc] | 166 | 166 | fixed |
| [mag] | 0.4 | 0.4 | fixed |
| [AU] | 0.2 | 0.2 | fixed |
| [AU] | 100 | 100 | fixed |
| [AU] | 18 | 18 | fixed |
| 0.2 | 0.2 | fixed | |
| 0.15 | 0.15 | fixed | |
| see section 3.5.2 | see fig. 5 | free | |
| 1.05, 1.1, 1.15, 1.2, 1.25 | free | ||
| [AU] | 4, 6, 8, 10, 12 | free | |
| (a) | |||
| [] | 2 | 2 | fixed |
| [mm] | 3 | 3 | fixed |
| 11.4 | 11.4 | fixed | |
| 0 | 0 | fixed | |
| 18.6 | 18.6 | fixed | |
| 169 | 169 | fixed | |
| 30 | 30 | fixed |
-
(a)
The total dust mass is obtained by integrating the surface density that is constructed in the fitting procedure. Hence, is not a direct fitting parameter.
3.3 Dust properties
Birnstiel et al. [68] proposed a dust model to interpret the ALMA data of the DSHARP disks. We directly take their model that consists of water ice, astronomical silicates, troilite, and refractory organic material, with volume fractions being 36%, 17%, 3% and 44%, respectively. The bulk density of the dust mixture is . We use the Mie theory to calculate the mass absorption/scattering coefficients. The grain size distribution follows the power law with a minimum grain size fixed to . The maximum grain size is set to for the SGP. To account for the effect of grain growth implied by the shallow millimeter spectral index (see section 2), we adopt for the LGP.
Zhu et al. [69] showed that taking dust scattering into account is important to estimate the total amount of dust mass in protoplanetary disks. Full scattering matrices are included in our radiative transfer models to treat dust scattering in a more realistic way.
3.4 Stellar heating
For simplicity, only stellar irradiation is considered as the heating source of the disk. The stellar parameters are listed in table 1. The photospheric spectrum is taken from the Kurucz database [70], assuming and solar metallicity. We found that a mild extinction of is needed to match the optical part of the SED. The extinction law is taken from Cardelli et al. [71].
3.5 Fitting procedure
3.5.1 Explored ranges for and
There are three free parameters/quantity in the model: , , and . The disk flaring and scale height define the vertical structure of the disk. The location of shadows seen in the SPHERE observation is sensitive to the height of the scattering surface as a function of . Using the equation developed in Min et al. [57], Benisty et al. [41] estimated at . Assuming that the scattering surface is higher than the scale height by a factor of , the disk aspect ratio . We note that such a calculation is highly dependent on the adopted geometric parameters and dust temperature as well, and therefore the result can only be treated as a guide.
In the fitting process, we explored a grid of values for and that are within the ranges of [1.05, 1.25] and [4 AU, 12 AU], respectively. Using eq. 1, the deduced aspect ratio spans a relatively broader range of 0.030.1.
3.5.2 Building the two-dimensional surface density
The most difficult part of the modeling is to construct the surface density profile . This is due to three reasons. First, it is naturally understood that for HD 143006, varies not only in the radial direction, but also with azimuthal angle. Second, what the ALMA image (see the left panel of fig. 3) shows is the millimeter continuum emission from a three dimensional disk projected onto the plane of sky. The projection parameters (i.e., inclination and position angle) are different between the inner and outer disks. Third, there is a misalignment complicating the geometry further.
To deal with the difficulty, we devised an iterative fitting loop. An initial surface density profile should be given. In practice, it can be an arbitrary form, for instance a power law. The surface density is closely linked to the ALMA observation due to the fact that the optical depth at millimeter wavelengths is low. Therefore, we extract the surface brightness on the ALMA image along 181 azimuthal angles () distributed from 0 to . The observed two-dimensional surface brightness distribution was first deprojected using the geometric parameters given in table 1, and then imported into the radiative transfer model as the initial surface density . After that, the iteration starts, and is followed by the steps itemized below.
-
(a)
We perform the radiative transfer simulation using the well-tested code RADMC-3D111http://www.ita.uni-heidelberg.de/ dullemond/software/radmc-3d/. [72]. The raytraced model image at 1.25 mm is obtained.
-
(b)
To simulate the ALMA observation, we compute the model visibilities at the same uv coordinates of the observation. Using the Common Astronomy Software Applications (CASA) package [73], the resulting model visibilities was CLEANed with the same parameters used for HD 143006 in the DSHARP project 222https://almascience.org/alma-data/lp/DSHARP.
-
(c)
On the CLEANed image, we extracted the surface brightness at the same locations as what we did on the observed ALMA map.
-
(d)
A ratio as a function of radius and azimuthal angle is calculated through dividing the observed brightness by the model brightness: . We deprojected using the disk geometric parameters to get a scaling factor for the next iteration.
-
(e)
The surface density profile used as the input for the model is scaled by the point-by-point ratio . The fitting loop goes back to step (a).
The iteration continues until the changes in the model surface brightness are less than 5% at all locations. This is typically satisfied after steps. Once the convergence is achieved, we also simulated the SED, and polarized intensity map at , in addition to the millimeter image.
3.5.3 Evaluating the quality of fit
It can be seen from table 1 that there are 25 different combinations of . For each of these possibilities, we separately ran the above-mentioned iteration from scratch until they converge. In the end, we obtained 25 models, and their final converged surface densities (therefore, the total dust mass in the disk ) are different from each other.
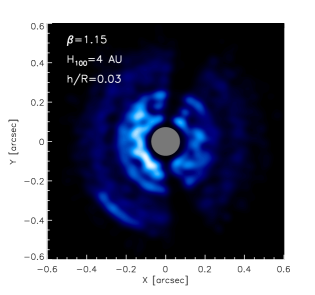
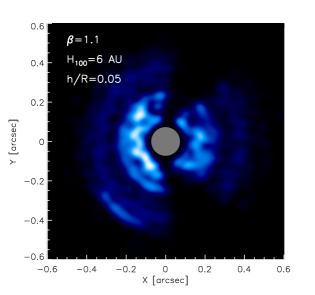
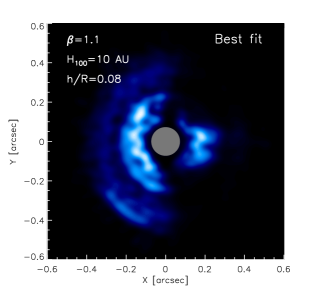
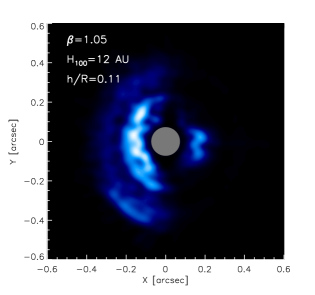
Near-infrared scattered light is produced by small dust grains in the surface layer of the disk. We first compare the morphological features in the polarized intensity map between the model and SPHERE observation. fig. 7 shows four models as an illustration. The effect of shadowing cast by the misalignment is very sensitive to the aspect ratio. We found that models with aspect ratios within are able to reproduce the overall morphology of the SPHERE image. table 3 summarizes the fitting results. There are 9 models with in the satisfied range.
Then, we evaluate the quality of fit to the SED and ALMA data for the 9 models. The goodness of fit is given by
| (4) |
For the SED, is the number of observed wavelengths, are the photometric measurements, and are the predicted flux densities at these wavelengths. The observational flux uncertainties are denoted as . For the ALMA image, is the number of pixels taken into account, are the observed surface brightness in each pixel, and are the model surface brightness. The quantity now is the rms noise of the ALMA image, which we fixed to for every pixel [13]. The total goodness of fit is evaluated via
| (5) |
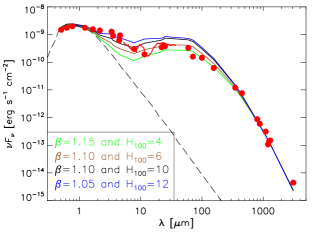
where is a weighting factor that is adjustable to make a compromise for the quality of fit between the SED and ALMA data. There is not an universal value for . The and values for each model are listed in table 3. As can be seen, is roughly an order of magnitude lower than . To balance the weighting between these two independent assessments, was taken to be 0.9. However, we emphasize that our choice is only applicable for this particular study. fig. 8 shows how the SED varies with the geometric parameters of the disk. The best fit is identified as the one with the minimum . The uncertainties of the best-fit parameter set are deduced from the models with lower than 1.1 times the minimum .
4 Results and discussion
The fitting results are presented in figs. 1, 3 and 7, whereas table 1 summarizes the corresponding parameter set. Our model well matches the ALMA data and the morphology of the infrared polarized intensity map, see for instance how high the quality of fit is for the arc and rings in the right panel of fig. 3.
The model SED is broadly consistent with the observation, except for the data points at and . The geometry of the inner disk for HD 143006 might be more complicated than what we assumed (see fig. 4), for instance there might be an puffed-up inner rim [74]. Moreover, a variability in accretion or an inclined companion can lead to changes in the structure of the inner disk [75]. These factors can explain the discrepancies in the near-infrared flux. For simplicity, we assume that the flaring index and scale height are the same in the inner and outer disk. The mild overestimation of far-infrared flux can be reconciled by reducing (or , or both) for the outer disk while maintaining the vertical structure of the inner disk. Nevertheless, such finely refinements are not expected to have a significant impact on the overall properties (i.e., temperature, surface density, and Toomre parameter) of the disk.
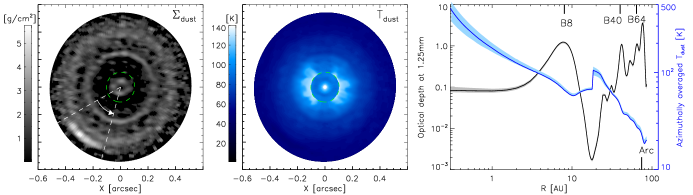
The left panel of fig. 5 shows the surface densities projected onto the plane of sky. A projection is performed to have a one-to-one comparison with the observation. The reconstructed surface densities show obvious fluctuations along both the radial and azimuthal directions. We checked the quality of the ALMA data, and found that in most disk regions (excepting for the gap around ), the signal-to-noise ratio is higher than 3. In the arc and rings where we are most interested, the ratio is higher than . These mean that the derived surface densities for the arc and rings are reliable since our iterative fitting is driven by the data. Nevertheless, surface density fluctuations in the gap around may reflect the noise of the ALMA observation. The right panel presents the optical depth at 1.25 mm and the mass-averaged temperature, derived from an azimuthal average between and . As can be seen, all the three ALMA rings (B8, B40, B64) are marginally optically thick: . This is different from the result presented by Huang et al. [60], who obtained an optical depth of . When calculating , they assumed a temperature profile being the simplified expression for a passively heated, flared disk: [76, 74]. It is clear that such an approximation is not sufficient for HD 143006, see the blue solid line in the figure. Instead, due to the misalignment, the temperature exhibits a discontinuity at the boundary () between the inner and outer disk. Along the radial direction towards the arc (), stellar photons can directly impinge upon the inner rim of the outer disk, resulting in a sharp increase in temperature. Beyond that radius, the temperature decreases by roughly following a power law with at the arc location. Moreover, in the analysis of Huang et al. [60], dust scattering is not taken into account. The difference in optical depth between our work and theirs can be understood in terms of these two reasons. The bright arc is optically thick with .
| Substructure | Region | Dust mass | Mean |
|---|---|---|---|
| [AU or ∘] | [] | [K] | |
| B8 | |||
| B40 | |||
| B64 | |||
| Arc | |||
The misalignment leads to a highly asymmetric temperature distribution, see the middle panel of fig. 5. The eastern/western sides of the outer disk’s rim (located at , the green dashed circle in the plot) are directly exposed to the central star. The typical temperature there reaches . Conversely, the northern/southern parts of the rim are cool with . table 2 gives the mean temperature of each substructure. We defined the arc region as the area enclosed with the white dashed lines in the left panel of fig. 3. The radial range of the arc overlaps with that of the B64 ring, because we considered that both features are tightly connected. Adopting the condensation temperature reported in the literature [77, 78, 30], the B8, B40, and B64 rings are associated with the ice lines of , , and , respectively. By integrating the surface density, we obtained the dust mass in the substructures. The total dust mass of the best model is (or ). The arc contains about 20% of the dust mass. This number should be regarded as a lower limit due to the optical thickness . The mass fraction is lower than that of the arc in HD 135344B (i.e., ), which shares a similar disk morphology [23]. The ring masses range from 0.6 to . They are systematically lower than those derived in the younger () HL Tau disk. In HL Tau, the dust masses in the rings are from 16 to [79]. If the rings are created by planets, this may suggest that much of the dusty material in the HD 143006 disk have already been converted to the mass of planets (or planetary cores).
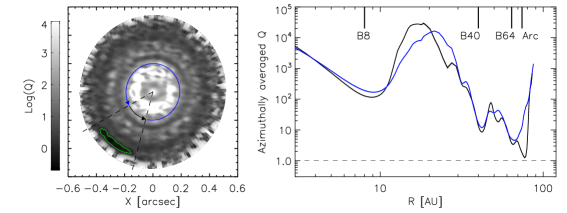
As can be seen from table 2, the rings, particularly the B64 ring, and the arc occupy a large amount of dust mass. In addition, the arc is located so distant from the central star that the temperature is as low as . Gravitational instability may be in action at these cold and dense regions. We checked this possibility using the Toomre criterion [80]. The Toomre parameter is defined as
| (6) |
where is the local sound speed, is the angular frequency, and stands for the gas surface density. In terms of , a disk/substructure is unstable to its own self-gravity if , and stable if . As there is no constraints on , for simplicity, we scaled up the constructed by a constant gas-to-dust mass ratio of 30 that is found to be representative via millimeter dust and gas observations of a sample of protoplanetary disks [81, 82, 83]. The two-dimensional distribution of is shown in the left panel of fig. 6. The value is below unity at the center of the arc, as indicated by the green contour. The right panel of fig. 6 displays the azimuthally averaged as a function of radius. Two ranges of azimuthal angles were considered in order to highlight the difference at various locations. While most regions including the three rings are gravitationally stable, approaches at the radial position of the arc. Pohl et al. [84] showed that an embedded massive planet (planet-to-star mass ratio of 0.01) can induce gravitational collapses in massive disks when is around unity. Nevertheless, analyzing infrared interferometric data excludes the presence of a companion with mass ratios of [41]. Future searches for less massive (proto)planets with high-contrast imaging are desired to test the hypothesis.
The gas-to-dust mass ratio reflects how quickly the dust and gas components dissipate, in particular relative to each other. The inherited interstellar medium gas-to-dust mass ratio is 100. ALMA observations of dust and gas lines reveal that the ratio can drop to 10 in some disks [82, 85]. Arcs are often interpreted as a result of dust trapping into vortices that preferentially concentrate dust grains. Numerical simulations of vortex formation and dust trapping have shown that the gas-to-dust mass ratio in the center of vortices can decrease down to 10 and even [86, 87]. In such a situation, will be above unity, and gravitational instability is suppressed accordingly. Future high resolution and high sensitivity observations of gas lines are required to constrain the gas surface density, and therefore the gas-to-dust mass ratio, particularly in the local arc region. Furthermore, hydrodynamic simulations dedicated on HD 143006, with the inclusion of the feedback of dust onto gas [88], will help to understand the fate of the arc.
Vortices are regions acting as local pressure maxima in the disk, and they can form at the edge of a planet-induced gap due to the excitation of RWI. An important prediction of dust trapping toward vortices is that larger dust grains are expected to be concentrated into a narrower region [89, 90], which has been observationally identified in several disks, e.g., Oph IRS 48 [91], HD 142527 [92], MWC 758 [93], and HD135344B [23]. Investigating the spatial distribution of dust grains with different sizes requires high resolution observations at multi-wavelengths. Due to the lack of such datasets, we distributed the SGP and LGP into the same azimuthal extent in the radiative transfer models. Future high resolution observations at different wavelengths, and follow-up search for (proto)planets are indispensable to clarify the nature of the arc in the HD 143006 disk.
5 Summary
We performed three dimensional radiative transfer modeling of the HD 143006 disk that shows three dust rings and a bright arc in the outermost region on the DSHARP ALMA map. The goal of our work is to constrain the density and temperature distributions, and to investigate the possibility of triggering a gravitational instability in the substructures. In order to account for the ALMA and SPHERE observations, our model features a complex geometry with a misalignment between the inner and outer disk.
All of the three rings (B8, B40, B64) are marginally optically thick () at the observed ALMA wavelength, while the optical thickness of the arc is . Our self-consistent modeling gives higher optical depth than those derived from a simple analytic method in the literature. We found that the temperature as a function of radius resembles two connecting power laws with a sharp jump at the boundary of the misalignment. The temperature in the rings are from 74 to 29 K, and it drops down to 23 K in the arc. The total dust mass in the disk is about , with the arc sharing about 20% of the amount. The dust masses in the rings range from to , which are systematically lower than those found in the younger HL Tau disk.
While all the rings are gravitationally stable, the Toomre parameter in the arc is around unity when assuming a gas-to-dust mass ratio of 30 that is constant in the entire disk. The arc is close to the threshold of gravitational collapse in this case. If gravitational instability is in action and the cooling is efficient enough, giant planets may quickly form [94]. However, if the arc indeed traces a vortex, millimeter dust grains preferentially concentrate in the arc, which will decrease the local gas-to-dust mass ratio. Given that the gas-to-dust mass ratio is an unknown assumption, adopting a lower value would increase our estimate of . In this situation, gravitational instability will not take place. Future gas and dust observations at high resolutions are required to better constrain the gas-to-dust mass ratio, and to clarify the origin of the arc in the HD 143006 disk.
We thank the anonymous referees for their constructive comments that highly improved the manuscript. We sincerely thank Myriam Benisty for sharing the reduced SPHERE data of HD 143006. Y.L. acknowledges the financial support by the Natural Science Foundation of China (Grant No. 11973090). M.F. acknowledge funding from the European Research Council (ERC) under the European Union’s Horizon 2020 research and innovation program (grant agreement No. 757957). We acknowledge the science research grants from the China Manned Space Project with NO. CMS-CSST-2021-B06. Herschel is an ESA space observatory with science instruments provided by European-led Principal Investigator consortia and with important participation from NASA. ALMA is a partnership of ESO (representing its member states), NSF (USA) and NINS (Japan), together with NRC (Canada), MOST and ASIAA (Taiwan), and KASI (Republic of Korea), in cooperation with the Republic of Chile. The Joint ALMA Observatory is operated by ESO, AUI/NRAO and NAOJ. This work has made use of data from the European Space Agency (ESA) mission Gaia (https://www.cosmos.esa.int/gaia), processed by the Gaia Data Processing and Analysis Consortium (DPAC, https://www.cosmos.esa.int/web/gaia/dpac/consortium). Funding for the DPAC has been provided by national institutions, in particular the institutions participating in the Gaia Multilateral Agreement.
The authors declare that they have no conflict of interest.
References
- [1] M. Mayor and D. Queloz, Nature378, 355 (1995).
- [2] G. Basri, W. J. Borucki, and D. Koch, New A Rev.49, 478 (2005).
- [3] G. R. Ricker et al., Journal of Astronomical Telescopes, Instruments, and Systems 1, 014003 (2015).
- [4] C. Pinte et al., Nature Astronomy 3, 1109 (2019).
- [5] M. Keppler et al., A&A617, A44 (2018).
- [6] A. Müller et al., A&A617, L2 (2018).
- [7] S. P. Quanz et al., ApJ766, L1 (2013).
- [8] T. Currie et al., ApJ877, L3 (2019).
- [9] K. Wagner et al., ApJ882, 20 (2019).
- [10] J.-L. Beuzit et al., in: Ground-based and Airborne Instrumentation for Astronomy II, eds. I. S. McLean and M. M. Casali, Vol. 7014 of Society of Photo-Optical Instrumentation Engineers (SPIE) Conference Series, 2008, p. 701418.
- [11] H. Avenhaus et al., ApJ863, 44 (2018).
- [12] F. Long et al., ApJ869, 17 (2018).
- [13] S. M. Andrews et al., ApJ869, L41 (2018).
- [14] ALMA Partnership et al., ApJ808, L3 (2015).
- [15] R. van Boekel et al., ApJ837, 132 (2017).
- [16] S. M. Andrews, ARA&A58, 483 (2020).
- [17] M. Benisty et al., A&A578, L6 (2015).
- [18] L. M. Pérez et al., Science 353, 1519 (2016).
- [19] M. Benisty et al., A&A597, A42 (2017).
- [20] J. Huang et al., ApJ869, L43 (2018).
- [21] N. van der Marel et al., Science 340, 1199 (2013).
- [22] R. Dong et al., ApJ860, 124 (2018).
- [23] P. Cazzoletti et al., A&A619, A161 (2018).
- [24] L. M. Pérez et al., ApJ869, L50 (2018).
- [25] W. Kley and R. P. Nelson, ARA&A50, 211 (2012).
- [26] J. Fung and R. Dong, ApJ815, L21 (2015).
- [27] G. Lodato et al., MNRAS486, 453 (2019).
- [28] X.-N. Bai and J. M. Stone, ApJ796, 31 (2014).
- [29] C. Cui and X.-N. Bai, MNRAS507, 1106 (2021).
- [30] K. Zhang, G. A. Blake, and E. A. Bergin, ApJ806, L7 (2015).
- [31] S. Z. Takahashi and S.-i. Inutsuka, ArXiv e-prints (2016).
- [32] J. Drażkowska, Y. Alibert, and B. Moore, A&A594, A105 (2016).
- [33] H. Jiang and C. W. Ormel, MNRAS505, 1162 (2021).
- [34] S. J. Weidenschilling, MNRAS180, 57 (1977).
- [35] P. Pinilla et al., A&A584, A16 (2015).
- [36] Z. Zhu and J. M. Stone, ApJ795, 53 (2014).
- [37] W. Fu, H. Li, S. Lubow, and S. Li, ApJ788, L41 (2014).
- [38] M. Hammer, M.-K. Lin, K. M. Kratter, and P. Pinilla, MNRAS504, 3963 (2021).
- [39] R. Teague et al., A&A592, A49 (2016).
- [40] K. M. Flaherty et al., ApJ843, 150 (2017).
- [41] M. Benisty et al., A&A619, A171 (2018).
- [42] K. L. Luhman and E. E. Mamajek, ApJ758, 31 (2012).
- [43] Gaia Collaboration et al., A&A616, A1 (2018).
- [44] S. A. Barenfeld, J. M. Carpenter, L. Ricci, and A. Isella, ApJ827, 142 (2016).
- [45] T. P. Robitaille, B. A. Whitney, R. Indebetouw, and K. Wood, ApJS169, 328 (2007).
- [46] R. M. Cutri et al., 2246 , (2003).
- [47] R. M. Cutri and et al., 2328 , (2013).
- [48] G. Neugebauer et al., ApJ278, L1 (1984).
- [49] K. N. Grankin, S. Y. Melnikov, J. Bouvier, W. Herbst, and V. S. Shevchenko, A&A461, 183 (2007).
- [50] J. M. Carpenter et al., ApJS179, 423 (2008).
- [51] R. J. Sylvester, C. J. Skinner, M. J. Barlow, and V. Mannings, MNRAS279, 915 (1996).
- [52] A. Natta, L. Testi, R. Neri, D. S. Shepherd, and D. J. Wilner, A&A416, 179 (2004).
- [53] K. Miyake and Y. Nakagawa, Icarus106, 20 (1993).
- [54] S. M. Andrews and J. P. Williams, ApJ671, 1800 (2007).
- [55] L. Ricci et al., A&A512, A15 (2010).
- [56] L. Testi et al., in: Protostars and Planets VI, eds. H. Beuther, R. S. Klessen, C. P. Dullemond, and T. Henning, 2014, p. 339.
- [57] M. Min, T. Stolker, C. Dominik, and M. Benisty, A&A604, L10 (2017).
- [58] S. Facchini, A. Juhász, and G. Lodato, MNRAS473, 4459 (2018).
- [59] G. Ballabio et al., MNRAS504, 888 (2021).
- [60] J. Huang et al., ApJ869, L42 (2018).
- [61] C. P. Dullemond and C. Dominik, A&A421, 1075 (2004).
- [62] P. D’Alessio, N. Calvet, L. Hartmann, R. Franco-Hernández, and H. Servín, ApJ638, 314 (2006).
- [63] Y. Liu et al., A&A622, A75 (2019).
- [64] S. M. Andrews et al., ApJ732, 42 (2011).
- [65] D. Fedele et al., A&A610, A24 (2018).
- [66] D. Lynden-Bell and J. E. Pringle, MNRAS168, 603 (1974).
- [67] A. Isella et al., PhRvL 117, 251101 (2016).
- [68] T. Birnstiel et al., ApJ869, L45 (2018).
- [69] Z. Zhu et al., ApJ877, L18 (2019).
- [70] R. Kurucz, 19 , (1994).
- [71] J. A. Cardelli, G. C. Clayton, and J. S. Mathis, ApJ345, 245 (1989).
- [72] C. P. Dullemond et al. RADMC-3D: A multi-purpose radiative transfer tool Astrophysics Source Code Library, 2012.
- [73] J. P. McMullin, B. Waters, D. Schiebel, W. Young, and K. Golap, in: Astronomical Data Analysis Software and Systems XVI, eds. R. A. Shaw, F. Hill, and D. J. Bell, Vol. 376 of Astronomical Society of the Pacific Conference Series, 2007, p. 127.
- [74] C. P. Dullemond, C. Dominik, and A. Natta, ApJ560, 957 (2001).
- [75] K. M. Flaherty et al., ApJ748, 71 (2012).
- [76] E. I. Chiang and P. Goldreich, ApJ490, 368 (1997).
- [77] R. Martín-Doménech, G. M. Muñoz Caro, J. Bueno, and F. Goesmann, A&A564, A8 (2014).
- [78] R. Luna, M. Á. Satorre, C. Santonja, and M. Domingo, A&A566, A27 (2014).
- [79] Y. Liu et al., A&A607, A74 (2017).
- [80] A. Toomre, ApJ139, 1217 (1964).
- [81] J. P. Williams and W. M. J. Best, ApJ788, 59 (2014).
- [82] M. Ansdell et al., ApJ828, 46 (2016).
- [83] M. Ansdell et al., AJ153, 240 (2017).
- [84] A. Pohl et al., MNRAS453, 1768 (2015).
- [85] K.-L. Soon et al., PASJ71, 124 (2019).
- [86] H. Meheut, Z. Meliani, P. Varniere, and W. Benz, A&A545, A134 (2012).
- [87] A. Sierra, S. Lizano, and P. Barge, ApJ850, 115 (2017).
- [88] I. Crnkovic-Rubsamen, Z. Zhu, and J. M. Stone, MNRAS450, 4285 (2015).
- [89] T. Birnstiel, C. P. Dullemond, and P. Pinilla, A&A550, L8 (2013).
- [90] W. Lyra and M.-K. Lin, ApJ775, 17 (2013).
- [91] N. van der Marel et al., ApJ810, L7 (2015).
- [92] S. Casassus et al., ApJ812, 126 (2015).
- [93] S. Marino et al., ApJ813, 76 (2015).
- [94] L. Mayer, T. Quinn, J. Wadsley, and J. Stadel, Science 298, 1756 (2002).
Appendix Appendix More information about the fitting results
The location of shadows and the overall morphology of the scattered light map are dependent on the geometric parameters of the disk. In the radiative transfer analysis, we fixed the inclination and position angle of the inner and outer disks, and the misalignment angle as well. Hence, the remaining freedom characterizing the morphology of the polarized intensity map is the aspect ratio that is determined by and via eq. 1. fig. 7 shows how the morphological features change with the aspect ratio . We found that disk configurations with aspect ratios are able to interpret the overall morphology of the SPHERE image. There are 9 models with being in this range. table 3 summarizes the fitting results for each model. The millimeter optical depth, dust temperature, and the Toomre parameter of the arc are also provided.
The parameters and work together to determine the vertical structure of the disk, and therefore affect the level of infrared excess. Generally, a larger and/or produces more infrared excess, and vice versa. The four models shown in fig. 8 illustrate this tendency, and they have the same parameter values to the ones presented in fig. 7.
| Model ID | Match with SPHERE data | (arc) | (arc) | (arc) | |||||||
|---|---|---|---|---|---|---|---|---|---|---|---|
| [AU] | [K] | ||||||||||
| 01 | 1.05 | 4 | 0.037 | 15.0 | N | ||||||
| 02 | 1.1 | 4 | 0.034 | 14.0 | N | ||||||
| 03 | 1.15 | 4 | 0.031 | 14.0 | N | ||||||
| 04 | 1.2 | 4 | 0.028 | 13.0 | N | ||||||
| 05 | 1.25 | 4 | 0.026 | 13.0 | N | ||||||
| 06 | 1.05 | 6 | 0.055 | 12.0 | N | ||||||
| 07 | 1.1 | 6 | 0.051 | 12.0 | N | ||||||
| 08 | 1.15 | 6 | 0.046 | 12.0 | N | ||||||
| 09 | 1.2 | 6 | 0.043 | 11.0 | N | ||||||
| 10 | 1.25 | 6 | 0.039 | 11.0 | N | ||||||
| 11 | 1.05 | 8 | 0.073 | 11.0 | Y | 2878 | 33692 | 5959 | 3.1 | 21.1 | 1.1 |
| 12 | 1.1 | 8 | 0.067 | 11.0 | N | ||||||
| 13 | 1.15 | 8 | 0.062 | 10.0 | N | ||||||
| 14 | 1.2 | 8 | 0.057 | 10.0 | N | ||||||
| 15 | 1.25 | 8 | 0.052 | 10.0 | N | ||||||
| 16 | 1.05 | 10 | 0.092 | 9.8 | Y | 2909 | 35634 | 6181 | 2.7 | 22.9 | 1.2 |
| 17 | 1.1 | 10 | 0.084 | 9.7 | Y | 2528 | 35822 | 5857 | 2.7 | 23.1 | 1.3 |
| 18 | 1.15 | 10 | 0.077 | 9.6 | Y | 2771 | 34379 | 5932 | 2.6 | 23.4 | 1.3 |
| 19 | 1.2 | 10 | 0.071 | 9.4 | Y | 3095 | 34292 | 6215 | 2.6 | 23.6 | 1.3 |
| 20 | 1.25 | 10 | 0.065 | 9.3 | N | ||||||
| 21 | 1.05 | 12 | 0.11 | 9.1 | N | ||||||
| 22 | 1.1 | 12 | 0.10 | 9.0 | Y | 3768 | 38118 | 7203 | 2.4 | 25.1 | 1.3 |
| 23 | 1.15 | 12 | 0.093 | 8.9 | Y | 3555 | 42960 | 7495 | 2.4 | 25.3 | 1.3 |
| 24 | 1.2 | 12 | 0.085 | 8.8 | Y | 3762 | 35776 | 6964 | 2.3 | 25.3 | 1.4 |
| 25 | 1.25 | 12 | 0.078 | 8.7 | Y | 4202 | 32385 | 7020 | 2.3 | 25.5 | 1.4 |
-
(a)
This column gives the result for a comparison of scattered light images between the model and SPHERE data. If the model fails to reproduce the overall morphological features, “N” is assigned. On the contrary, “Y” means that the model and observation are broadly consistent with each other, see section 3.5.3.