University of Pittsburgh, 3941 O’Hara Street, Pittsburgh, PA 15260, USA.
Modeling the signatures of interaction in Type II supernovae:
UV emission, high-velocity features, broad-boxy profiles
Because mass loss is a fundamental phenomenon in massive stars, interaction with circumstellar material (CSM) should be universal in core-collapse supernovae (SNe). Leaving aside the extreme CSM density, extent, or mass typically encountered in Type IIn SNe, we investigate the diverse long-term radiative signatures of interaction between a Type II SN ejecta and CSM corresponding to mass loss rates up to 10-3 yr-1. Because these CSM are relatively tenuous and optically-thin to electron-scattering beyond a few stellar radii, radiation hydrodynamics is not essential and one may treat the interaction directly as an additional power source in the non-local thermodynamic equilibrium radiative transfer problem. The CSM accumulated since shock breakout forms a dense shell in the outer ejecta and leads to high-velocity absorption features in spectral lines, even for negligible shock power. Besides Balmer lines, such features may appear in Na i D, He i lines etc. A stronger interaction strengthens the continuum flux (preferentially in the UV), quenches the absorption of P-Cygni profiles, boosts the Mg ii doublet, and fosters the production of a broad boxy H emission component. The rise in ionization in the outer ejecta may quench some lines (e.g., the Ca ii near-infrared triplet). The interaction power emerges preferentially in the UV, in particular at later times, shifting the optical color to the blue, but increasing modestly the optical luminosity. Strong thermalization and clumping seem to be required to make an interaction superluminous in the optical. The UV range contains essential signatures that provide critical constraints to infer the mass loss history and inner workings of core-collapse SN progenitors at death.
Key Words.:
line: formation – radiative transfer – supernovae: general1 Introduction
Mass loss is a fundamental phenomenon affecting the evolution of massive stars. Steady-state mass loss in the form of a wind can significantly reduce the mass of a star and affect many of its properties throughout its life (Maeder & Meynet, 1987; Langer et al., 1994), as well as the mass of the metal-rich core, the final yields, and the compactness at collapse (Woosley et al., 2002; Renzo et al., 2017). Steady or dynamical mass transfer through Roche-lobe overflow in interacting binaries are typically short lived but manyfold stronger than wind mass loss and can thus lead to a dramatic change in the evolution of a massive star (Podsiadlowski et al., 1992; Wellstein & Langer, 1999; Eldridge et al., 2008; Langer, 2012). Interacting binaries are likely central for the production of stripped-envelope supernovae (SNe; Yoon et al., 2010). Hence, stellar wind mass loss and mass transfer in interacting binaries play a central role in determining the gross properties of the SN progenitor and the SN type.
However, the radiative properties of SNe depend also on the complex internal structure of the star at death and the structure of its close environment. The final structure of the star affects the shock propagation through the envelope prior to shock breakout. When the close environment of the star is not a vacuum, as generally assumed for simplicity, an interaction takes place with the circumstellar material (CSM). While the existence of CSM is not surprising for massive stars, a number of observed SNe suggest that this CSM may be exceptionally dense, in the sense that it would correspond to wind mass loss rates manyfold greater than standard steady-state mass loss rates typically inferred in massive stars (see, for example, de Jager et al. 1988). This CSM may also extend out to large distances above the star surface, from several 1014 cm (SN 2013fs; Dessart et al., 2017; Moriya et al., 2017; Morozova et al., 2017; Yaron et al., 2017), to 1015 cm (SN 2020tlf; Jacobson-Galán et al., 2022), to several 1015 cm (SN 1998S; Leonard et al., 2000; Fassia et al., 2001; Chugai, 2001; Dessart et al., 2016), and up to 1016 cm (SN 2010jl; Zhang et al., 2012; Fransson et al., 2014; Dessart et al., 2015). While large relative to the progenitor radius, these distances correspond to mass loss episodes occurring on year time scales before core collapse and thus may point to dynamical phenomena tied to the last stages of massive star evolution (Quataert & Shiode, 2012; Fuller, 2017).
A critical spectroscopic signature of interaction in a SN is the presence of narrow and symmetric emission line profiles instead of the expected Doppler-broadened P-Cygni profiles (Schlegel, 1990; Stathakis & Sadler, 1991; Chugai, 2001; Dessart et al., 2009). This is most obvious in H i Balmer lines of Type II SNe (e.g., SN 1998S), but also seen in lines of He i, He ii, or more highly ionized ions of C, N, or O (e.g., SN 2013fs; Yaron et al. 2017). Such lines imply a reprocessing of the radiation from the underlying SN by the unshocked, quasistatic, optically-thick CSM. This CSM releases the SN radiation on a diffusion timescale, broadening significantly the shock breakout signal. In the interaction between ejecta and CSM, the ejecta deceleration implies a transformation of kinetic energy into radiative energy, which boosts the SN luminosity. The CSM also induces a shift of the spectral energy distribution to longer wavelength because the radiation is trapped within a larger optically-thick volume. Together, these effects tend to boost the optical luminosity of the SN.
While many studies have been devoted to superluminous interacting SNe, the impact of mass loss is likely much more universal in core-collapse SNe. For wind mass loss rates stronger than standard but too low to produce an optically-thick CSM, the SN spectra cannot exhibit the narrow spectral signatures that would flag the event as a Type IIn or Type Ibn. However, the shock power may nonetheless be substantial and even supersede the ‘default’ SN luminosity (i.e., in the absence of interaction). Overluminous SNe II exhibiting non standard broad line profiles (e.g., H) are indeed observed (Pessi et al., in prep). For a SN shock ramming at velocity into a steady-state wind with mass loss rate and velocity , the instantaneous power released by the interaction is where yr-1, /10000 km s-1 and km s-1. If in addition is fixed, the shock power is constant in time. The representative luminosity of a Type II SN during the photospheric phase, which is a few times 1042 erg s-1 (Bersten & Hamuy, 2009), can be rivaled by the power from the ejecta interaction with a wind mass loss rate of 10-3 yr-1. This mass loss rate is still a factor of a 100 weaker than inferred for a superluminous Type IIn SN like 2010jl (Fransson et al., 2014; Dessart et al., 2015). Furthermore, if the wind density remains sufficiently high at large distances, the shock power should eventually ‘win’ over the inner ejecta luminosity (powered by radioactive decay). For example, for 3.2, 1.0, and 1.0, the interaction power is 1041 erg s-1 and comparable to the power at 300 d from the decay of 0.1 of i. The contribution from interaction power to the SN radiation at some stage in the evolution of a core-collapse SN is thus likely.
For CSM configurations corresponding to wind mass loss rates of 0.1 yr-1 and extending over large scales, a multi-group radiation hydrodynamics treatment is essential. This approach captures the dynamics of the interaction, the deceleration of the ejecta, and the continuous pile-up of CSM into a dense shell. Furthermore, as the CSM becomes optically thick following the radiative precursor, the radiative transfer problem is time dependent, and so are the gas properties. As long as the shock is embedded in this optically-thick CSM, photons emerge from the unshocked CSM. This situation changes as the shock progresses outwards and escaping photons increasingly originate from the shocked CSM and ejecta. Such configurations correspond to superluminous SNe (Moriya et al., 2011; Dessart et al., 2015).
In this letter, we leave aside these extreme CSM configurations. Instead, we consider the interaction of a standard Type II SN ejecta with a CSM corresponding to a wind mass loss rate that is always too weak to make the CSM optically thick to electron scattering (except perhaps in the immediate vicinity of the progenitor surface, which is quickly swept up by the ejecta on a day timescale). In this case, there is no need for radiation hydrodynamics since 1) the shock power is known analytically and given above by ; 2) the CSM is transparent so its contribution in emission and absorption may be neglected; 3) and the CSM is too tenuous to appreciably decelerate the ejecta. Hence, in contrast to the approach used in our previous studies (Dessart et al., 2015, 2016, 2017), we simulate the interaction between ejecta and CSM directly within CMFGEN (Hillier & Dessart, 2012). While this ignores the dynamics of the problem, this allows for a much better treatment of the radiative transfer and the effects associated with departures from local thermodynamic equilibrium (LTE). It also allows for the long-term modeling of an interaction over weeks, months, and even years (see Sect. 4). In the next section, we present our numerical approach, including the treatment of the interaction power in CMFGEN and the set of simulations we cover in this work. We then present our results in Sect. 3. We conclude in Sect. 4.
2 Numerical setup
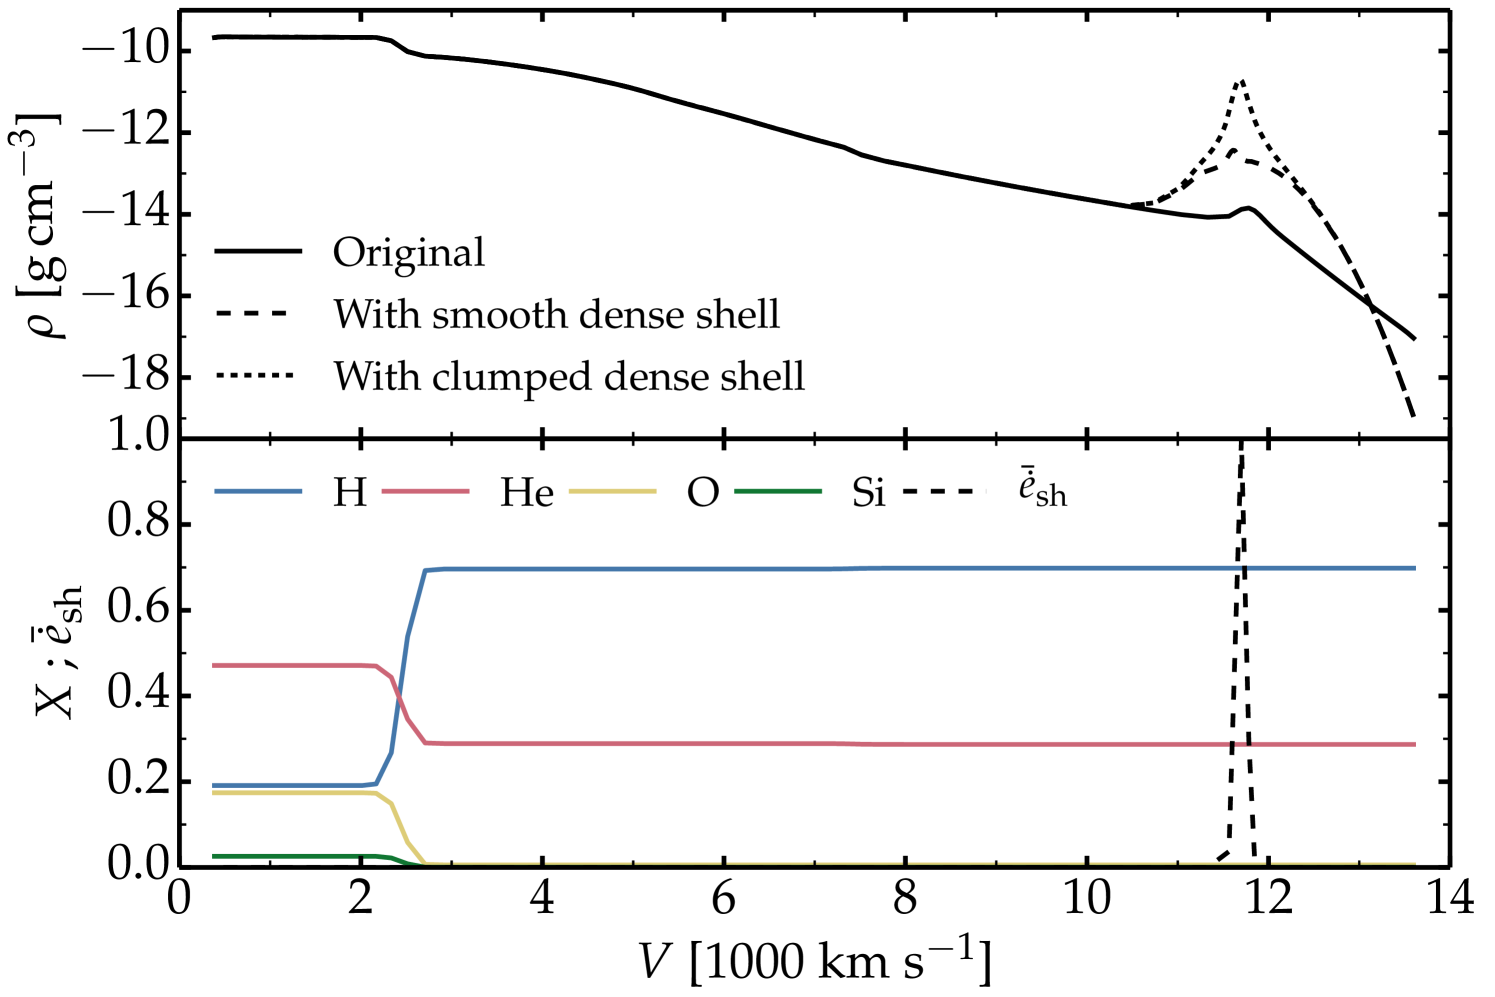
All models presented in this work start with the same default Type II SN ejecta at an age of 10 d. It corresponds to a star of 15 initially, evolved at solar metallicity, and that exploded to produce an ejecta of 10.81 with a kinetic energy of erg and 0.03 of i (for details on the method, see Hillier & Dessart 2019). To mimic the presence of a cocoon of material in the direct vicinity of the progenitor red-supergiant (RSG) star, something that is likely typical in SNe II-P with super-wind phases prior to explosion as inferred for SN 2013fs (Yaron et al., 2017), we introduce in the initial density structure a dense shell of 0.1 at a velocity of 11700 km s-1 (compatible with model predictions; Dessart et al. 2017). Because of multidimensional instabilities, this dense shell should break-up in 3D and exhibit strong clumping. We thus spread the dense shell over a characteristic scale set to 10 % of the local radius, and introduce clumping to reach a maximum compression factor of 100 (volume filling factor of 1 %). Numerically, this allows us to resolve this dense shell in 1D while preserving a high density for the clumped material in the dense shell (Fig. 1).
All models are evolved assuming a fixed shock velocity ( 1.17) and a steady progenitor wind ( from zero to 100 and 0.5), corresponding to a fixed interaction power from zero to 1043 erg s-1. The accumulated swept-up mass by the ejecta after one year is (i.e., about 0.1 for 100). Being relatively small, we decide to neglect it and go further and neglect any dynamical influence of the CSM on the initial ejecta density structure. We also neglect the absorption and emission from such a low-density CSM. We reset its properties so that its density is negligible and its velocity is homologous. With these adjustments we can model the SN ejecta and the interaction using the same approach as we use to model non-interacting SN ejecta in CMFGEN.
How one should deposit the interaction power is a delicate matter. In radiation-hydrodynamics simulations of interactions, power is injected in the forward and in the reverse shocks that bound the dense shell. Because of the break-up of the dense shell in 3D, which leads to clumping and turbulence etc, the deposition of shock power is highly complex. Here, we focus on that part of the shock power that is absorbed in the ejecta and ignore any high-energy radiation that escapes. Hence the power that we deposit underestimates the true power of the shock (particularly for the forward shock, but much less so for the reverse shock). As a first step, we deposit the shock power in the dense shell and we model how it thermalizes in that region. In practice, we adopt a Gaussian profile for the deposition of shock power, with a centroid at the center of the dense shell at 11700 km s-1 with a characteristic width of 75 km s-1 (dashed-curve in the bottom panel of Fig. 1; the clumping profile takes the same form). We treat equivalently shock power and decay power in CMFGEN, that is, the shock power is injected as high-energy radiation and degraded in the same way as -rays from radioactive decay. Clumping is treated as in Dessart et al. (2018) and we therefore neglect porosity. Nonthermal effects are thus computed consistently by the nonLTE solver. Because of the rapid change in density, ionization, and temperature within the dense shell, we enforce a high resolution in this region. Regridding is also performed in individual models to resolve accurately the recombination fronts.
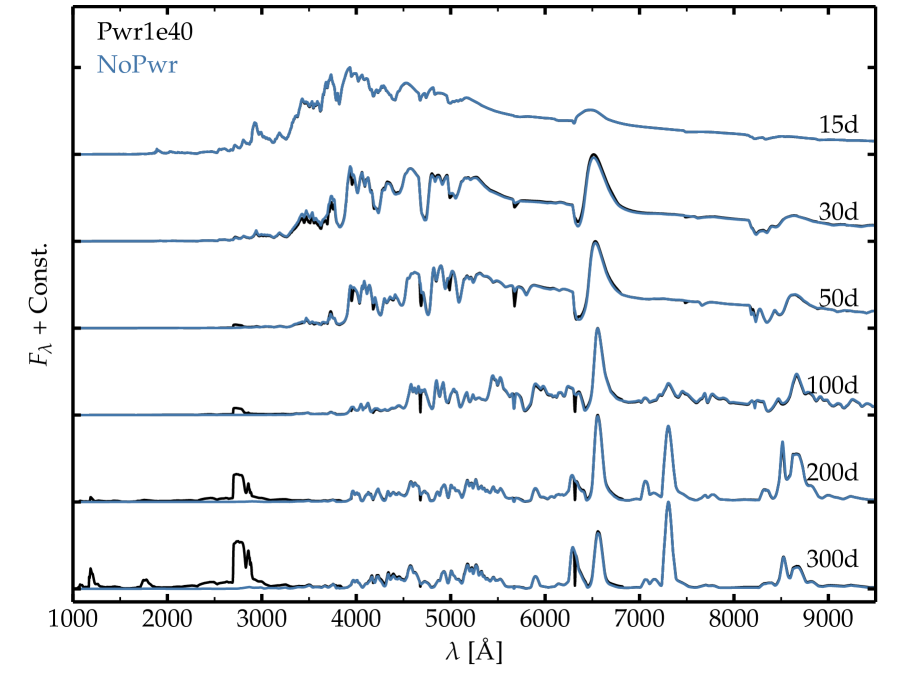
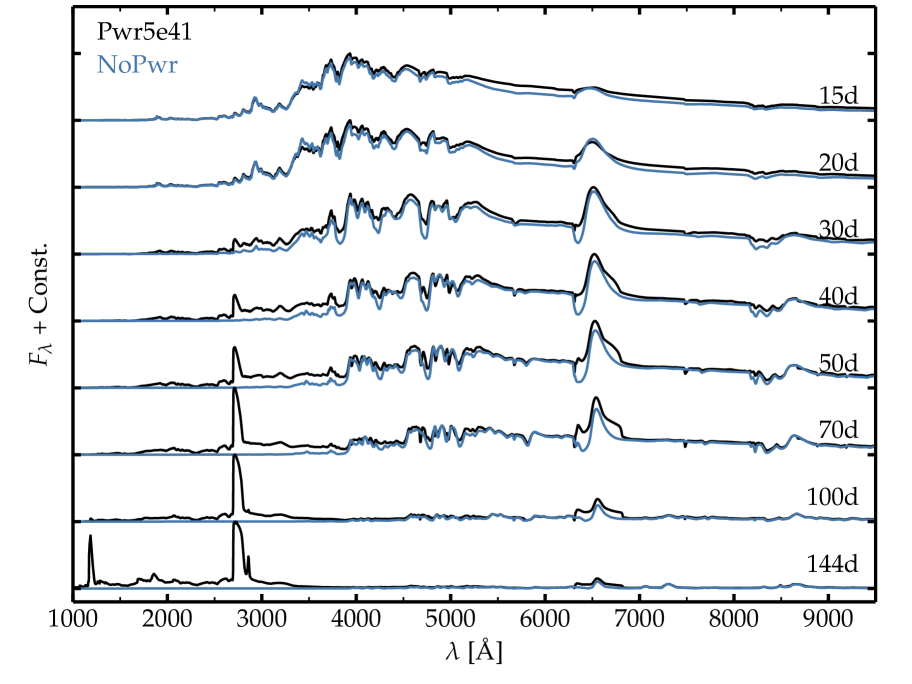
In this work, we present time sequences for a SN II ejecta under the influence of eight different interaction powers (but constant in time for any given model sequence). These seven distinct sequences take shock powers of 1040, 1041, 5 1041, 1042, 2.5 1042, 5 1042, and 1043 erg s-1 (the corresponding model names are Pwr1e40 etc). One sequence without interaction power serves as a reference (model NoPwr). All models have the same density structure at any given SN age and were evolved until 150–300 d – the models change little once nebular. The simulations are time dependent and contain all the assets of the standard simulations performed in the past with CMFGEN (for similar but noninteracting SNe II models, see, for example, Hillier & Dessart 2019). Different ejecta models, levels of clumping (which is known to impact the temperature and the gas ionization), shock velocities, progenitor mass loss history, or composition will be considered in future studies.
3 Results
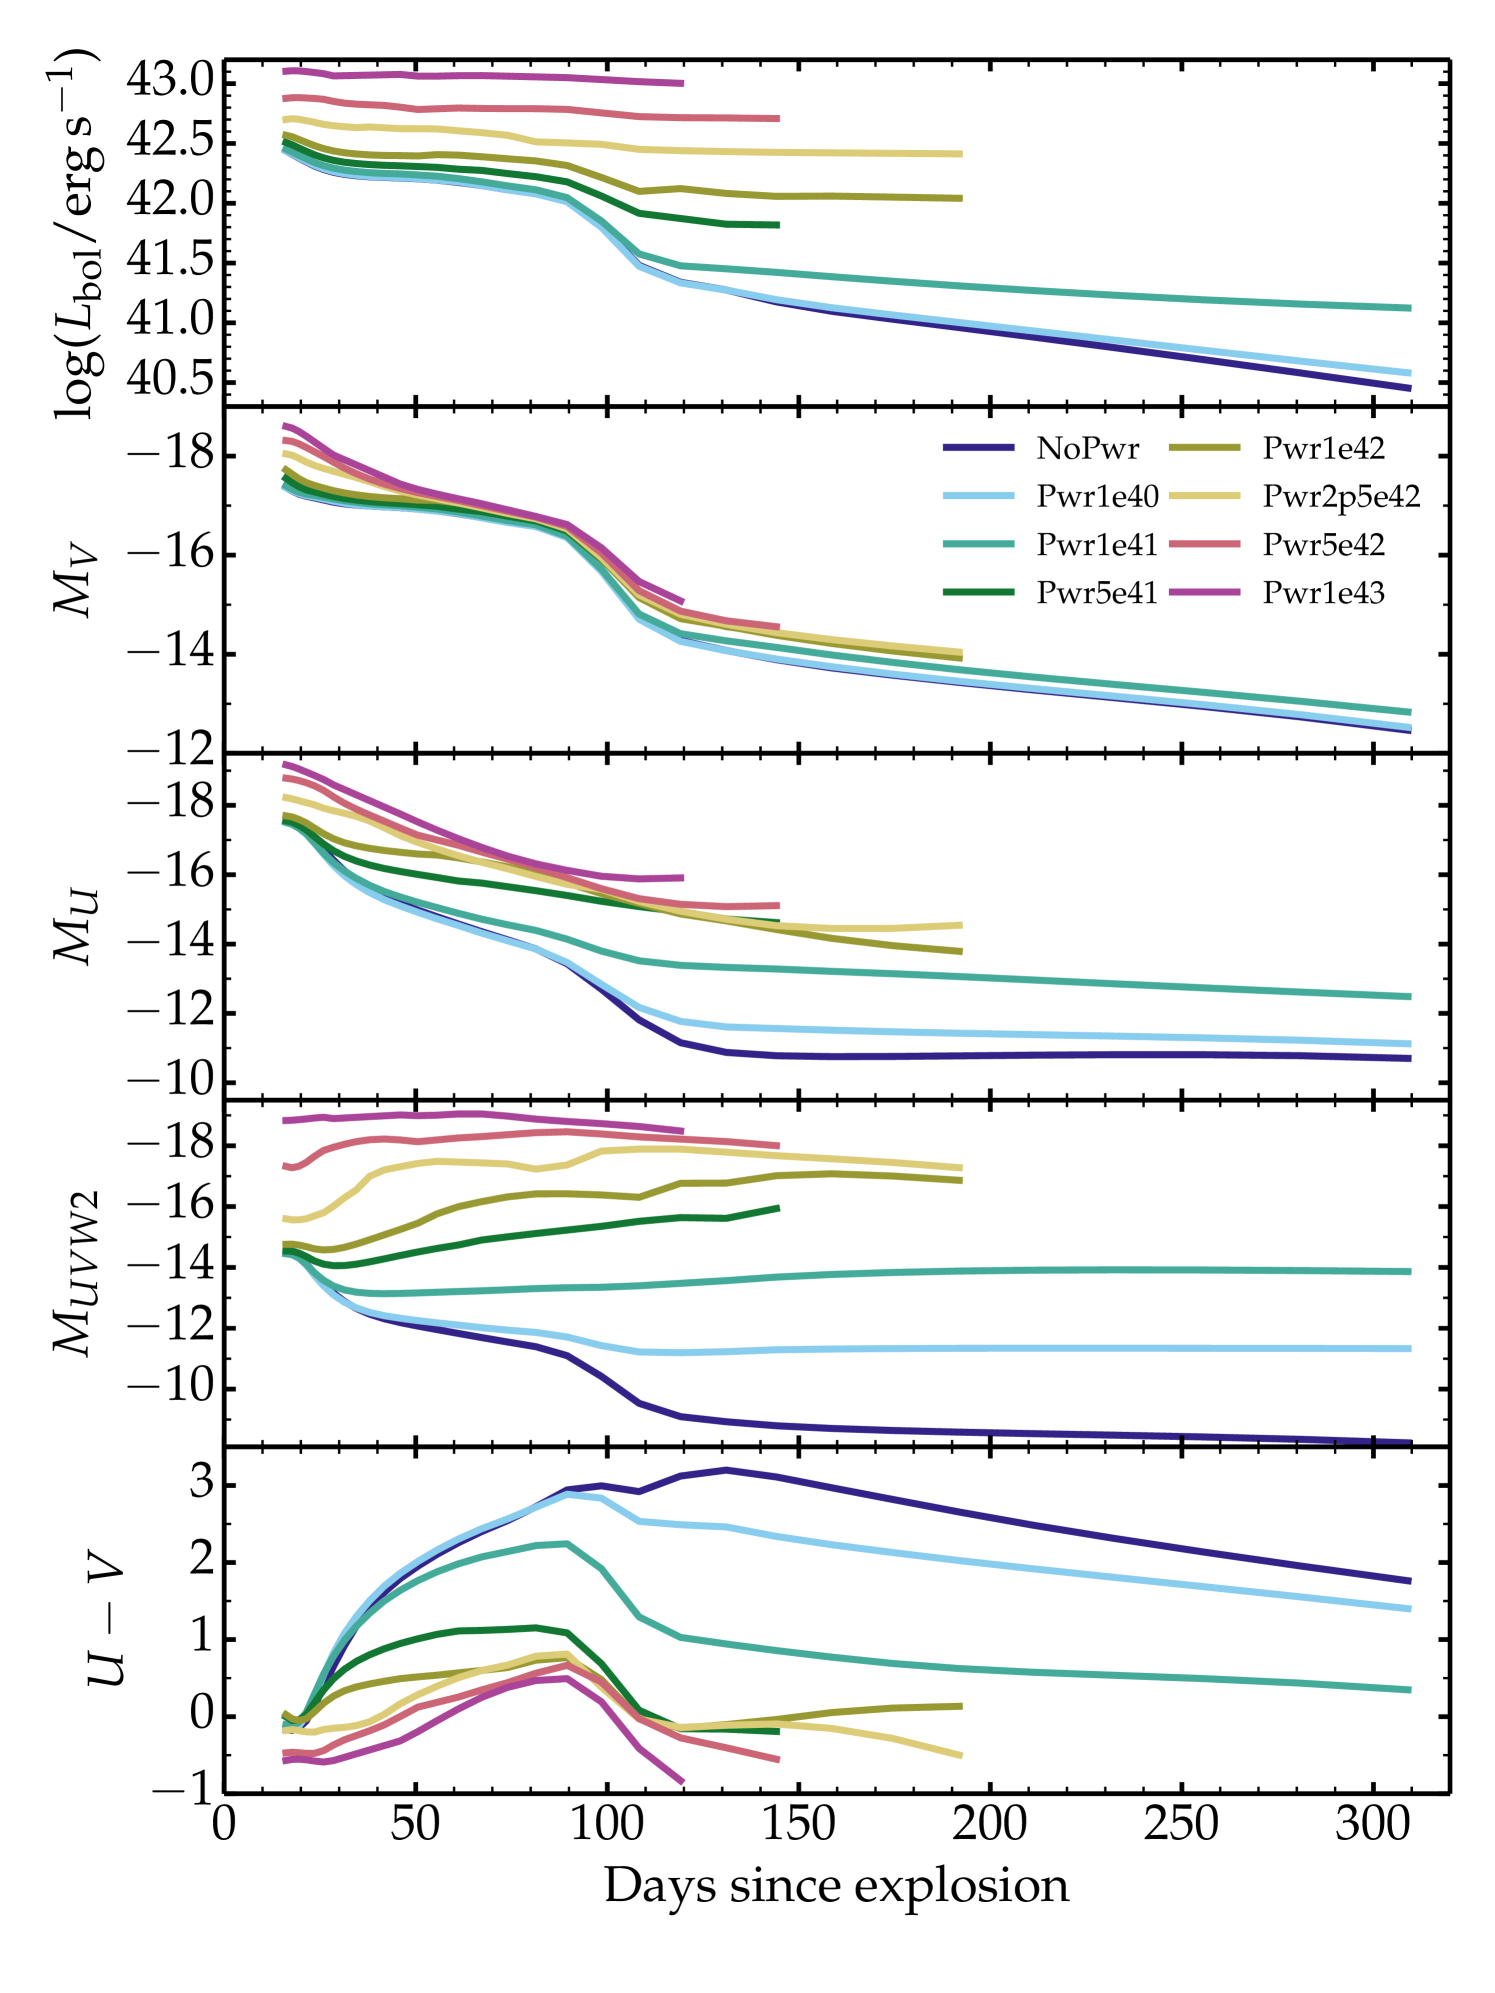
The top panel of Fig. 2 shows the bolometric light curves for our set of models. For increasing interaction power, the luminosity from the underlying ejecta (stemming from energy deposited by the SN shock prior to shock breakout as well as from the continuous power supply from radioactive decay) is progressively dominated by the interaction power and eventually swamped for erg s-1 during the photospheric phase. Although the models span three orders of magnitude in interaction power, there is only a factor of 5.6 difference in bolometric luminosity at 40 d after explosion. This arises from the large intrinsic luminosity of noninteracting SN II ejecta during the photospheric phase, which stems from the release of stored radiation energy. Because the SN ejecta is typically ten times fainter at nebular times, an interaction power of 1041 erg s-1 is more easily discerned after about 120 d.
The lower panels of Fig. 2 give some photometric properties. It is essentially impossible from the -band brightness (0.5 mag offset between models at 42 d) to guess the presence of an interaction in this parameter space, but the interaction is strikingly apparent in the band, and more so as we progress to the UV (with offsets of several magnitudes). The sensitivity in makes the color a good probe of these interaction models.
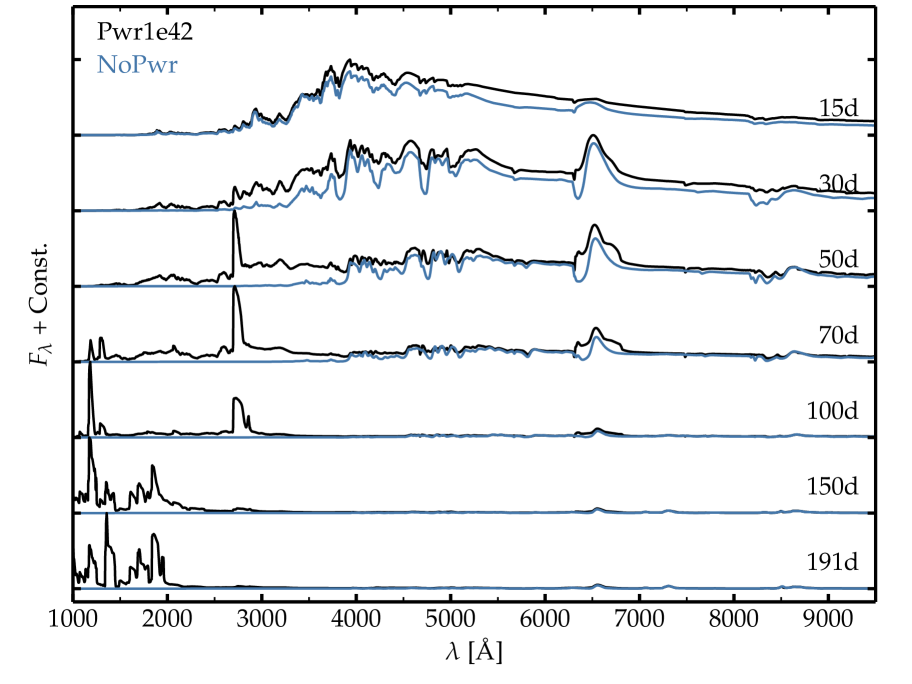
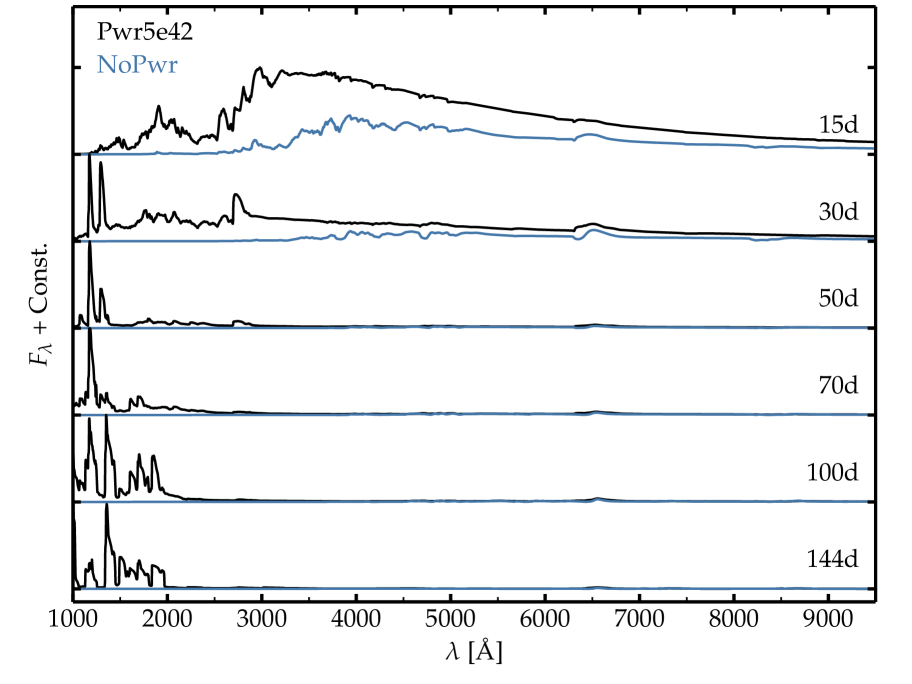
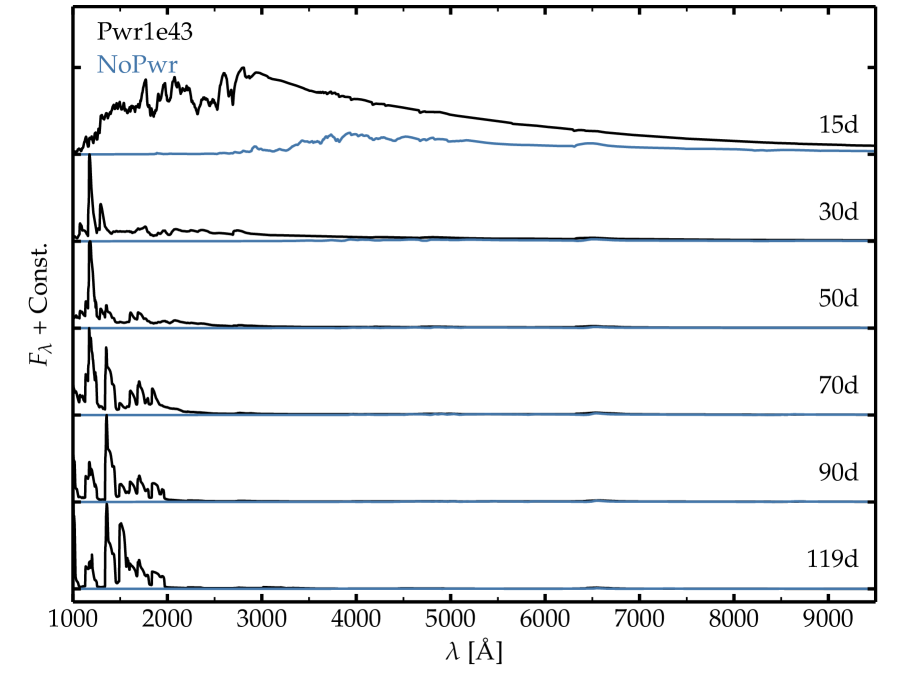
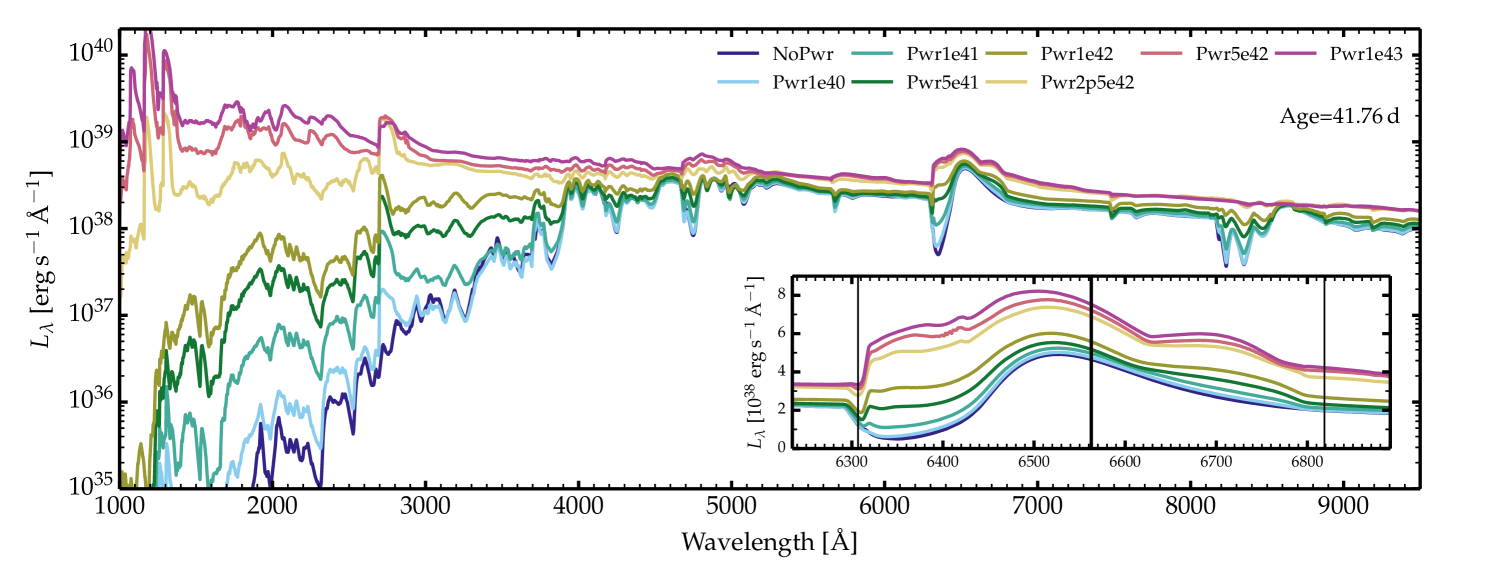
Figure 3 compares the synthetic spectra from 1000 to 9500 Å at 41.76 d after explosion (see Fig. 6 for the counterpart at 108.3 d). At that time, the maximum offset is only 50 % in optical luminosity but the disparity between models is huge in the UV. Models without interaction power are UV faint as a result of a cold photosphere essentially at the H recombination temperature and affected by strong metal line blanketing. With increasing interaction power, the UV flux progressively rises and the Mg ii doublet emerges and strengthens. For the models with the highest powers, other emission lines appear in the far-UV, namely multiplets of Si iii and Fe iii around 1110 Å, Ly, or C ii at 1335 Å. Hence, interaction power is an efficient process to produce superluminous SNe but such transients are optically superluminous only if the interaction power is strongly degraded into low energy photons. In this context, observations in both UV and optical are essential to establish the bolometric luminosity of a SN and determine the presence of an interaction.
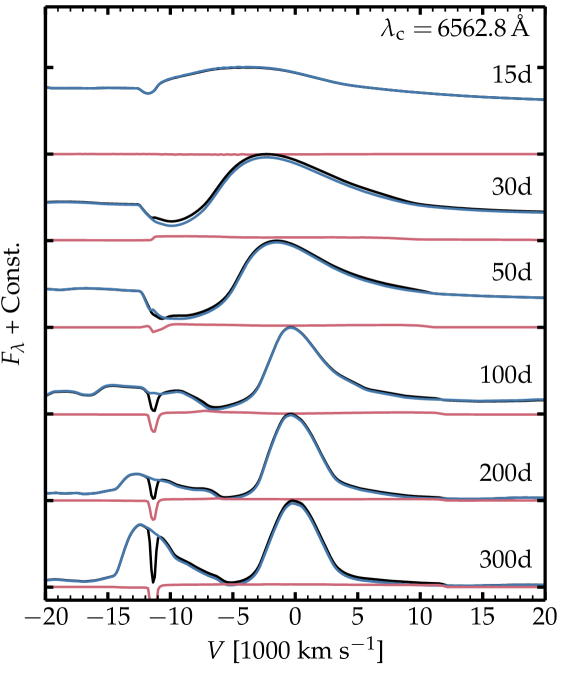
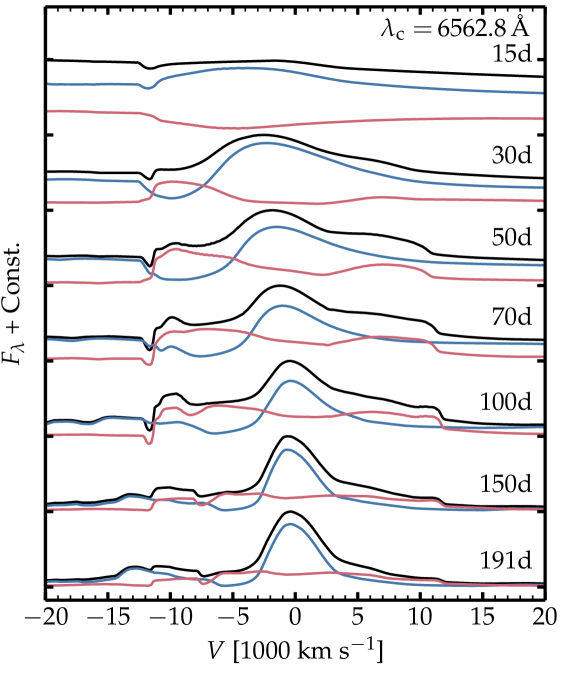
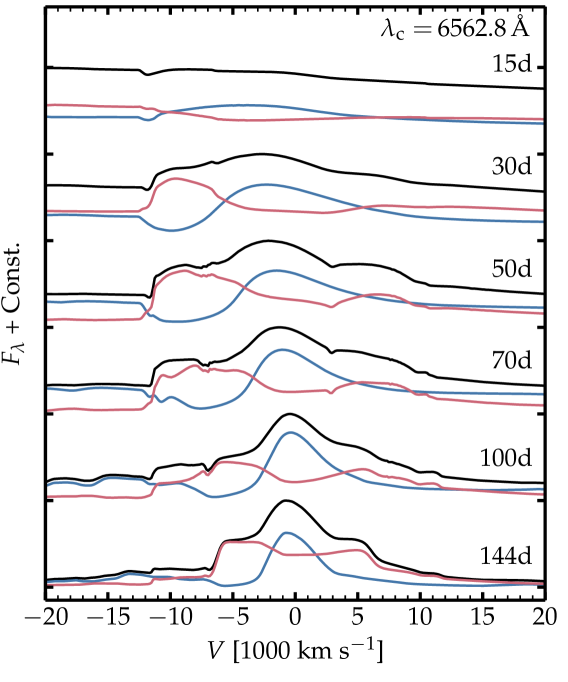
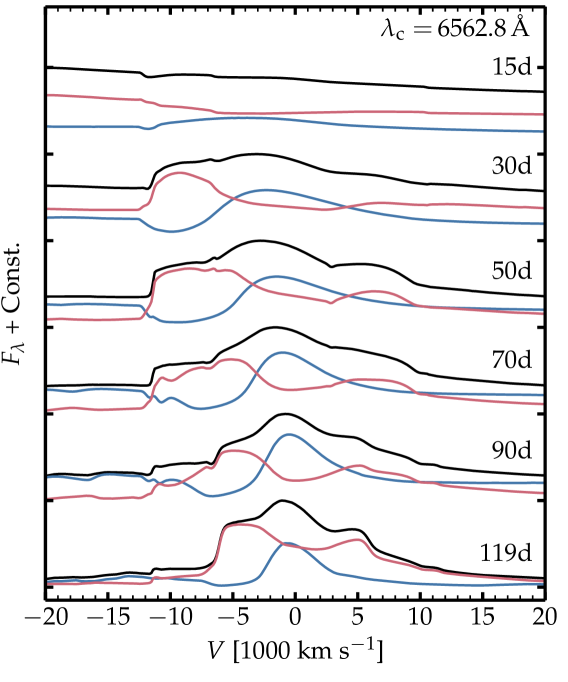
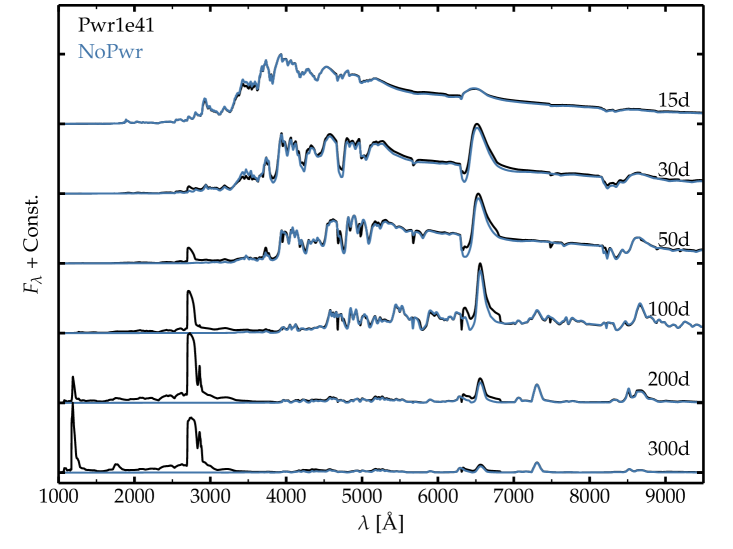
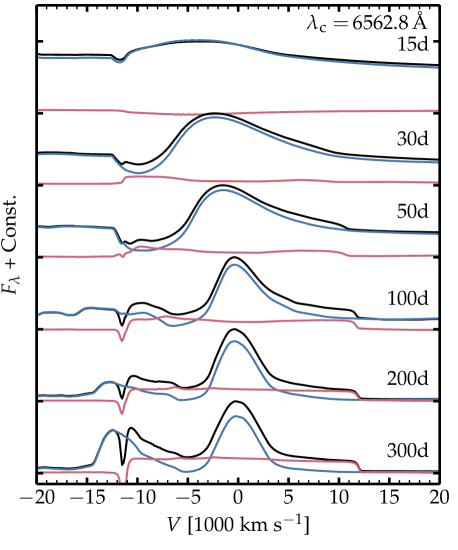
In contrast to the diverse UV landscape sketched by the models, the interaction yields subtle, though compelling, spectral features in the optical. Numerous line profiles including H, H, Na i D, or the Ca ii near-infrared triplet, exhibit a strong and narrow absorption at the Doppler velocity corresponding to the dense shell (i.e., a ‘high velocity’ or HV feature in SN jargon). This HV notch is present even without interaction power. However, as interaction power is increased, this absorption becomes more obvious (see inset for H in Fig. 3). For a given model sequence, these HV features emerge at the onset of the recombination epoch (around 30–50 d) and strengthen thereafter (Fig. 4). Our results confirm the findings of Chugai et al. (2007) based on observations of SNe 1999em and 2004dj – larger samples of Type II SN spectra reveal that such HV features are not rare although they tend to be more frequently observed in H and H (Gutiérrez et al., 2017).
The HV features arise because the thin shell at large velocity is much larger than the continuum emitting region. These notches are narrow because the shell is narrow and because projection effects are small. Such a shell may have a complex formation history. It first forms at the time of shock breakout, but this alone produces a negligible shell mass. More mass can be accumulated if some dense CSM is present close to the star, as in SN 2013fs (Yaron et al., 2017), and in addition, or alternatively, if some lower density CSM is present over a large volume, as proposed by Chugai et al. (2007). We do find in our simulations that even without interaction power, a HV feature may be present (model NoPwr shows a HV feature in H, H, Na i D, and in the Ca ii near infrared triplet at 50 d).
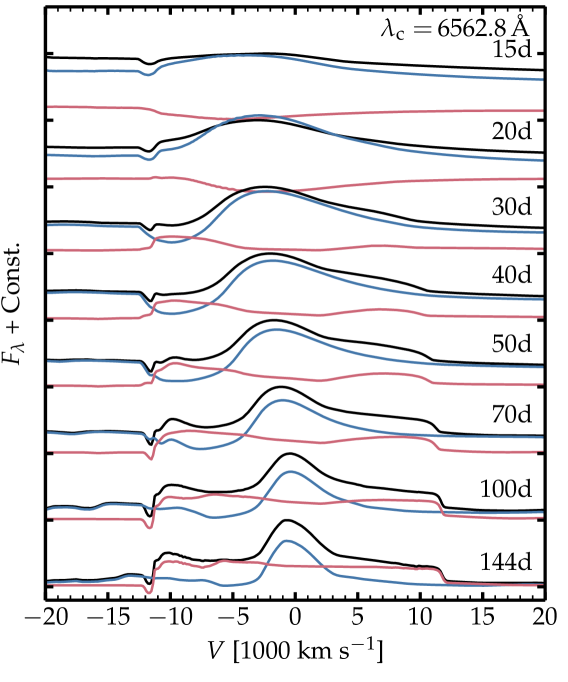
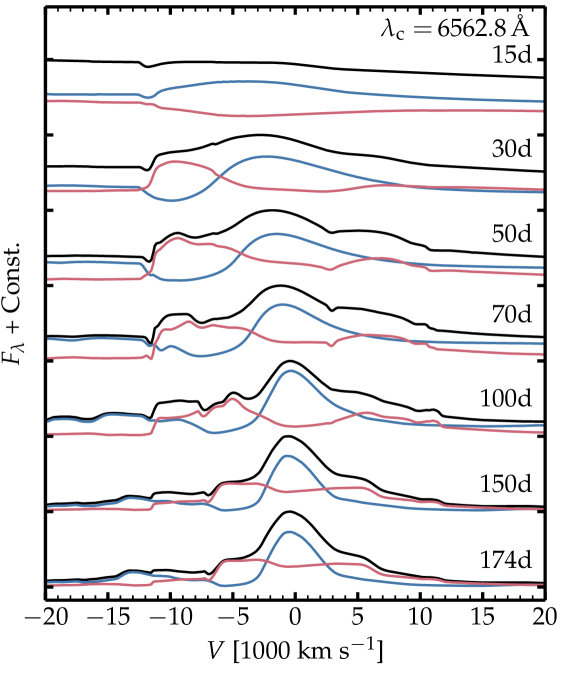
As interaction power is increased (mass loss rates greater than 10-5 yr-1, thus barely above the typical RSG mass loss rates), a broad H emission component appears (right panel in Fig. 4). Because of optical depth effects, it is strongly blueshifted early in the photospheric phase but eventually turns into a boxy emission bounded within 11700 km s-1 (i.e., corresponding to the dense shell velocity). A boxy profile is simply a consequence of having a narrow emitting shell and a Hubble flow. In model Pwr1e41 at 300 d, this extended emission overlaps in the blue with [O i] , making the red component of the O i doublet appear stronger than the blue component (right panel of Fig. 4). This boxy emission extends to the red of the H rest wavelength and makes its origin clear : It only occurs in the presence of interaction (model NoPwr does not have it). Such a profile has been seen at nebular times in SN 2017ivv (Gutiérrez et al., 2020).
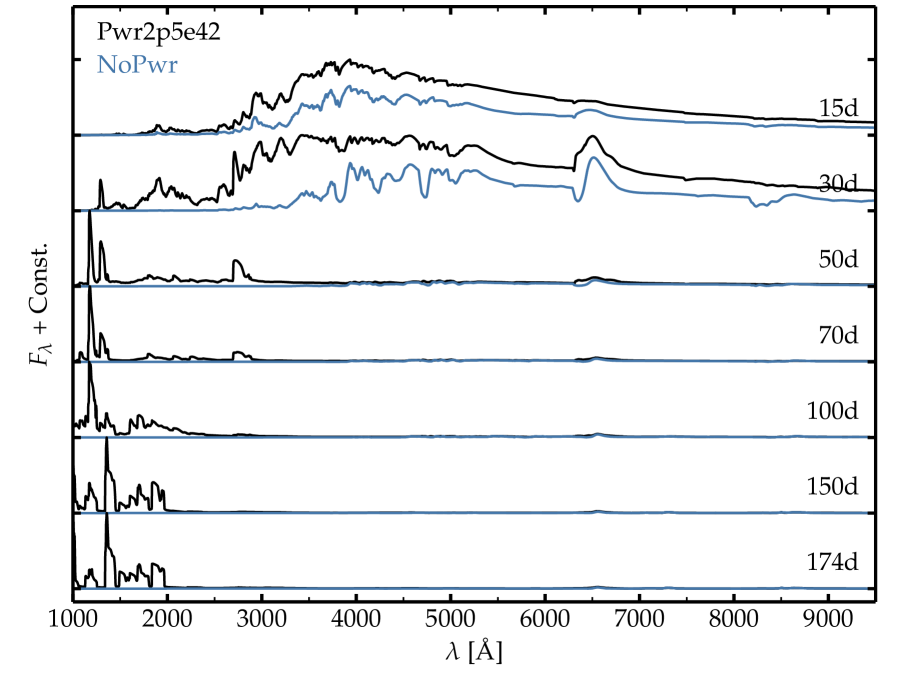
In the models with the highest power, the model spectra in the UV and in the optical strongly depart from the NoPwr model (Fig. 3). Besides the huge UV flux, a blue continuum flux weakens the line absorptions in the optical. Some lines are also weakened because the interaction power enhances the ionization and the temperature of the ejecta layers (an ionization wave penetrates the ejecta inwards from the CDS), overionizing certain species (e.g., at 41.76 d, Ca is everywhere Ca2+ in model Pwr1e43 but partially Ca+ in model Pwr1e40). The broad boxy emission component is very strong in model Pwr1e43 during the photospheric phase, with a slight excess near line center reminiscent of the H emission seen in model NoPwr. An H profile with a weak or no absorption component testifies for the presence of an interaction (Hillier & Dessart, 2019) and the connexion to brighter and faster declining Type II SN light curves (Gutiérrez et al., 2014). At nebular times, the outer dense shell in the models with the highest power is hot and highly ionized, which quenches the broad boxy H emission component (Figs. 10–12).
In nearly all of our simulations, the interaction power eventually dominates over decay power as we progress in the nebular phase. The trends seen in a given model with increasing SN age are qualitatively similar to those seen at a given time with increasing interaction power (Fig. 3). In model Pwr1e41 at 300 d, the offset in flux is primarily confined to the UV (67 % of the total flux emerges in the UV) where strong lines have formed (Ly and Mg ii ). This strong effect results from our ad-hoc prescription of a fixed interaction power at all times. However, it is clear that the UV range is critical to evaluate the presence of an interaction since the only obvious optical signature is limited to the broad boxy emission component of H, which typically contains of order 1 % of the total interaction power injected in the model.
4 Conclusions
In this letter, we have presented a new method for modeling interacting SNe within the time-dependent nonLTE radiative transfer code CMFGEN. The method is designed to cover conditions in which the CSM is optically thin in electron scattering, to complement the alternate configurations with optically-thick CSM handled with HERACLES and the non-monotonic solver in CMFGEN (Dessart et al., 2015). The preliminary simulations presented in this letter were focused on a Type II SN ejecta, modified to exhibit a dense shell at high velocity to mimic the swept-up mass from the interaction with CSM, and influenced by various shock powers. Although it depends on the level of clumping in the dense shell and the efficiency of thermalization therein, the bulk of the interaction power tends to emerge in the UV, making this spectral range essential in this context and emphasizing the need for future observations of transients in the UV (Kulkarni et al., 2021). In the optical, the presence of a dense shell can give rise to HV features in numerous strong lines (H, Na i D etc), even in the absence of interaction power. However, as the interaction is increased, the HV absorptions tend to strengthen while a broad boxy H emission component develops.
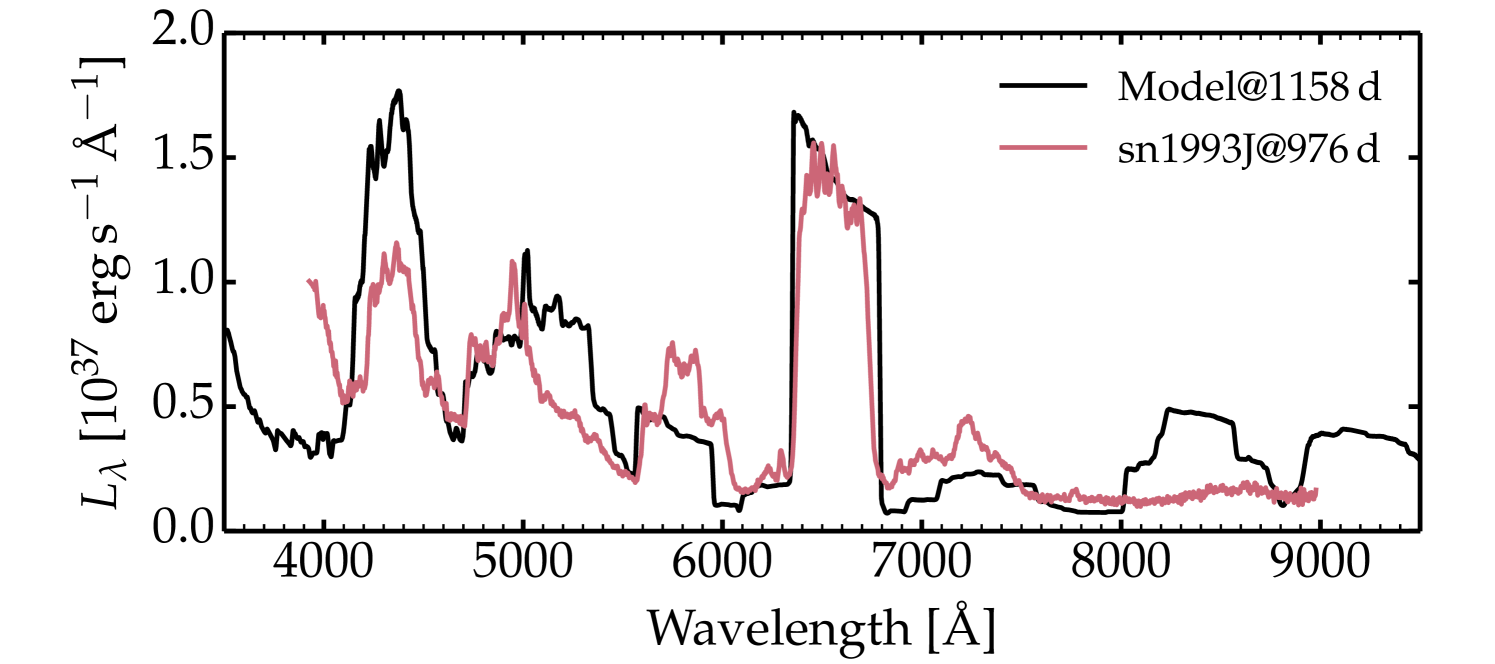
The method can be applied to any type of SN ejecta and may help quantify the level at which an interaction with a pre-SN wind can contaminate the SN radiation. Because it is well suited at nebular times, it will allow investigations on the long-term evolution of SN ejecta such as SN 1993J (an exploratory model is shown in Fig. 5), and help constrain the mass loss history of SN progenitors in the years, decades or centuries prior to explosion.
Acknowledgements.
We acknowledge fruitful discussion with J. Anderson and P. Pessi. This work was supported by the “Programme National de Physique Stellaire” of CNRS/INSU co-funded by CEA and CNES. DJH thanks NASA for partial support through the astrophysical theory grant 80NSSC20K0524. This work was granted access to the HPC resources of CINES under the 2020 allocation A0090410554 made by GENCI, France. This research has made use of NASA’s Astrophysics Data System Bibliographic Services.References
- Bersten & Hamuy (2009) Bersten, M. C. & Hamuy, M. 2009, ApJ, 701, 200
- Chugai (2001) Chugai, N. N. 2001, MNRAS, 326, 1448
- Chugai et al. (2007) Chugai, N. N., Chevalier, R. A., & Utrobin, V. P. 2007, ApJ, 662, 1136
- de Jager et al. (1988) de Jager, C., Nieuwenhuijzen, H., & van der Hucht, K. A. 1988, A&AS, 72, 259
- Dessart et al. (2015) Dessart, L., Audit, E., & Hillier, D. J. 2015, MNRAS, 449, 4304
- Dessart et al. (2017) Dessart, L., Hillier, D. J., & Audit, E. 2017, A&A, 605, A83
- Dessart et al. (2016) Dessart, L., Hillier, D. J., Audit, E., Livne, E., & Waldman, R. 2016, MNRAS, 458, 2094
- Dessart et al. (2009) Dessart, L., Hillier, D. J., Gezari, S., Basa, S., & Matheson, T. 2009, MNRAS, 394, 21
- Dessart et al. (2018) Dessart, L., Hillier, D. J., & Wilk, K. D. 2018, A&A, 619, A30
- Eldridge et al. (2008) Eldridge, J. J., Izzard, R. G., & Tout, C. A. 2008, MNRAS, 384, 1109
- Fassia et al. (2001) Fassia, A., Meikle, W. P. S., Chugai, N., et al. 2001, MNRAS, 325, 907
- Fransson et al. (2014) Fransson, C., Ergon, M., Challis, P. J., et al. 2014, ApJ, 797, 118
- Fuller (2017) Fuller, J. 2017, MNRAS, 470, 1642
- Gutiérrez et al. (2014) Gutiérrez, C. P., Anderson, J. P., Hamuy, M., et al. 2014, ApJ, 786, L15
- Gutiérrez et al. (2017) Gutiérrez, C. P., Anderson, J. P., Hamuy, M., et al. 2017, ApJ, 850, 89
- Gutiérrez et al. (2020) Gutiérrez, C. P., Pastorello, A., Jerkstrand, A., et al. 2020, MNRAS, 499, 974
- Hillier & Dessart (2012) Hillier, D. J. & Dessart, L. 2012, MNRAS, 424, 252
- Hillier & Dessart (2019) Hillier, D. J. & Dessart, L. 2019, A&A, 631, A8
- Jacobson-Galán et al. (2022) Jacobson-Galán, W. V., Dessart, L., Jones, D. O., et al. 2022, ApJ, 924, 15
- Kulkarni et al. (2021) Kulkarni, S. R., Harrison, F. A., Grefenstette, B. W., et al. 2021, arXiv:2111.15608
- Langer (2012) Langer, N. 2012, ARA&A, 50, 107
- Langer et al. (1994) Langer, N., Hamann, W. R., Lennon, M., et al. 1994, A&A, 290, 819
- Leonard et al. (2000) Leonard, D. C., Filippenko, A. V., Barth, A. J., & Matheson, T. 2000, ApJ, 536, 239
- Maeder & Meynet (1987) Maeder, A. & Meynet, G. 1987, A&A, 182, 243
- Matheson et al. (2000) Matheson, T., Filippenko, A. V., Barth, A. J., et al. 2000, AJ, 120, 1487
- Moriya et al. (2011) Moriya, T., Tominaga, N., Blinnikov, S. I., Baklanov, P. V., & Sorokina, E. I. 2011, MNRAS, 415, 199
- Moriya et al. (2017) Moriya, T. J., Yoon, S.-C., Gräfener, G., & Blinnikov, S. I. 2017, MNRAS, 469, L108
- Morozova et al. (2017) Morozova, V., Piro, A. L., & Valenti, S. 2017, ApJ, 838, 28
- Podsiadlowski et al. (1992) Podsiadlowski, P., Joss, P. C., & Hsu, J. J. L. 1992, ApJ, 391, 246
- Quataert & Shiode (2012) Quataert, E. & Shiode, J. 2012, MNRAS, 423, L92
- Renzo et al. (2017) Renzo, M., Ott, C. D., Shore, S. N., & de Mink, S. E. 2017, A&A, 603, A118
- Schlegel (1990) Schlegel, E. M. 1990, MNRAS, 244, 269
- Stathakis & Sadler (1991) Stathakis, R. A. & Sadler, E. M. 1991, MNRAS, 250, 786
- Wellstein & Langer (1999) Wellstein, S. & Langer, N. 1999, A&A, 350, 148
- Woosley et al. (2002) Woosley, S. E., Heger, A., & Weaver, T. A. 2002, Reviews of Modern Physics, 74, 1015
- Yaron et al. (2017) Yaron, O., Perley, D. A., Gal-Yam, A., et al. 2017, Nature Physics, 13, 510
- Yoon et al. (2010) Yoon, S.-C., Woosley, S. E., & Langer, N. 2010, ApJ, 725, 940
- Zhang et al. (2012) Zhang, T., Wang, X., Wu, C., et al. 2012, AJ, 144, 131
Appendix A Additional figures
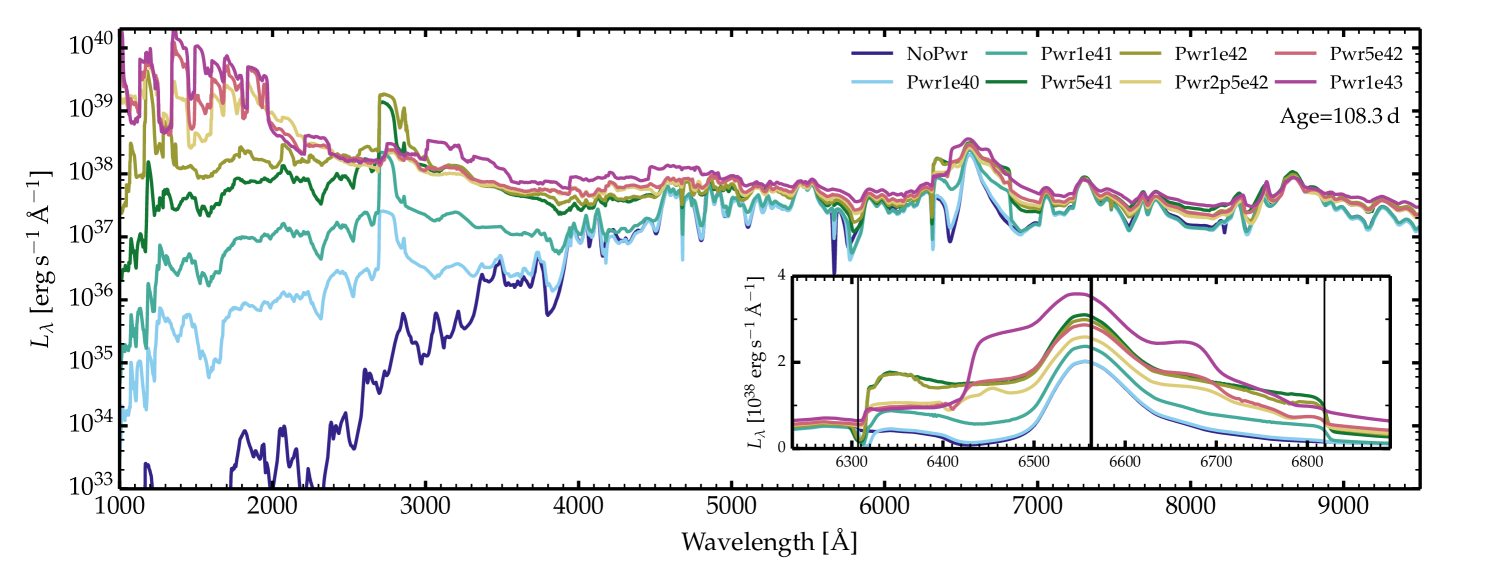
In this appendix, we provide additional illustrations to document the results from our radiative transfer simulations. Figure 6 shows the UV and optical properties at 108.3 d. This epoch corresponds to the onset of the nebular phase for all models (see the bolometric light curves in the top panel of Fig. 2). Compared to the properties at 41.76 d (Fig. 3), the impact of the interaction is greater because the radiation from the noninteracting part of the ejecta is smaller. The lower densities also lead to a greater ionization and temperature, which all conspire to producing a greater boost to the UV luminosity. The broad and boxy emission component in the H profile is also more developed (except for the highest powers), while the H emission from the underlying ejecta is weaker and narrower.
Figures 7 to 12 are similar to Fig. 4, but show the results for the whole set of models that cover from zero to the highest interaction power of 1043 erg s-1. At high interaction power, the models were stopped earlier in the sequence, around 50 d or at the onset of the nebular phase.