Modeling the Surface X-ray Emission and Viewing Geometry of PSR J08214300 in Puppis A
Abstract
We present a model for the unusual X-ray pulse profiles of PSR J08214300, the compact central object in supernova remnant Puppis A. We show that a pair of thermal, antipodal hot-spots on the neutron star surface is able to fully account for the pulsar’s double blackbody spectrum and energy-dependent pulse profile, including the observed phase reversal at keV. By comparing the observed pulse modulation and phase to the model predictions, we strongly constrain the hot-spot pole () and the line-of-sight () angles with respect to the spin axis. For a nominal radius of km and distance kpc, we find , with error ellipse of (); this solution is degenerate in the two angles. The best-fit spectral model for this geometry requires that the temperatures of the two emission spots differ by a factor of 2 and their areas by a factor of . Including a cosine-beamed pattern for the emitted intensity modifies the result, decreasing the angles to (); however this model is not statistically distinguishable from the isotropic emission case. We also present a new upper limit on the period derivative of (), which limits the global dipole magnetic field to G, confirming PSR J08214300 as an “anti-magnetar.” We discuss the results in the context of observations and theories of nonuniform surface temperature on isolated NSs of both weak and strong magnetic field. To explain the nonuniform temperature of PSR J08214300 may require a crustal field that is much stronger than the external, global dipole field.
Subject headings:
pulsars: individual (PSR J08214300) — stars: neutron — X-rays: stars1. Introduction
The young X-ray pulsar PSR J08214300, associated with the Puppis A supernova remnant (SNR), is one of three pulsars in SNRs that are spinning down nearly imperceptibly (Gotthelf & Halpern, 2009, Paper I). The age of PSR J08214300 is kyr based on the proper motion of oxygen knots in Puppis A (Winkler et al., 1988), and its distance is kpc from H I absorption features to the SNR (Reynoso et al., 1995). In the context of the magnetic dipole model, these pulsars are a new physical manifestation of neutron stars (NSs), “anti-magnetars” born with weak magnetic fields possibly related to slow natal spin (Gotthelf & Halpern, 2008). They were drawn from the previously defined class of central compact objects (CCOs) in SNRs, which are characterized by their steady, predominantly thermal X-ray emission, lack of optical or radio counterparts, and absence of pulsar wind nebulae (see reviews by Pavlov et al. 2004 and De Luca 2008). Currently, 7–10 objects are known or proposed to be CCOs (for a list, see Halpern & Gotthelf, 2010), and are therefore candidates for anti-magnetars.
The XMM-Newton discovery observations of PSR J08214300 revealed an abrupt phase reversal of its quasi-sinusoidal pulse profile at an energy of around keV (Paper I). The X-ray spectrum of PSR J08214300 was fitted with a two-temperature blackbody model, both temperatures being seen at all rotation phases, while the cross-over energy of the spectral components coincides with the energy where the pulse reverses phase. These detailed properties afford the opportunity to construct a highly constrained model of the NS surface emission geometry.
In this Paper, we present a quantitative verification of the geometrical model for PSR J08214300 proposed in Paper I. By reproducing the detailed pulse profile behavior, we are able to specify the surface emission areas and viewing geometry to within . Our treatment includes general relativistic effects of light deflection and gravitational redshift, and examines the effects of local anisotropy (beaming) in the emitted radiation. We describe the antipodal hot-spot model in Section 2, compare the energy-dependent modulation to the data for the range of allowed geometries in Section 3, and explore if it is possible to limit the neutron star radius in conjunction with the estimated distance. In Section 4 we discuss some implications of the model results, and in Section 5 compare with pulsars of other types.
2. The Emission model
Our method of modeling the emission from spots on the surface of a NS follows the derivation given by Pechenick et al. (1983), with some generalizations introduced by Perna & Gotthelf (2008). The radiation comes from a hot spot of blackbody temperature and angular radius , and an antipodal warm spot of lower temperature and angular radius . The remainder of the surface is assumed to be at a uniform temperature . The geometry is indicated in Figure 1.
We use to indicate the phase of rotation instead of the common notation . Phase corresponds to the closest approach of the hot spot to the observer, while the phase of rotation is related to the angular rotation rate of the star through . We indicate with the angle that the hot-spot axis makes with the line-of-sight. is a function of the angle between the hot-spot axis and the rotation axis and the angle between the line-of-sight and the rotation axis, by means of the relation
| (1) |
For each set of angles and , the angle that the axis of the opposing warm spot makes with respect to the line-of-sight is simply .
The spherical coordinate system is defined with respect to the line-of-sight as the -axis. Due to general relativistic effects, a photon emitted at a colatitude reaches the observer only if emitted at an angle with respect to the perpendicular to the NS surface. The two angles are related by the ray-tracing function111To improve the computational efficiency of this equation we use the approximation presented in Beloborodov (2002). (Pechenick et al., 1983; Page, 1995)
| (2) |
having defined . Here, is the ratio of the NS radius to Schwarzschild radius, (we will assume ).
The hot spot is bounded by the conditions:
| (3) |
and
| (4) |
where
| (5) |
On the other hand, it is identified through the condition
| (6) |
where the outer boundary of the spot is computed by numerical solution of the equation
| (7) |
The antipodal warm spot is described on the surface of the star through the same conditions, but with the substitutions and .
We assume that the emission from the hot and warm spots is blackbody, of uniform temperatures and , respectively. The spectral function is then given by , where the temperature is equal to or if and are inside either of the spots, respectively, and it is equal to zero outside. Given that the presence of NS atmospheres and their elemental composition are yet to be firmly established, here we first model isotropic radiation. Then, we explore how the obtained constraints depend on the assumption of forward beaming of the radiation, as found in magnetized, light element atmosphere models (e.g., Pavlov et al., 1994), by approximating beaming222This approximation is based on the assumption that the magnetic field is normal to the surface in the heated regions; this is plausible since heat transport along the B field lines is enhanced in the outer envelope, at least for G. See §4 for further discussion of this issue. as intensity . The observed spectrum as a function of phase angle is obtained by the standard method of integrating the local emission over the observable surface of the star, accounting for the gravitational redshift of the radiation following Page (1995):
| (8) |
in units of photons cm-2 s-1 keV-1. In equation (8), the NS radius and photon energy as observed at infinity are given by and , where is the energy emitted at , and is defined as
| (9) |
The phase-averaged flux is computed as .

In addition to the basic two-temperature antipodal spot model described above, the spectrum of PSR J08214300 requires an additional narrow line-like component around 0.77 keV, possibly an electron cyclotron feature in emission (Paper I). Furthermore, as shown in Paper I, this spectral feature is associated exclusively with the larger spot, of temperature . In the current study, we include the best fitted Gaussian line as an additive component to our basic model. With no other information about its spatial distribution, this emission is assumed to be spread uniformly over the surface of the warm spot only. This line emission is shown to account for a notable increase in the observed modulation below 1 keV, as described in Section 3.
3. Modeling the Energy-Dependent Modulation
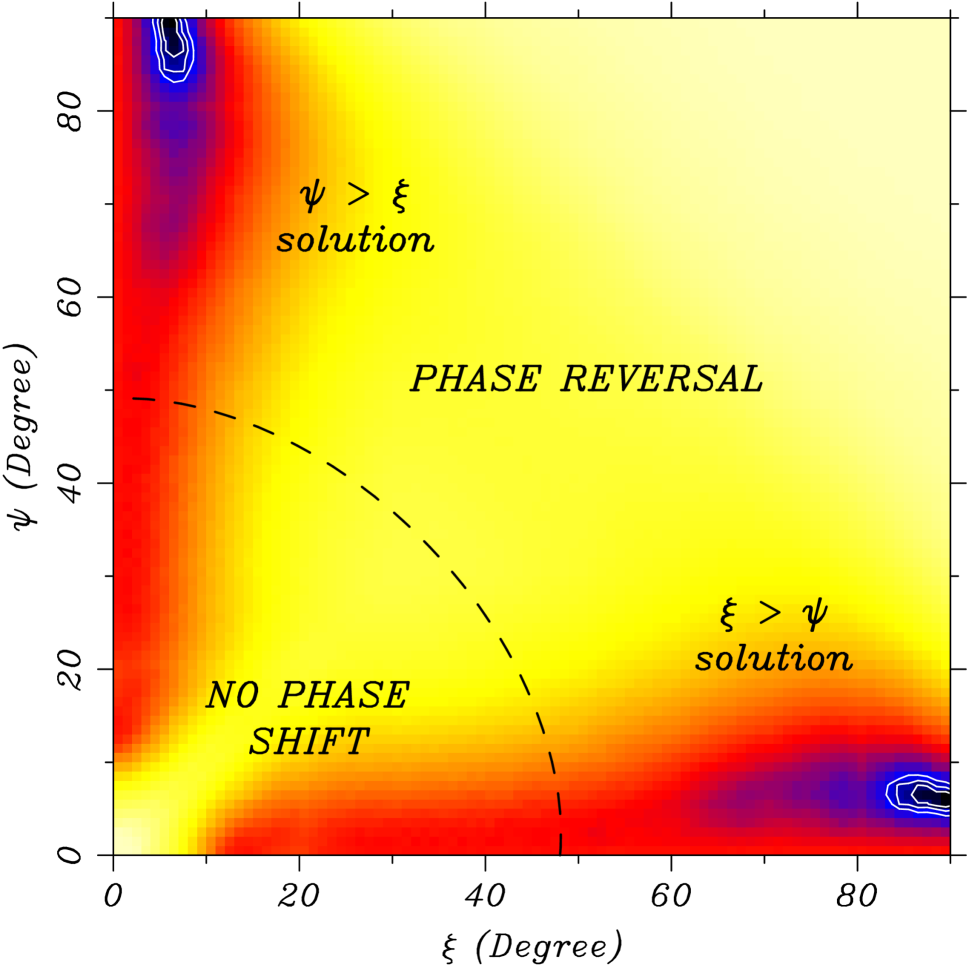
The surface emission geometry of PSR J08214300 is highly constrained by its unique energy dependent pulse profile. As shown in Paper I, the quasi-sinusoidal signal has a background subtracted pulsed fraction of in the energy band keV, with an abrupt change in phase at keV, around which the modulation evidently cancels out. This behavior is indicative of a geometry having the symmetry of Figure 1, namely, a pair of antipodal spots of different temperatures. Our goal is to match the observed pulse profile (modulation and phase) in three interesting energy bands, , , and keV, using the antipodal model, by exploring the range of all possible viewing and hot-spot geometry pairs (; see Figure 1), and fitting for the correct one.
We summarize our proceedure as follows. We started by fitting the X-ray spectrum of Paper I using the antipodal model to compute the temperatures and spot-sizes corresponding to all spot and viewing angles and . We then used these models to compute predicted pulse profiles in the three bands as a function of (,), to compare with the observed profiles. Clearly, only certain geometries will produce a phase shift; for example, there will be no shift if the spot axis is nearly coaligned with both the viewing direction and spin axis, as only one spot remains in view as the star rotates. Finally, we considered the effect of radiative beaming, and repeated our analysis for a range of NS radii. In the following we describe our procedure and results in detail.

For a given set of viewing angles the antipodal flux model can be integrated over phase to provide a direct comparison with the observed spectra. We have incorporated equation (8) into an “additive model” for use in the XSPEC spectral fitting software (Arnaud, 1996). The coded model comprises 13 parameters: the NS radius and distance (), three blackbody temperatures (), two spot angular sizes (), two geometrical angles (), the rotation phase (), and the Gaussian emission-line center, width, and flux. The column density is fixed at the best value determined in Paper I from a fit to the overall spectrum, cm-2. In the spectral fits, the normalization is set to unity so that the flux is determined by and , and implicitly takes into account all relativistic effects noted in Section 2.
![[Uncaptioned image]](https://cdn.awesomepapers.org/papers/0df3d5df-ddae-412e-9041-8e5cfcb91aa4/x8.png)
![[Uncaptioned image]](https://cdn.awesomepapers.org/papers/0df3d5df-ddae-412e-9041-8e5cfcb91aa4/x9.png)
The model allows for a uniform temperature in the inter-spot area, but since none is necessary for an acceptable fit to the spectrum or pulse profiles, we set . Nevertheless, to place a model-independent upper limit on , we have simulated blackbody spectra in XSPEC for km and kpc (Reynoso et al. 1995), increasing the temperature until the model exceeds the spectrum of PSR J08214300 at low energies. Since the model counts depend on the interstellar column density, we assumed here the largest value measured by Katsuda et al. (2010) for filaments in the Puppis A remnant in Chandra data, . This yields a conservative upper limit of keV; Hwang et al. (2008) report a significantly lower value of from Suzaku measurements, which would allow a smaller limit on , if applicable.
To map the antipodal model for PSR J08214300 as a function of () we generated best fit model parameters over the grid spanning () in steps of by systematically fitting for , , , and . Since we fitted the phase-averaged spectrum (presented in Paper I and described therein), a reasonable approximation for the equivalent phase-averaged model flux is . The flux of each blackbody component depends on the size of its respective emission spot as parameterized by its , which sets the normalization for that component. As we consider the range of viewing orientations, the size of the spots must be adjusted to keep the model flux fixed to that of the observed value. This is because the projected flux from the phase integrated emission strongly depends on the viewing geometry (), which is not known a priori. In comparing with data, for each trial () pair, we fit for the spot sizes () that correctly normalize the blackbody components to match the observed spectrum.
The grid of best fitted models with values of () describes the flux from PSR J08214300 as a function of energy and phase () according to equation (8) for any realizable geometry333Not all values of () can fit the spectrum, as the available flux in some cases, e.g., both near zero, are insufficient to match the data even with at its maximum value of . Such cases produce unacceptable statistics., the latter parameterized by () and a set of fixed , and emission-line parameters. We find that the spot temperatures remain almost constant in () and use the average value given in Table 1 in our final fits. The resulting fitted values of and for the case km are interpolated to pixels on a grid and displayed in Figure 2.
We are now prepared to compute the set of phase-resolved modulations in the three interesting energy bands, which manifest the phase shift. Specifically, the pulse in the soft keV band peaks at rotation phase , the hard keV band peaks at , while the modulation in the intermediate keV band cancels out to . The comparison is best done in counts space rather than flux, to make use of the counting statistics for errors. The background counts are measured for each band and added to the model counts. For each () pair, the antipodal flux model, including interstellar absorption, is folded through the XMM-Newton EPIC response function used for the spectral fits (see Paper I). For each energy band, we record the magnitude of the model modulation defined as
| (10) |
where the flux is the total flux in the band, is the number of bins in the light curve (ten in this case), and is the “unpulsed” flux in the band, determined from the bin of minimum flux. The results are shown in Figure 3 for the soft and hard energy bands.
For a given () pair, the model profile in ten phase bins is compared to the observed counts in the three bands, for a total of 30 bins, using the statistic. Since the total count normalizations in each band were fixed earlier by the spectral fits via the parameters, the mean counts of the models match the means of the three observed light curves. This reduces the number of degrees of freedom by three, from 30 to 27. The () region that best matches the measured pulsed fraction in the soft and hard bands, corrected for background, is indicated by the contours in Figure 3. While there is a range of allowed angles in each band separately, they overlap in only two small regions corresponding to the minimum . This uniquely identifies the geometry of the system, within statistical uncertainty. More specifically, we find that, for km, the most likely geometry is specified by the combinations or . Since the flux depends on the angles and only through the parameter in equation (1), it is symmetric with respect to an exchange of and , yielding the two possible solutions. This is evident in the map that compares the model and observed profiles in the three bands (Figure 4). In one solution the spin axis is nearly perpendicular to the line of sight, while in the other solution the two lines are nearly parallel. Figure 5 shows the fit to the pulse profiles for these equivalent best solutions. Finally, the parameters for the model that resulted in the smallest for each test radius are given in Table 1. In all cases, the reduced is near unity, indicating an excellent match to the observed pulse profiles.
Figure 6 provides a graphic explanation of the origin of the observed energy-dependent modulation and phase-shift seen from PSR J08214300. For the set of model parameters that best fit the data, we graph separately the phase-averaged fluxes for the two spots to gauge their contribution to the light curve. At the lower energies, the large warm spot dominates the spectrum and the light curve peaks when this component is in view, while at the higher energies, the small hot spot dominates and it peaks in view 0.5 cycles later. Thus, the energy at which the dominant spectral component switches is around 1.3 keV, and the peak phase necessarily shifts by at this energy due to the antipodal symmetry in longitude. This phase reversal, at this energy, is thus a direct consequence of the crossing of the spectral components of different temperatures. The agreement between the energy of phase reversal and the energy of the spectral cross-over point provides direct evidence of the correctness of the model.
Figure 6 also shows that the predicted modulation is 19.6% at the highest energies, where 100% of the flux comes from the blackbody component. At lower energies, the modulation is reduced exactly in proportion to the increased contribution of the or spot, depending on which one dominates the flux at a given energy, . For our broad energy bands, used to compare the model with data, the observed modulation is evidently weighted by the total flux over the band. This is especially clear in the highest energy band (1.5–4.5 keV), in which most of the photons are from the lower end of the band where the modulation is significantly less than 19.6%. The modulation in the middle band, which spans the phase shift with equal counts, is mostly canceled out. That a similar pulsed fraction is measured in the lower and higher bands is largely coincidence in this case. Figure 6 also shows the contribution of the spectral line at keV; a small but significant increase in the modulation results. The photon statistics of the current data do not allow a more detailed comparison of the modulation as a function of energy.
Next we explored the dependence of the fitted parameters on the radius of the NS. As discussed above, due to general-relativistic effects is not simply a normalization of the flux; this requires us to compute maps for each test value of . Therefore, we repeated our full analysis for the range of values km, in 1 km increments. These results are presented in Table 1. In principle, the relativistic effects can lead to a preferred , but statistically, no unique radius is suggested here. The general trend is that the angles , and increase with decreasing radius. Two counteracting effects, both due to flux conservation, influence the spot sizes. Gravitational redshift decreases the inferred emission area on a more relativistic (smaller) star to compensate for the larger needed surface temperature. On the other hand, for a fixed distance , the spot angular size increases on the smaller star. For the values of the fitted parameters here, the latter effect tends to dominate over the former, reducing the modulation from a smaller star for the same viewing geometry. However, the most important effect influencing the amplitude of the modulation is the gravitational deflection of light rays, which acts to suppress the pulsed flux for the smaller star. Therefore, in order to reproduce the same observed level of modulation, a smaller requires a larger modulation of the viewing angle , which, according to equation (1), is obtained by increasing either or . This explains the trends in Table 1444The larger of the two angles () is unchanged as a function of radius relative to its error, while the smaller one is clearly decreasing with radius as compared to its error.
We then repeated our analysis for a locally anisotropic intensity pattern, . For the nominal radius km, the combined constraints from the pulsed fraction and the phase shifts moves the best fitted viewing angles to , with a larger uncertainty than found for the unbeamed case. This behavior is readily accounted for. Forward beaming enhances the emission in the direction of the spot axis, hence increasing the differences in observed flux as the axis of the spot moves toward and away from the observer. As a result, a fit to the observed level of modulation requires smaller values of the viewing angles. The pulse profile is found to remain sinusoidal and is statistically indistinguishable from the isotropic intensity case. For the specific geometry of PSR J08214300, such beaming is a weak effect in narrowing the pulse profile because of our relatively unmodulated views of the two antipodal spots at glancing angles.
In the antipodal model, the energy dependent phase reversal is a direct consequence of switch in dominance between the two blackbody spectral components of different temperatures. As mentioned previously, this agreement between the cross-over energy in phase and spectra is distinct feature of this symmetric model, where the emission spots are exactly antipodal. However, similar light curves can be obtained if the spots remain opposite in longitude, but are allowed to move closer in latitude. Such geometry can still produces a phase reversal. Allowing this additional degree of freedom, the angles ) would not be so strongly constrained as in the antipodal model. More generally, if the spot locations differ in longitude by , such an “offset” model allows the possibility of a continuous phase shift as a function of energy. The effect of asymmetric spot locations is clear in the energy-dependent model profiles, but any such effect in PSR J08214300 is not apparent, and would require higher quality data to discern. Description of the geometry of offset models can be found in Bogdanov et al. (2007, 2008), for example.
| Parameter | Unc.a | (km) | |||||
|---|---|---|---|---|---|---|---|
| 9 | 10 | 11 | 12 | 13 | 14 | ||
| (keV) | 3% | 0.29 | 0.28 | 0.27 | 0.26 | 0.26 | 0.25 |
| (keV) | 3% | 0.57 | 0.54 | 0.53 | 0.51 | 0.50 | 0.50 |
| 6% | |||||||
| 11% | |||||||
| or | |||||||
| or | |||||||
| (27 DoF) | … | 0.94 | 1.00 | 0.99 | 1.00 | 0.95 | 0.97 |
Note. — Spectral fits with fixed parameters cm-2 and kpc. Gaussian line model parameters are fixed at energy keV, width keV, and flux normalization ph cm-2 s-1.
a The uncertainties in the spectral parameters are estimated by running the XSPEC error command; the uncertainties in and are determined from the map of Figure 4.
4. Discussion of Model Results
Using an antipodal spot model, we have accounted for all of the details of the XMM-Newton observations of PSR J08214300 described in Paper I. In particular, we can reproduce the overall spectral shape, energy-dependent pulsed modulation, and abrupt phase reversal at the cross-over energy of the fitted blackbody components. In so far as no observed phenomena remains unmodeled, and no unobserved features are predicted, the antipodal model provides a credible description of the geometry of emission from the CCO in Puppis A. The full data set can be reproduced, with slight differences in the best fitted parameters, assuming either isotropic or forward-beamed emission. Differentiating between these assumptions will require observations with higher statistics.
By matching the observed modulation in three broad energy bands, we are able to restrict the angles that the hot-spot axis and the line of sight make with respect to the spin-axis to within , up to the degeneracy between these two angles. Either the spin axis lies nearly parallel () to the line-of-sight, with the hot-spot axis at , or the hot-spot axis is nearly co-aligned with the spin-axis, but perpendicular to the line-of-sight. In the absence of a strong physical motivation to prefer one of these configurations over the other, we note that the a priori probability of the spin axis lying from the line of sight is only , while the probability that it is at is , a factor of 20 larger, although still small. We note that the specific orientations that fit the observations of PSR J08214300 are not the only ones that allow phase reversals in the two-temperature model. Rather, phase reversals are found in the majority of configurations of Figure 4.
Comparing with the other CCO pulsars, we see that PSR J1852+0040 in the SNR Kesteven 79 (Halpern & Gotthelf, 2010) also has a two-temperature X-ray spectrum, but its highly modulated pulse () is single-peaked and virtually invariant with energy. Because of this, its emitting regions are likely to be concentric, or nearly so. In the case of 1E 1207.45209 in PKS 120951/52, there are large variations in pulse phase and amplitude as a function of energy (Pavlov et al., 2002b; De Luca et al., 2004), with the largest pulsed fraction coinciding with the strong absorption lines in the unique spectrum of this pulsar. This effect may be a manifestation of angle-dependent scattering in cyclotron lines, which is the favored identification of the spectral features considering the upper limit of G on the surface dipole field from the absence of spin-down (Gotthelf & Halpern, 2007). The data on 1E 1207.45209 should be fitted with detailed atmosphere models that include quantum treatment of the cyclotron harmonics (Suleimanov et al., 2010).
Applying this model to surface thermal emission from CCOs with weak magnetic fields (anti-magnetars) is an especially apt use, in that additional complicating emission mechanisms that are evident in other classes of pulsars (see Section 5) are absent in CCOs. Such contributions include nonthermal magnetospheric emission in spin-powered pulsars, polar-cap heating from backflowing particles, and transient and variable heating from magnetic field decay in magnetars. The first two extra contributions can be significant even for recycled millisecond pulsars, which are now known to be efficient -ray emitters (Abdo et al., 2009a, b). Observations and upper limits on spin-down of CCOs indicate spin-down luminosities that are smaller than their thermal X-ray luminosities, and dipole magnetic fields of order G, remarkably small for young pulsars. These properties imply that none of the above-mentioned emission and surface heating mechanisms can be significant, and constrain the effects that may be responsible for the multiple temperatures that are a ubiquitous feature of CCO spectra, even those that have not yet been observed to pulse.
For the assumed distance to PSR J08214300 of 2.2 kpc and a radius of 12 km, the best match for the modulation fixes the extent of the hot and warm regions to angles and , representing and of the surface area, respectively. The existence of a hot spot is difficult to understand in the context of a weakly magnetized NS, as it requires a mechanism to confine the heat to such a small area. Using XMM-Newton, we obtained a new period measurement of PSR J08214300 on 2010 May 2 using the identical observational setup and analysis as described in Paper I. We obtained another measurement of the pulsations on 2010 Aug 16, from a Chandra CC-mode observation. These results will be presented in a future publication. The period is found to be unchanged from the values observed in 2001. In combination with the previous measurements listed in Paper I, this places a limit on of and, under the assumption of dipole spin-down, G, confirming PSR J08214300 as an anti-magnetar. Given the corresponding upper limit on spin-down luminosity of erg s-1, the hot-spot luminosity of erg s-1 can hardly be attributed to external heating by backflowing particles. The same problem was discussed in the context of the highly pulsed emission from PSR J1852+0040 in Kes 79 (Halpern & Gotthelf, 2010).
Possible explanations for the properties of CCOs are largely focused on magnetic field induced anisotropies in the surface temperature of a NS, as proposed by Greenstein & Hartke (1983), in which strongly enhanced conductivity in the direction parallel to the magnetic field is matched by a corresponding reduction in the perpendicular direction. The effect of the magnetic field on the heat transport of the crust and envelope of neutron stars has been investigated by a number of authors (e.g., Heyl & Hernquist, 1998, 2001; Potekhin & Yakovlev, 2001; Lai, 2001; Geppert et al., 2004, 2006; Pérez-Azorín et al., 2006a; Pons et al., 2009). While heat transport in the core ( g cm-3) is expected to be roughly isotropic due to proton superconductivity, anisotropy of heat transport becomes pronounced in the outer envelope ( g cm-3) for field strengths G, and it extends deeper into the whole crust for higher fields, G. The main question is whether subsurface fields in CCOs can be strong enough to affect heat transport to the extent required, while not exceeding the weak external dipole field as constrained by their spin-down properties.
Geppert et al. (2004) discussed the differing effects of a poloidal magnetic field in the core of the NS, versus one confined to the crust, the true configuration being a matter of uncertainty. From a core field, any surface temperature anisotropy is expected to be small, while a tangential crustal field insulates the magnetic equator and conducts heat to the magnetic poles. A tangential crustal field may be indicated for CCOs, because it can lead to small hot regions where the field emerges normal to the surface, while contributing very little to the external dipole field. Of particular interest here, Geppert et al. (2006) found that, if the crustal field consists of both a dipolar poloidal and a toroidal component, then configurations can be realized in which two warm regions of different sizes are separated by a cold equatorial belt. However, their case study included large poloidal magnetic fields, G in both core and crust components, which would tend to violate the observed spin-down limit of G for PSR J08214300.
5. Comparison with Other Pulsars
The ultimate goal of this field is to infer the equation of state and measure the radius of the NS. Some progress on these fronts has been made with high-quality data from millisecond pulsars (MSPs). Using an unmagnetized hydrogen atmosphere model fitted to the spectra and pulse profile of the nearest known MSP J04374715, Bogdanov et al. (2007) derived km (for ). Bogdanov et al. (2008, 2009) also obtained lower limits on modeling X-ray observations of MSPs J21243358 and J0030+0451. Blackbody emission was not able to fit the pulse profiles, thus requiring a NS atmosphere. Bogdanov et al. (2007) assumed an identical pair of polar caps, but fitted two temperatures to each, as required by the data, which can be understood as non-uniform heating by backflowing particles from the magnetosphere giving a concentric temperature gradient, as originally modeled by Zavlin & Pavlov (1998). Bogdanov et al. (2007) concluded that the magnetic dipole is not centered on the star, but must be offset by km to account for an asymmetry in the observed pulse profile. The data on PSR J08214300 in Puppis A are not yet of a quality to search for such effects. On the other hand, the geometrical angles () are not nearly as well constrained in the MSPs. (In the case of the binary MSP J04374715. it could be assumed that because that is the inclination angle of its binary orbit.)
Pulsed light curves of the middle-aged pulsars PSR B0656+14, B105552, and Geminga, whose X-ray spectra are dominated by surface thermal emission, have been modeled by Page (1995), Page et al. (1995), Page & Sarmiento (1996), and Perna et al. (2001). Beginning with ROSAT data, it appeared that PSR B0656+14 (Possenti et al., 1996; Greiveldinger et al., 1996), PSR B105552 (Ögleman & Finley, 1993), and Geminga (Halpern & Ruderman, 1993) had two thermal components with pulse-phase shifts of between 0.1 and 0.3 cycles, the hotter component being attributed to a heated polar cap. Follow-up observations at higher energy with ASCA found that the harder components from Geminga (Halpern & Wang, 1997) and PSR B105552 (Wang et al., 1998) are better fitted by non-thermal power laws. As beamed emission from the magnetosphere, their hard X-ray pulses need not bear a simple phase relationship to the soft thermal components. Only PSR B0656+14 continued to have two clear temperatures when observed at higher energy (Pavlov et al., 2002a), with only a weak nonthermal tail.
Detailed study of the energy-dependent pulse profiles of these primarily thermal pulsars with XMM-Newton (De Luca et al., 2005) confirm that PSR B0656+14 has two thermal components, with the hotter one interpreted as a small polar cap, shifted in phase by cycles from the softer emission. The spectrum of PSR B105552 was fitted with two temperatures and a non-thermal power law, although it is difficult to explain why the hotter blackbody component has a pulsed amplitude of . A case for a hot polar cap on Geminga was made by Caraveo et al. (2004) and De Luca et al. (2005), but Jackson & Halpern (2005), analyzing the same data, did not find it to be necessary. Such a component does not make a significant contribution to the spectrum of Geminga at any energy, and its fitted pulse profile appears to have the same phase and similar shape as the power-law component, suggesting that it is a distinction without a difference.
Despite these difficulties, the pulsed amplitudes and fitted areas of thermal X-ray emission from cooling neutron stars indicate that most have highly nonuniform surface temperatures that may be regulated by their crustal magnetic field geometry. For example, the XMM-Newton observation of the middle-aged pulsar B170644 (McGowan et al., 2003) shows an asymmetric, double-peaked pulse profile whose K spectrum is compatible with the full NS area, while having a 22% pulsed fraction. In contrast, PSR J0538+2817 appears to have only a hot polar cap of K (McGowan et al., 2004). One of the most unusual results is the apparently thermal ( K) spectrum of the high -field ( G) PSR J11196127 (Gonzalez et al., 2005), which has pulsations of amplitude that are only detected below 2 keV.
Another family of thermally emitting pulsars are the nearby, isolated neutron stars (INSs) (Haberl, 2007; Kaplan & van Kerkwijk, 2009) with periods of s, and pulsed fractions that range from 1.2% for RX J1856.63754 (Tiengo & Mereghetti, 2007) to 52% for RX J1308.6+2127 (Schwope et al., 2005). The latter authors fitted the double-peaked pulse profile of RX J1308.6+2127 to a model of two small spots with temperatures of eV and eV separated by in phase. Timing measurements have revealed that these INSs have somewhat larger dipole magnetic fields than most young pulsars, with G (Kaplan & van Kerkwijk, 2009), and may be significantly heated by continuing magnetic field decay (Pons et al., 2009). In this sense, they may be the year old descendants of magnetars. Several of their spectra have very broad absorption features that have been interpreted as ion cyclotron lines or, in the case of multiple features, possibly atomic lines (Haberl 2007; Schwope et al. 2007). One of the best studied objects of this class, RX J0720.43125, shows a pulse phase shift of between soft and hard X-rays (Cropper et al., 2001), which suggests that there could be two spots of different temperatures. However, this interpretation is complicated by long-term (years) changes in the shape of the spectrum and pulse profile (de Vries et al., 2004; Hohle et al., 2009), which lends support to the idea that, similar to the case of magnetars, localized and variable heating by magnetic field decay is responsible for relatively short-lived surface thermal structure. This is evidently the case for the transient magnetar XTE J1810197, whose declining hot spot temperatures and areas were modeled by Gotthelf & Halpern (2005, 2007), Bernardini et al. (2009), Albano et al. (2009), and by Perna & Gotthelf (2008), who used a similar treatment as that presented herein.
Pérez-Azorín et al. (2006b), Zane & Turolla (2006) and Zane (2007) investigated models for INSs involving a combination of star-centered dipole and quadrupole magnetic field components to explain their asymmetric pulse profiles. The properties of PSR J08214300 in Puppis A may ultimately be ascribed to these same effects, but in a simpler system that is not variable in time.
6. Conclusions
We modeled the XMM-Newton spectra and pulsed light curve of PSR J08214300 in Puppis A, one of three CCO pulsars whose dipole magnetic field strengths are measured to be less than those of all spin-powered pulsars of similar age ( G in the case of PSR J08214300). The sizes and configurations of the surface hot and warm spots on PSR J08214300 are particularly well constrained. The two emitting areas differ by a factor of 2 in temperature and 20 in area, which conveniently endows them with similar luminosities that fall in the XMM-Newton bandpass. The phase reversal between the soft and hard X-ray pulse profiles reveals the antipodal geometry. It is especially significant that the X-ray spectra and pulse profiles of CCOs indicate considerably nonuniform surface temperatures. Many of the mechanisms that are held responsible for such effects in other classes of NSs are not expected to be operating in these anti-magnetars, which appear to be simple cooling neutron stars whose conduction of heat from the interior is highly anisotropic. The essential problem in understanding CCOs is to explain how this is accomplished without creating a strong external dipole magnetic field. Our tentative hypothesis is that even CCOs have strong tangential fields buried in the crust that channel heat toward the magnetic poles, or external quadupole fields. But what is the geometry of that magnetic field? Although the orientation of the hot spots in PSR J08214300 is determined to within , the degeneracy of the model does not allow us to decide if the axis of the hot spots is nearly aligned with the NS spin axis or nearly perpendicular to it. Geometrical probability, as well as the observation of larger pulsed fractions in other NSs, would suggest the latter. The actual geometry is probably fixed during the genesis of magnetic fields in these young NSs, which, in the case of CCOs, have not spun down since their birth and are likely to have preserved the natal -field configuration.
References
- Abdo et al. (2009a) Abdo, A. A., et al. 2009a, Science, 325, 848
- Abdo et al. (2009b) Abdo, A. A., et al. 2009b, ApJ, 699, 1171
- Albano et al. (2009) Albano, A., Turolla, R., Israel, G. L., Zane, S., Nobili, L., Stella, L. 2010, in press (arXiv:1007.5466)
- Arnaud (1996) Arnaud, K. A. 1996, in ASP Conf. Ser. 101, Astronomical Data Analysis Software and Systems V, ed. G. H. Jacoby & J. Barnes (San Francisco, CA: ASP), 17
- Beloborodov (2002) Beloborodov, A. M. 2002, ApJ. 566, L85
- Bernardini et al. (2009) Bernardini et al. 2009, A&A, 498, 195
- Bignami et al. (2003) Bignami, G. F., Caraveo, P. A., De Luca, A., & Mereghetti, S. 2003 Nature, 423, 725
- Bogdanov et al. (2009) Bogdanov, S., & Grindlay, J. E. 2009, ApJ, 703, 1557
- Bogdanov et al. (2008) Bogdanov, S., Grindlay, J. E., & Rybicki, G. B. 2008, ApJ, 689, 407
- Bogdanov et al. (2007) Bogdanov, S., Rybicki, G. B., & Grindlay, J. E. 2007, ApJ, 670, 668
- Caraveo et al. (2004) Caraveo, P. A., De Luca, A., Mereghetti, S., Pellizzoni, A., & Bignami, G. F. 2004, Science, 305, 376
- Cropper et al. (2001) Cropper, M., Zane, S., Ramsay, G., Haberl, F., & Motch, C. 2001, A&A, 365, L302
- de Vries et al. (2004) de Vries, C. P., Vink, J., Méndez, M., & Verbunt, F. 2004, A&A, 415, L31
- De Luca (2008) De Luca, A. 2008, in AIP Conf. Proc. 983, 40 Years of Pulsars: Millisecond Pulsars, Magnetars, and More, ed C. Bassa et al. (Melville, NY: AIP), 311
- De Luca et al. (2005) De Luca, A., Caraveo, P. A., Mereghetti, S., Negroni, M., & Bignami, G. F. 2005, ApJ, 623, 1051
- De Luca et al. (2004) De Luca, A., Mereghetti, S., Caraveo, P. A., Moroni, M., Mignani, R. P., & Bignami, G. F. 2004, A&A, 418, 625
- Geppert et al. (2004) Geppert, U., Küker, M., & Page, D. 2004, A&A, 426, 267
- Geppert et al. (2006) Geppert, U., Küker, M., & Page, D. 2006, A&A, 457, 937
- Gonzalez et al. (2005) Gonzalez, M. E., Kaspi, V. E., Camilo, F., Gaensler, B. M., & Pivovaroff, M. J. 2005, ApJ, 630, 489
- Gotthelf & Halpern (2005) Gotthelf, E. V. & Halpern, J. P. 2005, ApJ, 632, 1075
- Gotthelf & Halpern (2007) Gotthelf, E. V. & Halpern, J. P. 2007, ApJ, 664, L35
- Gotthelf & Halpern (2008) Gotthelf, E. V. & Halpern, J. P. 2008, in AIP Conf. Proc. 983, 40 Years of Pulsars: Millisecond Pulsars, Magnetars, and More, ed C. Bassa et al. (Melville, NY: AIP), 320
- Gotthelf & Halpern (2009) Gotthelf, E. V. & Halpern, J. P. 2009, ApJ, 695, L35 (Paper I)
- Greenstein & Hartke (1983) Greenstein, G., & Hartke, G. J. 1983, ApJ, 271, 283
- Greiveldinger et al. (1996) Greiveldinger, C., et al. 1996, ApJ, 465, L35
- Haberl (2007) Haberl, F. 2007, Ap&SS, 308, 181
- Halpern & Gotthelf (2010) Halpern, J. P., & Gotthelf, E. V. 2010, ApJ, 709, 436
- Halpern & Ruderman (1993) Halpern, J. P., & Ruderman, M. 1993, ApJ, 415, 286
- Halpern & Wang (1997) Halpern, J. P., & Wang, F. Y.-H. 1997, ApJ, 477, 905
- Heyl & Hernquist (1998) Heyl, J. S., & Hernquist, L. 1998, MNRAS, 300, 599
- Heyl & Hernquist (2001) Heyl, J. S., & Hernquist, L. 2001, MNRAS, 324, 292
- Hohle et al. (2009) Hohle, M. M., Haberl, F., Vink, J., Turolla, R., Hambaryan, V., Zane, S., de Vries, C. P., & Méndez, M. 2009, A&A, 498, 811
- Hwang et al. (2008) Hwang, U., Petre, R., & Flanagan, K. A. 2008, ApJ, 676, 378
- Jackson & Halpern (2005) Jackson, M. S., & Halpern, J. P. 2005, ApJ, 633, 1114
- Kaplan & van Kerkwijk (2009) Kaplan, D. L., & van Kerkwijk, M. H. 2009, ApJ, 705, 798
- Katsuda et al. (2010) Katsuda, S., Hwang, U., Petre, R., Park, S., Mori, K., & Tsunemi, H. 2010, ApJ, 714, 1725
- Lai (2001) Lai, D. 2001, Rev. Mod. Phys., 73, 629
- McGowan et al. (2003) McGowan, K. E., Kennea, J. A., Zane, S., Córdova, F. A., Cropper, M., Ho, C., Sasseen, T., & Vestrand, W. T. 2003, ApJ, 591, 390
- McGowan et al. (2004) McGowan, K. E., Zane, S., Cropper, M., Kennea, J. A., Córdova, F. A., Ho, C., Sasseen, T., & Vestrand, W. T. 2004, ApJ, 600, 343
- Ögleman & Finley (1993) Ögelman, H., & Finley, J. P. 1993, ApJ, 413, L31
- Page (1995) Page, D. 1995, ApJ, 442, 273
- Page & Sarmiento (1996) Page, D., & Sarmiento, A. 1996, ApJ, 473, 1067
- Page et al. (1995) Page, D., Shibanov, Yu A., & Zavlin, V. E. 1995, ApJ, 451. L21
- Pavlov et al. (2004) Pavlov, G. G., Sanwal, D., & Teter, M. A. 2004, in Young Neutron Stars and their Environment, IAU Symp. 218, ed. F. Camilo & B. M. Gaensler (San Francisco: ASP), 239
- Pavlov et al. (1994) Pavlov, G. G., Shibanov, Yu A., Ventura, J., & Zavlin, V. E. 1994, ApJ, 289, 837
- Pavlov et al. (2002a) Pavlov, G. G., Zavlin, V. E., & Sanwal, D. 2002a, in Proc. 270th WE-Heraeus Seminar on Neutron Stars, Pulsars and Supernova Remnants, MPE Rep. 278, ed. W. Becker, H. Lesch, & J. Trümper (Garching: MPE), 273
- Pavlov et al. (2002b) Pavlov, G. G., Zavlin, Sanwal, D., & Trümper, J. 2002b, ApJ, 569, L95
- Pechenick et al. (1983) Pechenick, K. R., Ftaclas, C., & Cohen, J. M. 1983, ApJ, 274, 846
- Pérez-Azorín et al. (2006a) Pérez-Azorín, J. F., Miralles, J. A., Pons, J. A. 2006a, A&A, 451, 1009
- Pérez-Azorín et al. (2006b) Pérez-Azorín, J. F., Pons, J. A., Miralles, J. A., & Miniutti, G. 2006b, A&A, 459, 175
- Perna & Gotthelf (2008) Perna, R., & Gotthelf, E. G. 2008 ApJ, 681, 522
- Perna et al. (2001) Perna, R., Heyl, J., & Hernquist, L. 2001 ApJ, 553, 809
- Pons et al. (2009) Pons, J. A., Miralles, J. A., & Geppert, U. 2009, A&A, 496, 207
- Possenti et al. (1996) Possenti, A., Mereghetti, S., & Colpi, M. 1996, A&A, 313, 565
- Potekhin & Yakovlev (2001) Potekhin, A. Y., & Yakovlev, D. G. 2001 A&A, 374, 213
- Reynoso et al. (1995) Reynoso, E. M., Dubner, G. M., Gross, W. M., & Arnal, E .M. 1995, AJ, 110, 318
- Schwope et al. (2005) Schwope, A. D., Hambaryan, V., Haberl, F., & Motch, C. 2005, A&A, 441, 597
- Schwope et al. (2007) Schwope, A. D., et al., 2007, Ap&SS, 308, 619
- Suleimanov et al. (2010) Suleimanov, V. E., Pavlov, G. G., & Werner, K. 2010, ApJ, 714, 635
- Tiengo & Mereghetti (2007) Tiengo, A., & Mereghetti, S. 2007, ApJ, 657, 101
- Wang et al. (1998) Wang, F. Y.-H., Ruderman, M., Halpern, J. P., & Zhu, T. 1998, ApJ, 498, 373
- Winkler & Petre (2007) Winkler, P. F., & Petre, R. 2007, ApJ, 670, 635
- Winkler et al. (1988) Winkler, P. F., Tuttle, J. H., Kirshner, R. P., & Irwin, M. J. 1988, in IAU Colloq. 101, Supernova Remnants and the Interstellar Medium, 65
- Zane (2007) Zane, S. 2007, Ap&SS, 308, 259
- Zane & Turolla (2006) Zane, S., & Turolla, R. 2006, MNRAS, 366, 727
- Zavlin & Pavlov (1998) Zavlin, V. E., & Pavlov, G. G. 1998, A&A, 329, 583