NetReAct: Interactive Learning for Network Summarization
Abstract
Generating useful network summaries is a challenging and important problem with several applications like sensemaking, visualization, and compression. However, most of the current work in this space do not take human feedback into account while generating summaries. Consider an intelligence analysis scenario, where the analyst is exploring a similarity network between documents. The analyst can express her agreement/disagreement with the visualization of the network summary via iterative feedback, e.g. closing or moving documents (“nodes”) together. How can we use this feedback to improve the network summary quality? In this paper, we present NetReAct, a novel interactive network summarization algorithm which supports the visualization of networks induced by text corpora to perform sensemaking. NetReAct incorporates human feedback with reinforcement learning to summarize and visualize document networks. Using scenarios from two datasets, we show how NetReAct is successful in generating high-quality summaries and visualizations that reveal hidden patterns better than other non-trivial baselines.
1 Introduction
Networks occur in various domains such as social networks, entity networks, communication networks, population contact networks, and more. A meaningful summary of these networks can help users with various downstream tasks like sensemaking, compression, and visualization [1, 2, 10, 11]. However, most prior work focus on generating summaries without human input [9, 10]. In contrast, there are several applications, especially exploratory tasks, where incorporating human feedback in the summarization process is essential for generating useful summaries. For example, consider intelligence analysis [3], which often involves making sense of networks of unstructured documents (like field reports) and extracting hidden information (like a terrorist plot) from a small subset of documents in the corpus. Users can provide feedback by interacting directly with the data, providing semantic interactions [5] such as moving two nodes (documents) closer to each other to express similarity. This feedback helps the system to determine the relative importance of other documents with respect to the interests of the user.
Motivated by above, in this paper we tackle the novel problem of learning to generate interactive network summaries that incorporate user feedback. We showcase the usefulness of our summaries by focusing on an exploratory document visualization task. We leverage our summary to generate network visualizations, with the goal of aiding in investigating document networks and supporting the human sensemaking process; i.e., help the users “connect the dots” across different documents and discover the hidden stories behind them. More specifically, we try to answer: Given a document corpus represented as a network, can we learn a model that incorporates user feedback alongside the objectives of the analysis task to generate high quality summary? Additionally, can we then leverage the summary to generate a meaningful visualization, and can such a model be re-applied to other document corpora? Towards solving this problem, we face two major challenges. The first is simplicity of feedback. Generally, the users are not experts in the summarization/visualization models and can only provide high-level semantic interactions. The second challenge is sparsity and inconsistency of human feedback. Getting human feedback is a slow and expensive process as the user needs to understand both the data and task in hand. As a result, the feedback is sparse.
Here the network data structure represents a document corpus. Each node in the network represents a document, and edge weights indicate the similarity between the documents based on their word usage. Our goal is to generate a summary network by grouping similar nodes (i.e., relevant documents together) and finding hierarchical “super-nodes” (representing collection of documents) and “super-edges” (representing similarities between groups of documents). We then visualize this network summary to produce a high-level understanding of the entire corpus and highlight hidden patterns. We will discuss the concepts of super-nodes and super-edges later in detail.
Our main idea is to tackle the above challenges via a reinforcement learning (RL) approach [15] to summarize networks. We believe RL is especially suited for this problem, as it makes it possible to re-apply the learned model in similar scenarios to reduce the necessary amount of human feedback to gain useful information. We design NetReAct, a feedback-based RL algorithm which integrates user interests with the objective of the summarization. NetReAct also provides a multi-level understanding of the data by generating summaries of various sizes, enabling the user to zoom in to each document group to view these different summaries.
The main contributions of this paper are: {itemize*}
Incorporating human feedback. We introduce NetReAct, a novel approach which leverages feedback-based reinforcement learning to principally incorporate human feedback to generate meaningful network summaries.
Meaningful relationships between groups as a summary network. NetReAct not only groups relevant nodes into super-nodes, but it also defines relationships between super-nodes. The weight of the edges in the summary network by NetReAct represent the similarity between groups.
Multi-scale visualization. We leveraged NetReAct to develop a multi-scale, interactive document network visualization framework. This visualization groups documents to summarize the network hierarchically, which makes it possible for the user to get a multilevel understanding of the document network by looking at the summaries on different levels.
2 Proposed Method
In this paper, we focus on document network summarization to support visualization. Visualizing a document network helps users in their sensemaking process and understanding the documents, providing a two-dimensional illustration of the entire network and highlighting hidden patterns. Learning from the user is essential in designing an intelligent visualization framework that reflects the user’s interests. Moreover, leveraging user feedback in the summarization helps to visualize data more effectively and efficiently than unsupervised approaches. Using supervised approaches are also not realistic in many real-world applications, particularly when the analyst is not an expert.
We ground our work using a state-of-the-art systems for interactive document network visualization, StarSPIRE [3]. This system treats the document network as an attributed network, where each attribute is the frequency of a particular term in the document. It then builds a multilevel model of user interests based on the user’s semantic interactions. In the StarSPIRE framework, a user can interact with the system through semantic interactions such as minimizing documents, closing documents, annotating a document, highlight text within a document, and overlapping two documents. From these interactions, the models infer the importance of each attribute and then calculate the similarity between each pair of documents (nodes) based on weighted attribute similarity. However, since the number of unique terms is very high, the attributes are high-dimensional, and thus generating optimal weights requires a significant number of interactions.
In NetReAct, we summarize document networks into explicit groups of related documents, demonstrating the relationship between groups in order to both generate a high-quality visualization for sensemaking tasks and to detect underlying stories hidden within the corpus. We design NetReAct to make it possible to incorporate semantic interaction feedback with network summarization, using that user guidance to generate a visualization of a document corpus. A “good” document network summary leads to a high-quality visualization, which helps a user to identify and read related documents and make sense of them quickly. More specifically, in a good network summary, each super-node (i.e., group) contains documents that are most relevant to each other according to the user’s interest. Further, the structure of the network summary indicates the relationship between groups, which guides the user on how to navigate through different groups. Given such a summary, we first can visualize the summary network. After this, we can expand the super-nodes that the user is interested in to suggest the most relevant documents. If the user wants to investigate more documents, we can then expand the closest (most similar) super-nodes to suggest another group of relevant documents.
2.1 User Feedback
We observed several users completing a sensemaking task using the StarSPIRE framework, and based on their behavior we selected a subset of the supported semantic interactions for generating user feedback. We divide such interactions into positive and negative feedback (see Table 1). For example, positive feedback can indicate the user’s intention to put two documents close to each other (i.e., group two nodes together), while negative feedback means they should be far from each other. Overlapping two documents indicates that the user agrees to display them close to each other. On the other hand, minimizing a document while reading another one is a sign of the disagreement with the visualization. This local feedback is then applied to the entire visualization and corpus. Such feedback is sparse, as the user cannot evaluate all documents and every aspect of the visualization.
| Feedback Type | Semantic Interaction |
|---|---|
| Negative feedback | (1) Minimizing document, (2) Closing document |
| Positive feedback | (1) Annotation, (2) Highlighting document, (3) Overlapping document |
2.2 Interactive Summarization Model
In this section, we describe an interactive network summarization framework to incorporate the user feedback and address its sparsity. Note that our goal is also to learn the steps to be taken for the summarization process so that the same approach can be re-applied on other document corpora with similar characteristics.
Network Construction. We start by converting the given document corpus into a network , where nodes () represent documents and edges () and their weights () represent document similarity. We define the weight to be the cosine similarity between the corresponding TF-IDF vectors of the documents. Note that is a complete-graph of size .
Network Summarization. Once the network is constructed, the summarization process begins. The goal is to generate a smaller network from the original network such that nodes representing similar/relevant documents in are grouped into a single node (a “super-node”) in . Nodes in therefore represent a group of documents. We call a “summary network,” where super-nodes () are the groups of related documents and super-edges (), and their weights () represent the average similarity between group of documents represented by the two endpoints. We obtain via a series of “assign” operations on . The “assign” operation assigns nodes to their super-nodes. This operation partitions the original network and groups each partition to form a super-node in the summary network . Next, we must determine how to partition the original network in a meaningful manner. In other words, how to decide between two partitions of , and how to measure the quality of each assigning operation and network summary?
Reinforcement Learning (RL) is a natural fit to answer the question above, as we can view our problem as taking actions (assigning nodes to a super-node) to maximize the reward (the final quality of grouping of documents). The next step in our summarization process is to formalize the RL framework for our task.
2.2.1 Interactive Reinforcement Learning Formulation
We use Q-learning, as it is known to be more sample efficient than policy gradient methods [15]. Each RL framework has five main components: states, actions, transition function, reward, and policy. We further add an additional feedback component as we design an interactive RL formulation. Brief descriptions of each follow.
1. State: The state is the sequence of actions which assign nodes to different super-nodes. We use the embedding , in to represent the states in a vector of n-dimensional space.
2. Action: An action at state selects a document , assigns it to a new super-node , and transfers it to the next state .
3. Transition: We assume the transition function is deterministic and corresponds to the action of assigning a document to a new super-node – i.e., .
4. Rewards: We define the reward to be for a state , unless it is a terminal state. A terminal state in our case is a state which satisfies all of the positive and negative feedback of the user. Intuitively the reward of encourages the learner to satisfy the user feedback faster. Formally, we define our reward function as follows:
| (1) |
Here, is the adjacency matrix of the document graph , is the diagonal matrix of node degrees, and is an indicator vector for super-node , i.e., if a node belongs to super-node , zero otherwise. In Eq. 1, we compute , which measures the quality of the document groups. By maximizing , we maximize the quality of document groups [16].
5. Feedback We assume a case that the user is interacting with the system until she is happy with the visualization, a process of incrementally formalizing the space [12]. This means that we must learn the model until all the feedback from the user is satisfied. The feedback is in the form of positive and negative interactions (See Tab. 1). The user can indicate if she agrees to group a pair of documents (i.e., positive feedback) or disagrees with it (i.e., negative feedback). We represent the feedback with two graphs, which we call feedback graphs. A positive feedback graph is created from the set of positive feedback, i.e., the edges in are pair of related documents that the user indicated. Similarly, the negative feedback graph is created from the set of negative feedback.
To satisfy all the feedback, we must group all positive feedback node pairs in the same super-nodes and all negative feedback node pairs in different super-nodes. These constraints can be stated using the positive and negative feedback graphs and as follows:
| (2) |
Here, is a super-node, is the number of super-nodes, and is the adjacency matrix of . In the real world, we do not expect the user to provide all possible feedback, as this would essentially provide the desired summary without computational assistance. Rather, the provided feedback are sparse, especially when the task is exploratory in nature. To handle such problems, we combine the reward in Eq. 1 with feedback (Eq. 2). Thus, our goal is to achieve a summary that satisfies all feedback and maximizes the reward.
6. Policy: The policy function specifies what action to take at a given state. It is defined as , where is the Q-value of the state and action that estimates the expected cumulative reward achieved after taking action at state . Our goal is to learn an optimal Q-value function resulting in the highest cumulative reward. We leverage the Q-learning, which iteratively updates until convergence [13].
2.2.2 Q-learning
Our pipeline learns the best super-node for each node in the document graph such that its corresponding summary graph gives a high-quality visualization and is generalizable to similar unseen document corpora. We use Q-learning to learn the pipeline. First, we define how to estimate the Q-value of a state and action , . We define the Q-value of a state and action as the expected rewards in the future as follows,
| (3) |
Our aim is to find the maximum cumulative reward achievable with state and action : . We estimate iteratively using the Bellman equation:
| (4) |
We use a Fully Connected (FC) neural network to embed each state and get a compact representation of it. We combine the embedding layer with the estimator to have an end-to-end framework to summarize the document network.
In our framework, the input state is fed into the FC neural network. The output of this step is a compact representation of the state, which is then fed into another FC that decides how to update the super-nodes. Alg. 1 presents an overview of our summarization algorithm.
2.2.3 Hierarchical Summaries
Our goal is not only to summarize the network but also to provide a multi-level understanding of the structure. This is specially useful in large networks, where it is challenging to meaningfully and efficiently generate the best summary. Hence, we propose a hierarchical approach, where we intuitively, zoom out one “level” at a time to generate summaries with different sizes. Specifically, in each step NetReAct tries to partition the data into two super-nodes, and then iteratively summarizes each part until reaching a summary with the desired size.
2.2.4 Generate Summaries
After learning the best super-nodes of the network, we merge nodes in the same super-nodes to generate a corresponding super-node. We also connect each super-node to others by super-edges. The weight of the super-edge from to is the average similarity between documents in to . More formally, we define the merge operation as follows,
Definition 1
Merge operation merges nodes , , …, into a new node , such that . We add new edge for all the nodes with weight .
We merge nodes in the same super-node using Def. 1 to yield the summary document network , where .
2.3 Two-step Visualization
Once the summary is generated, our goal is to visualize the document network. We design a multilevel framework that first leverages the weighted force-directed layout [4] to visualize the summary graph. This gives us a 2D layout of the summary network, which we treat as the “backbone” of our visualization process. Note that each super-node consists of a group of nodes, which induce sub-graphs in the original network. We separately run the weighted force-directed layout on each sub-graph induced by the super-nodes. Finally, we “combine” the layouts within each super-node with the backbone layout of the entire summary network in a multi-level fashion to visualize with entire network. Lines 3-7 of Alg. 2 show the pseudocode of this two-step visualization approach.
3 Empirical Studies
We used Python and PyTorch to implement all steps of NetReAct and NetReAct-Viz, and our code is publicly available for academic and research purposes111http://bit.ly/2MJzpWy. We explore the effectiveness of NetReAct and NetReAct-Viz on two document network datasets: Crescent [8] is a document corpus containing synthetic intelligence reports related to terrorist activities, and the VAST 2007 Challenge dataset (“Blue Iguanodon”) [7] contains documents regarding wildlife law enforcement subplots. We compare performance of NetReAct against several baselines including Spectral [14], Community-Det [6], CoarseNet [10] and Metric-Learning [17] based approaches.
3.1 Quality of Summaries
Here, we demonstrate that NetReAct generates high quality network summaries by both grouping relevant nodes in the same super-node and satisfying the constraints posed by users as feedback. In this section, we focus on quantitative results.
We measure the quality of the summary by quantifying the ease of identifying relevant documents. To that end, we measure the purity of super-nodes that contain relevant documents. In other words, we calculate the average probability of observing a relevant document in a super-node that contains at least one relevant document. Formally,
| (5) |
where is the set of super-nodes that have at least one relevant document to the scenario, is a super-node in the set and is the probability that a document is relevant to the hidden scenario in . Intuitively, if the value of is closer to one, it means the user can easily find relevant documents in a selected super-node.
We investigate the quality of summary networks generated by NetReAct using Crescent and three subplots of VAST 2007 datasets with 2, 4, 8, and 16 super-nodes and calculate their values (Eq. 5). In addition, we compare the quality of NetReAct with baselines. Figs. 1 and 2 show the quality of summary networks with various numbers of super-nodes. For each experiment, we randomly selected positive and negative feedback from the ground-truth (see Sec. 2.1). More specifically, we randomly choose a few pairs of nodes that are relevant to the hidden story as positive feedback and similarly pick pairs in which only one of them is relevant as negative feedback. In all experiments, we fixed the amount of positive and negative feedback at of all possible positive feedback and of all possible negative feedback.
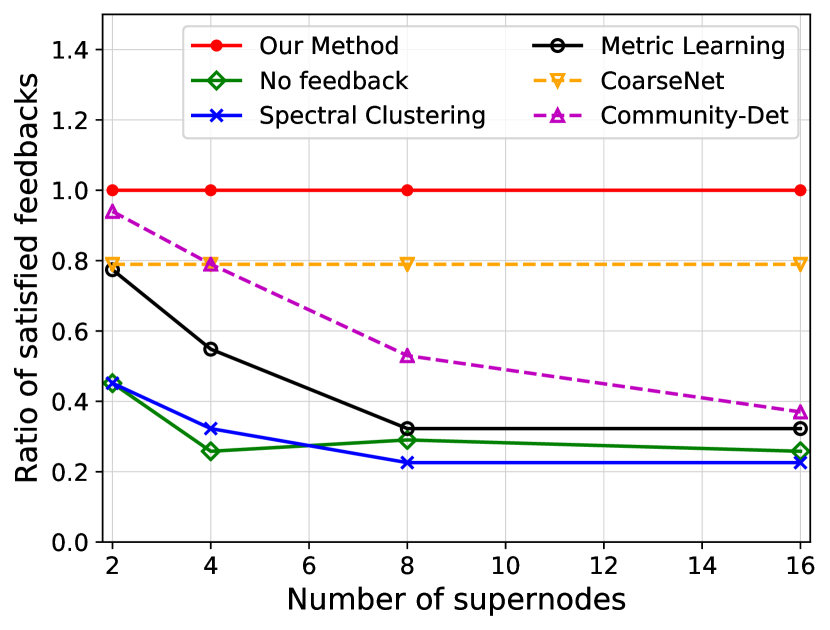
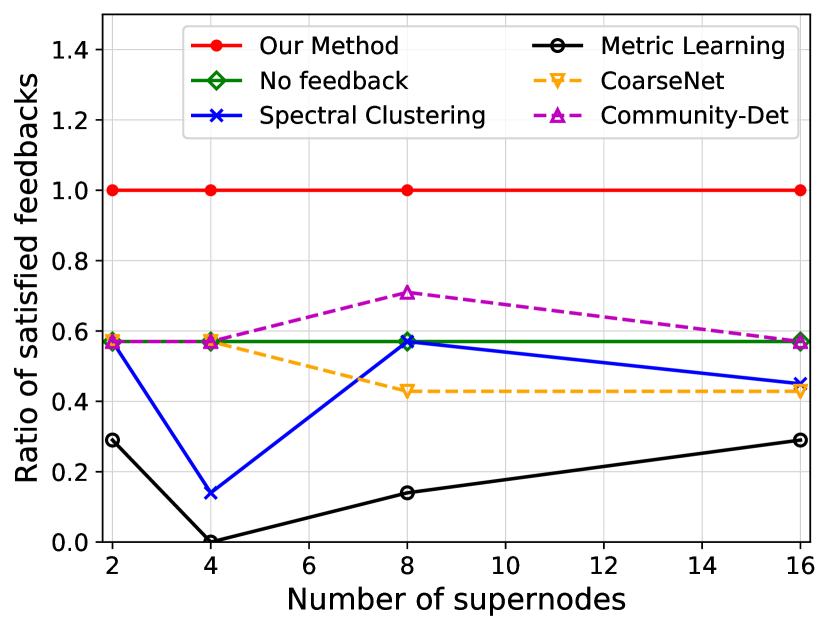
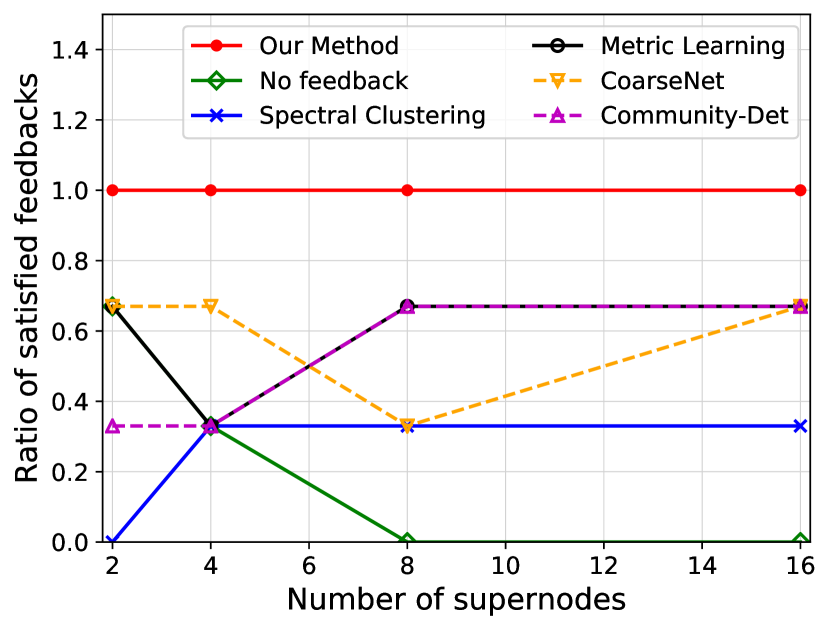
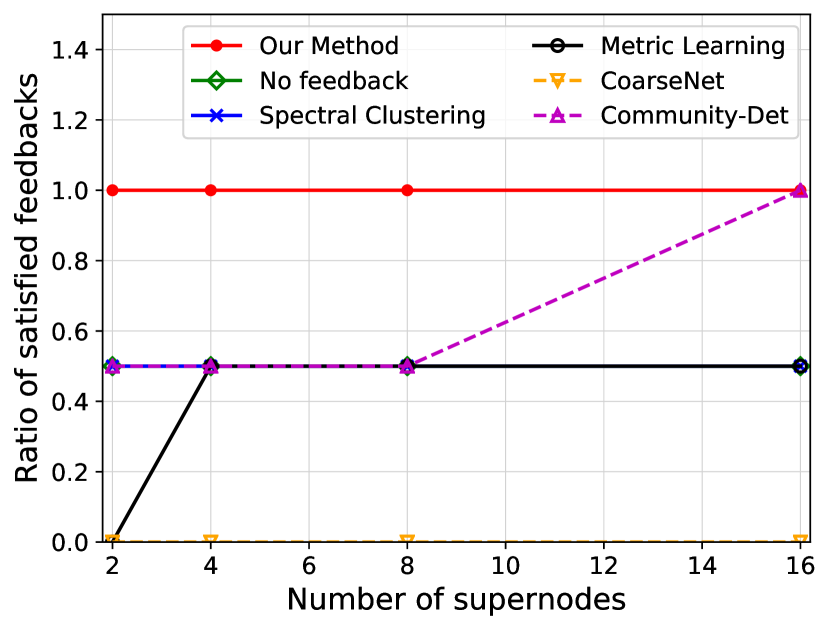
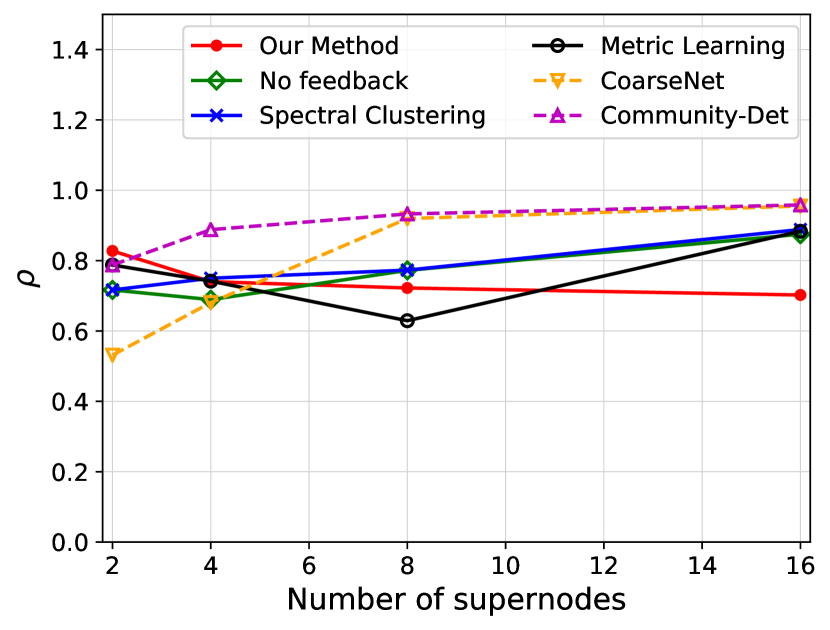
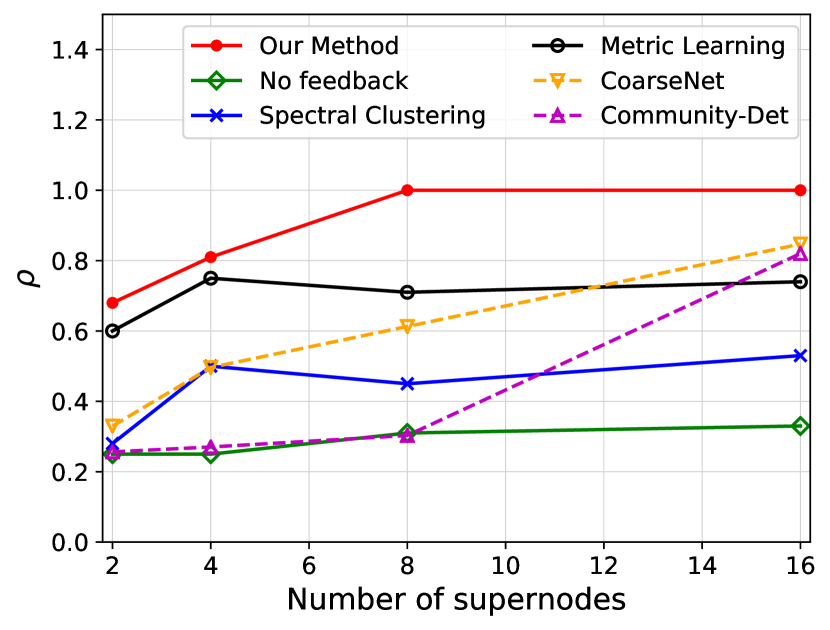
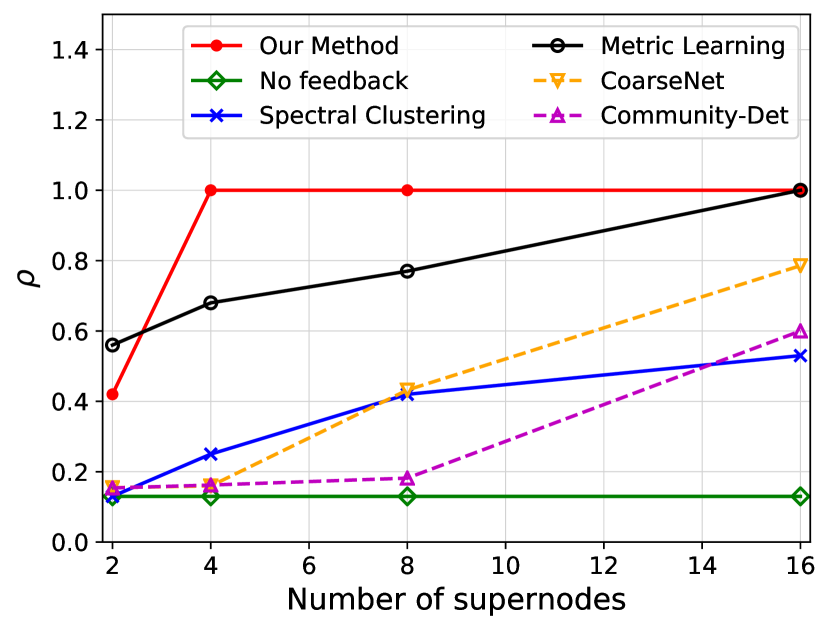
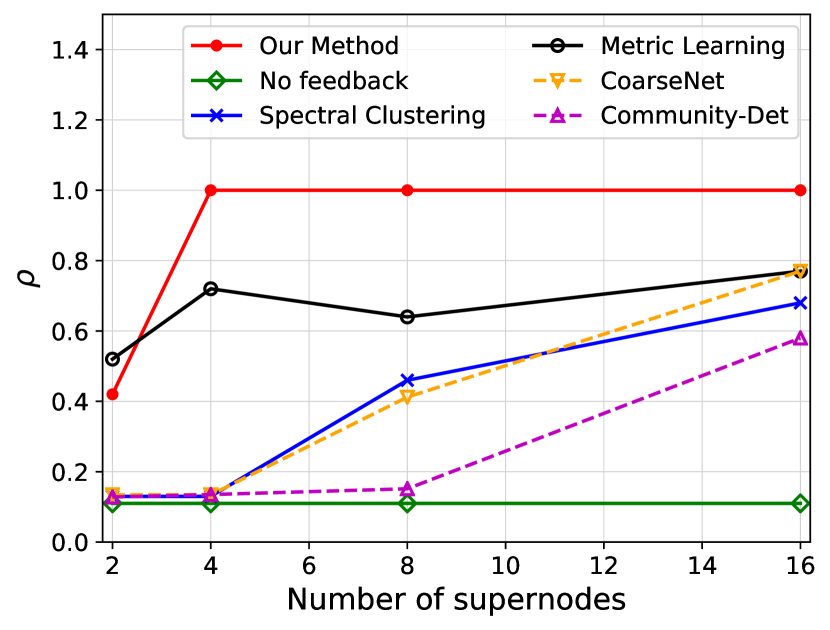
Fig. 1 shows the ratio of satisfied feedback. The results indicate that NetReAct generates the highest-quality summary that matches the interests of the user, as it satisfies all of the user’s feedback while other baselines can only satisfy part of the feedback. Fig. 2 shows the quality of summaries . NetReAct generates high-quality summaries (i.e highest ) networks for various sizes. This implies that users can easily find the relevant documents to scenarios while interacting with visualization generated using NetReAct-Viz. It is interesting to mention that because feedback is sparse and the TF-IDF vectors are high-dimensional, the Metric-Learning approach is not able to learn proper weights and does not perform well in some cases. Similarly, the poor performance of other graph summarization approaches is explained by the fact that they do not consider user feedback.
3.2 Q2. Effect of Feedback
We investigate how NetReAct evolves the summary of a document network while the user gives positive and negative feedback. We also objectively measure the change in quality of super-nodes based on the feedback by tracking the changes in . Similar to Sec. 3.1, feedback is randomly generated from the ground-truth.
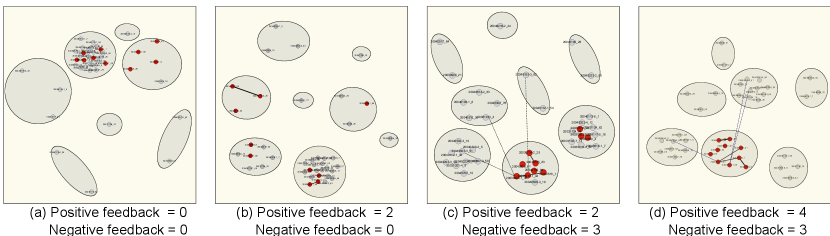
To showcase the quality of NetReAct on the VAST 2007 dataset, for each subplot we extract a subset of documents relevant to the subplot. Fig. 3 shows the visualization of the Chinchilla Bio-terror subplot. We depict positive feedback as solid black lines between documents and negative feedback as dashed lines. Initially our method can only identify four of the related documents with the subplot and puts them in a super-node. However, the rest of the relevant documents are mixed with other irrelevant ones in the largest super-node of the summary network. Next, the user gives feedback regarding the similarity of two pairs of documents. NetReAct updates the visualization (Fig. 3(b)). However, this is not enough to improve the quality. When the user adds the negative feedback, NetReAct can distinguish more relevant documents (Fig. 3(c)). Finally, by giving two more positive feedback interactions, NetReAct can accurately identify the relevant documents with the subplots and puts them in a separate super-node (Fig. 3(d)).
4 Conclusions and Discussion
In this paper, we explored the problem of learning interactive network summaries with an application of generating multi-level and generalizable visualization models for text analysis. We proposed a novel and effective network summarization algorithm, NetReAct, which leverages a feedback-based reinforcement learning approach to incorporate human input. We also proposed NetReAct-Viz as a framework to produce a visualization based on hierarchical network summaries generated by NetReAct. Our experiments show that NetReAct is able to summarize and NetReAct-Viz is able visualize a document network meaningfully to reveal hidden stories in the corpus and connect the dots between documents.
As NetReAct relies on Q-learning, it can be made faster, which is also a promising direction for future work. As shown by our experiments, it already works well on real document networks and solves real tasks in practice. In the future, we plan to apply this interactive network summarization model to much larger document datasets and temporal data scenarios. Moreover, the flexibility we obtain from the reinforcement learning approach makes it possible to bring learning into summarization and enable better generalization and personalization. For example, we can build a personalized interactive summarization model for each user to reflect their interests and quickly summarize different datasets without requiring user input for each new corpus.
Network summarization can lead to other meaningful visualizations by incorporating more diverse semantic interactions into the reinforcement learning approach. For example, we would like to explore how to differentiate between highlighting, overlapping, and annotating documents in our framework. Also, leveraging more visual encodings to create a more understandable and user-friendly summarization is a fruitful direction. We can explore using our approach for summarizing and visualizing other data types such as social networks and images as well. Our approach here opens several additional interesting avenues for future work.
Acknowledgements This paper is based on work partially supported by the NSF (Expeditions CCF-1918770, CAREER IIS-2028586, RAPID IIS-2027862, Medium IIS-1955883, NRT DGE-1545362), NEH (HG-229283-15), CDC MInD program, ORNL, funds/computing resources from Georgia Tech and a Facebook faculty gift.
References
- [1] B. Adhikari, Y. Zhang, S. E. Amiri, A. Bharadwaj, and B. A. Prakash. Propagation-based temporal network summarization. IEEE Transactions on Knowledge and Data Engineering, 30(4):729–742, 2018.
- [2] S. E. Amiri, L. Chen, and B. A. Prakash. Efficiently summarizing attributed diffusion networks. Data Mining and Knowledge Discovery, 32(5):1251–1274, 2018.
- [3] L. Bradel, C. North, L. House, and S. Leman. Multi-model semantic interaction for text analytics. In 2014 IEEE Conference on Visual Analytics Science and Technology, VAST 2014, Paris, France, October 25-31, 2014, pages 163–172, 2014.
- [4] T. Dwyer and Y. Koren. Dig-cola: directed graph layout through constrained energy minimization. In INFOVIS. IEEE, 2005.
- [5] A. Endert, P. Fiaux, and C. North. Semantic interaction for sensemaking: Inferring analytical reasoning for model steering. IEEE Trans. Vis. Comput. Graph., 18(12):2879–2888, 2012.
- [6] M. Girvan and M. E. Newman. Community structure in social and biological networks. Proceedings of the national academy of sciences, 99(12):7821–7826, 2002.
- [7] G. Grinstein, C. Plaisant, S. Laskowski, T. O’Connell, J. Scholtz, and M. Whiting. Vast 2007 contest-blue iguanodon. In 2007 IEEE Symposium on Visual Analytics Science and Technology, pages 231–232. IEEE, 2007.
- [8] F. Hughes and D. Schum. Discovery-proof-choice, the art and science of the process of intelligence analysis-preparing for the future of intelligence analysis. Joint Military Intelligence College, Washington, DC., 2003.
- [9] G. Karypis and V. Kumar. Multilevel algorithms for multi-constraint graph partitioning. In Supercomputing, 1998. SC98. IEEE/ACM Conference on, pages 28–28. IEEE, 1998.
- [10] M. Purohit, B. A. Prakash, C. Kang, Y. Zhang, and V. Subrahmanian. Fast influence-based coarsening for large networks. In Proceedings of the 20th ACM SIGKDD international conference on Knowledge discovery and data mining, pages 1296–1305. ACM, 2014.
- [11] N. Shah, D. Koutra, T. Zou, B. Gallagher, and C. Faloutsos. Timecrunch: Interpretable dynamic graph summarization. In Proceedings of the 21th ACM SIGKDD International Conference on Knowledge Discovery and Data Mining, pages 1055–1064. ACM, 2015.
- [12] F. M. Shipman and C. C. Marshall. Formality considered harmful: Experiences, emerging themes, and directions on the use of formal representations in interactive systems. Computer Supported Cooperative Work (CSCW), 8(4):333–352, 1999.
- [13] R. S. Sutton and A. G. Barto. Introduction to reinforcement learning, volume 135. MIT press Cambridge, 1998.
- [14] U. Von Luxburg. A tutorial on spectral clustering. Statistics and computing, 17(4):395–416, 2007.
- [15] C. J. Watkins and P. Dayan. Q-learning. Machine learning, 8(3-4):279–292, 1992.
- [16] J. J. Whang, I. S. Dhillon, and D. F. Gleich. Non-exhaustive, overlapping k-means. In Proceedings of the 2015 SIAM International Conference on Data Mining, Vancouver, BC, Canada, April 30 - May 2, 2015, pages 936–944, 2015.
- [17] E. P. Xing, M. I. Jordan, S. J. Russell, and A. Y. Ng. Distance metric learning with application to clustering with side-information. In Advances in neural information processing systems, pages 521–528, 2003.