Neutrino Physics Opportunities with the IsoDAR Source at Yemilab
Abstract
IsoDAR seeks to place a high-power-cyclotron and target combination, as an intense source of at the level of /year, close to a kiloton-scale neutrino detector in order to gain sensitivity to very short-baseline neutrino oscillations () and perform precision tests of the weak interaction, among other physics opportunities. Recently, IsoDAR has received preliminary approval to be paired with the 2.26 kton target volume liquid scintillator detector at the Yemi Underground Laboratory (Yemilab) in Korea, at a 17 m center-to-center baseline, and cavern excavation for IsoDAR is now complete. In this paper, we present the physics capabilities of IsoDAR@Yemilab in terms of sensitivity to oscillations (via inverse beta decay, IBD; ), including initial-state wavepacket effects, and the weak mixing angle (via elastic scattering off atomic electrons, ). We also introduce a study of IsoDAR sensitivity to new particles, such as a light boson, produced in the target that decays to .
I Introduction
The IsoDAR concept, in which a powerful and compact cyclotron is brought close to a large existing or planned underground detector, represents a significant paradigm shift in neutrino physics. Such an experiment would open the possibility for new physics discoveries in various forms, including neutrino production, interactions, and oscillations, each of which would present as unexpected spectral deviations in the high statistics event samples observed at the detector. In addition to the particle physics opportunities enabled by IsoDAR and as detailed in a number of publications, including outside of neutrino physics Hostert et al. (2022), the experiment will be especially important for applications in accelerator and medical science as well Abs et al. (2015); Alonso et al. (2019).
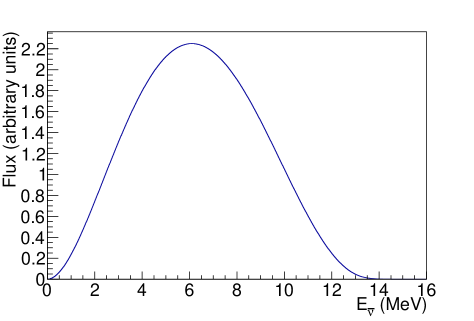
IsoDAR will rely on 60 MeV proton interactions with a 9Be target (600 kW) to produce a powerful source of neutrons. Neutron capture on the surrounding 99.99% isotopically pure 7Li sleeve results in an intense source of from the high- -decay of 8Li (; ms) with a mean antineutrino energy of 6.4 MeV and an endpoint of 15 MeV. With protons on target per year and 0.015 /proton, IsoDAR will produce in 4 years of livetime (5 years of running at 80 % duty cycle); the flux shape is shown in Figure 1.
In this paper, we consider the physics capabilities of the IsoDAR source (accelerator+target) paired to a planned 2.26 kton (inner volume) detector, called the Liquid Scintillator Counter (LSC), at the Yemilab Center for Underground Physics in Korea at a center-to-center distance of 17 m Alonso et al. (2021, 2022). The envisioned detector is cylindrical with 7.5 m radius and 15 m height (inner volume), along with a 1 m buffer region extending from the top and sides, and a 1.5 m veto region extending further. The liquid scintillator properties and photocoverage are expected to be similar to KamLAND Gando et al. (2013a). In addition, the radiopurity capabilities of the detector, which are expected to surpass KamLAND, and prospects of reconstructing direction, are discussed below. This allows for expanded physics capability beyond the pairing of IsoDAR at KamLAND that has been the focus of previous publications Bungau et al. (2012); Conrad et al. (2014). In this paper, we describe the improved sensitivity for neutrino oscillation and electroweak measurements, as well as introduce an additional physics goal: the search for unexpected peaks in the flux due to novel physics, such as a new light boson. The excavation for IsoDAR rooms was completed in January 2022 and construction of the LSC hall is well underway.
The possibility of new physics associated with neutrino mixing at short-baselines has, simultaneously, never been stronger and more confusing. The MiniBooNE experiment’s latest result Aguilar-Arevalo et al. (2021) shows a 4.8 indication of oscillations with a characteristic , consistent with MiniBooNE’s 2.8 evidence of Aguilar-Arevalo et al. (2013) and LSND’s 3.8 evidence of Athanassopoulos et al. (1995, 1996, 1998). The compatibility of these results with each other and seemingly with the reactor- Mention et al. (2011a) and radioactive-source-based Giunti and Laveder (2011); Barinov et al. (2021a) electron-flavor disappearance anomalies, perhaps within a 3+1 model with mixing among the three active flavors and one “sterile” flavor, is generally stymied by the global lack of observed muon-flavor disappearance, although a notable exception to this comes from IceCube Aartsen et al. (2020) (see discussion below). The varied results may be indicative of a more complicated modification to 3 neutrino mixing beyond this simple extension. This paper updates a 3+2 scenario we have previously presented, and adds a study of a recently proposed scenario involving sterile neutrino decay Gninenko (2009); Gninenko and Gorbunov (2010); Bai et al. (2016); Moss et al. (2018); Bertuzzo et al. (2018); Ballett et al. (2019); Fischer et al. (2020); Moulai et al. (2020a); Dentler et al. (2020); de Gouvêa et al. (2020a); Datta et al. (2020) motivated by new results from IceCube Moulai (2021). IsoDAR@Yemilab will provide unsurpassed sensitivity to oscillations observed as a periodic deficit in the well-predicted IBD signal due to the increased size of the detector and longer . The ability to trace an -dependent wave over many cycles (in much of the currently-favored parameter space), and/or more unusual - or -dependent behavior, is unique to IsoDAR and is likely to disentagle this complicated situation.
In addition to measuring IBD events in the context of an oscillation search, IsoDAR@Yemilab can use this large sample of events for a generic (or model-dependent) “bump hunt” — a search for a peak in the well predicted IBD event rate versus energy. Such a search is well motivated by theoretical interest in light-mass mediators and a number of experimental anomalies, including the “5 MeV bump” Ashenfelter et al. (2019); Almazán et al. (2020); Ko et al. (2017); Choi et al. (2016); An et al. (2016a); Abe et al. (2016) observed in numerous reactor experiments and a possible “X17” particle Krasznahorkay et al. (2016).
Similar to precision oscillation studies and an IBD-based “bump hunt”, neutrino-based measurements of the weak mixing angle, , are also highly sensitive to new physics. Specifically, non-standard neutrino interactions (NSI) can present as a deviation from the well-predicted -dependent Standard Model (SM) cross section of . The prospect of improved electroweak measurements using neutrinos is especially exciting because the most precise measurement to date with neutrinos, coming from the NuTEV experiment Zeller et al. (2002), deviates from the SM prediction, constrained by the electroweak measurements from LEP Schael et al. (2006), by . While a number of possible explanations for this anomaly exist, often involving modified nuclear physics assumptions required to extract the neutral-current to charged-current and neutrino-nucleus to antineutrino-nucleus cross section ratios relevant for NuTEV’s measurement, a definitive explanation of this long-standing anomaly remains elusive. Either way, it is clear that improved neutrino-based measurements across many energy scales are valuable, noting that NuTEV’s measurement was at GeV. At the MeV-scale energies relevant for this discussion, global measurements of are extremely sparse with only 1000 total events collected at reactors (1-10 MeV) Reines et al. (1976); Deniz et al. (2010); Derbin et al. (1993); Daraktchieva et al. (2005) and accelerators (10-50 MeV) Allen et al. (1993); Athanassopoulos et al. (1995). IsoDAR@Yemilab will collect about a factor of 7 more than this worldwide data sample.
This paper is organized as follows: first, we consider the sensitivity of “IsoDAR@Yemilab” (17 m center-to-center from IsoDAR to the Yemilab detector) to mixing via IBD detection; next, we provide an in-depth discussion of this oscillation sensitivity in the context of global searches for short-baseline oscillations, including mixing beyond the simplest 3+1 model; next, we consider the implications of decoherence on IsoDAR@Yemilab’s sensitivity to oscillations, including prospects for measuring the finite initial antineutrino wavepacket; next, we discuss the prospects of a “bump hunt” in the measured IBD spectrum, especially in the context of a search for a new boson; finally, we study IsoDAR@Yemilab’s ability to measure and search for non-standard interactions (NSI) via elastic scattering off atomic electrons (ES; ).
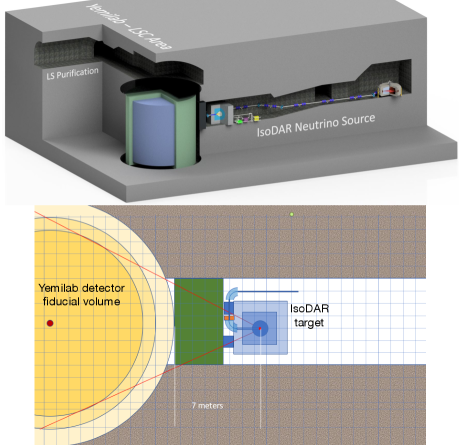
For the IsoDAR@Yemilab scenario considered, we place the IsoDAR target center at the mid-plane of the detector, next to the outer-tank. The distance from the center of the IsoDAR target to the center of the Yemilab detector in this configuration is 17 m: 7.5 m (radius of the detector) + 1 m (detector buffer region) + 1.5 m (detector veto region) + 7 m (shielding and IsoDAR beam-pipe/target geometry). The envisioned source and detector geometry is shown in Fig. 2. While this conceptual arrangement may require adjustments based on ongoing engineering and shielding studies, we expect it to be representative of what is achievable for this “IsoDAR@Yemilab” experiment. For reference, the relevant IsoDAR accelerator/target and detector assumptions applicable to all analyses presented are shown in Table 1. The IsoDAR-specific parameters are based on Ref. Abs et al. (2015). Notably, the IBD-based and ES-based analyses feature significantly different signal and background event rates, and thus require separate fiducial volume definitions towards optimizing the sensitivity of each. The analysis-specific assumptions are discussed below.
| Runtime | 5 calendar years |
|---|---|
| IsoDAR duty factor | 80% |
| Livetime | 4 years |
| Protons on target/year | |
| 8Li/proton (/proton) | 0.0146 |
| in 4 years livetime | |
| IsoDAR@Yemilab mid-baseline | 17 m |
| IsoDAR@Yemilab depth | 985 m (2700 m.w.e.) |
II Sensitivity to electron antineutrino disappearance
The IsoDAR@Yemilab experiment will be able to collect IBD events in 5 years of running. In addition, the wide range of baselines (9.5-25.6 m) and energies (0-15 MeV) in this setup combined with the reconstruction abilities of the detector affords strong sensitivity to disappearance as a function of (and, or considered individually). For detecting IBD events in the Yemilab detector, our assumptions are shown in Table 2.
IBD analysis assumptions
IsoDAR@Yemilab baseline range
9.5-25.6 m
IsoDAR@Yemilab fiducial mass
2.26 kton
IsoDAR@Yemilab fiducial size (radius, height)
7.5 m, 15.0 m
1 uncertainty in creation point
0.41 m
Prompt (e+) energy res.
Prompt (e+) energy res. @ 8 MeV
2.3%
Prompt (e+) vertex res.
Prompt (e+) vertex res. @ 8 MeV
4 cm
Total IBD efficiency
92%
Total detected IBD (92% efficiency)
1.67
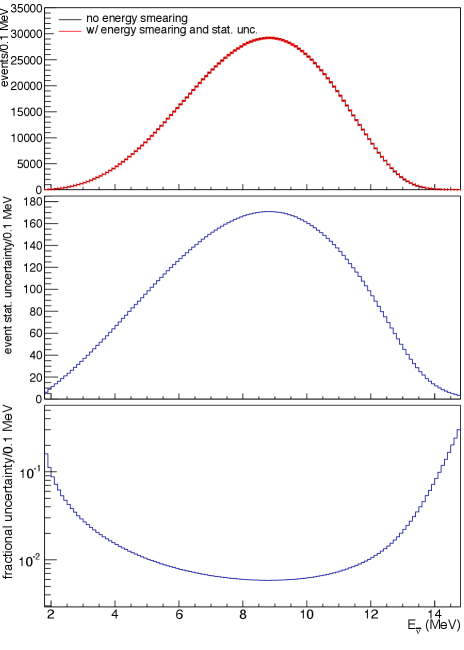
For IBD events, the energy is reconstructed based on the positron energy, MeV, and the IBD detection efficiency at the Yemilab detector is assumed to be %, consistent with KamLAND Gando et al. (2011, 2013b). Given the -dependent behavior of conventional neutrino oscillations, the energy and vertex (or, baseline) resolutions are highly relevant for an oscillation search. The energy and vertex resolutions are assumed to be consistent with KamLAND, and Gando et al. (2011). Fig. 3 (top) compares the true IBD event energy spectrum in black to the reconstructed IBD energy spectrum in red, and one sees that the reconstructed energy is highly precise and, even with only 0.1 MeV bin width, the uncertainties are small. The middle and bottom panels of Fig. 3 show the absolute and fractional expected statistical uncertainty as a function of the reconstructed antineutrino energy.
With regard to vertex resolution, however, we note that the inherent uncertainty in the baseline, essential for oscillation studies, on an event-by-event basis is dominated by knowledge of the creation position in the IsoDAR target and sleeve. Based on the currently envisioned IsoDAR target/sleeve geometry Bungau et al. (2019) and Geant4-based simulations Agostinelli et al. (2003), the characteristic uncertainty in the creation position is modeled with a 41 cm 1 spherical Gaussian uncertainty.
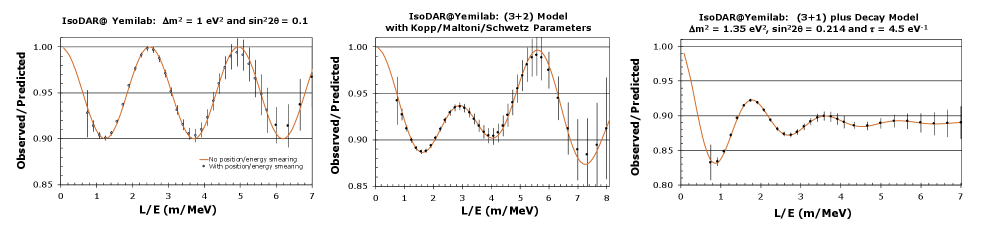
As stated above, the IsoDAR@Yemilab configuration can expect detected IBD in 5 years of running, after accounting for detection efficiency, allowing IsoDAR@Yemilab to have unprecedented sensitivity to new physics models through the model-agnostic approach of analyzing the detected rate as a function of . Fig. 4 compares three scenarios that cannot be distinguished using existing global data. The simplest model involving three active neutrinos is the 3+1 model, which produces a oscillation wave as a function of , with survival probability given by:
| (1) |
where is the mass-splitting between the fourth neutrino mass state and the three lighter neutrino states that are effectively degenerate, and is the mixing matrix element that represents the electron flavor composition of the fourth mass state in the extended PMNS matrix. Terms involving the latter are often simplified to an electron-flavor dependent mixing angle, such that the survival probability is given by:
| (2) |
Motivated by the arbitrariness of assuming only one sterile neutrino and by tension between the observed experimental anomalies and limits, 3+2 models, with two sterile neutrinos, were introduced. In this case, the survival probability is given by:
| (3) | |||||
where there is an additional mass splitting due to the fifth mass state, and the mixing matrix is further extended to include the coupling of the electron flavor to this state. Examples of the expected data as a function of for some characteristic 3+1 and 3+2 Kopp et al. (2013) IsoDAR@Yemilab scenarios are shown in Fig. 4, left and center. One can see that, for IsoDAR@Yemilab, 3+2 is distinguishable from 3+1 due to the the interference between the two contributing mass splittings. Fig. 4 (right) presents the expectation for a representative “3+1+decay” scenario, a new model that has recently been motivated by IceCube’s muon-flavor disappearance results. IceCube atmospheric muon neutrino data in the 1 TeV range will exhibit a resonant disappearance signature due to matter effects if neutrinos have a sterile component in the range of eV2. The results indicate an allowed region for a 3+1 fit at and CL Moulai (2021). When the model is extended to allow for decay of the high mass neutrino , the fit improves, and the SM is rejected with a p-value of 2.8% Moulai (2021). This motivates exploration of the model by IsoDAR, for the lifetime found by IceCube and within the IceCube 95% allowed region that overlaps with a solution found in short-baseline global fits. The survival probability for a 3+1+decay model is given by:
| (4) | |||||
Fig. 4, right, shows the IsoDAR rate as a function of , and one can see the signature exponential die-off of the oscillation wave associated with the decay.
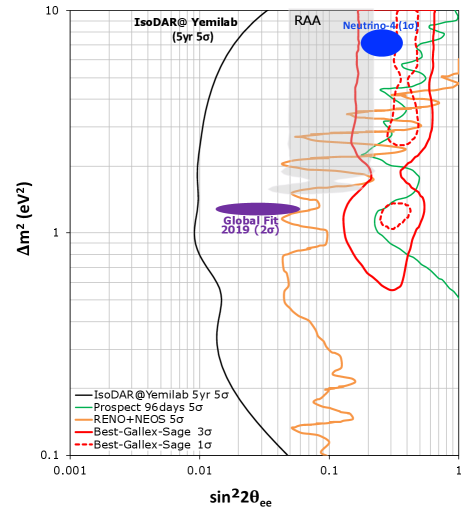
The sensitivity to is traditionally calculated and compared with existing data within a 3+1 model, using Eq. 2. The specifics of the IsoDAR sensitivity calculation, based on searching for shape-dependent effects, follows Ref. Agarwalla et al. (2011). Fig. 5 shows the IsoDAR@Yemilab 5 sensitivity for 5 years of running, as described above.
Fig. 5 also demonstrates the present state of electron-flavor disappearance searches, which is very complex. One sees four closed contours, which are allowed regions: the Reactor Antineutrino Anomaly (gray) Mention et al. (2011b), the Neutrino-4 reactor experiment measurement (blue) Serebrov et al. (2021), a BEST-GALLEX-SAGE Barinov et al. (2021b, 2022); Kaether et al. (2010); Abdurashitov et al. (2009) source experiment combination (red) Serebrov et al. (2021), and a 2019 global fit (purple) Diaz et al. (2020). One immediately notes that the allowed regions have significant disagreements. Also, a set of recent reactor experiments have not observed disappearance, and therefore set corresponding limits; examples on Fig. 5 are PROSPECT (green) Andriamirado et al. (2021) and the combined NEOS/RENO analysis (yellow) Atif et al. (2020). The 5 exclusion curve for NEOS/RENO (PROSPECT) is obtained by extracting the and values from the 90% (95%) CL exclusion curve in Ref. Atif et al. (2020) (Ref. Andriamirado et al. (2021)) and then multiplying , () to the values. As can be seen, these limits are in strong disagreement with the low- solution for BEST-GALLEX-SAGE.
The lack of clarity in Fig. 5 indicates that a simple 3+1 oscillation model is unlikely to explain all of these results. Either one or more of the results is incorrect or the underlying physics is significantly more complicated than a 3+1 model. However, as can be seen in Fig. 5, the IsoDAR@Yemilab experiment will cover these results at very high sensitivity. In general, if any or all signatures are real, they will be easily discernible with IsoDAR@Yemilab. Beyond this, the IsoDAR@Yemilab design has several features that make it ideal to follow up on these experiments:
-
•
Unlike reactor experiments, the IsoDAR flux is created by a single isotope (8Li beta decay), which is extremely well understood.
-
•
BEST-GALLEX-SAGE are MegaCurie single-isotope source experiments. However, these experiments only count germanium atoms produced from charged current interactions, and cannot reconstruct individual events. IsoDARYemilab reconstructs the neutrino path length, , and energy, , on a per-event basis.
-
•
The IsoDAR , , and ranges are uniquely wide and the and reconstruction capability is at high precision compared to the other experiments.
It is worth noting that most of the anomalies discussed are the result of follow-up on previous experiments of the same type. Unfortunately, if history is any kind of predictor of the future, running more of the same type of experiment, with incremental (and, even substantial) improvements, is unlikely to provide a definitive explanation of the complicated and confusing situation. IsoDAR@Yemilab provides a new way to explore the problem with both unprecedented sensitivity and approach. Indeed, in the case that any one of the existing anomalies is due to some kind of new physics involving oscillations, IsoDAR will almost certainly make a discovery.
III Oscillation measurements in a global context
If the possible source of new physics is due to the existence of one or more sterile neutrinos, then the IsoDARYemilab disappearance sensitivity requires consideration within the context of global searches for disappearance and appearance (noting that oscillations involving are weakly constrained at present). This is because the addition of extra mass and flavor states into the neutrino sector leads to all three phenomena. Returning to a 3+1 model for simplicity, while keeping in mind that the tension between various experiments indicates that this model is likely to be too simplistic (if sterile neutrinos do exist), then one finds two more equations that make a triplet with Eq. 1:
| (5) |
where, for clarity, we write out the extended PMNS matrix for 3+1:
| (6) |
By making the mixing matrix elements explicit, one sees the connection between disappearance data sets ( and ) and appearance data sets () in a 3+1 model.
Since 1993, possible () oscillation effects have been observed in all three channels, although the hints are very recent Aartsen et al. (2020) and do not rise to the level. At the same time, the parameter space is highly constrained in global, all-experiment fits by results that have reported no oscillation signature, thus the allowed region for the global fit (purple) on Fig. 5 is rather small. Notably, there is a well-known “tension” between the disappearance and appearance data sets, which is traditionally quantified using the “parameter goodness-of-fit” (PG) test Maltoni and Schwetz (2003). By that measure, there is a probability of agreement between the worldwide short-baseline data sets within a 3+1 model Diaz et al. (2020). On the other hand, the / when fitting the data for a 3+1 model versus an only-3 model shows a improvement with the addition of the sterile state Diaz et al. (2020). This indicates that, although 3+1 may not be the correct underlying model, the data strongly prefer a model with oscillations involving a sterile neutrino over the SM.
The MiniBooNE experiment, which uses a Cherenkov detector, has observed an excess of -like events for MeV at a baseline of 550 m. To date, most 3+1 studies involving MiniBooNE have assumed that appearance may occur, but do not also consider that , which is also a component of the intrinsic decay-in-flight flux, can also disappear. Very recently, Kopp and Brdar Brdar and Kopp (2021) have studied the allowed regions for MiniBooNE alone, outside of a global fit, allowing all three oscillation modes associated with sterile neutrinos. This is a complicated fit, and an external, very high statistics measurement of oscillation parameters from IsoDAR@Yemilab would allow the intrinsic prediction at MiniBooNE to be well determined, thereby allowing the appearance parameters to be extracted. Given a precise oscillation prediction, we can isolate any remaining excess MiniBooNE signal, which could be due to photons. This is inconsistent with a simple 3+1 model that says 100% of the MiniBooNE signal is due to interactions.
The need for IsoDAR@Yemilab has become even more apparent because of the recent MicroBooNE results Abratenko et al. (2021). MicroBooNE is located 70 m upstream of MiniBooNE and uses liquid argon time projection chamber (LArTPC) technology. This state-of-the-art detector can distinguish electrons from photons, unlike the MiniBooNE detector. MicroBooNE limits the fraction of generic charged-current interactions that can explain the MiniBooNE excess to at 95% CL. However, the limit is significantly better than the expected experimental sensitivity because MicroBooNE observes an overall deficit of , which may be a complex disappearance signature, perhaps similar to those that produce the dependence shown in Fig. 4. This possibility is already being explored in the literature (see, e.g., Ref. Denton (2021)). Alternatively, because MicroBooNE is using state-of-the-art detection technology, it may be that there are unmodelled inefficiencies which lead to the deficit.
The combination of the apparent cross-experiment disagreement with electron-flavor disappearance, the tension between appearance and disappearance in the global fits, and the possible unmodeled source of photon-like signals in MiniBooNE, point to a more complex sterile neutrino model, if new physics is indeed the source of the anomalous results. In Fig. 4 (middle), we show the IsoDAR@Yemilab sensitivity to an additional sterile neutrino state (a “3+2” model). Notably, the addition of the second new state allows for new sources of violation to be present in appearance results. Therefore, the “nuisance” of sterile-neutrino-induced violation is required in global fits for a mixed conventional beam that has neutrinos and antineutrinos. On the other hand, the fact that we are performing a disappearance search using a pure electron-antineutrino source implies that IsoDAR@Yemilab is insensitive and agnostic to the value of the phases. Unfortunately, at present, a model does not seem to significantly reduce the tension between appearance and disappearance experiments in global fits, and there is no compelling improvement overall, as compared to a model Diaz et al. (2020).
A possible solution to the tension is to introduce additional secret forces that predominantly affect the mostly sterile neutrino mass state. Indeed, this might produce an additional photon-like signal in MiniBooNE. In this context, the possibility of the mostly sterile neutrino mass state to decay has been considered in Refs. Gninenko (2009); Gninenko and Gorbunov (2010); Bai et al. (2016); Moss et al. (2018); Bertuzzo et al. (2018); Ballett et al. (2019); Fischer et al. (2020); Moulai et al. (2020a); Dentler et al. (2020); de Gouvêa et al. (2020a); Datta et al. (2020). Notably, in Ref. Moulai et al. (2020b) it was shown that a 3+1+decay model significantly reduces the tension between appearance and disappearance experiments, improving the global-data goodness-of-fit. Sterile neutrino decay leads to a dampening in the neutrino oscillation pattern as can be seen in Fig. 4, right, which produces a clear and distinct signature. In general, IsoDAR has excellent sensitivity to the IceCube-motivated parameters of a 3+1+decay model.
IV Sensitivity to wavepacket effects
Adding to the complexity of oscillation searches at short-baseline, the authors of Ref. Argüelles et al. (2022) have recently pointed out that the assumption of the neutrino state as a plane wave (PW) may be too simplistic for oscillation models applied to the anomalies. A better description is the wave package (WP) formalism, which accounts for effects arising from a finite initial antineutrino wavepacket width. This leads to decoherence that becomes most apparent when is large compared to . The wavepacket width depends on the source, and for reactors could be finite due to the characteristic sizes of the quantum system, including U and Pu nuclei ( nm), the inverse of the antineutrino energy ( nm) and the interatomic spacing ( nm) de Gouvêa et al. (2021). Fits to a combination of Daya Bay, RENO and KamLAND data set a limit on the wave-packet width of nm at 90% CL de Gouvêa et al. (2021).
The wavepacket width is incorporated into the 3+1 electron-flavor survival probability equation in the following manner Argüelles et al. (2022):
| (7) |
where and
| (8) |
In the above equations, , and are in meters, and is in MeV. Fits assuming nm lead to considerably reduced limits in the high- anomaly range for a combined fit to Daya Bay, RENO, and PROSPECT Argüelles et al. (2022). The MegaCurie 51Cr and 37Ar source experiments, BEST, GALLEX and SAGE, would be expected to have a wavepacket effect of roughly similar level. If one fits the source data using nm, the allowed region is enlarged in the eV2 region, as can be seen in Fig. 7. The figure also shows that a wavepacket effect of nm leads to agreement between reactors (“All ” in the figure) and BEST at eV2 as well as eV2, hence, dramatically improving tension between the experiments.
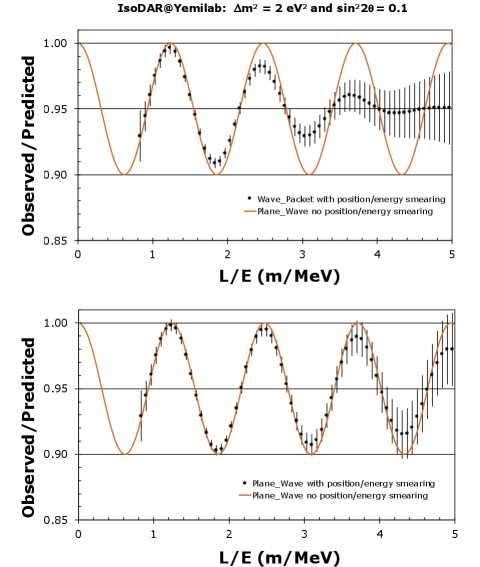
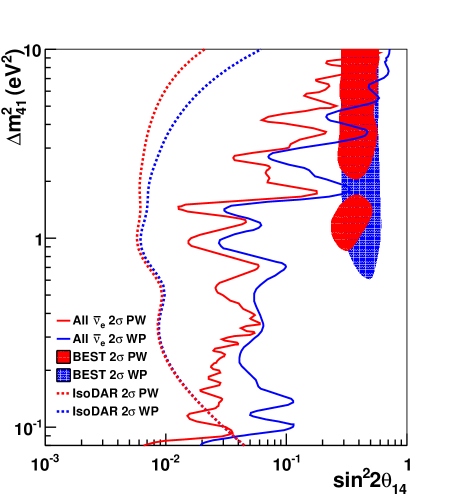
The high statistics of the IBD data set allows IsoDAR@Yemilab to study the wavepacket effect. Since the bulk of this data will be in the range where (in m/MeV) is not substantially larger than the (in eV2) range under scrutiny, the sensitivity is not significantly affected. Fig. 7 shows the 2 IsoDAR@Yemilab sensitivity for a wavepacket effect of nm, alongside the nominal plane-wave sensitivity and, adapted from Ref. Argüelles et al. (2022), the analogous results from both BEST individually and a Daya-Bay-NEOS-PROSPECT experiment combination An et al. (2016b, 2017); Ko et al. (2017); Andriamirado et al. (2021). For IsoDAR@Yemilab, one can see that at eV2 the difference in sensitivity is 10%. This sensitivity can be restored through a minor extension to the run-time. However, at the same time, the experiment has sufficient statistical power at large , where the effect is largest, that the data can be fit for the value of . Fig. 6 shows the -dependence of the rates for eV2 oscillations with nm (top) and with no wavepacket effect (bottom). For m/MeV, the wavepacket effect is readily apparent with the data distribution substantially flattened. The ability to distinguish these oscillation models and measure the wavepacket effect at high precision is unique to IsoDAR@Yemilab.
V Searches for new physics via “bump hunting” in the IBD spectrum
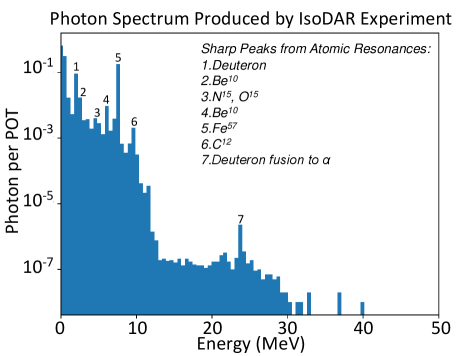
The same excellent energy resolution, seen in Fig. 3, that allows precise searches for deficits related to oscillations and/or decays involving sterile neutrinos also allows for searches for peaks from new particles produced in the IsoDAR target and sleeve that decay to . There is both theoretical and experimental impetus for a “bump hunt” at IsoDAR@Yemilab. The theoretical motivation arises from interest in low mass mediators, called light X particles, that are produced through mixing of photons within the target and sleeve or directly from the nuclear transitions emerging at the target or the sleeve. Fig. 8 shows the spectrum of photons that are produced up to 50 MeV, where the line-structure arises from the transitions of excited nuclei, and the other photons are mainly due to bremsstrahlung. If the particles are nearly at rest, the subsequent decays produce s with energy at half the mass, which can engage in an IBD interaction, producing a peak. The experimental motivations are twofold: the Atomki anomaly and the 5 MeV “reactor bump.” We discuss all motivations below, however we note that, given the novel high-statistics data set that will be produced by IsoDAR@Yemilab, a curiosity-driven search is equally valid.
Low mass mediators are well motivated in various extensions of the SM, see e.g., Refs. Bauer et al. (2018); Dutta et al. (2019); Datta et al. (2019); Delle Rose et al. (2019a); Dutta et al. (2021). These models involve extensions of the SM gauge sectors and/or the SM Higgs sector and are motivated to explain the origin of dark matter, neutrino masses and mixings, non-standard neutrino interactions and various anomalies, e.g., of the muon, Atomki, MiniBooNE, LHCb, etc. The mediators can be of vector, scalar and pseudoscalar types and involve couplings to the SM and dark sector particles. Various beam dump experiments, Belle, BaBar, reactor and beam-dump based neutrino experiments, astrophysical measurements, etc. apply constraints on these mediators. The mediators of mass MeV can provide positive and negative contributions to depending on its decay branching ratio into neutrino-anti-neutrinos and electron-positrons Escudero (2019), respectively, which is interesting to determine the allowed parameter space for these low mass mediator models. Further, the interactions involving the decay into neutrino final states have impact on the neutrino floor for dark matter direct detection experiments Aristizabal Sierra et al. (2019); Bœhm et al. (2019).
The transition lines in Fig. 8 are associated with various types of magnetic () and electric () moments which can be associated with different types of mediators, e.g., Avignone et al. (1988); Feng et al. (2017); Dent et al. (2022). Due to the existence of many lines with different moments, for simplicity, we assume that the generic mediator is coupled to both quarks and neutrinos, e.g., Datta et al. (2019); Aristizabal Sierra et al. (2019); Bœhm et al. (2019). The production rate of this new mediator depends on its coupling with quarks and the mass, which can be expressed as a branching ratio for a given transition. This simple model can bypass the constraints from the electron beam dump data, but the product of the neutrino and quark couplings is limited by some neutrino experiments, e.g., COHERENT, CCM etc., and has impacts on the neutrino floor for direct detection experiments Bœhm et al. (2019); Aristizabal Sierra et al. (2019).
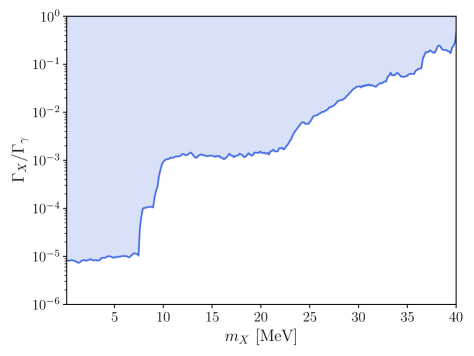
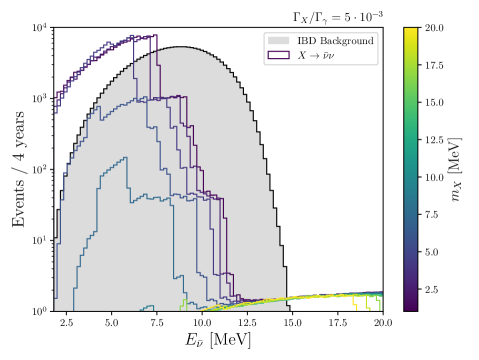
Driven by nuclear transition induced gammas in the IsoDAR target, we present the 90% CL sensitivity to the bosonic state via a branching ratio , that subsequently decays to pairs, in Fig. 9. The spectrum produced from the prompt decay is simulated with Monte Carlo in the rest frame, boosted to the lab frame, and propagated to the IsoDAR@Yemilab 2.26 kton fiducial volume where the antineutrino is detected via IBD. The energy spectra detected this way are shown in Fig. 10 for several masses and compared with the IBD rate from 8Li, which is expected to be the only significant background for this search. There are several interesting features of the signal shape, namely, the boosted spectrum from each monoenergetic produced would have endpoint energies , where and are the Lorentz factor and velocity, respectively. The edges in the spectrum are the imprints of edges in the photon spectrum (Fig. 8), transformed and skewed by the combined effect of the Lorentz boost and IBD cross section convolution.
Our projected sensitivity in Fig. 9 is then calculated by performing a analysis, treating the expected IBD spectrum as a background and null hypothesis. The -boson coupling to the quarks can be constrained from this analysis to be for an -boson mass MeV when the boson decays promptly into neutrinos with coupling values . Some regions of the parameter space associated with the product of the quark and the neutrino couplings of that can be probed at IsoDAR are still allowed by the constraints from the COHERENT experiment Aristizabal Sierra et al. (2019); Cadeddu et al. (2021); us (2022).
One particular experimental interest is the sensitivity to the light mediator claimed to explain the Atomki anomaly Krasznahorkay et al. (2016); Gulyás et al. (2016); Aleksejevs et al. (2021); Delle Rose et al. (2019b). This is a reported excess of pairs observed in the decay of the 18 MeV excited state of beryllium produced through 7Li(p,n)8Be∗, and the set of 20 MeV excited states of helium produced through 3H(p,)4He. In the former case, the invariant mass of the pairs is consistent with a vector boson mediator of (stat)(sys) MeV and in the latter of mass (stat)(sys) MeV. However, one can see from Fig. 8, that the rate of 18 MeV (and higher energy) photon production is relatively low. Thus, if IsoDAR observes a peak due to interactions at 8.5 MeV, then the connection to the Atomki anomaly requires a coupling to neutrinos that is substantially different from the coupling to electrons. Alternatively, if IsoDAR@Yemilab observes no signal at 8.5 MeV, some (but unlikely all) explanations for the Atomki anomaly can be excluded.
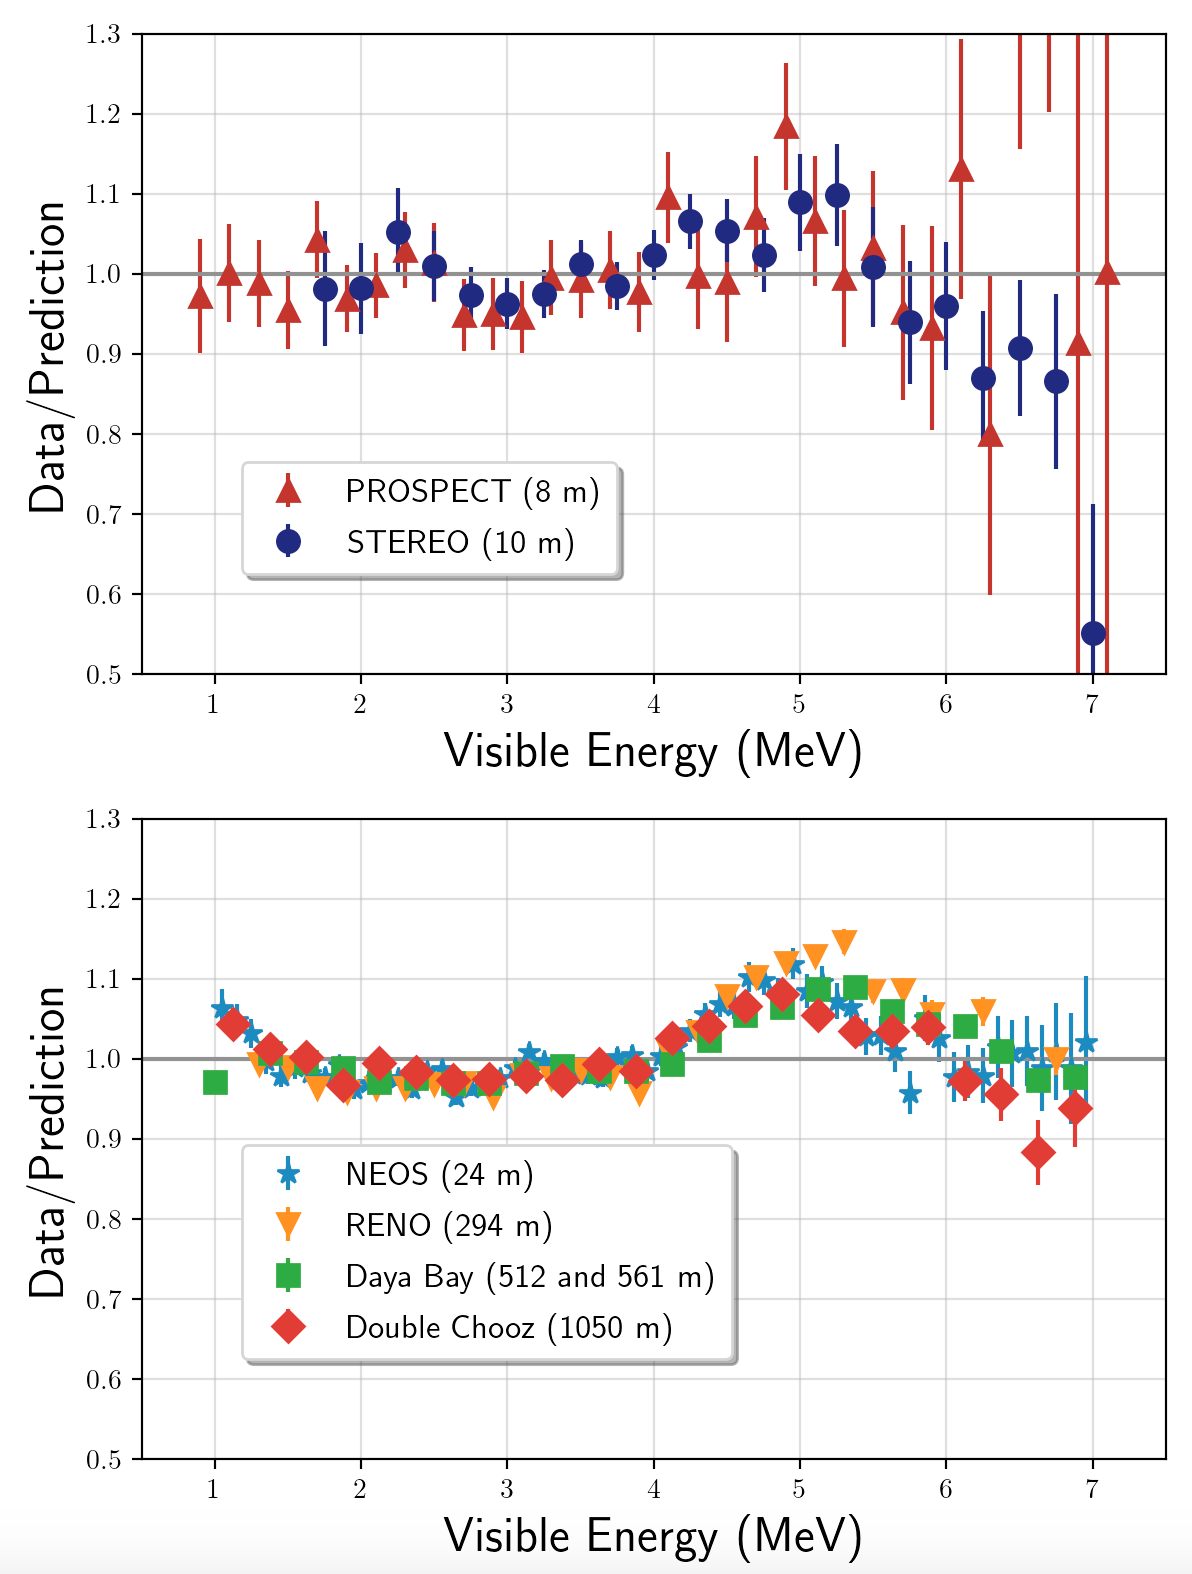
Another interesting experimental motivation arises from the 5 MeV reactor bump, which is seen in the event distribution of most modern reactor experiments. Fig. 11 shows the ratio of data to prediction for recent high statistics data sets, with experiments located at highly enriched uranium (HEU) reactors, PROSPECT Ashenfelter et al. (2019) and STEREO Almazán et al. (2020), shown in the top panel and those located at power-reactors, NEOS Ko et al. (2017), RENO Choi et al. (2016), Daya Bay An et al. (2016a) and Double Chooz Abe et al. (2016), in the bottom panel. The source of the excess at 5 MeV has not yet been fully explained, although recent measurements Bak et al. (2019); Adey et al. (2019) indicate that the bump may arise from incorrect predictions of the Huber-Mueller model Huber (2011); Mueller et al. (2011) related to 235U (and perhaps 239Pu as well) isotopes in reactor cores. If that is the case, since IsoDAR uses an 8Li-decay flux, IsoDAR@Yemilab will not observe a 5 MeV bump signal. However, a 5 MeV signal bump could be observed as fake IBD events in IsoDAR@Yemilab from enhancements associated with the reaction in the liquid scintillator detector, based on either minimal or non-minimal new physics scenarios, as suggested in Ref. Berryman et al. (2019). IsoDAR@Yemilab has an advantage to test this thanks to the high flux of above 9.4 MeV required for this reaction (see Fig. 1). In addition, it is interesting to note that the characteristic shape of the low mass mediator induced IBD event spectrum, shown in Fig. 10, is similar to the reactor bump for some masses. In any case, the IsoDAR result will provide an important clue to the source of the reactor bump.
VI Sensitivity to new physics via scattering
In addition to the bounty of IBD events described in the previous section, the IsoDAR@Yemilab configuration will provide about 6980 detected ES events with MeV in a 1.16 kton fiducial volume (6.0 m radius, 12 m height) with a 4 year livetime. Note that this fiducial volume is smaller than the double-flash IBD analysis one described above, due to the single-flash nature of ES events and correspondingly higher background. The MeV requirement is necessary to mitigate rapidly rising radiogenic-induced gammas below this energy cutoff. The event rate estimate includes a 32% detection efficiency above 3 MeV. Notably, this sample will be significantly higher than the 2600 ES events expected (3 MeV) in the IsoDAR@KamLAND configuration studied in Ref. Conrad et al. (2014), driven by the larger fiducial volume of the Yemilab detector.
In this section, we consider these ES signal events, along with relevant backgrounds and systematic uncertainties, in the context of both searching for new physics via non-standard neutrino interactions (NSI) and measuring the weak mixing angle under a “no NSI” assumption. However, it is important to note that, beyond searching for NSI using ES, the study of the single-electron signature can provide powerful tests of new physics in other ways, which are not explored here in detail (in favor of analyzing the singular measurement/observable, of electron kinetic energy in scattering, in the context of the weak mixing angle and NSI). For example, neutrino electromagnetic properties Giunti and Studenikin (2009); Baha Balantekin and Kayser (2018) can distort the expected SM cross section as well. If neutrinos have a large magnetic moment, as is the case in some neutrino-mass-generation scenarios Voloshin (1988); Leurer and Marcus (1990), they would produce observable signatures in experiments measuring small electron recoils Shoemaker and Wyenberg (2019); Brdar et al. (2021).
This section derives largely from the highly analogous study in Ref. Conrad et al. (2014), which details an ES measurement in the IsoDAR@KamLAND configuration.
The SM’s ES differential cross section is given by:
| (9) |
where , , is the energy, is the electron’s recoil kinetic energy, is the mass of the electron, and is the Fermi coupling constant. The coupling constants are expressed at tree level as:
| (10) |
An ES measurement as a function of the outgoing electron’s energy can therefore provide a measurement of and , as well as . The weak mixing angle is constrained experimentally in other ways, of course, and the relationship between , , and [] combined with precision measurements at colliders Erler and Su (2013) and from muon decay Webber (2011) provide a precise global prediction for , assuming that these measurements are fully applicable and transferable for the neutrino case. However, deviations from this expectation may appear due to NSI. Under different assumptions, the ES study described below can be considered in the context of a measurement or in terms of a search for NSI (while setting to a constant or, alternatively, allowing it to deviate based on a precision measurement in a different sector and assuming universal applicability of the parameter), but the experimental observable and backgrounds are identical for the two cases, although the normalization and energy dependence of the signal expectation can change based on the relevant model’s parameters (either or the NSI parameters described below).
For an NSI search, we can parameterize the deviations from the SM prediction as changes to the relevant couplings:
| (11) | |||||
where and .
The NSI parameters ( and ) are associated with flavor-changing neutral currents. We neglect (set to zero) these parameters when considering IsoDAR@Yemilab’s sensitivity to NSI, since they are tightly constrained for muon flavor Davidson et al. (2003) and lepton-flavor-changing experiments, in general. The are called “non-universal parameters” and the IsoDAR@Yemilab sensitivity quoted below is in terms of these, with the other four set to zero.
VI.0.1 Signal and Background
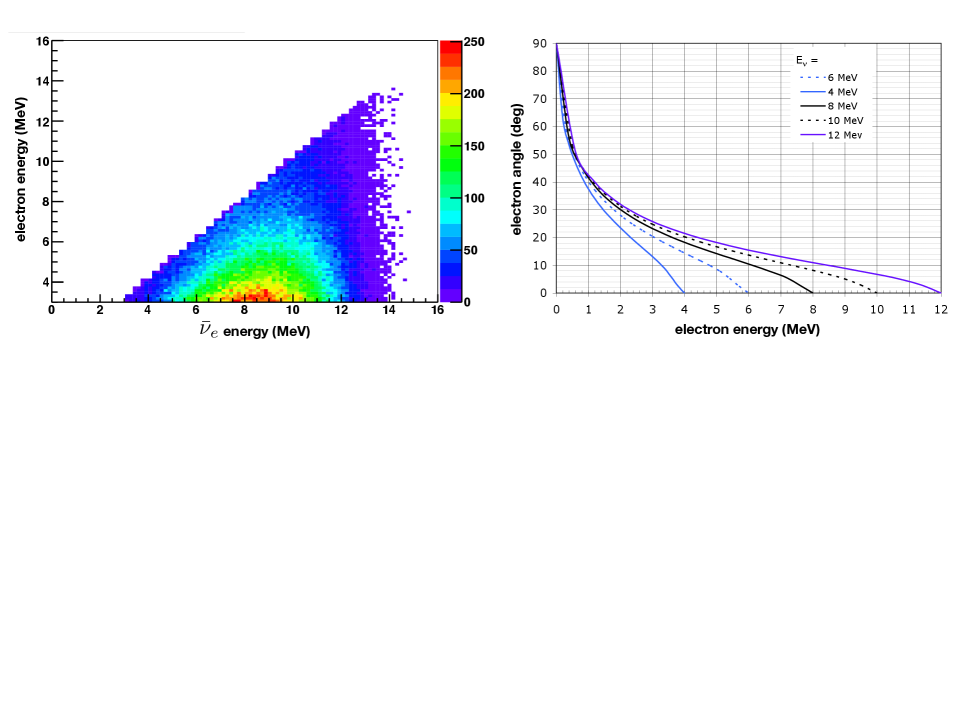
The signature of an ES interaction () is simply an outgoing electron, and these events are completely characterized by the recoiling electron’s energy () and angle (), with the recoil energy directly proportional to visible light in the detector, . The energy can be reconstructed using these quantities with the following equation: . The kinematics associated with ES events generically and in IsoDAR@Yemilab are shown in Fig. 12. While the angular information is useful for background mitigation, as discussed below, we focus on reconstructing the well-predicted ES distribution for achieving sensitivity to , and consider a detector without angular reconstruction abilities as the default design. However, we briefly consider an alternative scenario in which the detector has directional resolution capabilities below. The energy and vertex resolution assumptions for ES detection are identical to the IBD-induced ones discussed above. These, along with a number of other relevant assumptions, are shown in Table 3 and presented in detail below.
ES analysis assumptions
IsoDAR@Yemilab fiducial mass
1.16 kton
IsoDAR@Yemilab fiducial size (radius, height)
6.0 m, 12.0 m
e- energy res.
e- energy res. @ 8 MeV
2.3%
IBD bkgnd. rejection efficiency Conrad et al. (2014)
IBD efficiency unc. (for flux normalization) Gando et al. (2013b)
0.7%
e± detection eff. for MeV (signal and bkgnd.) Conrad et al. (2014)
32%
Total detected -e for MeV (w/ 32% eff.)
6980
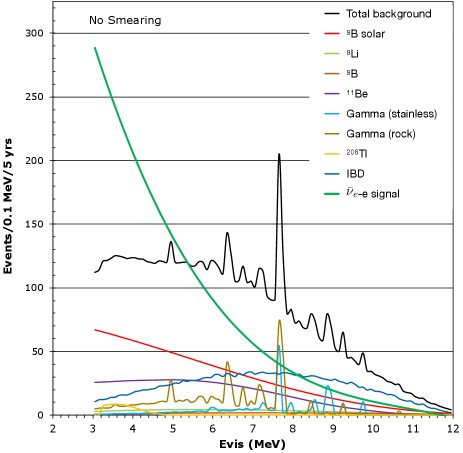
Given the single-flash nature of ES events, there are a number of important backgrounds to consider, including mis-reconstructed IBD events from the IsoDAR source, solar -induced ES events (the dominant source is 8B neutrinos), cosmogenic-spallation-induced isotopes, and radiogenics originating from the liquid, stainless steel, and rock outside of the detector. These backgrounds are discussed below.
The nearly 1.7 million IBD events expected in 5 years of running with IsoDAR@Yemilab discussed above are useful for an ES-based measurement, in the sense that they constrain the normalization of the flux (at least, in the absence of oscillations, which is assumed in this section) at the level of the uncertainty in the IBD efficiency of 0.7% Gando et al. (2013b), noting that the IBD cross section error is subdominant at 0.2% and the statistical uncertainty on the IBD measurement will be at the 0.1% level. However, the IBD events, nominally double-coincident with a prompt followed by a neutron capture signal on either 1H (2.2 MeV ) or 12C (4.95 MeV ), can pose a background for the ES measurement as well. IBD events are nominally identified by the detection of this delayed neutron capture, with a time constant of s for capture on hydrogen after the interaction Gando et al. (2013b). However, IBD events can be misidentified as single/prompt-only ES-like events if the neutron is not detected. While IBD identification (or, background rejection in this case) is highly effective, the higher IBD event rate compared to the ES event rate, means that this background is important. Following the IsoDAR@KamLAND study in Ref. Conrad et al. (2014), the IBD background rejection efficiency for IsoDAR@Yemilab is conservatively estimated as . This inefficiency is dominated by events which simultaneously produce a reconstructed IBD prompt vertex in the fiducial volume and a neutron capture outside both the fiducial volume and a larger “neutron capture volume”. This estimate, originally based on the KamLAND spherical geometry (5.0 m radius fiducial volume and 6.0 m radius neutron capture volume), is conservative since the IsoDAR@Yemilab cylindrical geometry and distance between the fiducial and neutron capture volumes defined here (6.0 m radius and 12 m height fiducial volume; and 7.5 m radius and 15 m height neutron capture volume) will provide comparatively higher neutron detection efficiency. Ultimately, an AmBe source delayed neutron capture calibration campaign at Yemilab will provide precision estimates of the IBD rejection efficiency and uncertainty for this analysis.
Neutrino-electron () elastic scattering events from 8B solar (where ) also present a background to the ES measurement described here. The relevant solar neutrino flux Abe et al. (2011a) and interaction rate ( events/ktonday), and energy dependence are described in Ref. Conrad et al. (2014) and are included here, scaled appropriately based on the fiducial volume difference between IsoDAR@KamLAND to the IsoDAR@Yemilab. Radiogenic-induced gammas from the stainless steel containment vessel and rock surrounding the detector also represent backgrounds for the ES measurement. We utilize the Geant4-based background prediction from Ref. Conrad et al. (2014), scaled according to the geometric (spherical vs. cylindrical) and volume differences between IsoDAR@KamLAND and IsoDAR@Yemilab. Radiogenic daughters from the 238U and 232Th decay chains inside of the liquid scintillator can also produce backgrounds. For MeV, the beta decay of 208Tl ( minutes, =5.0 MeV) from the 232Th chain is the main concern. Ref. Conrad et al. (2014) assumed 232Th contamination at the level of the low-background phase of KamLAND [ g/g]. However, the Yemilab detector expects to achieve significantly better liquid scintillator purity, with 232Th contamination at the level of g/g. Here, we conservatively assume that the contamination in the Yemilab detector is equal to this upper-limit.
Another set of backgrounds is due to cosmogenic-induced spallation and the resulting light isotope production, which can produce signal-like events with MeV, including 8B ( decay; s, =18 MeV), 8Li ( decay; s, =16 MeV), and 11Be ( decay; s, =11.5 MeV) Tilley et al. (2004); Ajzenberg-Selove (1990). These backgrounds and their removal, largely based on a cosmic muon veto, are detailed in Ref. Abe et al. (2010) in the context of IsoDAR@KamLAND, and we apply them here as well, scaled appropriately to the different volumes, noting that the depth-equivalent of each detector is the same (2700 m.w.e.). Again, we expect this estimate to be conservative given the larger distance between the Yemilab detector’s fiducial volume’s outer edge and the outer edge of the veto region (minimum distance=5.0 m) as compared to KamLAND (4.0 m).
The default scenario (no angular reconstruction capability) signal and background expectations for the ES analysis are summarized in Table 4 and their energy spectra can be seen in Fig. 13. After including fiducial volume and veto cuts, the signal event rate detection is 32% efficient overall above MeV (and 0% efficient below). The fiducial volume cuts are used to mitigate the radiogenic backgrounds from the stainless steel detector vessel and rock surrounding the detector, and cosmogenic-induced radioactive isotopes. A smaller fiducial volume also limits events featuring IBD-induced neutron escape, and thus IBD misidentification background. The veto cuts are used to reject cosmogenics, and are based on the KamLAND muon veto selection described at Ref. Abe et al. (2011b). In summary, the dominant backgrounds are from solar neutrinos and misidentified IBD events. Solar-induced ES-like events are particularly significant at lower energies, approaching MeV, where signal is rapidly rising. In contrast to the IsoDAR@KamLAND expectation detailed in Ref. Conrad et al. (2014), 208Tl is a much smaller background due to the higher radiopurity envisioned in the Yemilab liquid scintillator.
VI.0.2 Angular reconstruction capability
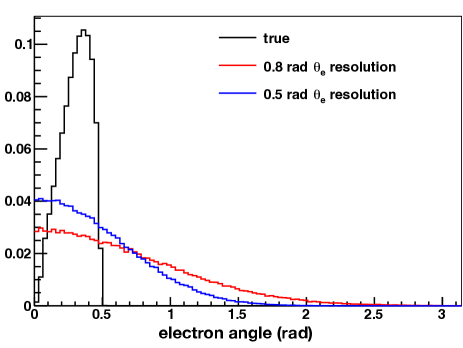
There is a possibility that the Yemilab detector could have angular reconstruction capabilities via some combination of fast-timing photosensors and/or Cerenkov-sensitive photosensors and/or water-based (or dilute) liquid scintillator Seo (2019). Along with allowing energy reconstruction, the additional ability to reconstruct the direction of the electron in ES events would be a powerful way to mitigate background since the signal electron is very forward (see Fig. 14) and can be pointed back to the IsoDAR target-sleeve source. Background events from IBD-induced positrons from the IsoDAR target-sleeve can be considered isotropic. Backgrounds from solar neutrino ES events, however, are not isotropic; they will generally point directly away from the Sun. Therefore, solar neutrino ES events will be most likely to pass an angular selection cut only during the parts of the day and year where the Sun is behind the target-to-detector line. The IsoDAR@Yemilab beam-to-detector orientation will be roughly east-to-west aligned, which will mean data taken at sunrise will have significantly more solar neutrino backgrounds than data taken at other times of the day.
Notably, while these detector “improvements” would enable electron angular reconstruction, it is also possible that energy and vertex resolution could also be affected, perhaps negatively, by these significant detector changes. For simplicity, we ignore this possibility and maintain the energy and vertex resolutions assumed above when calculating the weak mixing angle sensitivity under this alternative scenario featuring angular reconstruction. The true electron angle and reconstructed angle under two angular resolution assumptions in ES events are shown in Fig. 14. With an angular resolution of 0.5 rad, reasonably consistent with what might be expected with the use of water-based liquid scintillator, and a simplistic signal selection criterion of rad, the ES analysis would be 90% efficient in selecting signal while reducing the isotropic and solar neutrino backgrounds by a factor of 3. This alternative scenario is considered below when calculating IsoDAR@Yemilab’s sensitivity to and NSI.
| Event type | Counts |
|---|---|
| ( MeV)/ 5 years | |
| 8B solar | 2531 |
| 8Li spallation | 270 |
| 8B spallation | 121 |
| 11Be spallation | 1393 |
| rock | 683 |
| stainless | 291 |
| 208Tl | 84 |
| IBD | 2013 |
| Total background | 7387 |
| - signal | 6977 |
VI.0.3 Analysis
As discussed above, the ES differential cross section depends on , , , and NSI parameters. Here, we quote the sensitivity to (1) , assuming no NSI, and (2) NSI parameters, while setting to be a constant. For determining the sensitivity to , we perform a fit to the ES signal+background, while relying on expected in-situ measurements to provide the normalization of both the antineutrino flux and the beam-on (IBD) background, as well as beam-off measurements (statistical-error only) of steady-state backgrounds. Based on the expected IBD inefficiency discussed above, the misidentified IBD background is estimated as of the entire IBD event collection.
We estimate the measurement sensitivity of IsoDAR@Yemilab following the methodology outlined in Ref. Conrad et al. (2014). Signal and background events are binned together by in 0.5 MeV bins from 3 MeV to 14 MeV. To estimate the uncertainty achievable on a measurement of , we perform a fit using a statistic. In determining sensitivity, we assume the best fit corresponds to the signal, with , and the backgrounds presented above.
Following Ref. Conrad et al. (2014), we write in the following way. For the th bin in terms of , we let be the number of elastic scattering events at . We also define as beam-on backgrounds (IBD) and as non-beam backgrounds (solar, radiogenic, cosmogenic) for the th bin. The number of events in this bin is
| (12) |
With and , we have:
| (13) |
The normalization uncertainties for the ES signal and the IBD misidentification background events are included using the pull parameters and , respectively. is constrained by the uncertainty in the IBD efficiency as . is the uncertainty in the misidentified IBD background, determined above to be 0.25% of the IBD sample, and we estimate a conservative uncertainty on this value. Statistical uncertainties on the beam-off backgrounds are included in the fit as well.
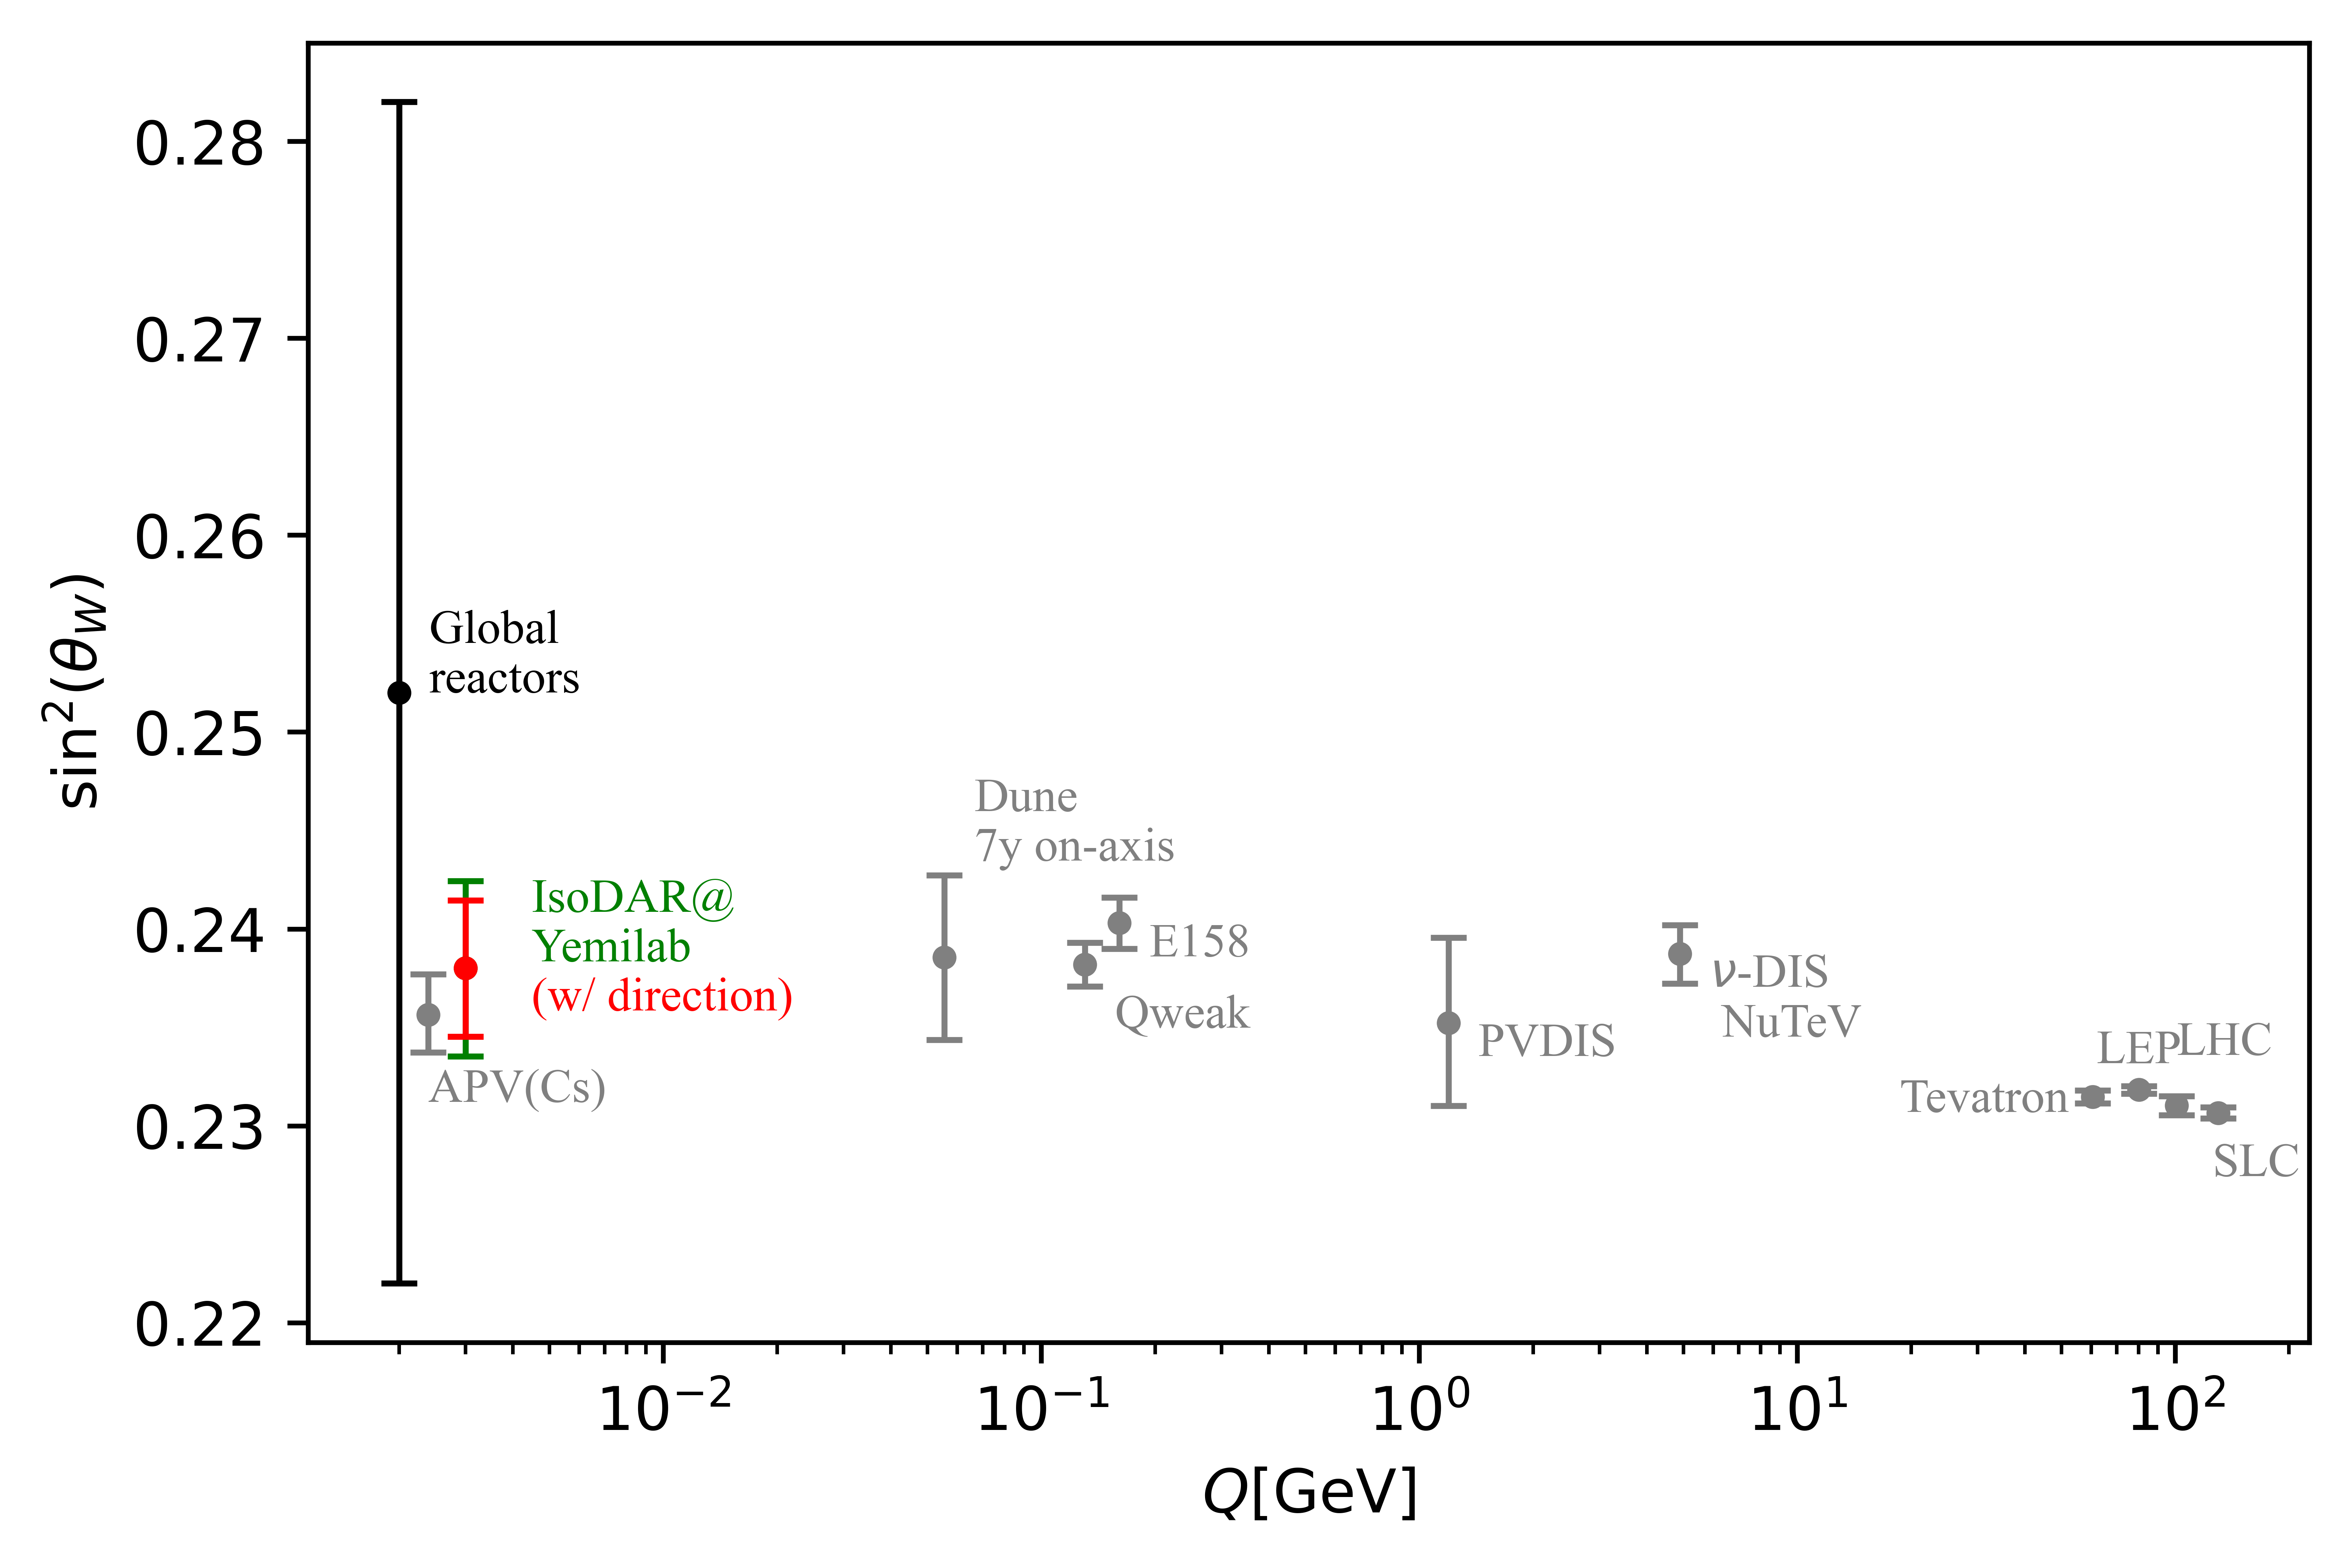
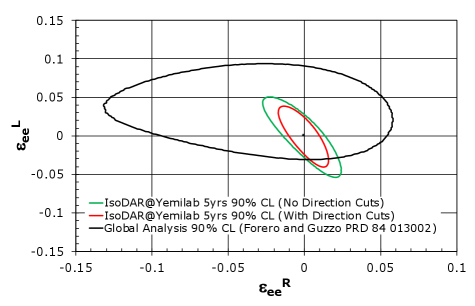
The fitting results show that the IsoDAR@Yemilab experiment can expect a sensitivity of 0.0045 (1.9% measurement), using rate and energy-shape information and including statistical and systematic uncertainties, in 5 years of running. As can be seen in Fig. 15, this sensitivity would improve upon the current global reactor measurement of Cañas et al. (2016) by nearly an order of magnitude. This can also be compared to that which is expected in the IsoDAR@KamLAND configuration of a 3.2% measurement (rate+shape) Conrad et al. (2014). In the alternative scenario considered, with the ability to reconstruct the electron angle, the IsoDAR@Yemilab sensitivity in terms of would improve to 0.0035 (1.5% measurement). In terms of an NSI search, after fixing , the achievable sensitivity to the NSI non-universal parameters in both the w/ and w/o directional reconstruction capability scenarios is shown in Fig. 16. As can be seen, the IsoDAR@Yemilab experiment would provide greatly improved sensitivity to NSI as compared to a current global fit Forero and Guzzo (2011).
VII Conclusions
The IsoDAR electron antineutrino source combined with a kiloton-scale detector at Yemilab would provide unprecedented sensitivity to new physics via (1) a search for short-baseline oscillations, including initial-state wavepacket effects, and the ability to trace the wave with a collection of -induced IBD events; (2) a search for other unexpected deviations in this IBD sample (e.g. a bump hunt), which are, for example, motivated by theory models involving light mass mediators, and experiment, including the X17 particle and the 5 MeV reactor bump anomalies; and (3) a precision measurement of -induced electron scattering events as an electroweak probe and search for non-standard neutrino interactions. The latter measurement would be significantly enhanced by the detector’s potential capability to reconstruct the direction of signal electrons. These physics studies would greatly improve upon existing measurements, in particular, at a level approaching an order of magnitude in both sterile-oscillation and weak-mixing-angle/NSI sensitivity.
VIII Acknowledgements
We thank P. Denton and M. Hostert for useful discussions. CAA is supported by the Faculty of Arts and Sciences of Harvard University, and the Alfred P. Sloan Foundation. JMC and DW are supported by National Science Foundation award #1912764. YDK and SHS are supported by IBS-R016-D1. JS is supported by National Science Foundation award #2012897. MHS is supported by National Science Foundation award #PHY-2013070.
References
- Hostert et al. (2022) M. Hostert, D. McKeen, M. Pospelov, and N. Raj, (2022), arXiv:2201.02603 [hep-ph] .
- Abs et al. (2015) M. Abs et al., (2015), arXiv:1511.05130 [physics.acc-ph] .
- Alonso et al. (2019) J. R. Alonso, R. Barlow, J. M. Conrad, and L. H. Waites, Nature Reviews Physics 1, 533 (2019).
- Bungau et al. (2012) A. Bungau et al., Phys. Rev. Lett. 109, 141802 (2012).
- Alonso et al. (2021) J. R. Alonso et al., (2021), arXiv:2110.10635 [physics.ins-det] .
- Alonso et al. (2022) J. R. Alonso et al., (2022), arXiv:2201.10040 [physics.ins-det] .
- Gando et al. (2013a) A. Gando et al. (KamLAND), Phys. Rev. D 88, 033001 (2013a), arXiv:1303.4667 [hep-ex] .
- Conrad et al. (2014) J. M. Conrad, M. H. Shaevitz, I. Shimizu, J. Spitz, M. Toups, and L. Winslow, Phys. Rev. D 89, 072010 (2014).
- Aguilar-Arevalo et al. (2021) A. A. Aguilar-Arevalo et al. (MiniBooNE Collaboration), Phys. Rev. D 103, 052002 (2021).
- Aguilar-Arevalo et al. (2013) A. A. Aguilar-Arevalo et al. (MiniBooNE Collaboration), Phys. Rev. Lett. 110, 161801 (2013).
- Athanassopoulos et al. (1995) C. Athanassopoulos et al., Phys. Rev. Lett. 75, 2650 (1995).
- Athanassopoulos et al. (1996) C. Athanassopoulos et al. (LSND Collaboration), Phys. Rev. Lett. 77, 3082 (1996).
- Athanassopoulos et al. (1998) C. Athanassopoulos et al. (LSND Collaboration), Phys. Rev. Lett. 81, 1774 (1998).
- Mention et al. (2011a) G. Mention, M. Fechner, T. Lasserre, T. A. Mueller, D. Lhuillier, M. Cribier, and A. Letourneau, Phys. Rev. D 83, 073006 (2011a).
- Giunti and Laveder (2011) C. Giunti and M. Laveder, Phys. Rev. C 83, 065504 (2011).
- Barinov et al. (2021a) V. V. Barinov et al., (2021a), arXiv:2109.11482 [nucl-ex] .
- Aartsen et al. (2020) M. G. Aartsen et al. (IceCube Collaboration), Phys. Rev. Lett. 125, 141801 (2020).
- Gninenko (2009) S. N. Gninenko, Phys. Rev. Lett. 103, 241802 (2009).
- Gninenko and Gorbunov (2010) S. N. Gninenko and D. S. Gorbunov, Phys. Rev. D 81, 075013 (2010).
- Bai et al. (2016) Y. Bai, R. Lu, S. Lu, J. Salvado, and B. A. Stefanek, Phys. Rev. D 93, 073004 (2016).
- Moss et al. (2018) Z. Moss et al., Phys. Rev. D 97, 055017 (2018).
- Bertuzzo et al. (2018) E. Bertuzzo et al., Phys. Rev. Lett. 121, 241801 (2018).
- Ballett et al. (2019) P. Ballett, S. Pascoli, and M. Ross-Lonergan, Phys. Rev. D 99, 071701 (2019).
- Fischer et al. (2020) O. Fischer, A. Hernández-Cabezudo, and T. Schwetz, Phys. Rev. D 101, 075045 (2020).
- Moulai et al. (2020a) M. H. Moulai, C. A. Argüelles, G. H. Collin, J. M. Conrad, A. Diaz, and M. H. Shaevitz, Phys. Rev. D 101, 055020 (2020a).
- Dentler et al. (2020) M. Dentler, I. Esteban, J. Kopp, and P. Machado, Phys. Rev. D 101, 115013 (2020).
- de Gouvêa et al. (2020a) A. de Gouvêa, O. L. G. Peres, S. Prakash, and G. V. Stenico, JHEP 07, 141 (2020a), arXiv:1911.01447 [hep-ph] .
- Datta et al. (2020) A. Datta, S. Kamali, and D. Marfatia, Phys. Lett. B 807, 135579 (2020), arXiv:2005.08920 [hep-ph] .
- Moulai (2021) M. H. Moulai, Light, Unstable Sterile Neutrinos: Phenomenology, a Search in the IceCube Experiment, and a Global Picture, Ph.D. thesis, MIT (2021), arXiv:2110.02351 [hep-ex] .
- Ashenfelter et al. (2019) J. Ashenfelter et al. (PROSPECT), Phys. Rev. Lett. 122, 251801 (2019), arXiv:1812.10877 [nucl-ex] .
- Almazán et al. (2020) H. Almazán et al. (STEREO Collaboration), Phys. Rev. D 102, 052002 (2020).
- Ko et al. (2017) Y. J. Ko et al. (NEOS), Phys. Rev. Lett. 118, 121802 (2017), arXiv:1610.05134 [hep-ex] .
- Choi et al. (2016) J. H. Choi et al. (RENO Collaboration), Phys. Rev. Lett. 116, 211801 (2016).
- An et al. (2016a) F. P. An et al. (Daya Bay Collaboration), Phys. Rev. Lett. 116, 061801 (2016a).
- Abe et al. (2016) Y. Abe et al. (Double Chooz), JHEP 01, 163 (2016), arXiv:1510.08937 [hep-ex] .
- Krasznahorkay et al. (2016) A. J. Krasznahorkay et al., Phys. Rev. Lett. 116, 042501 (2016), arXiv:1504.01527 [nucl-ex] .
- Zeller et al. (2002) G. P. Zeller et al., Phys. Rev. Lett. 88, 091802 (2002).
- Schael et al. (2006) S. Schael et al. (ALEPH, DELPHI, L3, OPAL, SLD, LEP Electroweak Working Group, SLD Electroweak Group, SLD Heavy Flavour Group), Phys. Rept. 427, 257 (2006), arXiv:hep-ex/0509008 .
- Reines et al. (1976) F. Reines, H. S. Gurr, and H. W. Sobel, Phys. Rev. Lett. 37, 315 (1976).
- Deniz et al. (2010) M. Deniz et al. (TEXONO Collaboration), Phys. Rev. D 81, 072001 (2010).
- Derbin et al. (1993) A. I. Derbin et al., JETP Lett. 57, 768 (1993).
- Daraktchieva et al. (2005) Z. Daraktchieva et al. (MUNU), Phys. Lett. B 615, 153 (2005), arXiv:hep-ex/0502037 .
- Allen et al. (1993) R. C. Allen et al., Phys. Rev. D 47, 11 (1993).
- Gando et al. (2011) A. Gando et al. (KamLAND), Phys. Rev. D 83, 052002 (2011), arXiv:1009.4771 [hep-ex] .
- Gando et al. (2013b) A. Gando et al. (KamLAND Collaboration), Phys. Rev. D 88, 033001 (2013b).
- Bungau et al. (2019) A. Bungau, J. Alonso, L. Bartoszek, J. Conrad, M. Shaevitz, and J. Spitz, JINST 14, P03001 (2019), arXiv:1805.00410 [physics.ins-det] .
- Agostinelli et al. (2003) S. Agostinelli et al. (GEANT4), Nucl. Instrum. Meth. A 506, 250 (2003).
- Kopp et al. (2013) J. Kopp, P. A. N. Machado, M. Maltoni, and T. Schwetz, JHEP 05, 050 (2013), arXiv:1303.3011 [hep-ph] .
- Agarwalla et al. (2011) S. K. Agarwalla, J. M. Conrad, and M. H. Shaevitz, JHEP 12, 085 (2011), arXiv:1105.4984 [hep-ph] .
- Mention et al. (2011b) G. Mention, M. Fechner, T. Lasserre, T. A. Mueller, D. Lhuillier, M. Cribier, and A. Letourneau, Phys. Rev. D 83, 073006 (2011b), arXiv:1101.2755 [hep-ex] .
- Serebrov et al. (2021) A. P. Serebrov et al., Phys. Rev. D 104, 032003 (2021), arXiv:2005.05301 [hep-ex] .
- Barinov et al. (2021b) V. V. Barinov et al., (2021b), arXiv:2109.11482 [nucl-ex] .
- Barinov et al. (2022) V. V. Barinov et al., (2022), arXiv:2201.07364 [nucl-ex] .
- Kaether et al. (2010) F. Kaether, W. Hampel, G. Heusser, J. Kiko, and T. Kirsten, Phys. Lett. B 685, 47 (2010), arXiv:1001.2731 [hep-ex] .
- Abdurashitov et al. (2009) J. N. Abdurashitov et al. (SAGE), Phys. Rev. C 80, 015807 (2009), arXiv:0901.2200 [nucl-ex] .
- Diaz et al. (2020) A. Diaz, C. Arguelles, G. Collin, J. Conrad, and M. Shaevitz, Phys.Rept. 884, 1 (2020), arXiv:1906.00045 [hep-ex] .
- Andriamirado et al. (2021) M. Andriamirado et al. (PROSPECT), Phys. Rev. D 103, 032001 (2021), arXiv:2006.11210 [hep-ex] .
- Atif et al. (2020) Z. Atif et al. (RENO, NEOS), (2020), arXiv:2011.00896 [hep-ex] .
- Maltoni and Schwetz (2003) M. Maltoni and T. Schwetz, Phys. Rev. D 68, 033020 (2003), arXiv:hep-ph/0304176 .
- Brdar and Kopp (2021) V. Brdar and J. Kopp, (2021), arXiv:2109.08157 [hep-ph] .
- Abratenko et al. (2021) P. Abratenko et al. (MicroBooNE), (2021), arXiv:2110.14054 [hep-ex] .
- Denton (2021) P. B. Denton, (2021), arXiv:2111.05793 [hep-ph] .
- Moulai et al. (2020b) M. Moulai, C. Arguelles, G. Collin, J. Conrad, A. Diaz, and M. Shaevitz, Phys.Rev. D101, 055020 (2020b), arXiv:1910.13456 [hep-ph] .
- Argüelles et al. (2022) C. A. Argüelles, T. Bertólez-Martínez, and J. Salvado, (2022), arXiv:2201.05108 [hep-ph] .
- de Gouvêa et al. (2021) A. de Gouvêa, V. De Romeri, and C. A. Ternes, JHEP 06, 042 (2021), arXiv:2104.05806 [hep-ph] .
- An et al. (2016b) F. P. An et al. (Daya Bay), Phys. Rev. Lett. 117, 151802 (2016b), arXiv:1607.01174 [hep-ex] .
- An et al. (2017) F. P. An et al. (Daya Bay), Phys. Rev. D 95, 072006 (2017), arXiv:1610.04802 [hep-ex] .
- Bauer et al. (2018) M. Bauer, P. Foldenauer, and J. Jaeckel, JHEP 07, 094 (2018), arXiv:1803.05466 [hep-ph] .
- Dutta et al. (2019) B. Dutta, S. Ghosh, and J. Kumar, Phys. Rev. D 100, 075028 (2019), arXiv:1905.02692 [hep-ph] .
- Datta et al. (2019) A. Datta, B. Dutta, S. Liao, D. Marfatia, and L. E. Strigari, JHEP 01, 091 (2019), arXiv:1808.02611 [hep-ph] .
- Delle Rose et al. (2019a) L. Delle Rose, S. Khalil, S. J. D. King, S. Moretti, and A. M. Thabt, Phys. Rev. D 99, 055022 (2019a), arXiv:1811.07953 [hep-ph] .
- Dutta et al. (2021) B. Dutta, D. Kim, A. Thompson, R. T. Thornton, and R. G. Van de Water, (2021), arXiv:2110.11944 [hep-ph] .
- Escudero (2019) M. Escudero, JCAP 02, 007 (2019), arXiv:1812.05605 [hep-ph] .
- Aristizabal Sierra et al. (2019) D. Aristizabal Sierra, B. Dutta, S. Liao, and L. E. Strigari, JHEP 12, 124 (2019), arXiv:1910.12437 [hep-ph] .
- Bœhm et al. (2019) C. Bœhm, D. G. Cerdeño, P. A. N. Machado, A. Olivares-Del Campo, E. Perdomo, and E. Reid, JCAP 01, 043 (2019), arXiv:1809.06385 [hep-ph] .
- Avignone et al. (1988) F. T. Avignone, C. Baktash, W. C. Barker, F. P. Calaprice, R. W. Dunford, W. C. Haxton, D. Kahana, R. T. Kouzes, H. S. Miley, and D. M. Moltz, Phys. Rev. D 37, 618 (1988).
- Feng et al. (2017) J. L. Feng, B. Fornal, I. Galon, S. Gardner, J. Smolinsky, T. M. P. Tait, and P. Tanedo, Phys. Rev. D 95, 035017 (2017), arXiv:1608.03591 [hep-ph] .
- Dent et al. (2022) J. B. Dent et al., Phys. Rev. D 105, 015030 (2022), arXiv:2105.07007 [hep-ph] .
- Cadeddu et al. (2021) M. Cadeddu, N. Cargioli, F. Dordei, C. Giunti, Y. F. Li, E. Picciau, and Y. Y. Zhang, JHEP 01, 116 (2021), arXiv:2008.05022 [hep-ph] .
- us (2022) A detailed work on this topic is under preparation, (2022).
- Gulyás et al. (2016) J. Gulyás, T. J. Ketel, A. J. Krasznahorkay, M. Csatlós, L. Csige, Z. Gácsi, M. Hunyadi, A. Krasznahorkay, A. Vitéz, and T. G. Tornyi, Nucl. Instrum. Meth. A 808, 21 (2016), arXiv:1504.00489 [nucl-ex] .
- Aleksejevs et al. (2021) A. Aleksejevs, S. Barkanova, Y. G. Kolomensky, and B. Sheff, (2021), arXiv:2102.01127 [hep-ph] .
- Delle Rose et al. (2019b) L. Delle Rose, S. Khalil, S. J. D. King, and S. Moretti, Front. in Phys. 7, 73 (2019b), arXiv:1812.05497 [hep-ph] .
- Bak et al. (2019) G. Bak et al. (RENO), Phys. Rev. Lett. 122, 232501 (2019), arXiv:1806.00574 [hep-ex] .
- Adey et al. (2019) D. Adey et al. (Daya Bay), Phys. Rev. Lett. 123, 111801 (2019), arXiv:1904.07812 [hep-ex] .
- Huber (2011) P. Huber, Phys. Rev. C 84, 024617 (2011), [Erratum: Phys.Rev.C 85, 029901 (2012)], arXiv:1106.0687 [hep-ph] .
- Mueller et al. (2011) T. A. Mueller et al., Phys. Rev. C 83, 054615 (2011), arXiv:1101.2663 [hep-ex] .
- Berryman et al. (2019) J. M. Berryman, V. Brdar, and P. Huber, Phys. Rev. D 99, 055045 (2019), arXiv:1803.08506 [hep-ph] .
- Giunti and Studenikin (2009) C. Giunti and A. Studenikin, Phys. Atom. Nucl. 72, 2089 (2009), arXiv:0812.3646 [hep-ph] .
- Baha Balantekin and Kayser (2018) A. Baha Balantekin and B. Kayser, Ann. Rev. Nucl. Part. Sci. 68, 313 (2018), arXiv:1805.00922 [hep-ph] .
- Voloshin (1988) M. B. Voloshin, Sov. J. Nucl. Phys. 48, 512 (1988).
- Leurer and Marcus (1990) M. Leurer and N. Marcus, Physics Letters B 237, 81 (1990).
- Shoemaker and Wyenberg (2019) I. M. Shoemaker and J. Wyenberg, Phys. Rev. D 99, 075010 (2019), arXiv:1811.12435 [hep-ph] .
- Brdar et al. (2021) V. Brdar, A. Greljo, J. Kopp, and T. Opferkuch, JCAP 01, 039 (2021), arXiv:2007.15563 [hep-ph] .
- Erler and Su (2013) J. Erler and S. Su, Prog. Part. Nucl. Phys. 71, 119 (2013), arXiv:1303.5522 [hep-ph] .
- Webber (2011) D. M. Webber (MuLan), in Meeting of the APS Division of Particles and Fields (2011) arXiv:1109.6689 [hep-ex] .
- Davidson et al. (2003) S. Davidson, C. Pena-Garay, N. Rius, and A. Santamaria, JHEP 03, 011 (2003), arXiv:hep-ph/0302093 .
- Abe et al. (2011a) K. Abe et al. (Super-Kamiokande), Phys. Rev. D 83, 052010 (2011a), arXiv:1010.0118 [hep-ex] .
- Tilley et al. (2004) D. Tilley, J. Kelley, J. Godwin, D. Millener, J. Purcell, C. Sheu, and H. Weller, Nuclear Physics A 745, 155 (2004).
- Ajzenberg-Selove (1990) F. Ajzenberg-Selove, Nucl. Phys. A 506, 1 (1990).
- Abe et al. (2010) S. Abe et al. (KamLAND), Phys. Rev. C 81, 025807 (2010), arXiv:0907.0066 [hep-ex] .
- Abe et al. (2011b) S. Abe et al. (KamLAND), Phys. Rev. C 84, 035804 (2011b), arXiv:1106.0861 [hep-ex] .
- Seo (2019) S.-H. Seo, (2019), arXiv:1903.05368 [physics.ins-det] .
- Cañas et al. (2016) B. C. Cañas, E. A. Garcés, O. G. Miranda, M. Tortola, and J. W. F. Valle, Phys. Lett. B 761, 450 (2016), arXiv:1608.02671 [hep-ph] .
- Forero and Guzzo (2011) D. V. Forero and M. M. Guzzo, Phys. Rev. D 84, 013002 (2011).
- de Gouvêa et al. (2020b) A. de Gouvêa, P. A. N. Machado, Y. F. Perez-Gonzalez, and Z. Tabrizi, Phys. Rev. Lett. 125, 051803 (2020b).
- Abed Abud et al. (2021) A. Abed Abud et al. (DUNE), Instruments 5, 31 (2021), arXiv:2103.13910 [physics.ins-det] .