Neutrino searches with the IceCube telescope.
Abstract
The IceCube Neutrino Observatory is an array of 5,160 photomultipliers (PMTs) deployed on 86 strings at 1.5-2.5 km depth within the ice at the South Pole. The main goal of the IceCube experiment is the detection of an astrophysical neutrino signal. In this contribution we present the results of the point source analysis on the data taken from April 2008 to May 2011, when three detector configurations were operated: the 40-string configuration (IC-40), the 59-string configuration (IC-59) and the 79-string configuration (IC-79). No significant excess indicative of point sources of neutrinos has been found, and we present upper limits for an muon neutrino flux for a list of candidate sources. For the first time these limits start to reach TeV-1 cm-2 s-1 in some parts of the sky.
keywords:
neutrino astronomy , point-sources , cosmic rays originNuclear Physics B Proceedings Supplement \runauth \jidnuphbp \jnltitlelogoNuclear Physics B Proceedings Supplement
1 Introduction
The origin of Cosmic Rays (CRs) is still one of the unresolved questions of modern physics. The detection of a point source of neutrinos could not only prove the hadronic acceleration models responsible for CR emission but also identify the sources of these CRs. The IceCube neutrino telescope is located at the South Pole aiming at the detection of astrophysical neutrinos originating in the same environment as CRs. An array of 5,160 photomultipliers (PMTs) has been deployed in the antarctic ice in order to detect the Cherenkov light emitted by the secondary muon produced in muon neutrino interaction in the vicinity of the detector. The energy and direction of the secondary muon is inferred by the amount of light collected by the PMTs and the geometrical properties of the Cherenkov emission. This direction is, on average, very close to the direction of the parent neutrino, specially for 10 TeV, and therefore the IceCube detector can work as a neutrino telescope. In Sec. 2 of these proceedings we describe the three data samples used in this analysis. The likelihood method used for the search of point neutrino sources is explained in Sec. 3 and the results are given in Sec. 4. Conclusions are given in Sec. 5.
2 Detector and event selection.
One of the most important steps in neutrino analysis is to remove the large atmospheric muon background. A significant part of this reduction is achieved at the South Pole by rejecting poorly reconstructed up-going events from the northern sky and selecting high energy down-going muons in the southern sky. However, these online filters are not enough to obtain an event selection suitable for neutrino analysis. Further processing is needed including the addition of more CPU consuming track reconstructions and algorithms. In this analysis we use three different geometries of the IceCube detector over the last three years and therefore the event selections for these three periods are different.
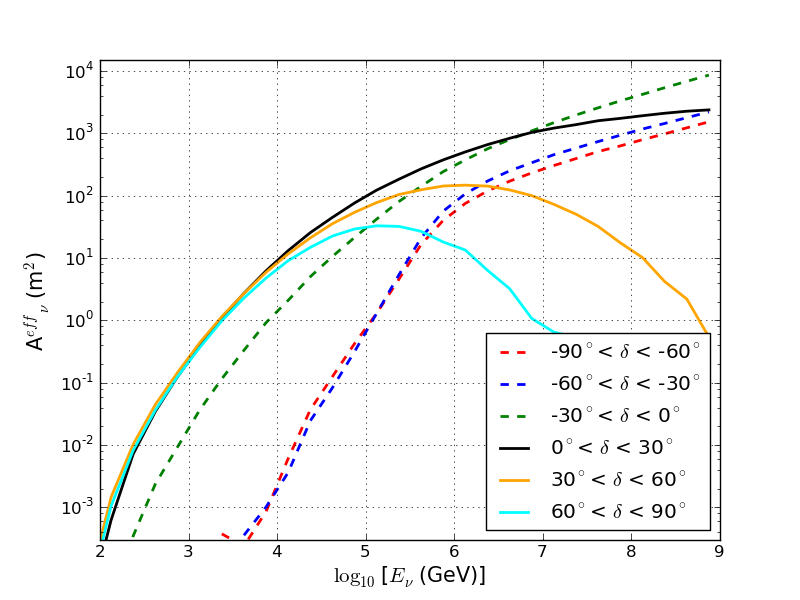
The event selection in IC-40 data was done by cutting on observables with discrimination power between signal (generally an E-2 neutrino signal) and background (atmospheric neutrinos and muons). The details of this event selection can be found in Ref. [1]. A multi-variate classification algorithm was used for the event selections in IC-59 and IC-79. A Boosted Decision Tree (BDT) [2] classifies events as signal-like or background-like based on a large number of detector observables. For the northern sky 12 and 17 variables were used in the BDT training for the IC-59 and IC-79 periods respectively. The southern sky in the IC-59 dataset was, however, filtered using a cut on the energy estimator as a function of the zenith angle to separate the large amount of down-going atmospheric muons from a hypothetical neutrino signal with a harder spectrum. In the IC-79 dataset a combination of a BDT cut and a zenith dependent energy cut was applied. Figure 1 shows the muon neutrino effective area of the IC-79 sample for different declination bands as a function of the neutrino energy.
The different data rates for the three periods at different levels can be seen in Table 1.
| Conf. | Year | tlive [days] | SMT [Hz] | |
|---|---|---|---|---|
| 40 | 2008 | 376 | 1100 | 40/day |
| 59 | 2009 | 348 | 1900 | 120/day |
| 79 | 2010 | 316 | 2300 | 180/day |
3 Likelihood method for point source search
In this search an unbinned maximum likelihood ratio test [3] was used in order to calculate the significance of an excess of neutrinos above the background for a given direction in the sky. The signal () and background () probability density functions are modeled using simulation and scrambled real data, respectively. Since three geometries and event selections were combined, the density distribution of the event in the sample with energy and distance to the source , is given by:
| (1) |
where represents the three different event selections, IC-40, IC-59 and IC-79. The total number of events in the data set, , satisfies the condition , where is the total number of events in the three samples. The signal is considered to follow the uniform hypothesis among data sets and therefore the spectral index meets the condition of . The fitted number of signal events in each sample are also fixed relative to each other, according to the signal hypothesis tested and the resulting fraction of total signal events expected in each sample. For the all-sky survey, the likelihood is evaluated in each direction in the sky in steps of 0.1 centered at the position of the source . The significance of any excess found in the northern sky is corrected for trials by determining the fraction of scrambled data sets which contain an excess of equal or higher significance also in the northern part of the sky. Likewise, the most significant excess found in the southern sky is reported and the post-trial significance is calculated by comparing it with the fraction of scrambled data sets with an excess of equal or higher significance in that part of the sky.
4 Results
The results of the all-sky scan are shown in the pre-trial significance map in Figure 2. The most significant deviation in the northern sky has a pre-trial -value of 1.96 10-5 and is located at 34.25∘ r.a. and dec. Similarly, the most significant deviation in the southern sky has a pre-trial -value of 8.97 10-5 and is located at 219.25∘ r.a. and dec. The post-trial probabilities calculated as the fraction of scrambled sky maps with at least one spot with an equal or higher significance for each region of the sky correspond to 57% and 98% for the northern and the southern spots respectively and therefore both excesses are well compatible with the background hypothesis.
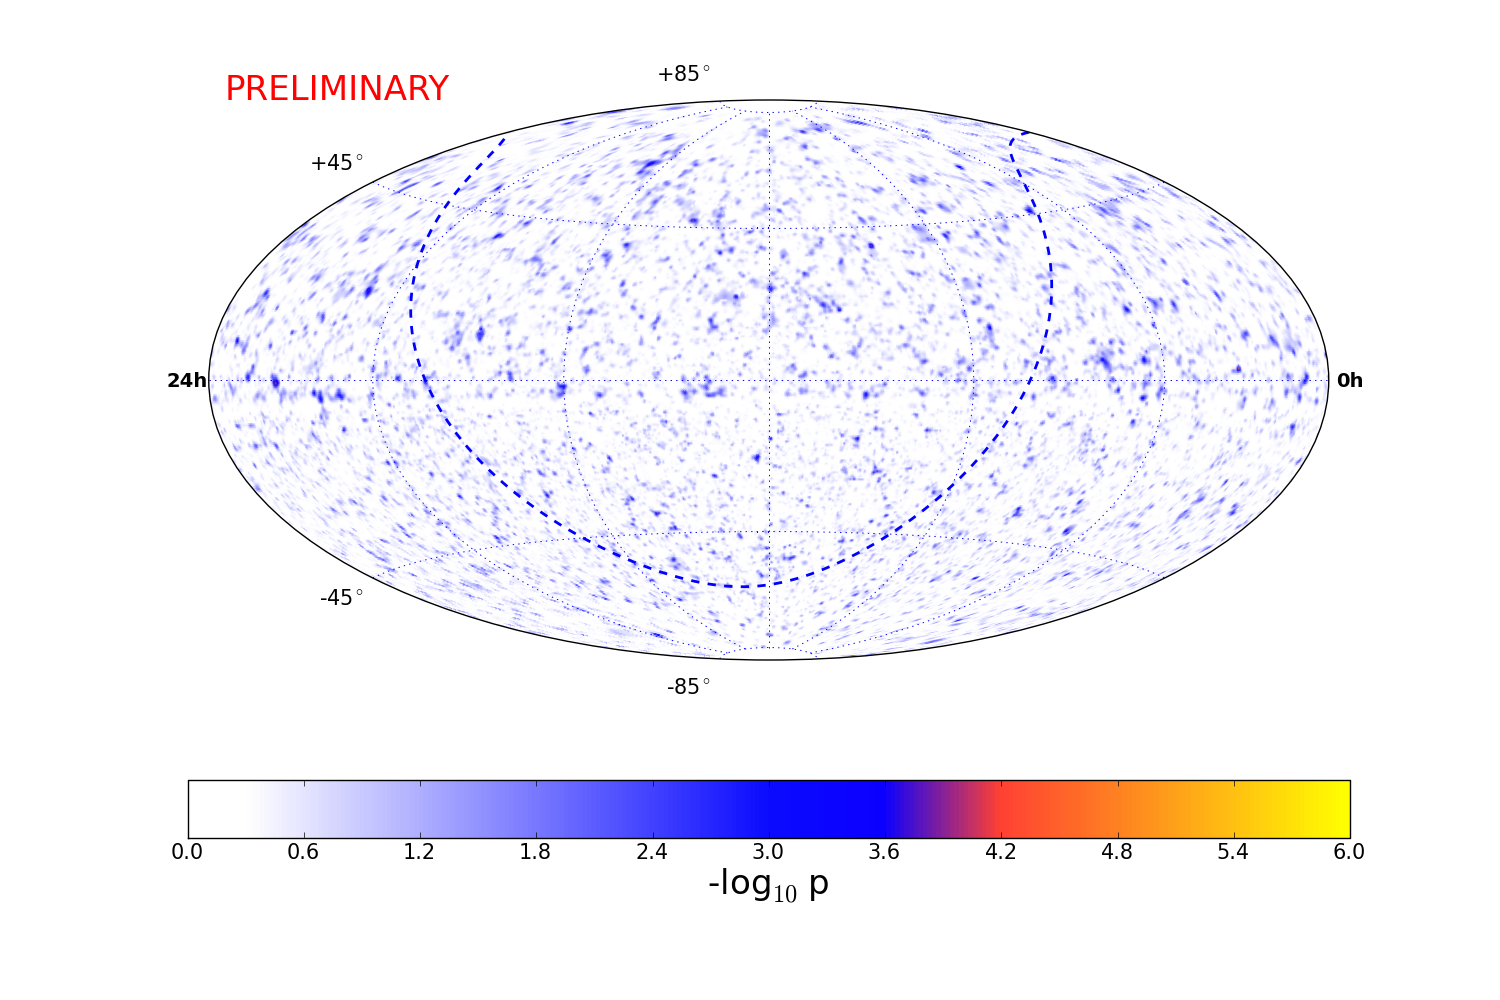
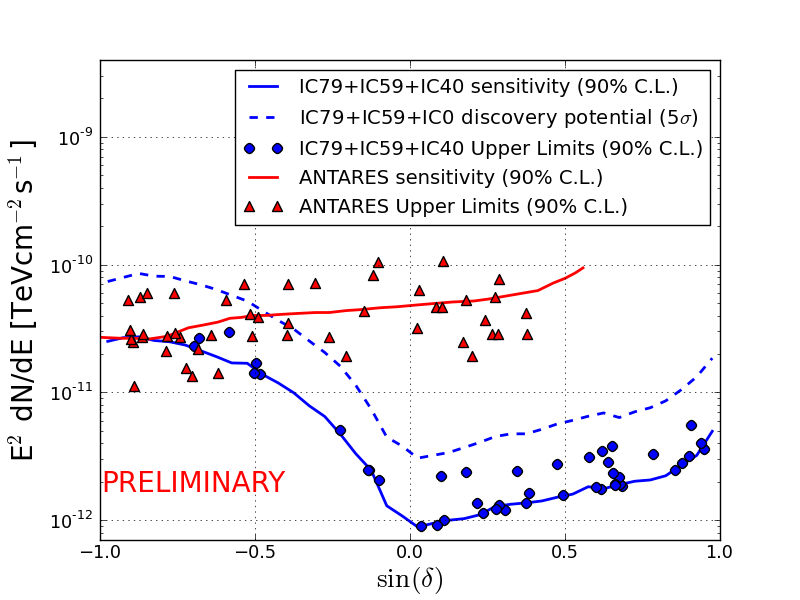
Figure 3 shows the muon neutrino flux upper limits calculated at 90% C.L. based on the classical (frequentist) approach [4] for each of the sources on a candidate list. Also shown is the median upper limit (sensitivity) for each declination for a live-time of 1,040 days and the discovery potential flux for a 5 confidence level. The 90% C.L. muon neutrino upper limits and sensitivities from ANTARES [5] correspond to the analysis of 813 days of data.
5 Conclusions
We presented the results of the point source analysis using the data-sets corresponding to three different IceCube configurations. The combined data has a total live-time of 1,040 days. The search for neutrino point sources found no evidence of a neutrino signal. Both the north and the south hot spots have post-trial probabilities compatible with background fluctuations. The muon neutrino upper limits presented here are a factor better than the latest published upper limits by IceCube [1] and are the most competitive neutrino limits to date over the majority of the sky.
References
- [1] R. Abbasi et al. [IceCube Coll.], Astrop. J., 732 (2011) 18.
- [2] S. S. Kerthi et al., Neural Comp. 13 (2001) 637.
- [3] J. Braun et al., Astropart. Phys., 33 (2010) 175.
- [4] J. Neyman. Phi. Tran. of the Royal Soc. of London Ser A, 236 (1937) 333-380.
- [5] S. Adrián-Martínez et al. [ANTARES Coll.] , Submitted to Astrop. J., (2012) arXiv:1207.3105