New approach to broad line region radius in Mrk142 after considering potential short-term optical transient quasi-periodic oscillations
Abstract
Mrk142 has been known as the only outlier in R-L space (correlation between BLRs (broad line regions) radii and continuum luminosity) among the low redshift local reverberation mapped broad line AGNs (BLAGNs) with moderate accretion rates, due to its BLRs radius smaller than R-L expected value. Here, considering probable optical transient quasi-periodic oscillations (QPOs), a new approach to assessing the BLRs radius can be considered. Reliable transient QPOs in high-energy emissions from black hole vicinity have been reported in several normal AGNs, however there are so-far few short-term low-energy optical transient QPOs in normal BLAGNs (not the QPOs reported in blazars nor in AGNs harbouring binary BH systems). Through the photometric optical light curves well directly described by sinusoidal functions, we report probable short-term optical transient QPOs with periodicities around 14days and 43days in BLAGN Mrk142, indicating similar but scaled optical QPOs as those in high-energy bands. Considering the 14days QPOs related to reprocessing procedure, new approach to the BLRs radius can be estimated in Mrk142 through the reverberation mapping technique. The new BLRs radius of Mrk142 well follows the R-L relation, demonstrating the R-L relation is fundamental in local normal BLAGNs without ultra-high accretion rates.
keywords:
galaxies:active - galaxies:nuclei - quasars:emission lines - galaxies:Seyfert1 Introduction
Transient Quasar-Periodic Oscillations (QPOs) in high-energy emissions arising from general relativistic effects (relativistic Frame Dragging method (Cui et al., 1998), discoseismology method (Wagoner, 2012), etc.) related to central accretion disks have been seen in several Active Galactic Nuclei (AGNs) (Gierlinski et al., 2008; Lin et al., 2013; Pasham et al., 2014; Reines et al., 2016; Gupta et al., 2018). However, there are so-far rare reports on short-term low-energy optical transient QPOs in AGNs with periodicities of about days to tens of days, not similar as the reported optical QPOs with periodicities of years to tens of years in dozens of blazars (Bhatta, 2019; Otero-Santos et al., 2020) related to jet emissions/precessions nor similar as the optical QPOs in a few AGNs (Graham et al., 2015) harbouring binary supermassive black hole (BH) systems. There are so far few candidates of short-term optical transient QPOs in normal AGNs, such as the QPOs in KIC9650712 (Smith et al., 2018) but with low confidence level. Meanwhile, there are several reports on probably false optical QPOs in normal AGNs (Revalski et al., 2014; Do et al., 2009; Vaughan et al., 2016). Actually, either the general relativistic effects related to optical emission regions in accretion disks or the reprocessed high-energy emissions (Cackett et al., 2007; Gierlinski et al., 2009) to the observed optical emissions strongly indicate detectable optical transient QPOs in normal broad line AGNs (BLAGNs).
Timescales of short-term transient QPOs can be scaled with parameters of mass and spin of BH and radius of emission regions in different kinds of BH accreting systems (McHardy et al., 2006). From accreting systems in galactic X-ray binaries (van der Klis, 1989; Abramowicz et al., 2004; Remillard & McClintock, 2006; James et al., 2010; van den Eijnden et al., 2017) to accreting systems in normal BLAGNs, for quasi-periodic emissions from high-energy X-ray band to low-energy optical band, expected timescales of short-term optical transient QPOs could be around tens of days in normal BLAGNs with central supermassive BHs. To study short-term optical transient QPOs in normal BLAGNs could provide further information on structures of large-scale accretion flows far-away from central BHs.
Moreover, considering the reverberation mapping method (Blandford & McKee, 1982), in reverberation mapped BLAGNS (RMBLAGNs) (Kaspi et al., 2000; Zu et al., 2013; Bentz et al., 2009; Du et al., 2014; Grier et al., 2017), optical continuum (photometric) variability properties combining with properties of optical broad emission lines are commonly applied to estimate virial BH masses under the Virialization assumption (Peterson, 1993) to broad emission line regions (BLRs). Once short-term optical transient QPOs are detected in optical variabilities in normal RMBLAGNs, effects of optical transient QPOs could provide further corrected information on structures of BLRs, because optical QPOs will lead to multiple optional time lags (with time difference of expected periodicity of the QPOs) between continuum variabilities and broad line variabilities as the shown results in the manuscript. Here, we report so-far the first unique case with considering effects of probable short-term optical transient QPOs on determining BLRs radius in the normal BLAGN Mrk142. The main results and discussions are shown in Section 2 on the detected optical QPOs in the well-known RMBLAGN Mrk142. Then Section 3 shows our final conclusions.
2 Main results and Discussions
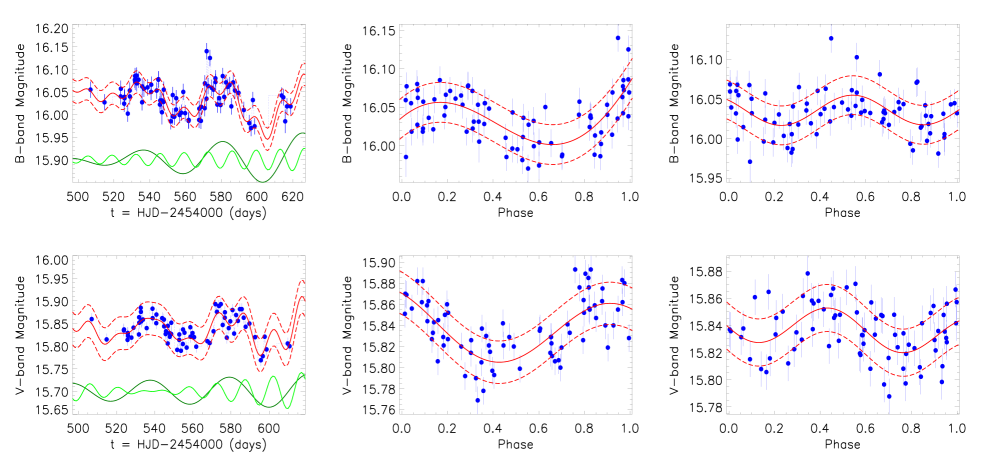
Mrk142 is one well-known RMBLAGN in the Lick AGN Monitoring Project (LAMP) (Bentz et al., 2013; Barth, 2015). Left panels of Fig. 1 show the ground-based high-quality photometric B-band and V-band light curves from Feb. to Jun. in 2008 (Walsh, 2009) in the LAMP, each light curve can be well described by one linear trend plus two sinusoidal signals with periodicities around 43days and 14days: and for the B-band light curve, and for the V-band light curve, through the Levenberg-Marquardt least-squares minimization technique. The best-fitting results to the observed photometric light curves can be well described by
| (1) |
. The best-fitting results lead ( as the summed squared weighted residuals, as the degrees of freedom) to be around 1.8. Actually, the same fitting procedure has been applied to the public light curves of the other RMBLAGNs in the projects of LAMP and AGNWATCH, Mrk142 is the unique RMBLAGN of which light curves can be well described by sinusoidal functions.
Meanwhile, the corresponding phase-folded light curves with periodicities of about 41days and about 16days (a bit larger than 14days) are shown in the middle and the right panels of Fig. 1. Each phase-folded curve can be well described by a sinusoidal function plus a linear trend. The best-fitting results by sinusoidal functions to both the observed and the phase-folded light curves indicate apparent QPOs in the optical emissions of Mrk142. Furthermore, amplitude of the sinusoidal signal with shorter periodicity included in each observed light curve is quite small, only about 1.5 times larger than the measured errors of observed light curve, but the well applied statistical F-test technique can tell that the sinusoidal signal with shorter periodicity is preferred with confidence level higher than 99.6% ( confidence levels), rather than by only the sinusoidal signal with longer periodicity plus a linear trend applied to describe each observed light curve. Similarly, the F-test technique can also determine the confidence level higher than 99.96% for the sinusoidal function plus a linear trend applied to describe each phase-folded light curve, rather than by only a linear trend applied.
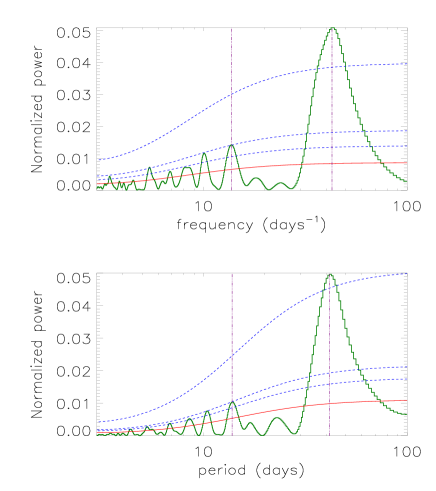
Moreover, the improved REDFIT method (Schulz & Mudelsee, 2002) considering intrinsic AGN variabilities dominated by red noises from random walk process (Kelly et al., 2009; Kozlowski et al., 2010; Zu et al., 2013) has been well applied to check and determine the QPOs included in the observed unevenly sampled B-band and V-band light-curves of Mrk142, shown in Fig. 2. The expected periodicities are around 43days and 14days through the REDFIT method, similar as the values through the best fitted results directly by sinusoidal functions shown in Fig. 1. Meanwhile, as the shown results in Fig. 2, there seems to be a possible periodicity of 10days, at equal confidence levels to the 14days. However, if 10days rather than the 14days applied in the shorter QPO signals, the calculated should be larger than 2, larger than the with 14days as the shorter periodicity. Furthermore, if 10days was considered as the shorter periodicity, there should be an apparent drop of the confidence levels from 99.96% to 80% for the sinusoidal function plus a linear trend applied to describe the phase-folded light curves with the shorter periodicity of 10days applied (such as the ones shown in the right panels of Fig 1), rather than by only a linear trend applied. Therefore, the periodicity of 14days is preferred in the manuscript. Based on the results through the REDFIT method, the significance levels for the periodicities around 14days and 43days are higher than 85% and 99%, indicating the quasi-periodic variabilities are reliable to some extent. Meanwhile, based on the power spectra in Fig. 2, there are much different qualities ( and as the periodicity and the corresponding full width at half maximum) of the two periodicities, and for the periodicity of around 43days and of around 14days, respectively, indicating the two periodicities are related to emissions from different emission processes and/or to emissions from different emission regions.
Particularly based on the results from the best-fitting results directly by the sinusoidal signals shown in Fig. 1, the optical transient QPOs can be detected, especially the quasi-periodic variability component with periodicity around 14days due to eight complete cycles covered in the light curves, after considerations of the time durations and time cadences of the light curves from the LAMP. Why are there two different kinds of short-term optical quasi-periodic signals in the normal BLAGN Mrk142? The answer is simple but fascinating. After considering the well applied reprocessing procedure (Cackett et al., 2007; Gierlinski et al., 2009) in accreting system around the central supermassive BH in Mrk142, the QPOs with longer periodicity come from local optical continuum emissions with the emission regions in outer part of the central accretion disk, however the QPOs with shorter periodicity come from the reprocessed X-ray band emissions from the inner accretion disk and/or from the central coronal regions. Therefore, it is reasonable to find short-term optical weeks-timescale quasi-periodic variabilities in Mrk142.
Considering the reprocessing procedure, more meaningful results on radius of broad line emission regions (BLRs) can be expected in Mrk142 through the known reverberation mapping technique (Blandford & McKee, 1982; Peterson, 1993), because broad emission line variabilities more sensitively depend on high-energy photoionization photons, i.e., photons in the quasi-periodic emissions with shorter periodicities. In Mrk142, the BLRs radius has been reported as 2.7light-days (Bentz et al., 2013) or 6light-days (Du et al., 2014) in different epochs by time lags between broad line emissions and continuum emissions. However, considering the commonly accepted R-L relation (the correlation between BLRs radius and continuum luminosity) (Bentz et al., 2013) with the optical continuum luminosity of Mrk142 in LAMP, its expected BLRs radius around 20light-days is about 7 times larger than the reported 2.7light-days in the LAMP, leading Mrk142 to be the only outstanding outlier in the R-L space among the known RMBLAGNs with moderate accretion rates in the sample of Bentz et al. (2013). Moreover, besides the reported RMBLAGNs in Bentz et al. (2013), Du et al. (2018) have reported the SEAMBH RMBLAGNs with high accretion rates, and Grier et al. (2017) have reported the SDSS RMBLAGNs with redshift around 0.5. And a larger part of SEAMBH RMBLAGNs and SDSS RMBLAGNs have apparently smaller BLRs radii than the R-L relation expected values. However, as discussed in Fonseca Alvarez et al. (2020) and in Du et al. (2018), the smaller BLRs radii in SEAMBH RMBLAGNs and SDSS RMBLAGNs could be due to super-Eddington accretion process and/or tightly related to quite different UV/optical spectral energy distributions. Here, among the low redshift local RMBLAGNs with moderate accretion rates in the Bentz et al. (2013), Mrk142 was the definite outlier in the R-L space. Therefore, it is interesting and thoughtful to consider whether are there intrinsic reasons applied to well explain the reported BLRs radius of Mrk142 smaller than the R-L expected value, besides the well-considered effects of super-Eddington accretion process (Du et al., 2016, 2018). Here, the quasi-periodic high-energy emissions have been determined with periodicity around 14days in Mrk142, considering the reprocessing procedure. Therefore, it is interesting to consider and check effects of the QPOs in Mrk142 on the final determined time lag of the broad line emissions relative to the continuum emissions.
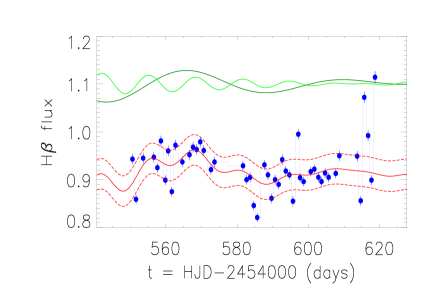
Before proceeding further, it is interesting to quickly check whether are there QPOs included in the broad H variabilities in Mrk142. Fig. 3 shows the collected light curve of broad H in Mrk142 from the LAMP (Bentz et al., 2009). And then, the same linear trend plus two sinusoidal functions have been applied to describe the light curve. Similar two sinusoidal components can be expected with periodicities of about days and days, however, the calculated value is about 18. The determined sinusoidal components but large indicate that there are signs to support the expected QPOs in Mrk142, but the results from the broad H variabilities have lower confidence levels. Therefore, the cross correlation results on the broad H variabilities are mainly considered as follows.
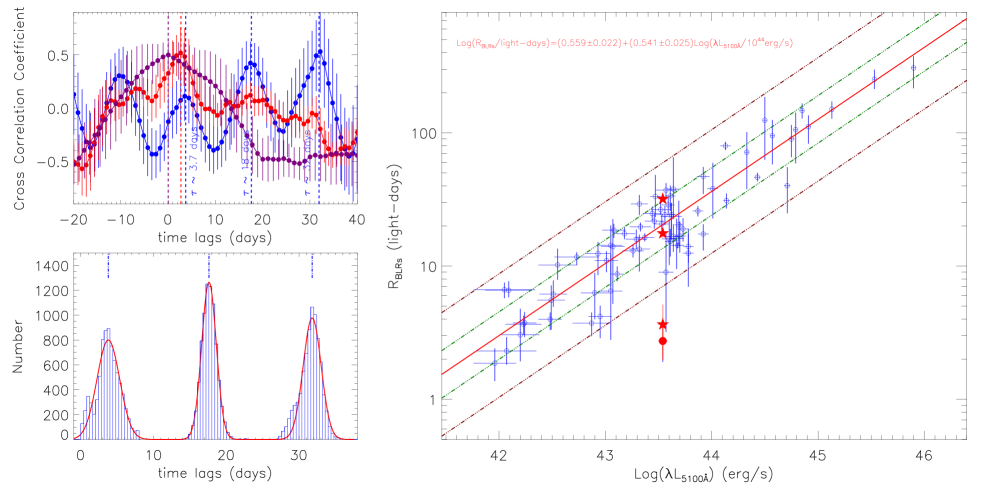
The direct cross correlations are shown in top left panel of Fig. 4 not only between the observed photometric B-band emissions and the observed broad H emissions (the results called as ), but also between the observed broad H emissions and the continuum emissions described only by the quasi-periodic emissions with the shorter periodicity of about 14days (the component shown as solid green line in the top-left panel of Fig. 1) (the results called as ) and between the observed broad H emissions and the continuum emissions described only by the quasi-periodic emissions with the longer periodicity of about 43days (the component shown as solid dark-green line in the top-left panel of Fig. 1) (the results called as ). Based on the cross correlation results in the top-left panel of Fig. 4, three points can be well confirmed. First, there are no apparent time lags in . Zero time lag in can be well expected, because the QPOs with longer periodicity come from optical emission regions, but the broad H emissions are tightly related to high ionization photons (the QPO emissions with shorter periodicity). Therefore, to check the time lags in the could be preferred. Second, the time lag can be well confirmed to be around 2.7days with maximum cross correlation coefficient about 0.5 in , the same as the results in the literature (Bentz et al., 2009), indicating reliable applications of our procedure to determine time lags. Meanwhile, in , the first peak with positive time lag is about 3.7days, much near to the 2.7days determined in the . Third, due to properties of the light curve described by the QPOs with shorter periodicity, multiple peak positions could be expected in the corresponding . The expected multiple peaks by properties of QPOs, here 4 peaks, can be found and well determined around days () in the .
Distributions of the three positive time lags in are shown in the bottom left panel of Fig. 4 through the Bootstrap method, leading the determined time lags to be days, days and days. Based on properties of the QPOs with shorter periodicity coming from the reprocessed high energy emissions, the new preferred BLRs radius of Mrk142 could be days or days, now coincident with the expected value by the continuum luminosity through the R-L relation, considering the best-fitting results and the corresponding confidence bands shown in the right panel of Fig. 4 by the Least Trimmed Squares robust technique (Cappellari et al., 2013). The new approach to the BLRs radius applied to estimate the central virial BH mass of Mrk142 leads to the intrinsic accretion rate at least six times smaller than the previous determined value, clearly indicating the BLAGN Mrk142 is definitely not a BLAGN with super-Eddington accretion rate, and there are few effects of ultra-high accretion rates on the BLRs radius expected through the continuum luminosity. The results ensure no one outlier in the R-L space among the reported local RMBLAGNs with moderate accretion rates in the sample of Bentz et al. (2013), therefore, the R-L relation can be well accepted as a fundamental relation in normal BLAGNs.
Before the end of the section, there is one main point we should note. With more and more RMBLAGNs occupying broader parameter space, a growing number of RMBLAGNs will have their BLRs radii that differ significantly from the commonly accepted R-L relation expected values. As more recent discussed results in Fonseca Alvarez et al. (2020), further understanding on intrinsic properties of ionizing continuum emissions could well explain the R-L offsets. However, as the shown special results with applications of detected QPOs well leading Mrk142 not to be an outlier in the R-L space any more, it is worthwhile searching optical QPOs candidates in several rare RMBLAGNs with smaller BLRs radii. Certainly, potential QPOs can not be commonly applied to explain the global R-L offsets in RMBLAGNs, nevertheless, the shown results in the manuscript will lead a new way to discuss optical QPOs in normal AGNs.
3 Conclusions
Based on the months-long high-quality photometric B-band and V-band light curves of Mrk142, short-term optical transient QPOs in Mrk142 could be expected with significance levels higher than 85%, with periodicities of about 14days, indicating relativistic effects could be detected in low-energy optical emissions through the reprocessed emissions. Moreover, considering effects of the probable short-term optical transient QPOs, improved properties of BLRs can be estimated through the reverberation mapping technique widely applied in normal BLAGNs, leading to the new BLRs radius in Mrk142 which is previously known as the only outlier among the low redshift local RMBLAGNs with moderate accretion rates. The new BLRs radius of Mrk142 well follows the R-L relation, indicating the R-L relation is fundamental enough in normal local BLAGNs without ultra-high accretion rates.
Acknowledgements
Zhang gratefully acknowledge the anonymous referee for giving us constructive comments and suggestions greatly improving our paper. Zhang gratefully acknowledges the kind support of Starting Research Fund of Nanjing Normal University, and the kind grant support from NSFC-11973029.
Data Availability
The data underlying this article will be shared on reasonable request to the corresponding author (xgzhang@njnu.edu.cn).
References
- Abramowicz et al. (2004) Abramowicz, M. A., Kluzniak, W., McClintock, J. E., Remillard, R. A., 2004, ApJL, 609, L63
- Barth (2015) Barth, A. J.; Bennert, V. N.; Canalizo, G.; et al., 2015, ApJS, 217, 26
- Bentz et al. (2013) Bentz, M. C., et al., 2013, ApJ, 767, 149
- Bentz et al. (2009) Bentz, M. C., et al., 2009, ApJ, 705, 199
- Bhatta (2019) Bhatta, G., 2019, Proceedings, 17, 15
- Blandford & McKee (1982) Blandford, R. D.; McKee, C. F., 1982, ApJ, 255, 419
- Cackett et al. (2007) Cackett, E. M.; Horne, K.; Winkler, H., 2007, MNRAS, 380, 669
- Cappellari et al. (2013) Cappellari, M.; Scott, N.; Alatalo, K.; et al., 2013, MNRAS, 432, 1709
- Cui et al. (1998) Cui, W.; Zhang, S. N.; Chen, W., 1998, ApJL, 492, L53
- Do et al. (2009) Do, T.; Ghez, A. M.; Morris, M. R.; et al., 2009, ApJ, 691, 1021
- Du et al. (2014) Du, P.; Hu, C.; Lu, K. X., et al., 2014, ApJ, 782, 45
- Du et al. (2016) Du, P., Lu, K., Zhang, Z., et al., 2016, ApJ, 825, 126
- Du et al. (2018) Du, P.; Zhang, Z.; Wang, K.; et al., 2018, ApJ, 856, 6
- Fonseca Alvarez et al. (2020) Fonseca Alvarez, G.; Trump, J. R.; Homayouni, Y.; et al., 2020, ApJ, 899, 73
- Gierlinski et al. (2009) Gierlinski, M.; Done, C.; Page, K., 2009, MNRAS, 392, 1106
- Graham et al. (2015) Graham, M. J., Djorgovski, S. G., Stern, D., et al., 2015, MNRAS, 453, 1562
- Grier et al. (2017) Grier, C. J.; Trump, J. R.; Shen, Y.; et al., 2017, ApJ, 851, 21
- Gupta et al. (2018) Gupta, A. C.; Tripathi, A.; Wiita, P. J.; et al., 2018, A&A, 616, 6
- Gierlinski et al. (2008) Gierlinski, M.; Middleton, M.; Ward, M.; Done, C., 2008, Nature, 455, 369
- James et al. (2010) James, M; Paul, B.; Devasia, J.; Indulekha, K., 2010, MNRAS, 407, 285
- Kaspi et al. (2000) Kaspi, S.; Smith, P. S.; Netzer, H.; et al., 2000, ApJ, 533, 631
- Kelly et al. (2009) Kelly, B. C.; Bechtold, J.; Siemiginowska, A., 2009, ApJ, 698, 895
- Kozlowski et al. (2010) Kozlowski, S., et al., 2010, ApJ, 708, 927
- Lin et al. (2013) Lin, D. C.; Irwin, J. A.; Godet, O.; Webb, N. A.; Barret, D., 2013, ApJL, 776
- McHardy et al. (2006) McHardy, I. M.; Koerding, E.; Knigge, C.; Uttley, P.; Fender, R. P., 2006, Nature, 444, 730
- Otero-Santos et al. (2020) Otero-Santos, J.; Acosta-Pulido, J. A.; Becerra Gonzalez, J.; et al., 2020, MNRAS, 492, 5524
- Pasham et al. (2014) Pasham, D. R.; Strohmayer, T. E.; Mushotzky, R. F.; 2014, Nature, 513, 74
- Peterson (1993) Peterson, B. M., 1993, PASP, 105, 247
- Reines et al. (2016) Reines, A. E.; Reynolds, M. T.; Miller, J. M.; et al., 2016, ApJL, 830, L35
- Remillard & McClintock (2006) Remillard, R. A.; McClintock, J. E., 2006, ARA&A, 44, 49
- Revalski et al. (2014) Revalski, M.; Nowak, D.; Wiita, P. J.; Wehrle, A. E.; Unwin, S. C., 2014, ApJ, 785, 60
- Smith et al. (2018) Smith, K. L.; Mushotzky, R. F.; Boyd, P. T.; Wagoner, R. V., 2018, ApJL, 860, L10
- Schulz & Mudelsee (2002) Schulz, M.; Mudelsee, M., 2002, Computers and Geosciences, 28, 421
- Vaughan et al. (2016) Vaughan, S.; Uttley, P.; Markowitz, A. G.; et al., 2016, MNRAS, 461, 3145
- van der Klis (1989) van der Klis, M., 1989, ARA&A, 27, 517
- van den Eijnden et al. (2017) van den Eijnden, J.; Ingram, A.; Uttley, P.; et al., 2017, MNRAS, 464, 2643
- Wagoner (2012) Wagoner, R. V., 2012, ApJL, 752, L18
- Walsh (2009) Walsh, J. L., et al., 2009, ApJS, 185, 156
- Zu et al. (2013) Zu, Y.; Kochanek, C. S.; Kozlowski, S.; Udalski, A., 2013, ApJ, 765, 106