NICER, NuSTAR and Insight-HXMT views to black hole X-ray binary SLX 1746–331
Abstract
We study the spectral and temporal properties of the black hole X-ray transient binary SLX 1746–331 during the 2023 outburst with NICER, NuSTAR, and Insight-HXMT observations. Through the joint fitting of the spectra from NICER, NuSTAR, and Insight-HXMT, the spin and inclination angles are measured for the first time as and °, respectively. Accordingly, the mass of the compact star is updated from the previous lower limit of 3.3 to , which is consistent with measured with an empirical mass-luminosity correlation of BH samples. With more NICER observations covering the later decay of the outburst, we confirm that the entire outburst was dominated by the disk emissions, and the thermal spectrum follows , till a luminosity of over than two magnitudes lower than the maximum of the outburst.
1 Introduction
A low-mass black hole X-ray binary consists of a companion star with a mass less than 1 and a black hole. Due to the lower mass of the companion star, the accreted material is more easily able to fill the Roche lobe, allowing the black hole to accrete material from the companion star through the Roche lobe (Shakura & Sunyaev, 1973).
For the black hole X-ray transient binary, it remains in a long-term quiescent state with a relatively low accretion rate (Deegan et al., 2009). As the accreted material in the disk accumulates, it reaches a temperature at which hydrogen can be ionized. Due to thermal and viscous instabilities, the angular momentum transfers outward, the material falls inward, and the accretion rate increases, an X-ray outburst is produced (Cannizzo et al., 1995; Lasota, 2001; Belloni et al., 2011; Corral-Santana et al., 2016).
The outburst of a black hole X-ray binary generally undergoes several different spectral states, including the Low/Hard States (LHS), High/Soft States (HSS), and Intermediate States (IMS) (Belloni et al., 2005; Motta et al., 2009), and these spectral states have distinct positions on the Hardness-Intensity Diagram (HID). The trajectory of the black hole X-ray binary forms a ”q” shape on the HID (Homan et al., 2001; Fender et al., 2004; Motta et al., 2012). In the LHS, the emission is primarily dominated by hard X-ray emission from the corona/jet. The locations of the accretion disks in the LHS are not clear, and for XTE J1118+480, McClintock et al. (2001) argued that its accretion disk is truncated in the LHS, while Reis et al. (2009) found a thermal component consistent with a disk at the ISCO, suggesting that its accretion disk is not truncated in the LHS. NuSTAR results for some canonical sources such as GRS 1915+105 and Cygnus X–1 also show no evidence that the accretion disk is truncated in the LHS (Markwardt, 2003; Parker et al., 2015). In the HSS, where thermal emission from the disk dominates and the contribution of non-thermal emission is relatively low (<25%), the disk has reached its innermost stable circular orbit (ISCO) (Esin et al., 1997; McClintock & Remillard, 2006; Gierliński et al., 2008). The IMS can be further divided into the hard intermediate state (HIMS) and the soft intermediate state (SIMS), where the spectrum of SIMS is softer than that of HIMS (Homan & Belloni, 2005).
Not all black hole X-ray transient binaries exhibit ”q” shaped trajectories on the HID, meaning that not all of them undergo a complete outburst from the LMS through the HIMS to the HSS and then back to the LMS through the SIMS. These outbursts are referred to as ”failed outbursts,” which are mainly classified into two categories: one category includes outbursts that have only evolved to the low hard state or intermediate state but not to the soft state, accounting for approximately 38 of all outbursts (Brocksopp et al., 2004; Capitanio et al., 2009; Tetarenko et al., 2016). and the other category is LHS only, which lacks the beginning of the outburst, which is relatively rare and was in 4U 1630–472, MAXI J0637–430 and SLX 1746–331 (Baby et al., 2020; Ma et al., 2022; Peng et al., 2024).
SLX 1746–331 was discovered with the Spacelab 2 XRT in 1985 August and detected by the RASS in 1990 (Warwick et al., 1988; Skinner et al., 1990). Skinner et al. (1990) discovered that it had a very soft spectrum that best fit thermal bremsstrahlung at a temperature of = 1.5 keV, leading to the suggestion that SLX 1746-331 might be a black hole candidate. SLX 1746–331 experienced outbursts in 2003 (Markwardt, 2003; Remillard & Levine, 2003), 2007 (Markwardt & Swank, 2007), and 2011 (Ozawa et al., 2011). The observed peak fluxes of these outbursts were approximately 400 mCrab, 100 mCrab, and 40 mCrab, respectively. Dunn et al. (2011) used data from Rossi X-ray Timing Explorer (RXTE) and assumed a black hole mass of 10 , a distance of 5 kpc, and an inclination angle of 60°. By using the relation, they estimated that is approximately 6.7 km, which is about 0.45 times the gravitational radius (), suggesting this system is either located further away or hosts a black hole with smaller mass. Yan & Yu (2015) estimated the distance of SLX 1746–331 to be about 10.81 3.52 kpc using data from RXTE.
SLX 1746–331 entered the outburst in 2023 and has been observed by Neutron Star Interior Composition Explorer (NICER) 81 times since March 8, 2023, covering the entire outburst, and has been observed a total of 46 times by Insight-HXMT over 35 days, from March 14th to April 17th, 2023. The previous research mainly based on the early released NICER observations revealed the outburst stayed around ISCO down to a luminosity of as low as 0.03 (Peng et al., 2023). Nuclear Spectroscopic Telescope Array (NuSTAR) has three observations of SLX 1746–331, carried out during the peak and decay phases of the outburst. In this letter, we perform a detailed spectral analysis by taking the NuSTAR, complete NICER observations, and the supplementary Insight-HXMT observations.
We report the first measurements on the basic properties of the system, including the black hole spin, the inclination angle, and the update of the black hole mass. In Section 2, we describe the observations and data reduction. The detailed results are presented in Section 3. The results are then discussed, and the conclusions are presented in Section 4.
2 Observations and Data reduction
2.1 NICER
NICER was launched by the Space X Falcon 9 rocket on 3 June 2017 (Gendreau et al., 2016). NICER has a large effective area and high temporal resolution in soft X-ray band (0.2–12 keV), which may allow us to better study black body components at low temperatures.
NICER started to observe SLX 1746–331 on March 8, 2023, and covered the entire outburst of the SLX 1746–331. NICER observations till the MJD 600103 were analyzed and reported in Peng et al. (2023). More NICER observations beyond MJD 600126 allow for investigation of the outburst around its later decay phase.
We use NICERDAS 2022-12-16 V010a software with the latest CALDB xti20221001 for NICER data analysis. NICER data are reduced using the standard pipeline tool nicerl2111https://heasarc.gsfc.nasa.gov/lheasoft/ftools/headas/nicerl2.html. We extract light curves using nicerl3-lc222https://heasarc.gsfc.nasa.gov/docs/software/lheasoft/ftools/headas/nicerl3-lc.html in 1–6 keV, 6–10 keV and 1–10 keV. To extract the spectrum, we utilize nicerl3-spect333https://heasarc.gsfc.nasa.gov/docs/software/lheasoft/help/nicerl3-spect.html, employing the ”nibackgen3C50444https://heasarc.gsfc.nasa.gov/docs/nicer/analysis_threads/background/” model to estimate the background for spectral analysis. For spectrum fitting, we select an energy range of 0.5–10 keV. Additionally, nicerl3-spect automatically applies the systematic error using niphasyserr. In the energy range of 0.3-10 kev, the systematic error is about 1.5%.
2.2 NuSTAR
NuSTAR is the first mission to employ focusing telescopes for high-energy X-ray (3 – 79 keV) imaging of the sky within the electromagnetic spectrum. It was launched on June 13, 2012, at 9 am PDT. (Harrison et al., 2013). As shown in Table LABEL:observ, NuSTAR conducted three observations of SLX 1746–331. For NuSTAR data analysis, we employ NuSTARDAS v2.1.2 software with the calibration database (CALDB 20230613). We extract NuSTAR-filtered data using the standard pipeline program nupipeline, The spectrum was extracted from a 120′′ circle region centered on the source and the background was generated from a 60′′ circle region away from the source. We utilized FPMA and FPMB 3–50 keV data for spectral analysis.
2.3 Insight-HXMT
Insight-HXMT is the first Chinese X-ray astronomy satellite, which was successfully launched on 2017 June 15 (Zhang et al., 2014, 2018, 2020). It carries three scientific payloads: the low energy X-ray telescope (LE, SCD detector, 1–15 keV, 384 , Chen et al. 2020), the medium energy X-ray telescope (ME, Si-PIN detector, 5–35 keV, 952 , Cao et al. 2020 ), and the high energy X-ray telescope (HE, phoswich NaI(CsI), 20–250 keV, 5100 , Liu et al. 2020).
Insight-HXMT started to observe SLX 1746–331 at the peak of its outburst on March 14, 2023 and continued until May 19, 2023. As shown in Table LABEL:observ, only the Insight-HXMT observations simultaneous with NICER and NuSTAR are adopted for joint spectral analysis. We extract the data from LE and ME using the Insight-HXMT Data Analysis software HXMTDAS v2.05. The data are filtered with the criteria recommended by the Insight-HXMT Data Reduction Guide v2.05 555http://hxmtweb.ihep.ac.cn/SoftDoc/648.jhtml. Due to the count rate of high-energy photons in SLX 1746–331, the energy bands considered for spectral analysis are LE 2–8 keV and ME 8–25 keV. One percent systematic error is added to data (Liao et al., 2020), and errors are estimated via Markov Chain Monte-Carlo (MCMC) chains with a length of 20000.
3 Results
3.1 Light curve and Hardness-intensity diagram
| NICER | Observed date | Exposure Time | |
|---|---|---|---|
| ObsID | (MJD) | (s) | |
| 6203700105 | 60015.05 | 766 | |
| 6203700110 | 60025.30 | 3888 | |
| 6203700122 | 60051.66 | 1797 | |
| NuSTAR | Observed date | FPMA exposure time | FPMB exposure time |
| ObsID | (MJD) | (s) | (s) |
| 80802346002 | 60015.45 | 17180 | 17790 |
| 80802346004 | 60025.36 | 23440 | 23690 |
| 80802346006 | 60051.08 | 24290 | 24600 |
| Insight-HXMT | Observed date | LE exposure time | ME exposure time |
| ObsID | (MJD) | (s) | (s) |
| P051436300803 | 60025.22 | 284.3 | 964.2 |
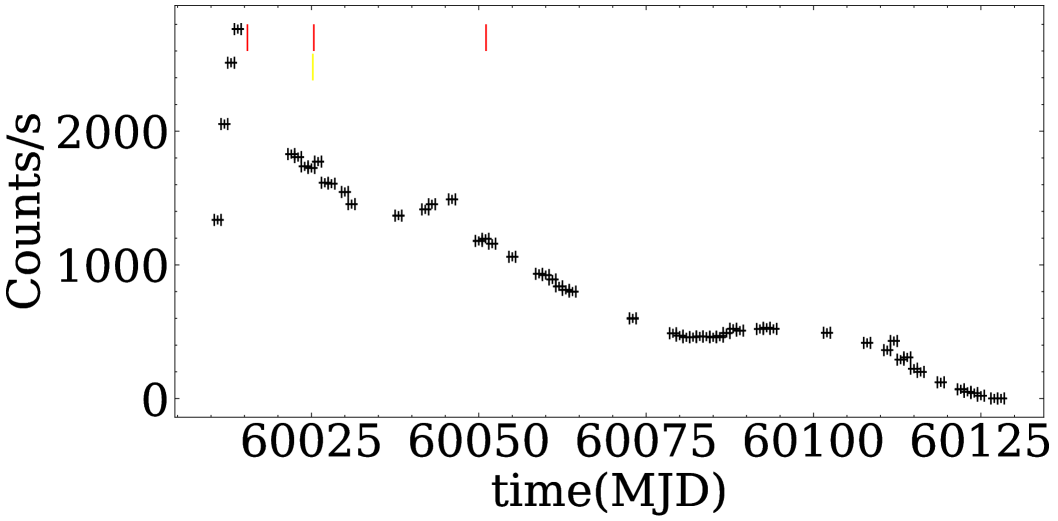
SLX 1746–331 entered the outburst on March 8, 2023. As shown in Figure 1, NICER began observing it on March 8, 2023 (MJD 60011), covering the entire outburst. The outburst manifests with a profile of ”fast rise and slow decay”, which is a typical characteristic of those outbursts observed in most black hole X-ray binary systems. The three short red lines in Figure 1 represent NuSTAR observations, and the yellow line denotes Insight-HXMT observation (Table LABEL:observ).
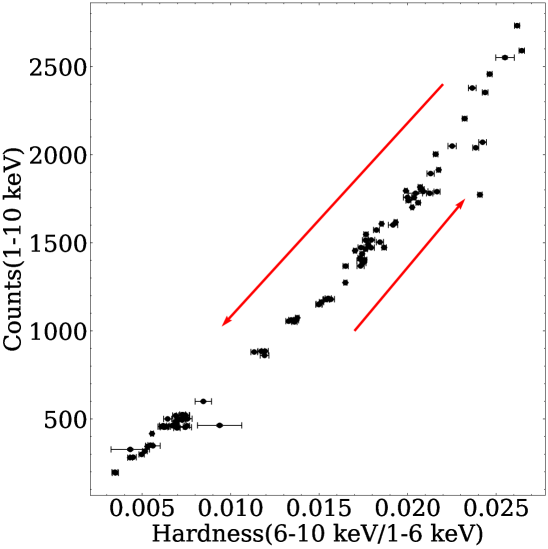
We extract the 1–6 keV, 6–10 keV, and 1–10 keV light curves of NICER to construct the Hardness-Intensity Diagram (HID) of SLX 1746-–331. The hardness is defined as the count rate ratio of 6–10 keV to 1–6 keV, while the intensity is the count rate ratio of 1–10 keV. As shown in Figure 2, the red arrows in the HID represent the trajectory of SLX 1746-–331, showing that the outburst of SLX 1746–331 commences and evolves to a soft state, with no trend for a transition to the hard state during the entire outburst.
3.2 The spectral analysis
| Model | Parameter | 80802346002 | 80802346004 | 80802346006 |
|---|---|---|---|---|
| tbabs | ||||
| ezdiskbb | ||||
| norm | ||||
| flux[ erg s-1 cm-2] | ||||
| relxillNS | ||||
| [°] | ||||
| logxi | ||||
| norm[] | ||||
| nthcomp | ||||
| [keV] | ||||
| norm | ||||
| constant | con[LE] | |||
| con[ME] | ||||
| con[NFPMA] | ||||
| con[NFPMB] | ||||
| /(d.o.f.) | 1.09 | 1.07 | 1.24 |
-
•
Note:
**We fixed the iron abundance by the results of the joint fit to 1.3
For the NICER data, we fit the 0.5–10 keV spectra using a model that includes tbabs to account for interstellar absorption (Wilms et al., 2000), considering photoelectric cross-sections provided by Verner et al. (1996), and diskbb for the multi-temperature blackbodspy of the accretion disk (Mitsuda et al., 1984). So our model M1 is tbabs*diskbb and the flux of the disk in the 1–100 keV is estimated with cflux.
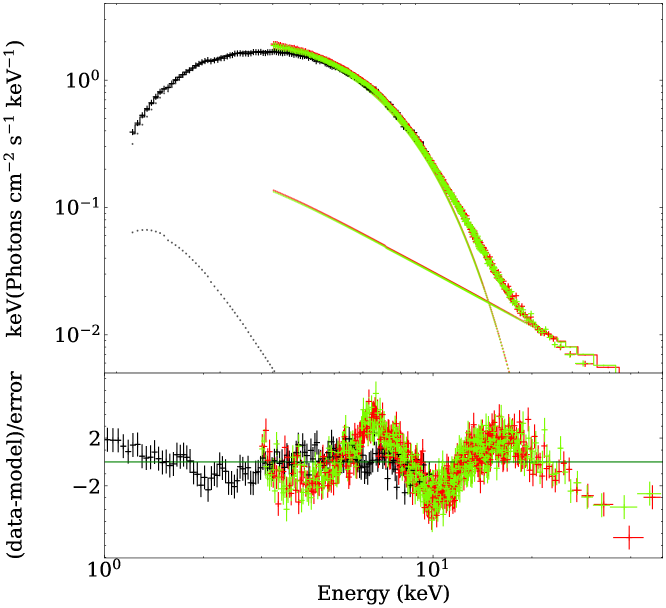
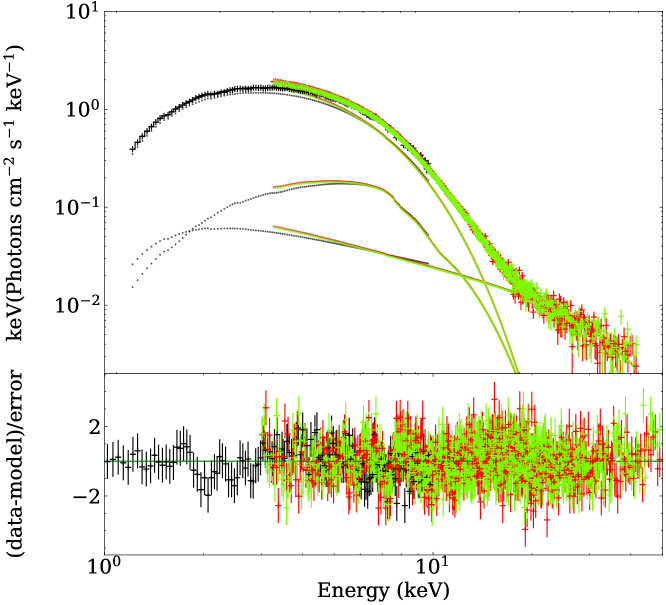
As shown in Figure 1 and Table LABEL:observ, there are three NuSTAR observations of SLX 1746–331, all of which have nearly simultaneous NICER observations. Additionally, one of these observations also had nearly simultaneous observations from Insight-HXMT. Since the spectrum of SLX 1746–331 is soft and the high-energy photon counts are relatively low, we conducted spectral analysis of SLX 1746–331 using nearly simultaneous data from NICER in 0.5–10 keV, NuSTAR FPMA and FPMB in 3–50 keV, and Insight-HXMT LE in 2–8 keV and ME in 8–25 keV. The first trial for the spectral model is constant*tbabs*(ezdiskbb+powerlaw), where ezdiskbb is a model of multiple blackbody disks with zero-torque inner boundary (Zimmerman et al., 2005). In order to take into account the differences between the different spectral indices of NICER and NuSTAR, we allowed the temperature of the disk and spectral index to vary. We find a poor-fitting result with /(d.o.f)=3358.67/1345=2.5, and there is a significant reflection component in the residuals(Figure 3). So we replaced powerlaw with relxill to fit the reflection component in the spectrum Dauser et al. (2016), which results in an improving but not yet perfect fitting with /(d.o.f)=1896.32/1340=1.4. Then we add the nthcomp model to improve the fit, where the in relxill is linked to in nthcomp. The reflection fraction is fixed to -1, so we only consider the reflection emission [/(d.o.f)=1746.27/1338=1.3]. Since the fit is not improved much, we replace relxill with relxillNS, where the reflection fraction is fixed to -1 and in relxillNS linked to in nthcomp. is fixed to -1, i.e., the disk is in the ISCO, emission index and truncation radius of 3 and 15, respectively. Finally the fit is largely improved [/(d.o.f)=1462.19/1339=1.09]. Therefore our fitting model M2 is:constant*tbabs*(ezdiskbb+nthcomp+relxillNS). The flux of the disk in the 1–100 keV is estimated with cflux. Figure 4 shows the spectral fitting of SLX 1746–331, and the spectral parameters are shown in Table LABEL:parameter, where the black hole spin and the inclination angle of the system are measured for the first time with the averaged values of and °, respectively.
We also try to fit the energy spectrum by replacing ezdiskbb with kerrbb, because kerrbb has spin, inclination, and other parameters. We link the spin and inclination with those of the relxillNS model and fix the distance to 10, the mass to 5 and, according to the requirements of the model, fix the norm to 1. We find that the spin and inclination obtained in the fit are the same as those obtained with the model we used previously. We find that the spin and inclination are basically the same as what we obtained with model 2. To obtain more robust results, we jointly fit the spectra from the three separate days, with parameters of black hole spin, inner disk inclination, and iron abundance linked among these observations, and obtain spin, inclination and iron abundance as , and respectively. These parameter estimations are consistent with previous results.
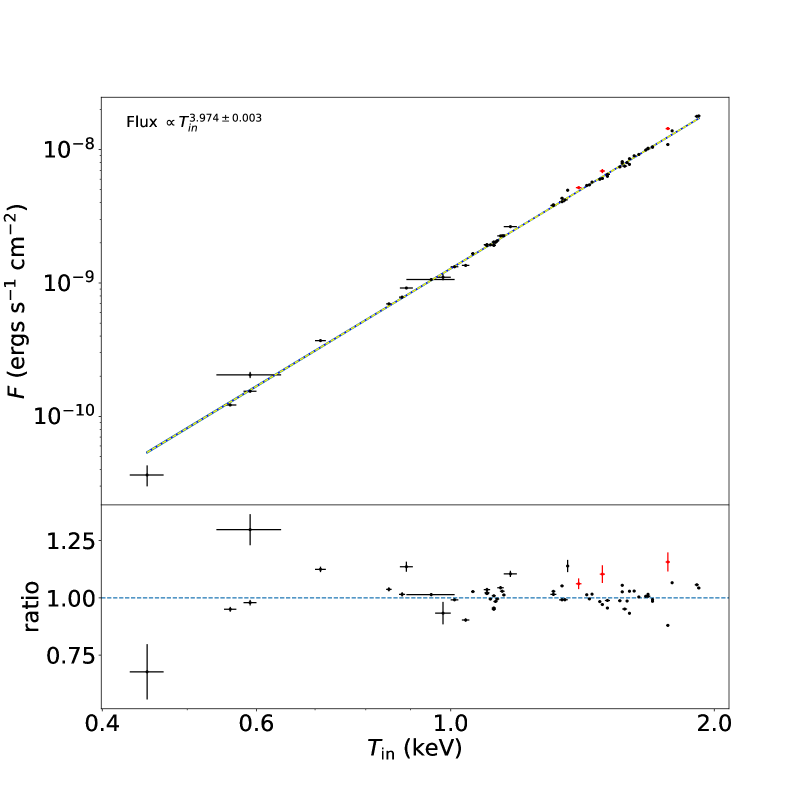
The disk flux versus the inner disk temperature () is plotted in Figure 5, and a fit with power law results in around 3.9740.003. This finding suggests that the disk is around the ISCO during the whole outburst. The highest and lowest fluxes of the disk differ by a factor of 500.
3.3 Estimating the mass of compact objects
As shown in Figure 5, the disk flux is always proportional to the fourth power of the temperature of the inner disk during the 2023 outburst of SLX 1746–331. For the standard thin disk, , where , , and representing the inner radius, the temperature of the disk and Stefan-Boltzmann constant respectively. This indicates that the disk is around the ISCO. Note that the standard disk applies to a luminosity range of 0.001 0.3 (Steiner et al., 2010; Salvesen et al., 2013; Garc´ıa et al., 2015; Draghis et al., 2023), where is the Eddington luminosity (). As shown in Figure 5, we find that the maximum flux for the disk is about 491 times greater than the lowest flux. This luminosity coverage exceeds that commonly associated with standard disks (0.001 0.3 ). So we speculate that the peak flux most likely has reached a value around 0.3 , and hence we use the flux and luminosity conversion in X-ray binaries to estimate the mass of the compact object. For a disk blackbody emission, the luminosity of the disk can be approximated as , where the distance 3.52 kpc (Yan & Yu, 2015), and thus a peak luminosity is erg/s. As shown in Table LABEL:parameter, the joint spectral fittings with NuSTAR, NICER, and Insight-HXMT, result in an average inclination angle °. Accordingly, the mass of the compact object could be estimated as .
In section 3.2, we used the M1 model to fit the spectrum of NICER and obtained a normalization value of approximately for the disk. For the normalization of the disk, , where is the inner disk radius, is the distance of the source in units of 10 kpc (1.08 0.352 kpc), and is the inclination angle (°). we estimate the inner disk radius to be 11.7 3.9 km. For M2 we estimate the inner disk radius to be 5.8 1.9 km. For a Kerr black hole, with a measured spin a= and a mass of the compact object about , gives km. Within the error range, the inner disk radius is consistently estimated in two different manners.
4 discussion and conclusion
We have joint spectral analyses of the 2023 SLX 1746-331 outburst using data from NICER, NuSTAR, and Insight-HXMT, which have been carried out, and for the first time, the spin and inclination of SLX 1746-331 are measured approximately as and °, respectively. By taking a peak outburst flux of 0.3 and the measured inclination, the mass of the compact object is derived as . Additionally, with the complete NICER observations, we also updated that during the entire outburst, is found to have its inner disk staying around ISCO even at the later decay phase.
The previous outburst of SLX 1746–331 exhibited characteristics that was identified as a black hole transient X-ray binary (Skinner et al., 1990; White & van Paradijs, 1996; Homan & Wijnands, 2003). Yan & Yu (2015) reported a distance of about 10.81 kpc using RXTE data, and Peng et al. (2024) estimated a lower limit of for the mass of the compact object by assuming 0.3 of the outburst peak flux, and from an empirical correlation between disk temperature and black hole mass. The large mass uncertainty is due to the shortage of precise measurements of the inclination of the system and the distance. By performing the joint spectral fittings with NICER, NuSTAR, and Insight-HXMT, the disk inclination is firstly precisely measured, which results in an updated mass measurement of the , well consistent with that derived from the previous empirical mass-temperature correlation (Peng et al., 2023). Obviously, mass can be further constrained in the future if the source distance can be more precisely measured.
For the 2023 outburst of SLX 1746–331, the analytical results of the spectrum of NICER, and the HID indicates that it remained mostly in a soft state. However, we have observed a significant reflection component in the three NuSTAR observations, where the disk is most likely illuminated by itself at the inner part. In the mean while, the non-thermal emissions contribute about 20% to the total. It is generally believed that there is a hard component in the high soft state, but its proportion is relatively low (<25%). Liu & Taam (2009) argued that the evaporation rate that corresponds to the corona production is related to the distance of the inner disk for the central black hole. As shown in their evaporation curve, the distant disk can be truncated by evaporation due to insufficient mass supply. When the accretion rate increases to a maximum value (0.027 times the Eddington accretion rate), evaporation cannot evacuate any disk region because the mass flow in the disk is greater than the evaporation rate. As a result, the disk extends into the ISCO, the corona covering the disk becomes very weak. For SLX 1746–331, no low hard state and intermediate states may mean the evaporation is very low during the entire outburst.
The 2023 outburst of SLX 1746–331 differs from those of normal black hole transient X-ray binaries in their evolution patterns in HID: instead of a low-hard state toward a soft state, SLX 1746–331 stayed around the ISCO during the whole outburst. Although such an outburst phenomena is relatively rare, we notice that so far a similar case was observed in the outburst of another black hole X-ray binary system MAXI J0637–430 (Ma et al., 2022). Peng et al. (2023) compared SLX 1746–331 with MAXI J0637–430, and suggested that such peculiar outburst could be related to the special configuration of the binary system. For example, a small compact object mass together with a rather tight orbital period could lead to a relatively smaller disk size which could own a weaker large-scale magnetic field (Cao et al., 2021). As discussed in Peng et al. (2023) and Cao et al. (2021), a weak magnetic field born out of a smaller disk can in principle lead the state transition toward HSS occurred at a lower luminosity level. Unlike MAXI J0637–430, which had a peak luminosity of about 0.08 and a soft-to-hard transition at about 0.007 , SLX 1746–331 remains in the soft state, with no state transition observed even at a luminosity <500 times lower than the peak luminosity of the outburst.
If takes the maximum luminosity of 0.3 for the outburst, the luminosity with which the disk remains around ISCO could be as low as 0.0006 , lower than 0.001 established from previous numerical simulations and observations (Reynolds & Fabian, 2008; Steiner et al., 2010; Salvesen et al., 2013). To further understand such a peculiar outburst, in future there two key issues in probing this binary system apart from the precise measurement of the source distance. One is the orbital period and the other is the state transitions. Since MAXI J0637–430 was already detected with so far the tightest orbital period of hrs, given the non-detection of a return of the spectral state to the hard state for SLX 1746–331 during the outburst decay phase, we expect an orbit even tighter than that of MAXI J0637–430. To catch a state transition either toward HSS in othe utburst rising phase or away from HSS in the decay phase, would also be crucial to our pining down the puzzle. Actually such a task has already served as one of the key sciences of the Einstein probe, which was successfully launched on January 9, 2024 to discover and observe sources exhibiting activity at very low luminosity. (Yuan et al., 2018).
References
- Baby et al. (2020) Baby, B. E., Agrawal, V. K., Ramadevi, M. C., et al. 2020, MNRAS, 497, 1197, doi: 10.1093/mnras/staa1965
- Belloni et al. (2005) Belloni, T., Homan, J., Casella, P., et al. 2005, A&A, 440, 207, doi: 10.1051/0004-6361:20042457
- Belloni et al. (2011) Belloni, T. M., Motta, S. E., & Muñoz-Darias, T. 2011, Bulletin of the Astronomical Society of India, 39, 409, doi: 10.48550/arXiv.1109.3388
- Brocksopp et al. (2004) Brocksopp, C., Bandyopadhyay, R. M., & Fender, R. P. 2004, New A, 9, 249, doi: 10.1016/j.newast.2003.11.002
- Cannizzo et al. (1995) Cannizzo, J. K., Chen, W., & Livio, M. 1995, ApJ, 454, 880, doi: 10.1086/176541
- Cao et al. (2021) Cao, X., You, B., & Yan, Z. 2021, A&A, 654, A81, doi: 10.1051/0004-6361/202141652
- Cao et al. (2020) Cao, X., Jiang, W., Meng, B., et al. 2020, Science China Physics, Mechanics, and Astronomy, 63, 249504, doi: 10.1007/s11433-019-1506-1
- Capitanio et al. (2009) Capitanio, F., Belloni, T., Del Santo, M., & Ubertini, P. 2009, MNRAS, 398, 1194, doi: 10.1111/j.1365-2966.2009.15196.x
- Chen et al. (2020) Chen, Y., Cui, W., Li, W., et al. 2020, Science China Physics, Mechanics, and Astronomy, 63, 249505, doi: 10.1007/s11433-019-1469-5
- Corral-Santana et al. (2016) Corral-Santana, J. M., Casares, J., Muñoz-Darias, T., et al. 2016, A&A, 587, A61, doi: 10.1051/0004-6361/201527130
- Dauser et al. (2016) Dauser, T., García, J., & Wilms, J. 2016, Astronomische Nachrichten, 337, 362, doi: 10.1002/asna.201612314
- Deegan et al. (2009) Deegan, P., Combet, C., & Wynn, G. A. 2009, MNRAS, 400, 1337, doi: 10.1111/j.1365-2966.2009.15573.x
- Draghis et al. (2023) Draghis, P. A., Miller, J. M., Zoghbi, A., et al. 2023, ApJ, 946, 19, doi: 10.3847/1538-4357/acafe7
- Dunn et al. (2011) Dunn, R. J. H., Fender, R. P., Körding, E. G., Belloni, T., & Merloni, A. 2011, MNRAS, 411, 337, doi: 10.1111/j.1365-2966.2010.17687.x
- Esin et al. (1997) Esin, A. A., McClintock, J. E., & Narayan, R. 1997, ApJ, 489, 865, doi: 10.1086/304829
- Fender et al. (2004) Fender, R. P., Belloni, T. M., & Gallo, E. 2004, MNRAS, 355, 1105, doi: 10.1111/j.1365-2966.2004.08384.x
- Garc´ıa et al. (2015) García, J. A., Steiner, J. F., McClintock, J. E., et al. 2015, ApJ, 813, 84, doi: 10.1088/0004-637X/813/2/84
- Gendreau et al. (2016) Gendreau, K. C., Arzoumanian, Z., Adkins, P. W., et al. 2016, in Society of Photo-Optical Instrumentation Engineers (SPIE) Conference Series, Vol. 9905, Space Telescopes and Instrumentation 2016: Ultraviolet to Gamma Ray, ed. J.-W. A. den Herder, T. Takahashi, & M. Bautz, 99051H, doi: 10.1117/12.2231304
- Gierliński et al. (2008) Gierliński, M., Done, C., & Page, K. 2008, MNRAS, 388, 753, doi: 10.1111/j.1365-2966.2008.13431.x
- Harrison et al. (2013) Harrison, F. A., Craig, W. W., Christensen, F. E., et al. 2013, ApJ, 770, 103, doi: 10.1088/0004-637X/770/2/103
- Homan & Belloni (2005) Homan, J., & Belloni, T. 2005, Ap&SS, 300, 107, doi: 10.1007/s10509-005-1197-4
- Homan & Wijnands (2003) Homan, J., & Wijnands, R. 2003, The Astronomer’s Telegram, 169, 1
- Homan et al. (2001) Homan, J., Wijnands, R., van der Klis, M., et al. 2001, ApJS, 132, 377, doi: 10.1086/318954
- Lasota (2001) Lasota, J.-P. 2001, New A Rev., 45, 449, doi: 10.1016/S1387-6473(01)00112-9
- Liao et al. (2020) Liao, J.-Y., Zhang, S., Lu, X.-F., et al. 2020, Journal of High Energy Astrophysics, 27, 14, doi: 10.1016/j.jheap.2020.04.002
- Liu & Taam (2009) Liu, B. F., & Taam, R. E. 2009, ApJ, 707, 233, doi: 10.1088/0004-637X/707/1/233
- Liu et al. (2020) Liu, C., Zhang, Y., Li, X., et al. 2020, Science China Physics, Mechanics, and Astronomy, 63, 249503, doi: 10.1007/s11433-019-1486-x
- Ma et al. (2022) Ma, R. C., Soria, R., Tao, L., et al. 2022, MNRAS, 514, 5238, doi: 10.1093/mnras/stac1585
- Markwardt (2003) Markwardt, C. B. 2003, The Astronomer’s Telegram, 143, 1
- Markwardt & Swank (2007) Markwardt, C. B., & Swank, J. H. 2007, The Astronomer’s Telegram, 1235, 1
- McClintock & Remillard (2006) McClintock, J. E., & Remillard, R. A. 2006, in Compact stellar X-ray sources, Vol. 39, 157–213, doi: 10.48550/arXiv.astro-ph/0306213
- McClintock et al. (2001) McClintock, J. E., Haswell, C. A., Garcia, M. R., et al. 2001, ApJ, 555, 477, doi: 10.1086/321449
- Mitsuda et al. (1984) Mitsuda, K., Inoue, H., Koyama, K., et al. 1984, PASJ, 36, 741
- Motta et al. (2009) Motta, S., Belloni, T., & Homan, J. 2009, MNRAS, 400, 1603, doi: 10.1111/j.1365-2966.2009.15566.x
- Motta et al. (2012) Motta, S., Homan, J., Muñoz Darias, T., et al. 2012, MNRAS, 427, 595, doi: 10.1111/j.1365-2966.2012.22037.x
- Ozawa et al. (2011) Ozawa, H., Suwa, F., Negoro, H., et al. 2011, The Astronomer’s Telegram, 3098, 1
- Parker et al. (2015) Parker, M. L., Tomsick, J. A., Miller, J. M., et al. 2015, ApJ, 808, 9, doi: 10.1088/0004-637X/808/1/9
- Peng et al. (2023) Peng, J.-Q., Zhang, S., Wang, P.-J., et al. 2023, ApJ, 955, 96, doi: 10.3847/1538-4357/acf461
- Peng et al. (2024) Peng, J.-Q., Zhang, S., Shui, Q.-C., et al. 2024, The Astrophysical Journal Letters, 960, L17, doi: 10.3847/2041-8213/ad17ca
- Reis et al. (2009) Reis, R. C., Miller, J. M., & Fabian, A. C. 2009, MNRAS, 395, L52, doi: 10.1111/j.1745-3933.2009.00640.x
- Remillard & Levine (2003) Remillard, R. A., & Levine, A. M. 2003, The Astronomer’s Telegram, 144, 1
- Reynolds & Fabian (2008) Reynolds, C. S., & Fabian, A. C. 2008, ApJ, 675, 1048, doi: 10.1086/527344
- Salvesen et al. (2013) Salvesen, G., Miller, J. M., Reis, R. C., & Begelman, M. C. 2013, MNRAS, 431, 3510, doi: 10.1093/mnras/stt436
- Shakura & Sunyaev (1973) Shakura, N. I., & Sunyaev, R. A. 1973, A&A, 24, 337
- Skinner et al. (1990) Skinner, G. K., Foster, A. J., Willmore, A. P., & Eyles, C. J. 1990, MNRAS, 243, 72, doi: 10.1093/mnras/243.1.72
- Steiner et al. (2010) Steiner, J. F., McClintock, J. E., Remillard, R. A., et al. 2010, ApJ, 718, L117, doi: 10.1088/2041-8205/718/2/L117
- Tetarenko et al. (2016) Tetarenko, B. E., Sivakoff, G. R., Heinke, C. O., & Gladstone, J. C. 2016, ApJS, 222, 15, doi: 10.3847/0067-0049/222/2/15
- Verner et al. (1996) Verner, D. A., Ferland, G. J., Korista, K. T., & Yakovlev, D. G. 1996, ApJ, 465, 487, doi: 10.1086/177435
- Warwick et al. (1988) Warwick, R. S., Norton, A. J., Turner, M. J. L., Watson, M. G., & Willingale, R. 1988, MNRAS, 232, 551, doi: 10.1093/mnras/232.3.551
- White & van Paradijs (1996) White, N. E., & van Paradijs, J. 1996, ApJ, 473, L25, doi: 10.1086/310380
- Wilms et al. (2000) Wilms, J., Allen, A., & McCray, R. 2000, ApJ, 542, 914, doi: 10.1086/317016
- Yan & Yu (2015) Yan, Z., & Yu, W. 2015, ApJ, 805, 87, doi: 10.1088/0004-637X/805/2/87
- Yuan et al. (2018) Yuan, W., Zhang, C., Ling, Z., et al. 2018, in Society of Photo-Optical Instrumentation Engineers (SPIE) Conference Series, Vol. 10699, Space Telescopes and Instrumentation 2018: Ultraviolet to Gamma Ray, ed. J.-W. A. den Herder, S. Nikzad, & K. Nakazawa, 1069925, doi: 10.1117/12.2313358
- Zhang et al. (2014) Zhang, S., Lu, F. J., Zhang, S. N., & Li, T. P. 2014, in Society of Photo-Optical Instrumentation Engineers (SPIE) Conference Series, Vol. 9144, Space Telescopes and Instrumentation 2014: Ultraviolet to Gamma Ray, ed. T. Takahashi, J.-W. A. den Herder, & M. Bautz, 914421, doi: 10.1117/12.2054144
- Zhang et al. (2018) Zhang, S., Zhang, S. N., Lu, F. J., et al. 2018, in Society of Photo-Optical Instrumentation Engineers (SPIE) Conference Series, Vol. 10699, Space Telescopes and Instrumentation 2018: Ultraviolet to Gamma Ray, ed. J.-W. A. den Herder, S. Nikzad, & K. Nakazawa, 106991U, doi: 10.1117/12.2311835
- Zhang et al. (2020) Zhang, S.-N., Li, T., Lu, F., et al. 2020, Science China Physics, Mechanics, and Astronomy, 63, 249502, doi: 10.1007/s11433-019-1432-6
- Zimmerman et al. (2005) Zimmerman, E. R., Narayan, R., McClintock, J. E., & Miller, J. M. 2005, ApJ, 618, 832, doi: 10.1086/426071