OH absorption in on-chip high-Q resonators
Abstract
Thermal silica is a common dielectric used in all silicon-photonic circuits. And bound hydroxyl ions (Si-OH) can provide a significant component of optical loss in this material on account of the wet nature of the thermal oxidation process. A convenient way to quantify this loss relative to other mechanisms is through OH-absorption at 1380 nm. Here, using ultra-high-Q thermal-silica wedge microresonators, the OH absorption loss peak is measured and distinguished from the scattering loss base line over a wavelength range from 680 nm to 1550 nm. Record-high on-chip resonator Q factors are observed for near-visible and visible wavelengths, and the absorption limited Q factor is as high as 8 billion in the telecom band. OH ion content level around 2.4 ppm (weight) is inferred from both Q measurements and by Secondary Ion Mass Spectroscopy (SIMS) depth profiling.
High-Q integrated resonators have become an essential component in nonlinear photonics. Most often, the guided light in these structures has a significant fractional overlap with silica (e.g., all-silica wedge resonators Lee et al. (2012a); Wu et al. (2020) and silica-clad ultra-low-loss silicon nitride waveguides Jin et al. (2021); Puckett et al. (2021)). It is therefore important to understand the loss limits imposed by the silica used in silicon photonic processing. Besides interface scattering loss, optical absorption from bound hydroxyl ions (Si-OH) can be a significant component of loss Gao et al. (2022), especially since thermal silica is prepared using a process involving water. Bound hydroxyl ions produce a well-known fundamental absorption peak at 2720 nm Humbach et al. (1996) and the overtone at 1380 nm is used here to measure OH absorption loss in ultra-high-Q thermal-silica wedge microresonators. Further comparison to scattering loss is made over a wavelength range from 680 nm to 1550 nm. Also, using cavity-enhanced photo-thermal spectroscopy Gao et al. (2022) near the 1380 nm band, the OH ion content level is estimated to be 2.4 ppm (weight). This value also agrees with Secondary Ion Mass Spectroscopy (SIMS) depth profiling performed on the resonator material. Outside of the 1380 nm band, scattering loss is confirmed by measurement and modeling to be the dominant loss mechanism in the samples tested.
Thermally-grown silica wedge whispering-gallery resonator devices were prepared as measurement samples, and featured 8 m thermal oxide thickness with resonator diameter 6.5 mm (10 GHz free spectral range, FSR). The fabrication steps are detailed in reference Wu et al. (2020) and a photo micrograph of a typical resonator is the Fig. 1 inset. The thermal silica was grown from float-zone (low background doping level) silicon wafers using the wet oxidation method. As a final step, the devices were annealed for 18-hours at 1000∘C in N2. The samples were stored and measured in a dry N2 environment to minimize environmental impact on optical loss. Tapered fiber couplers Cai et al. (2000); Spillane et al. (2003) were used to couple probe light to the resonator samples.
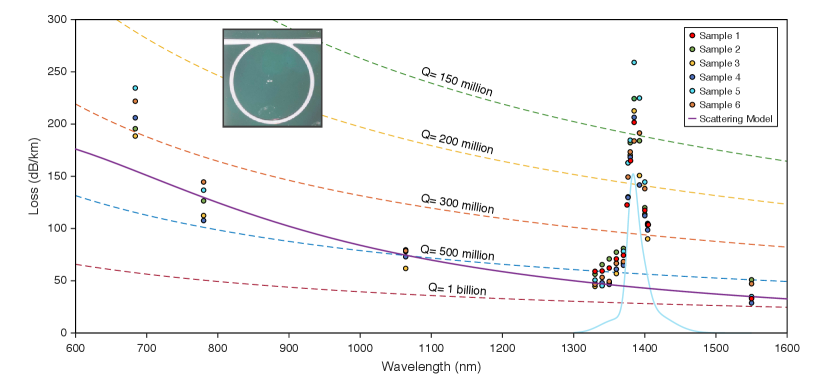
Fig. 1 summarizes the optical loss measurements using six of these devices measured at wavelengths from 680 nm to 1550 nm. All resonators feature intrinsic quality factor (Q-factor) over 500 million at 1550 nm. The corresponding Q-factors are also given in the plot (dashed contours). Significantly, the devices have record-high Q values for on-chip devices in the shorter wavelength bands: 300 million at 685 nm, 500 million at 780 nm, and 600 million at 1064 nm. As an aside, the loss per unit length (dB/km) is determined from the optical Q-factor measurement using the relationship , where Q0 is intrinsic Q-factor in billions, is the mode effective refractive index and is the wavelength (nm). The intrinsic Q-factor Q0 is obtained from the relationship by measuring the resonance linewidth with Lorentzian lineshape fitting to obtain the loaded Q-factor QL followed by measurement of transmission depth to infer the coupling Q-factor Qc.
A strong increase in loss near 1380 nm is apparent in all six samples, corresponding to the OH absorption band and reaching over 200 dB/km. This absorption quickly decreases for wavelengths above and below 1380 nm. The loss in other spectral regions is believed to be dominated by Rayleigh scattering. The wavelength dependence of this scattering within the resonator mode volume would scale approximately as , and does not fit the data. Modeling of surface scattering is described in the Methods and provides better agreement with the wavelength dependence. This theoretical dependence is given by the purple curve where surface roughness variance (1.9 nm) and correlation length (350 nm) are assumed in the plot Barwicz and Haus (2005). The origin of the increased loss at the shortest wavelengths measured is not known, but possibilities include absorption loss from metallic ion impurities and scattering from material density fluctuations. For example, SIMS Wilson (1989) data has shown that Chromium is a residual contaminant in our processing, and Cr3+ ions can contribute 1.6 dB/km/ppbw at 800 nm (peak at 625 nm) to absorption Olshansky (1979).
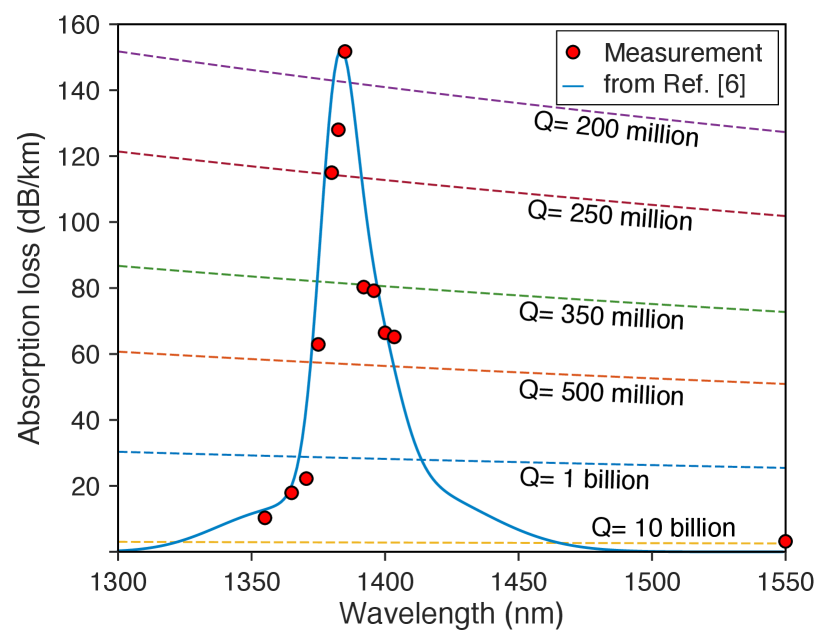
Cavity-enhanced photothermal spectroscopy (CEPS) Gao et al. (2022) was used to further study the OH absorption loss. This method measures the microresonator resonance thermal triangle formation induced by the thermo-optical effect Carmon et al. (2004) to determine mode volume absorption. Details on this method are provided in reference Gao et al. (2022). Fig. 2 summarizes the wavelength dependence of the measured absorption loss in both the 1380 nm band and at 1550 nm. The measured absorption near 1380 nm follows reasonably well the OH overtone lineshape in silica as determined elsewhere Humbach et al. (1996) (blue curve superimposed in plot). To fit the magnitude of the lineshape function to the data, an OH content level of 2.4 ppm weight is used. Also, the data near 1550 nm indicate that by further reduction in scattering loss, the existing thermal silica can provide absorption limited Q factors as high as 8 billion. This value is 2 larger than measured for wedge resonators in a previous study Gao et al. (2022) and is attributed to application of an improved resist cleaning step. The absorption loss measurement results at 1385 nm and 1550 nm are summarized in Table 1 and compared with values from the literature.
| Material | 1385 (dB/km) | 1550 (dB/km) |
|---|---|---|
| thermal silica in this study | 152 | 3.2 |
| 1 ppmw OH in silica Humbach et al. (1996) | 62.7 | |
| Wet fiber studied in Humbach et al. (1996) | 48500 | 100 |
| Fiber studied in Thomas et al. (2000) | 1.172 | 0.045 |
| low-OH fiber Li (1985); Keiser (2010) | 0.05 |
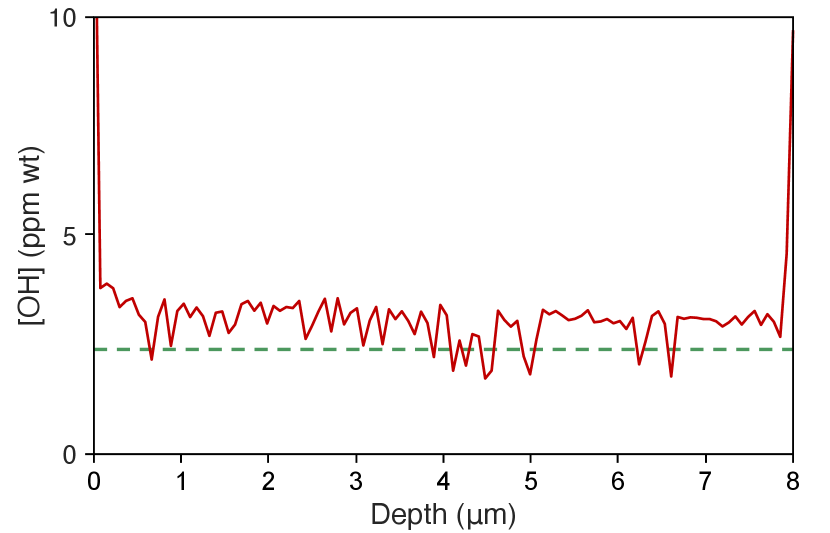
To further confirm the OH ion impurity level and also study its spatial distribution over the resonator oxide thickness, secondary ion mass spectroscopy (SIMS) depth profiling Wilson (1989) was employed (see Fig. 3). The absolute OH ion concentration in this measurement is obtained from the ratio 17OH/30Si, as calibrated against reference samples Hauri et al. (2002); Mosenfelder et al. (2011). The OH concentration remains nearly constant along the depth direction with a value in reasonable agreement with the CEPS results in Fig. 2. This uniformity is believed to result from diffusion-driven equilibrium Thomas et al. (2000) during the long oxide growth process and the post high-temperature annealing process Wu et al. (2020). The higher OH concentration near the surfaces is consistent with the hydrophilic nature of silica causing water to be adsorbed on the surfaces Gorodetsky et al. (1996); Rokhsari et al. (2004).
In summary, using thermal silica wedge microresonators and by measuring optical loss from 680 nm to 1550 nm, the OH ion absorption peak in 1380 nm band stands out from base line scattering loss. Absorption-only loss in the 1380 nm band was also measured using cavity enhanced photo-thermal spectroscopy. This gave a maximum absorption loss of 152 dB/km at 1385 nm. Fitting of the absorption spectrum gives an OH content level of 2.4 ppm weight, which is consistent with separate measurements performed on the resonator oxide by Secondary Ion Mass Spectroscopy. Outside the OH overtone absorption band, surface scattering was determined to be the dominant loss mechanism. Record high Q factors (limited by scattering) were measured for visible and near-visible wavelengths. Also, with further reduction scattering loss, Q values approaching 8 billion are feasible at 1550 nm. This value is higher than determined in previous measurements Gao et al. (2022). Overall, this investigation highlights the potential for even lower loss levels and higher Q factors using thermal silica in photonic devices.
Methods
The scattering loss for silica wedge resonators is dominant by surface inhomogeneity scattering rather than bulk inhomogeneity scattering, as evident by the following two experimental observations. First, the optical loss is roughly inversely proportional to the bending radius Wu et al. (2020), a characteristic feature for surface roughness scattering Gorodetsky et al. (1996, 2000). Second, with bending radius over 1 mm, the resonances of wedge resonators never have splitting effect Kippenberg et al. (2002) even with Q-factor over 1 billion Wu et al. (2020).
Surface scattering loss can be modeled as dipole radiation of surface inhomogeneities polarized by the local electrical field Barwicz and Haus (2005). The equivalent current density induced by the corresponding dipole moments is
where is the angular frequency of the light, is the free space permittivity, are refractive indices of cavity and cladding materials and is the local electrical field. The corresponding radiation field and Poynting vector are given by
where is the wave number of the light and is the volume element of inhomogeneity. When adding up the radiation field from different part of surface, their coherence is limited by the correlation length. Using the correlation function of surface roughness , and assuming that the correlation length is small enough to ignore the variation of the field within this length, the Poynting vector field can be reduced to
where is Fourier transformation of , is the propagation constant of cavity mode at , and is the component of parallel to the surface at .
In the calculation of and the radiation power, the parameters of the cavity mode, such as mode profiles and propagation constants, are acquired by numerical simulation (Lumerical MODE). The correlation function of surface roughness in the calculation is assumed to be a Gaussian function with the form . The parameters of the surface roughness are acquired by Atomic Force Microscopy (AFM) measurements, fitted with Gaussian-type function, revealing that the lower surface has of 2 nm, whereas the upper and wedge surfaces have smaller than 0.5 nm Lee et al. (2012a, b).
Funding Information:
This work was funded by DARPA (HR0011-22-2-0009).
Acknowledgments:
The authors acknowledge support provided by The Kavli Nanoscience Institute (KNI) at Caltech and Caltech Microanalysis Center (CMC) at Division of Geological Planetary Sciences. The authors thank George R. Rossman, Yunbin Guan and Qing-Xin Ji for fruitful discussions.
Disclosures: The authors declare no conflicts of interest.
References
- Lee et al. (2012a) H. Lee, T. Chen, J. Li, K. Y. Yang, S. Jeon, O. Painter, and K. J. Vahala, Chemically etched ultrahigh-Q wedge-resonator on a silicon chip, Nature Photonics 6, 369 (2012a).
- Wu et al. (2020) L. Wu, H. Wang, Q. Yang, Q. xin Ji, B. Shen, C. Bao, M. Gao, and K. Vahala, Greater than one billion Q factor for on-chip microresonators, Opt. Lett. 45, 5129 (2020).
- Jin et al. (2021) W. Jin, Q.-F. Yang, L. Chang, B. Shen, H. Wang, M. A. Leal, L. Wu, M. Gao, A. Feshali, M. Paniccia, K. J. Vahala, and J. E. Bowers, Hertz-linewidth semiconductor lasers using CMOS-ready ultra-high-Q microresonators, Nature Photonics 15, 346 (2021).
- Puckett et al. (2021) M. W. Puckett, K. Liu, N. Chauhan, Q. Zhao, N. Jin, H. Cheng, J. Wu, R. O. Behunin, P. T. Rakich, K. D. Nelson, and D. J. Blumenthal, 422 Million intrinsic quality factor planar integrated all-waveguide resonator with sub-MHz linewidth, Nature Communications 12, 934 (2021).
- Gao et al. (2022) M. Gao, Q.-F. Yang, Q.-X. Ji, H. Wang, L. Wu, B. Shen, J. Liu, G. Huang, L. Chang, W. Xie, S.-P. Yu, S. B. Papp, J. E. Bowers, T. J. Kippenberg, and K. J. Vahala, Probing material absorption and optical nonlinearity of integrated photonic materials, Nature Communications 13, 3323 (2022).
- Humbach et al. (1996) O. Humbach, H. Fabian, U. Grzesik, U. Haken, and W. Heitmann, Analysis of OH absorption bands in synthetic silica, Journal of Non-Crystalline Solids 203, 19 (1996).
- Cai et al. (2000) M. Cai, O. Painter, and K. J. Vahala, Observation of Critical Coupling in a Fiber Taper to a Silica-Microsphere Whispering-Gallery Mode System, Phys. Rev. Lett. 85, 74 (2000).
- Spillane et al. (2003) S. M. Spillane, T. J. Kippenberg, O. J. Painter, and K. J. Vahala, Ideality in a Fiber-Taper-Coupled Microresonator System for Application to Cavity Quantum Electrodynamics, Phys. Rev. Lett. 91, 043902 (2003).
- Barwicz and Haus (2005) T. Barwicz and H. A. Haus, Three-Dimensional Analysis of Scattering Losses Due to Sidewall Roughness in Microphotonic Waveguides, J. Lightwave Technol. 23, 2719 (2005).
- Wilson (1989) R. G. Wilson, Secondary Ion Mass Spectrometry : a practical handbook for depth profiling and bulk impurity analysis (Wiley, 1989).
- Olshansky (1979) R. Olshansky, Propagation in glass optical waveguides, Rev. Mod. Phys. 51, 341 (1979).
- Carmon et al. (2004) T. Carmon, L. Yang, and K. J. Vahala, Dynamical thermal behavior and thermal self-stability of microcavities, Opt. Express 12, 4742 (2004).
- Thomas et al. (2000) G. A. Thomas, B. I. Shraiman, P. F. Glodis, and M. J. Stephen, Towards the clarity limit in optical fibre, Nature 404, 262 (2000).
- Li (1985) T. Li, Optical Fiber Communications: Fiber Fabrication (Academic Press, 1985).
- Keiser (2010) G. Keiser, Optical fiber communications (4th edition) (McGraw-Hill Education, 2010).
- Hauri et al. (2002) E. Hauri, J. Wang, J. E. Dixon, P. L. King, C. Mandeville, and S. Newman, SIMS analysis of volatiles in silicate glasses: 1. Calibration, matrix effects and comparisons with FTIR, Chemical Geology 183, 99 (2002).
- Mosenfelder et al. (2011) J. L. Mosenfelder, M. Le Voyer, G. R. Rossman, Y. Guan, D. R. Bell, P. D. Asimow, and J. M. Eiler, Analysis of hydrogen in olivine by SIMS: Evaluation of standards and protocol, American Mineralogist 96, 1725 (2011).
- Gorodetsky et al. (1996) M. L. Gorodetsky, A. A. Savchenkov, and V. S. Ilchenko, Ultimate Q of optical microsphere resonators, Opt. Lett. 21, 453 (1996).
- Rokhsari et al. (2004) H. Rokhsari, S. M. Spillane, and K. J. Vahala, Loss characterization in microcavities using the thermal bistability effect, Applied Physics Letters 85, 3029 (2004).
- Gorodetsky et al. (2000) M. L. Gorodetsky, A. D. Pryamikov, and V. S. Ilchenko, Rayleigh scattering in high-Q microspheres, J. Opt. Soc. Am. B 17, 1051 (2000).
- Kippenberg et al. (2002) T. J. Kippenberg, S. M. Spillane, and K. J. Vahala, Modal coupling in traveling-wave resonators, Opt. Lett. 27, 1669 (2002).
- Lee et al. (2012b) H. Lee, T. Chen, J. Li, O. Painter, and K. J. Vahala, Ultra-low-loss optical delay line on a silicon chip, Nature Communications 3, 867 (2012b).