On the Evaluation Metrics for Paraphrase Generation
Abstract
In this paper we revisit automatic metrics for paraphrase evaluation and obtain two findings that disobey conventional wisdom: (1) Reference-free metrics achieve better performance than their reference-based counterparts. (2) Most commonly used metrics do not align well with human annotation. Underlying reasons behind the above findings are explored through additional experiments and in-depth analyses. Based on the experiments and analyses, we propose ParaScore, a new evaluation metric for paraphrase generation. It possesses the merits of reference-based and reference-free metrics and explicitly models lexical divergence. Experimental results demonstrate that ParaScore significantly outperforms existing metrics. The codes and toolkit are released in https://github.com/shadowkiller33/ParaScore.
1 Introduction
Paraphrase generation is a fundamental problem in natural language processing (NLP), which has been widely applied in versatile tasks, such as question answering Dong et al. (2017); Lan and Xu (2018); Gan and Ng (2019); Abujabal et al. (2019), machine translation Madnani et al. (2012); Apidianaki et al. (2018); Kajiwara (2019), and semantic parsing Herzig and Berant (2019); Wu et al. (2021); Cao et al. (2020). Recent years have witnessed rapid development in paraphrase generation algorithms Sun et al. (2021); Huang and Chang (2021); Kumar et al. (2020). However, little progress has been made in the automatic evaluation of this task. It is even unclear which metric is more reliable among many widely used metrics.
Most evaluation metrics used in previous paraphrase generation research are not designed for the task itself, but adopted from other evaluation tasks, such as machine translation (MT) and summarization. However, paraphrase evaluation is inherently different from the evaluation of most other tasks, because a good paraphrase typically obeys two criteria Gleitman and Gleitman (1970); Chen and Dolan (2011); Bhagat and Hovy (2013): semantic similarity () and lexical divergence (). means that the paraphrase maintains similar semantics to the input sentence, whereas requires that the paraphrase possesses lexical or syntactic differences from the input. In contrast, tasks like machine translation have no requirement for . It is therefore uncertain whether the metrics borrowed from other tasks perform well in paraphrase evaluation.
In this paper, we revisit automatic metrics for paraphrase evaluation. We collect a list of popular metrics used in recent researches Kumar et al. (2019); Feng et al. (2021); Hegde and Patil (2020); Sun et al. (2021); Huang and Chang (2021); Kumar et al. (2020), and computed their correlation with human annotation. Generally, these metrics fall into two categories, i.e., reference-based and reference-free metrics. The former is utilized much more frequently than the latter.
We first empirically quantify the matching degree between metric scores and human annotation, on two datasets of different languages. Upon both benchmarks, we make comprehensive experiments to validate the reliability of existing metrics. Surprisingly, we obtain two important findings: (1) Reference-free metrics better align with human judgments than reference-based metrics on our benchmarks, which is counter-intuitive in related evaluation tasks. (2) Most of these metrics (especially the commonly-used BLEU and Rouge) do not agree well with human evaluation.
Then we explore the potential reasons behind the above findings through additional experiments. For the first finding, we demonstrate that the performance comparison between reference-free and reference-based metrics is largely affected by the input-candidate and reference-candidate distance distribution. Specifically, reference-free metrics are better because most paraphrase candidates in the testset have larger lexical distances to the reference than to the input, but reference-based metrics may be better for the minority candidates. To study the second finding, we design an approach based on attribution analysis Ajzen and Fishbein (1975); Anderson Jr et al. (1976) to decouple the factors of semantic similarity and lexical divergence. Our experiments and analysis show that existing metrics measure semantic similarity well, but tend to ignore lexical divergence.
Based on our analyses, we propose a new family of metrics named ParaScore for paraphrase evaluation, which takes into account the merits from both reference-based and reference-free metrics and explicitly models lexical divergence. Extensive experiments show that our proposed metrics significantly outperform the ones employed in previous research.
In summary, our main contributions are: 111The new dataset and the code of ParaScore is available at the supplementary materials.
-
•
We observe two interesting findings that disobey conventional wisdom. First, reference-free metrics outperform reference-based ones on our benchmarks. Second, most existing metrics do not align well with human annotation.
-
•
Underlying reasons behind the above findings are explored through additional experiments and in-depth analysis.
-
•
Based on the findings and analysis, we propose ParaScore, a family of evaluation metrics for paraphrase generation. They align significantly better with human annotation than existing metrics.
2 Revisiting Paraphrasing Metrics
2.1 Settings
In a standard supervised paraphrase evaluation scenario, we are given an input sentence and a reference (the golden paraphrase of ). The goal is to evaluate the quality of a paraphrase candidate .
Dataset
Our experiments selected two benchmarks: Twitter-Para (English) and BQ-Para (Chinese). Twitter-Para is from the Twitter dataset Xu et al. (2014, 2015), while BQ-Para is built based on the BQ dataset Chen et al. (2018).
Specifically, considering that some metrics may have hyper-parameters, so we use 10% data in the benchmark as the dev set and tune the hyper-parameters on the dev set. Then the performance of metrics is evaluated on the remaining 90% data. Please refer to Appendix A for more details about the two datasets.
Chosen Metrics
We select the following well known metrics: BLEU Papineni et al. (2002), ROUGE Lin (2004), METEOR Banerjee and Lavie (2005), BERTScore Zhang et al. (2019), and BARTScore Yuan et al. (2021). Specifically, we consider two variants of BERTScore: BERTScore(B) and BERTScore(R), based on BERT Devlin et al. (2019) and RoBERTa Liu et al. (2019) respectively. For each metric , we consider its two variants, i.e., a reference-based version and a reference-free version ‘.Free’. In the reference-free version, the quality of a candidate is estimated by , where is the input. Similarly, in the reference-based version, the formula is , where is the reference.
2.2 Experimental Results
| Metric | Twitter-Para | BQ-Para | ||
|---|---|---|---|---|
| Pr. | Spr. | Pr. | Spr. | |
| BLEU-4 | -0.119 | -0.104 | 0.127 | 0.144 |
| BLEU-4.Free | -0.113 | -0.101 | 0.109 | 0.136 |
| Rouge-1 | 0.271 | 0.276 | 0.229 | 0.206 |
| Rouge-1.Free | 0.292 | 0.300 | 0.264 | 0.232 |
| Rouge-2 | 0.181 | 0.144 | 0.226 | 0.216 |
| Rouge-2.Free | 0.228 | 0.189 | 0.252 | 0.242 |
| Rouge-L | 0.249 | 0.239 | 0.221 | 0.204 |
| Rouge-L.Free | 0.266 | 0.253 | 0.260 | 0.230 |
| METEOR | 0.423 | 0.418 | - | - |
| METEOR.Free | 0.469 | 0.471 | - | - |
| BERTScore(B) | 0.470 | 0.468 | 0.332 | 0.322 |
| BERTScore(B).Free | 0.491 | 0.488 | 0.397 | 0.392 |
| BERTScore(R) | 0.368 | 0.358 | 0.387 | 0.376 |
| BERTScore(R).Free | 0.373 | 0.361 | 0.449 | 0.438 |
| BARTScore | 0.311 | 0.306 | 0.241 | 0.230 |
| BARTScore.Free | 0.295 | 0.286 | 0.282 | 0.263 |
For each dataset and metric, the score of each sentence in the dataset is calculated by the metric. The obtained scores are then compared with human annotation to check their correlation. The correlation scores, measured by Pearson and Spearman correlations, are reported in Table 1. Several observations can be made from the table.
Reference-based vs. reference-free
It can be seen from the table that, for most metrics, their reference-free variants align better with human annotation than their reference-based counterparts. This indicates that reference-free metrics perform better in the paraphrase generation task, which is somewhat counterintuitive. More detailed analysis about this observation will be given in Sec 3.
Low correlation
The second observation is that, the correlation between the metrics and human judgments is not high. In other words, most of the commonly-used metrics do not align well with human annotation. BLEU-4 even shows a negative correlation with human annotation on Twitter-Para. As the third observation, embedding-based metrics (e.g., BERTScore) tend to outperform ngram-based ones (including the variants of BLEU and Rouge). The main reason for this lies in the effectiveness of embedding-based metrics in capturing semantic similarity. Despite the better performance, embedding-based metrics are still far from satisfactory. On one hand, the results in the table show that the correlation scores for the embedding-based metrics are not high enough. On the other hand, embedding-based metrics assign a very high score for a candidate if it is the same as the input text. This is an obvious flaw, because it violates the lexical divergence criterion of paraphrasing. Therefore, we can see obvious drawbacks for both ngram-based and embedding-based metrics.
In summary, we have two findings from the experimental results: (1) Reference-free metrics outperform reference-based ones on our benchmarks. (2) Most of the popular metrics (especially the commonly-used BLEU and Rouge) do not align well with human annotation.
3 Reference-Free vs. Reference-Based
The results in the previous section indicate that reference-free metrics typically have better performance than their reference-based counterpart. In this section, we investigate this finding by answering the following question: When and why do reference-free metrics outperform their reference-based variants?
3.1 The Distance Effect
Recall that the reference-based and reference-free variants of a metric calculate the score of a candidate sentence by and respectively. Intuitively, as shown in Freitag et al. (2020); Rei et al. (2021), if the lexical distance between and is large, may not agree well with human annotation. Therefore, we guess the lexical distance between and may be an important factor that influences the performance of with respect to human evaluation.
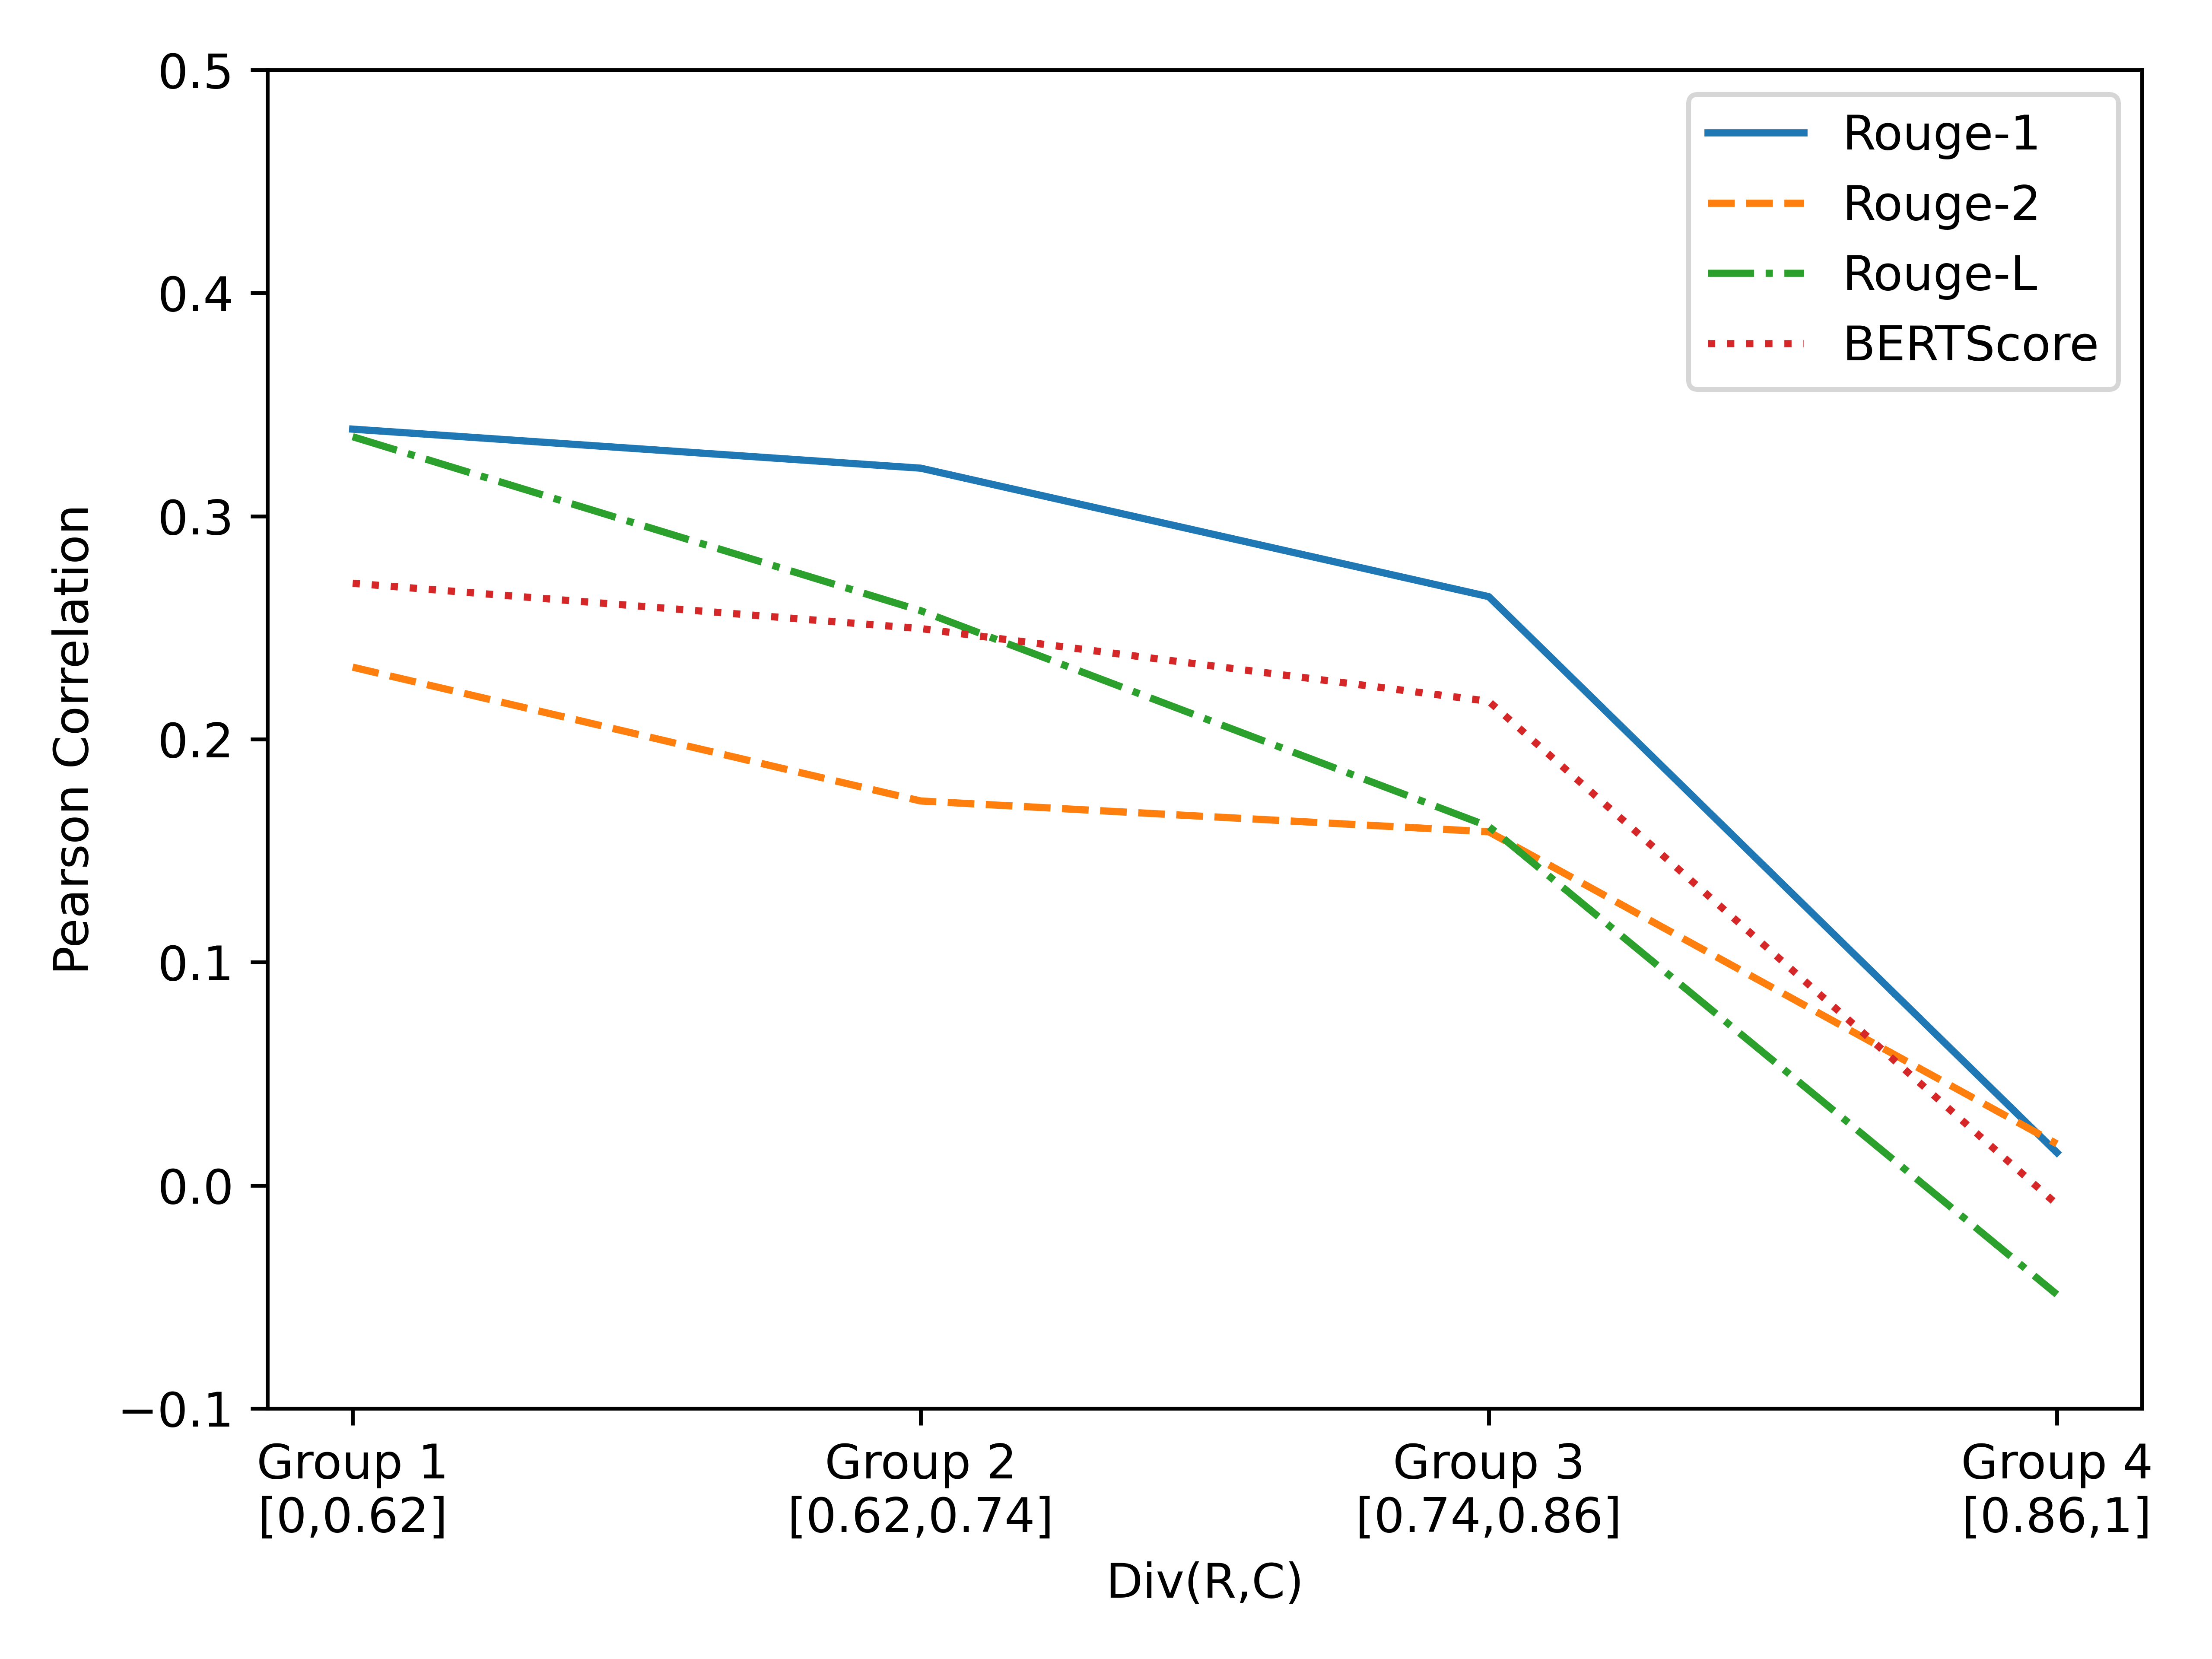
To verify this conjecture, we divide the candidates in a benchmark (e.g., Twitter-Para) into four equal-size groups (group 1 to group 4) according to ,222Here is measured by normalized edit distance (NED), which is widely used in retrieving translation memory Cai et al. (2021); He et al. (2021). Its definition is deferred to Appendix C . where elements in group 1 have small values. The performance of several reference-based metrics on such four groups is shown in Figure 1333We can see a counter-intuitive observation that the highest correlation on the subset is lower than the one on the whole set. This is a reasonable statistical phenomenon called Simpson’s paradox Wagner (1982).. It can be seen that when grows larger, the performance of the metrics decreases. There is a significant performance drop from group 3 to group 4 when the lexical distance is very large.
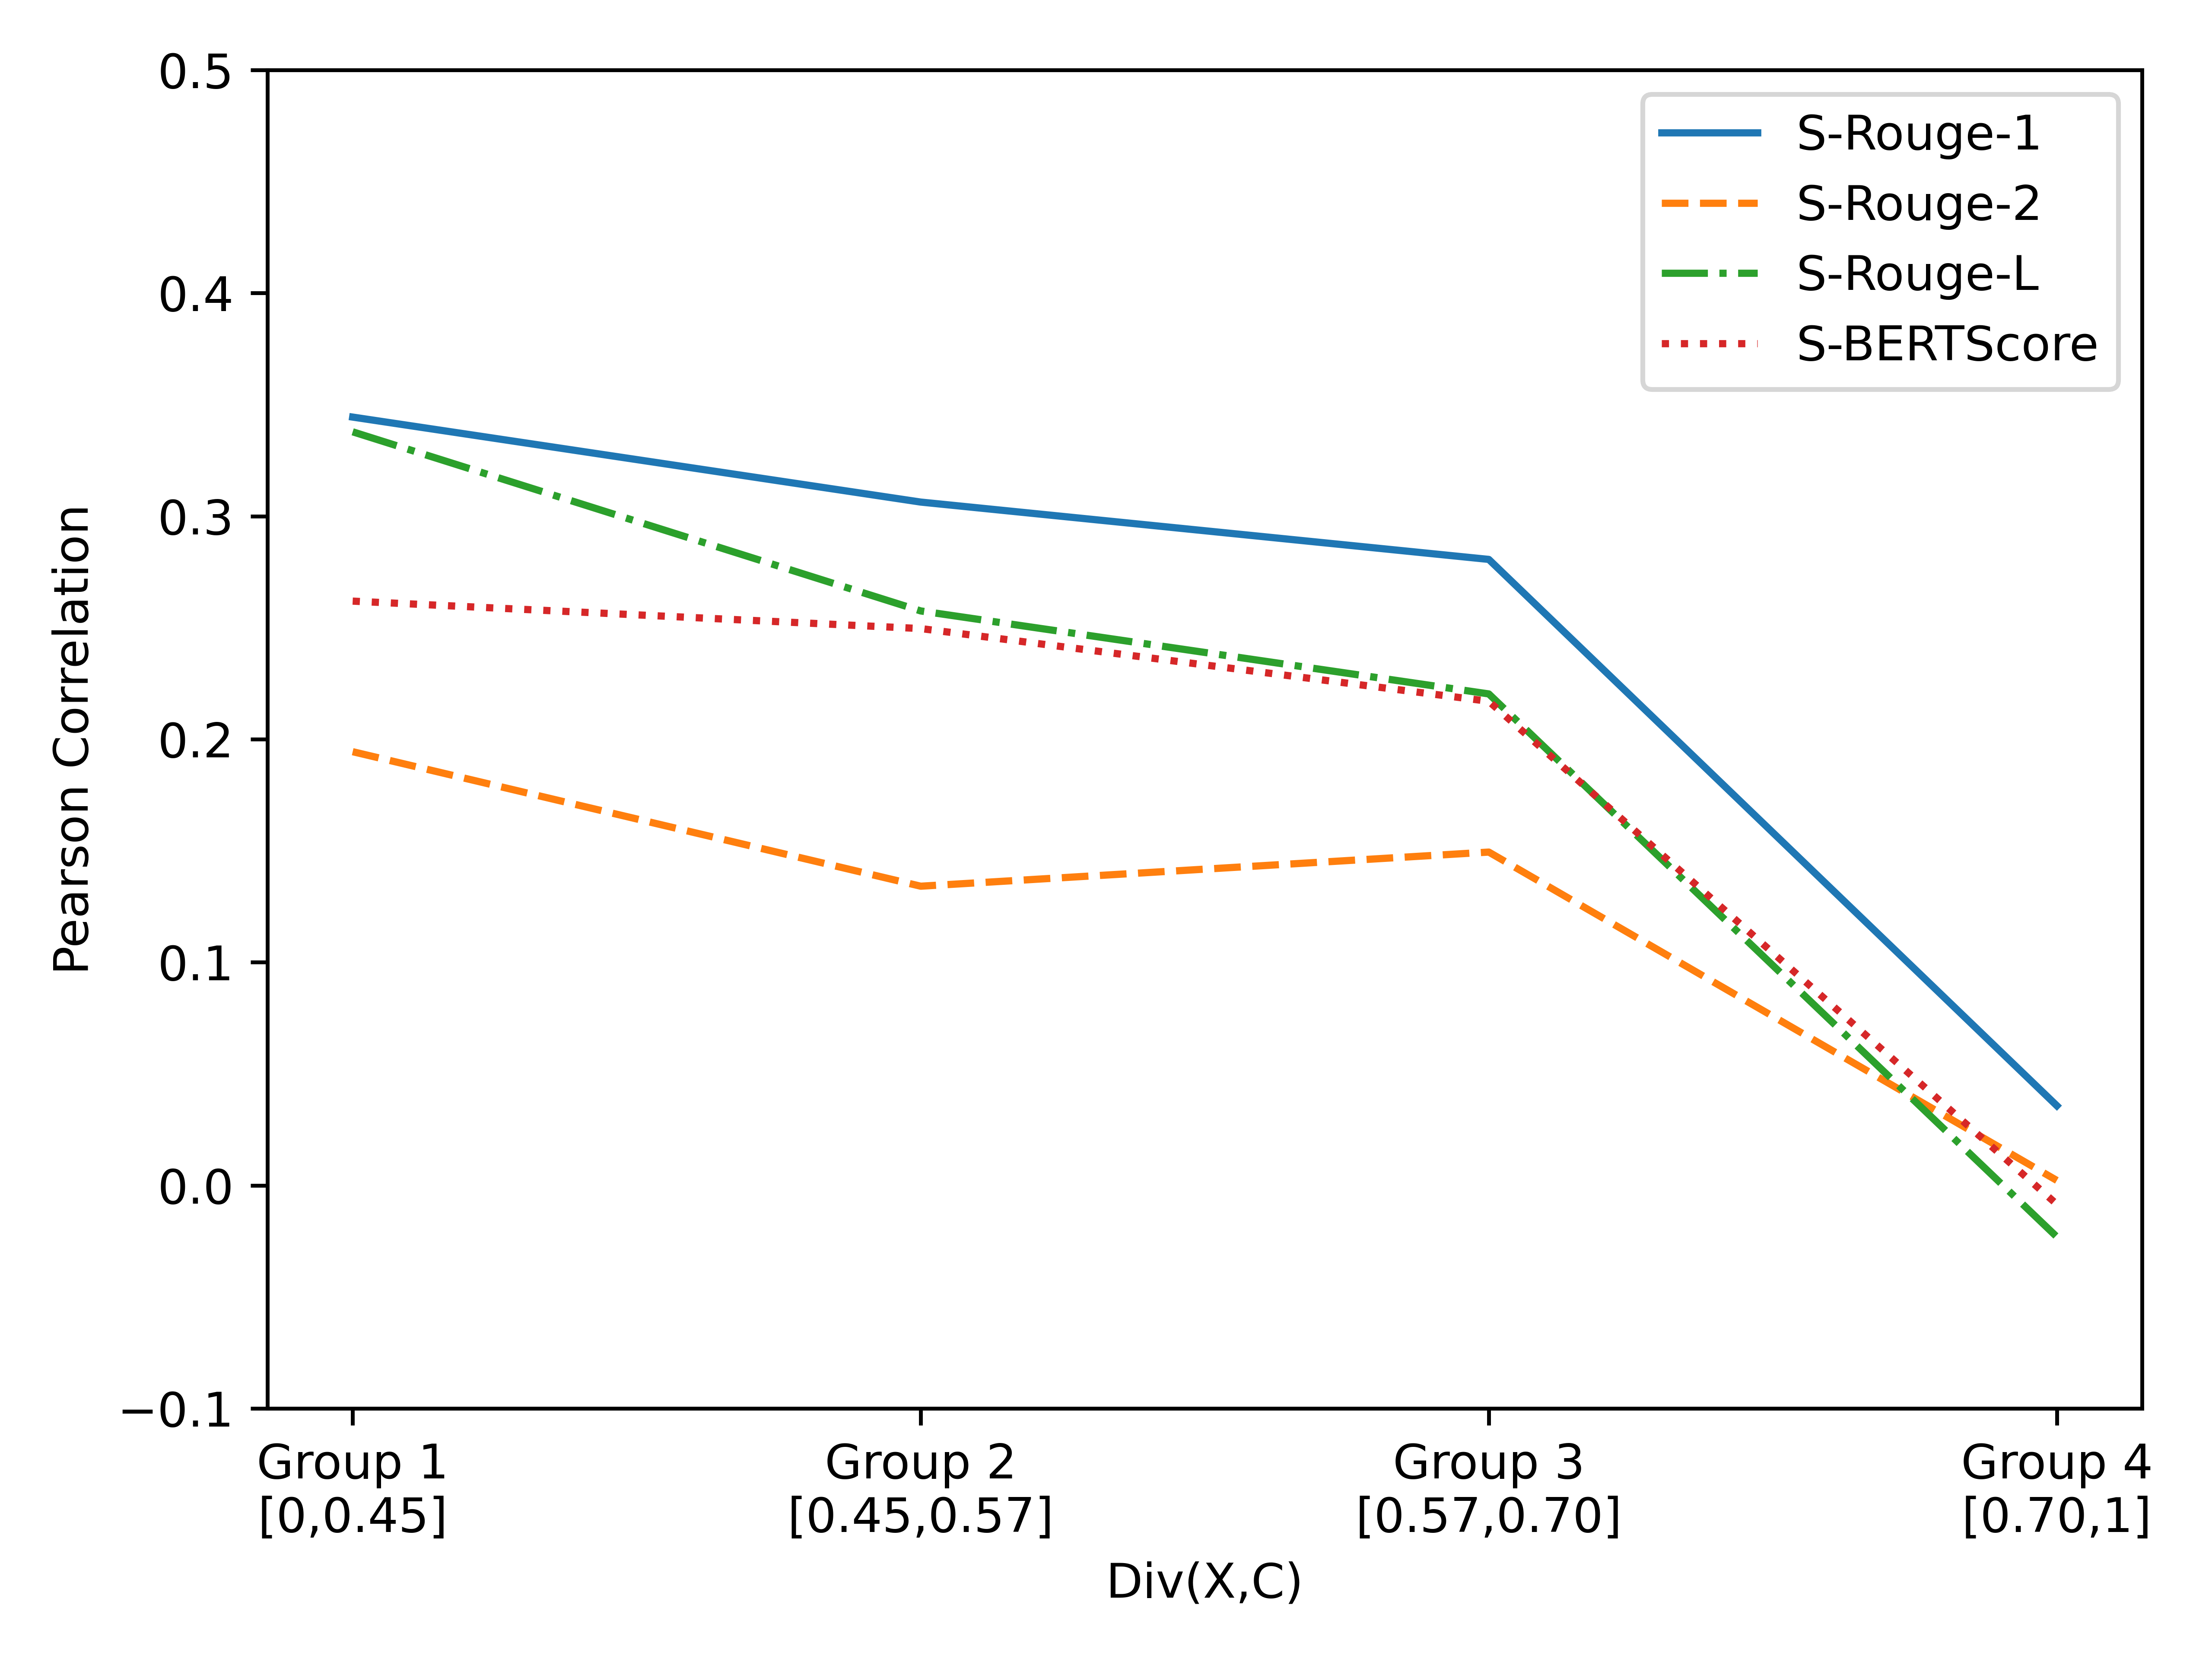
Similarly experiments are conducted for reference-free metrics. We separate the sentences in Twitter-Para into four equal-size groups according to and obtain the results in Figure 2. Again, the correlation between each metric and human annotation decreases when gets larger. A significant performance drop is observed when the lexical distance is very large (see group 4). The above results indicate that small lexical distances are important for both reference-based and reference-free metrics to produce high-quality scores.
3.2 Average Distance Hypothesis
According to the results in the previous subsection, the average distance from a group of candidates to or has a large effect on the performance of a metric on this candidate group. It is reasonable to further guess that lexical distances also affects the performance comparison between reference-based and reference-free metrics.
Therefore we make the following average distance hypothesis:
For a group of candidates , a reference-based metric outperforms its reference-free counterpart on if is significantly larger than . Similarly, the reference-free version is better if is greatly larger than .
Here denotes the average lexical distance from the candidates in to .
| Twitter-Para | BQ-Para | |||
| Metric | I | II | I | II |
| RougeL | 0.357 | 0.191 | 0.352 | 0.193 |
| RougeL.Free | 0.207 | 0.325 | 0.319 | 0.280 |
| Rouge1 | 0.367 | 0.223 | 0.362 | 0.199 |
| Rouge1.Free | 0.267 | 0.345 | 0.308 | 0.270 |
| Rouge2 | 0.256 | 0.120 | 0.366 | 0.200 |
| Rouge2.Free | 0.160 | 0.275 | 0.283 | 0.260 |
| BERTScore | 0.284 | 0.162 | 0.404 | 0.319 |
| BERTScore.Free | 0.191 | 0.277 | 0.400 | 0.417 |
| -0.110 | +0.132 | -0.044 | +0.079 | |
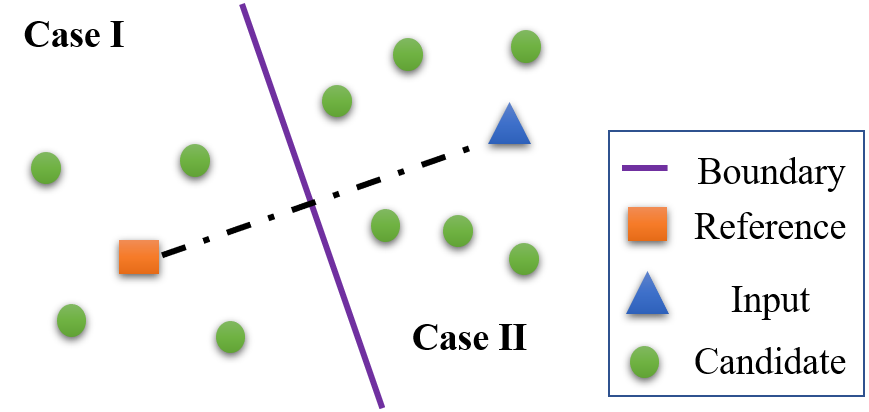
To validate the above hypothesis, we divide a dataset into two parts (part-I and part-II) according to whether or not, as shown in Figure 3. Then we compare the performance of reference-free and reference-based metrics on the two parts of data. The performance of reference-free and reference-based metrics on such cases are listed in Table 2. It is clearly shown that reference-based metrics enjoy better performance on part-I, whereas reference-free metrics perform better on part-II. Such results do verify our average distance hypothesis.
3.3 Why do Reference-Free Metrics Perform Better on our Benchmarks?
By employing the average distance hypothesis, we explain why reference-free metrics have higher performance on our datasets. We calculate the proportion of candidates in Case I and Case II (referring to Figure 3) on Para-Twitter and BQ-Twitter. The results are presented in Table 3. It is shown that there is a larger fraction of Case-II candidates than Case-I on each dataset. Therefore, according to the average distance hypothesis, it is reasonable to have the observation that reference-free metrics are often better than their reference-based counterparts on both datasets.
| Twitter-Para | BQ-Para | |||
|---|---|---|---|---|
| Metric | I | II | I | II |
| -0.110 | +0.132 | -0.044 | +0.079 | |
| Proportion | 46.4% | 53.6% | 15.7% | 84.3% |
4 Decoupling Semantic Similarity and Lexical Divergence
In this section, we investigate why most metrics do not align well with human annotation.
4.1 Attribution Analysis for Disentanglement
As illustrated earlier, a good paraphrase typically obeys two criteria: semantic similarity () and lexical divergence (). To seek the reasons behind the low performance of the metrics, we may need to explore how well these metrics perform in terms of each criterion. However, only one human score is available for a candidate on each dataset. The score is about the overall paraphrasing quality rather than those for a single criterion (either semantic similarity or lexical divergence).
In this section, we propose an approach to decouple the performance of the metrics in terms of each criterion. This proposed approach is inspired by attribution analysis Anderson Jr et al. (1976); Ajzen and Fishbein (1975) and its key idea is to analyze the attribution of one component (or dimension) while controlling the attributions from other components (or dimensions).
Applying attribution analysis to our scenario, we construct a subset , where is a paraphrase candidate pair for an input sentence , such that the difference between and on one criterion ( or ) is significant but the difference on the other criterion is close to zero. As a result, on such a subset , the difference of human score between and is mainly attributed by the interested criterion. Then we can measure the correlation between human scores and a metric in the specific criterion.
| Twitter-Para | BQ-Para | |||
| Base | Base | |||
| #num | 583 | 9158 | 200 | 5156 |
| 0.805 | 0.345 | 0.629 | 0.394 | |
Since there are no ground truth measures for and , we use normalized edit distance (NED) and SimCSE Gao et al. (2021) as the surrogate ground truth of and respectively. They are chosen for two reasons. First, they are widely used and proven to be good for measuring and ,. Second, they are not used as the metrics for paraphrase evaluation in this paper. Therefore, the potential unfairness is reduced.444For example, if we use BERTScore to compute , the statistics on may be biased to BERTScore and thus becomes unfair for other metrics.
4.2 Performance in Capturing
Formally, suppose the subset denotes all satisfying the following constraints:
| (1) | ||||
where is a distance function for calculating , is set as 0.05 and is 0.15. 555Intuitively, the disentanglement effect would be better if is more close to zero and is much larger. However, this leads to the limited size of due to the contradictory between and , and hence the statistical correlation on is not significant.
In addition, we define two quantities for each tuple from as follows:
| (2) | ||||
| (3) |
where refers to the human score. Then we measure the correlation between and on , and the results are shown in Table 4. It can be seen that the correlation is much higher on compared with that on all paraphrase pairs, indicating good disentanglement on . As is proper to demonstrate how well a metric captures semantic similarity, we call it semantic-promoted data.
| Metric | Twitter-Para | BQ-Para |
|---|---|---|
| BLEU-4.Free | 0.067 | 0.372 |
| Rouge-1.Free | 0.574 | 0.430 |
| Rouge-2.Free | 0.400 | 0.350 |
| Rouge-L.Free | 0.481 | 0.388 |
| METEOR.Free | 0.499 | - |
| BERTScore(B).Free | 0.785 | 0.576 |
| BARTScore.Free | 0.797 | 0.552 |
| Sim | 0.805 | 0.629 |
To investigate how well existing metrics capture semantic similarity, we add an extra definition:
| (4) |
where is a reference-free metric. Then we measure the correlation between and on the semantic-promoted data, and get the results in Table 5. The results suggest that the embedding-based metrics (i.e., BERTScore.Free) significantly outperform word-overlap metrics (i.e., BLEU.Free) in capturing semantic similarity. Overall, the results show that some metrics perform pretty well in capturing semantic similarity.
4.3 Performance in Capturing
Similarly, to analyze the ability of metrics in capturing , we exchange with in Eq 1 and obtain a subset of tuples named ( and ). In this case, the principal attribution on is lexical divergence. In addition, we define as follows:
| (5) |
Then we conduct analyses on to examine the effect of disentanglement for lexical divergence. It is interesting that the correlation between and on is almost zero, which indicates that higher distance scores does not guarantee better paraphrasing. This fact is in line with previous findings Bhagat and Hovy (2013). Let’s explain by the examples in Table 6. It is reasonable for candidate to get a low human annotation score due to its small lexical distance to the input . Though has a larger distance to than , they are assigned the same annotation score, possibly because both and are good enough in terms of from the viewpoint of human annotators. Such results show that when the distance is large (i.e., beyond a threshold), does not correlate well with human score .
| Type | Text | |||
|---|---|---|---|---|
|
- | - | ||
|
0.21 | 0.4 | ||
|
0.53 | 1.0 | ||
|
0.79 | 1.0 |
We modify our decoupling strategy by further dividing into two parts according to a distance threshold. We define as follows:
| (6) |
where represents the minimum score in . We use 0.35 as the threshold to split , with containing all the tuples satisfying , and containing other tuples. The Pearson correlation of and on the two subsets are listed in Table 7. According to the results, the correlation is high on but almost zero on . This is consistent with our intuition that candidates with larger scores tend to have higher quality when the distances are under a threshold. However, increasing scores does not improve quality when the distances exceed a threshold.
| Twitter-Para | BQ-Para | |||
| #num | 192 | 3876 | 290 | 6217 |
| 0.635 | 0.021 | 0.655 | 0.025 | |
The correlation between and on are shown in Table 8. It is shown that the correlation scores for all the metrics (except for the Dist function itself) are negative, which means the metrics tend to have opposite judgments with human annotators about the paraphrasing quality for the candidates in .
| Metric | Twitter-Para | BQ-Para |
|---|---|---|
| BLEU-4.Free | -0.197 | -0.075 |
| Rouge-1.Free | -0.385 | -0.334 |
| Rouge-2.Free | -0.377 | -0.308 |
| Rouge-L.Free | -0.426 | -0.514 |
| METEOR.Free | -0.233 | - |
| BERTScore(B).Free | -0.424 | -0.347 |
| BARTScore.Free | -0.187 | -0.263 |
| NED | 0.635 | 0.655 |
5 New Metric: ParaScore
5.1 ParaScore
Inspired by previous experiments and analyses, we propose a new metric named ParaScore, as below,
| (7) |
where is a hyper-parameter in our experiments, is motivated by the analysis in §3.2, and is defined as a sectional function to model lexical divergence (referring to the analysis in §4.3):
| (8) |
where is a hyper-parameter, d=, which can be any proper distance metric. In our experiments, and are respectively instantiated by BERTScore and NED 666Note that there may be other advanced metrics to instantiate (e.g., SimCSE) and other heuristic combination (e.g., weighted geometric mean) methods, which we leave as future work., and is fixed as 0.35.
ParaScore defined in Eq. (7) involves the reference and thus it is a reference-based metric. It is natural to extend ParaScore to its reference-free version ParaScore.Free by removing as follows:
| Metric | Twitter-Para | BQ-Para | ||
|---|---|---|---|---|
| Pearson | Spearman | Pearson | Spearman | |
| BERTScore(B) | 0.470 | 0.468 | 0.332 | 0.322 |
| BERTScore(R) | 0.368 | 0.358 | 0.387 | 0.376 |
| BARTScore | 0.311 | 0.306 | 0.260 | 0.246 |
| iBLEU(0.2) | 0.013 | 0.033 | 0.155 | 0.139 |
| BERTScore(B).Free | 0.491 | 0.488 | 0.397 | 0.392 |
| BERT-iBLEU(B,4) | 0.488 | 0.485 | 0.393 | 0.383 |
| ParaScore | 0.522 | 0.523 | 0.492 | 0.489 |
| ParaScore.Free | 0.492 | 0.489 | 0.398 | 0.393 |
| Metric | Twitter(Extend) | BQ-Para(Extend) | ||
|---|---|---|---|---|
| Pearson | Spearman | Pearson | Spearman | |
| BERTScore(B) | 0.427 | 0.432 | 0.248 | 0.267 |
| BERTScore(R) | 0.334 | 0.329 | 0.299 | 0.317 |
| BARTScore | 0.280 | 0.276 | 0.199 | 0.206 |
| iBLEU(0.2) | 0.011 | 0.032 | 0.129 | 0.121 |
| BERTScore(B).Free | 0.316 | 0.419 | 0.230 | 0.312 |
| BERT-iBLEU(B,4) | 0.327 | 0.416 | 0.221 | 0.303 |
| ParaScore | 0.527 | 0.530 | 0.510 | 0.442 |
| ParaScore.Free | 0.496 | 0.495 | 0.487 | 0.428 |
5.2 Experimental Results
Benchmarks and baselines
Experiments are conducted on four datasets: Twitter-Para, BQ-Para, and the extended version of them. The extended version of each dataset is built by adding 20% of the input sentences as candidates. They are called Twitter(Extend) and BQ(Extend) respectively. Since the newly added candidates are input sentences, according to the requirements of paraphrasing, their annotation scores are 0. The goal of adding the extended version of the datasets is to test the robustness of different metrics on various data distributions. In addition to the baselines in previous sections, we add two more baselines: BERT-iBLEU Niu et al. (2021) and iBLEU Siddique et al. (2020); Liu et al. (2020), whose details are listed in Appendix D.
Performance comparison
The performance of each metric on the four datasets are listed in Table 9. Several observations can be made. First of all, ParaScore performs significantly better than all the other metrics on all the datasets. It is also shown that ParaScore is much more robust than other metrics. Second, on both Twitter-Para and BQ-Para, BERT-iBLEU performs worse than vanilla BERTScore. Note that BERT-iBLEU Niu et al. (2021) also considers lexical divergence, and it applies a harmonic weight mean of BERTScore (for semantic similarity) and -BLEU.Free (for lexical divergence). However, according to results in Table 9, it is only comparable to BERTScore.Free or even worse. This further indicates that 1) the weighted harmonic mean formation is sub-optimal, 2) the sectional threshold is important as discussed in §4.3, making the performance comparable to BERTScore.Free in most cases, as shown in Appendix E.
| Metric | Twitter(Extend) | BQ-Para(Extend) | ||
|---|---|---|---|---|
| Pr. | Spr. | Pr. | Spr. | |
| ParaScore | 0.527 | 0.530 | 0.510 | 0.442 |
| ParaScore w/o thresh | 0.358 | 0.450 | 0.266 | 0.333 |
| ParaScore w/o max | 0.496 | 0.495 | 0.487 | 0.428 |
| ParaScore w/o DS | 0.349 | 0.450 | 0.249 | 0.326 |
Ablation study
We study of effect of three factors of ParaScore: the max function, the DS function for divergence, and the threshold mechanism in Equ (8). The results are listed in Table 10. By comparing ParaScore with ‘ParaScore w/o DS’, we can see that ParaScore significantly degrades when removing or its sectional version, which confirms the effectiveness of and the sectional function for . These findings demonstrate that a sectional function for is beneficial for paraphrase evaluation. According to the results, all of the above listed factors are essential for the effectiveness of ParaScore.
Discussion
According to Table 8, we can observe that existing metrics do not well consider the lexical divergence, including BERTScore.Free. On the two original benchmarks, as shown in Table 9, BERTScore.Free is still competitive with ParaScore.Free, which explicitly models lexical divergence. This fact seems to disagree with the human evaluation guideline that lexical divergence is also important. Therefore, these results may reveal a potential drawback in the original benchmarks: They overlook the role of lexical divergence. Although the extended version of both benchmarks alleviates such a drawback to some extent, it introduces divergence into both datasets in a toy manner by copying the inputs rather than in a natural manner. It would be important to build a better benchmark for paraphrase evaluation in the future.
6 Related Work
Most previous works conduct paraphrase evaluation by the reference-based MT metrics from the popular tasks similar to paraphrase generation such as machine translation Bannard and Callison-Burch (2005); Callison-Burch (2008); Cohn et al. (2008); Kumar et al. (2020); Goyal and Durrett (2020); Sun et al. (2021); Huang and Chang (2021). However, paraphrase evaluation is different from these tasks: the paraphrase should possess lexical or syntactic differences toward the input sentence, which is not emphasized in these tasks.
Generally, the metrics in paraphrase evaluation can be divided into two kinds: reference-free and reference-based metric. Most reference-based metrics include BLEU Papineni et al. (2002), Rouge Lin (2004), and METEOR Banerjee and Lavie (2005). In addition, the reference-free of these metrics have also been used: Self-BLEU Shu et al. (2019) measures the BLEU score between the generated paraphrase and input sentence. Moreover, the iBLEU Choshen and Abend (2018) score penalizes repeating the input sentence in the generated paraphrase. BERT-iBLEU Zhou and Bhat (2021) takes the weighted harmonic mean of the BERTscore Zhang et al. (2019) and one minus self-BLEU. Previous works commonly utilize reference-based metrics in evaluation, in this paper, we also pay attention to the overlooked reference-free metrics.
The difference between the existing works and our work is obvious. Existing works mainly employ these metrics to evaluate the paraphrases generated from a model. However, the reliability of existing paraphrase metrics has not been evaluated comprehensively. Thus, we prepare two paraphrase evaluation benchmarks (Chinese and English) and conduct comprehensive experiments to compare existing metrics’ performance on these benchmarks. In particular, based on the empirical findings, this paper proposes a new framework for paraphrase evaluation.
7 Conclusion
This paper first reviews the reliability of existing metrics for paraphrasing evaluation by investigating how well they correlate with human judgment. Then, we find two interesting findings and further ask two questions behind them that are overlooked by the community: (1) why do reference-free metrics outperform reference-based ones? (2) what is the limitation of existing metrics? We deliver detailed analyses of such two questions and present the explanation by disentangling paraphrase quality. Based on our analyses, finally, we propose ParaScore (with both reference-based and reference-free implementations) for paraphrase evaluation, and its effectiveness is validated through comprehensive experiments. In addition, we call for building better benchmarks which can faithfully reflect the importance of lexical divergence in paraphrase evaluation; we hope it will shed light on the future direction.
Limitation
One limitation in this paper is that it does not provide a perfect benchmark which remarkably reflects the importance of lexical divergence in a natural way rather than the heuristic way used in the experiments. Creating such a benchmark would be important for future studies on paraphrase evaluation. It is also interesting to examine the potential benefits of the proposed ParaScore on such a benchmark.
Ethical Considerations
The datasets used in this paper will not pose ethical problems. For the Twitter-Para dataset, it is a publicly available dataset. For the BQ-Para dataset, its inputs are from the public dataset BQ and we recruited five annotators to manually annotate the quality of paraphrases with the proper pay.
References
- Abujabal et al. (2019) Abdalghani Abujabal, Rishiraj Saha Roy, Mohamed Yahya, and Gerhard Weikum. 2019. Comqa: A community-sourced dataset for complex factoid question answering with paraphrase clusters. In Proceedings of the 2019 Conference of the North American Chapter of the Association for Computational Linguistics: Human Language Technologies, Volume 1 (Long and Short Papers), pages 307–317.
- Ajzen and Fishbein (1975) Icek Ajzen and Martin Fishbein. 1975. A bayesian analysis of attribution processes. Psychological bulletin, 82(2):261.
- Anderson Jr et al. (1976) W Thomas Anderson Jr, Eli P Cox III, and David G Fulcher. 1976. Bank selection decisions and market segmentation: Determinant attribute analysis reveals convenience-and sevice-oriented bank customers. Journal of marketing, 40(1):40–45.
- Apidianaki et al. (2018) Marianna Apidianaki, Guillaume Wisniewski, Anne Cocos, and Chris Callison-Burch. 2018. Automated paraphrase lattice creation for hyter machine translation evaluation. In Proceedings of the 2018 Conference of the North American Chapter of the Association for Computational Linguistics: Human Language Technologies, Volume 2 (Short Papers), pages 480–485.
- Banerjee and Lavie (2005) Satanjeev Banerjee and Alon Lavie. 2005. Meteor: An automatic metric for mt evaluation with improved correlation with human judgments. In Proceedings of the acl workshop on intrinsic and extrinsic evaluation measures for machine translation and/or summarization, pages 65–72.
- Bannard and Callison-Burch (2005) Colin Bannard and Chris Callison-Burch. 2005. Paraphrasing with bilingual parallel corpora. In Proceedings of the 43rd Annual Meeting of the Association for Computational Linguistics (ACL’05), pages 597–604.
- Bhagat and Hovy (2013) Rahul Bhagat and Eduard Hovy. 2013. What is a paraphrase? Computational Linguistics, 39(3):463–472.
- Cai et al. (2021) Deng Cai, Yan Wang, Huayang Li, Wai Lam, and Lemao Liu. 2021. Neural machine translation with monolingual translation memory. In Proceedings of the 59th Annual Meeting of the Association for Computational Linguistics and the 11th International Joint Conference on Natural Language Processing (Volume 1: Long Papers), pages 7307–7318.
- Callison-Burch (2008) Chris Callison-Burch. 2008. Syntactic constraints on paraphrases extracted from parallel corpora. In Proceedings of the 2008 Conference on Empirical Methods in Natural Language Processing, pages 196–205.
- Cao et al. (2020) Ruisheng Cao, Su Zhu, Chenyu Yang, Chen Liu, Rao Ma, Yanbin Zhao, Lu Chen, and Kai Yu. 2020. Unsupervised dual paraphrasing for two-stage semantic parsing. In Proceedings of the 58th Annual Meeting of the Association for Computational Linguistics, pages 6806–6817.
- Chen and Dolan (2011) David Chen and William B Dolan. 2011. Collecting highly parallel data for paraphrase evaluation. In Proceedings of the 49th annual meeting of the association for computational linguistics: human language technologies, pages 190–200.
- Chen et al. (2018) Jing Chen, Qingcai Chen, Xin Liu, Haijun Yang, Daohe Lu, and Buzhou Tang. 2018. The bq corpus: A large-scale domain-specific chinese corpus for sentence semantic equivalence identification. In Proceedings of the 2018 conference on empirical methods in natural language processing, pages 4946–4951.
- Choshen and Abend (2018) Leshem Choshen and Omri Abend. 2018. Automatic metric validation for grammatical error correction. In Proceedings of the 56th Annual Meeting of the Association for Computational Linguistics (Volume 1: Long Papers), pages 1372–1382.
- Cohn et al. (2008) Trevor Cohn, Chris Callison-Burch, and Mirella Lapata. 2008. Constructing corpora for the development and evaluation of paraphrase systems. Computational Linguistics, 34(4):597–614.
- Devlin et al. (2019) Jacob Devlin, Ming-Wei Chang, Kenton Lee, and Kristina Toutanova. 2019. Bert: Pre-training of deep bidirectional transformers for language understanding. In Proceedings of the 2019 Conference of the North American Chapter of the Association for Computational Linguistics: Human Language Technologies, Volume 1 (Long and Short Papers), pages 4171–4186.
- Dong et al. (2017) Li Dong, Jonathan Mallinson, Siva Reddy, and Mirella Lapata. 2017. Learning to paraphrase for question answering. In Proceedings of the 2017 Conference on Empirical Methods in Natural Language Processing, pages 875–886.
- Feng et al. (2021) Steven Y Feng, Varun Gangal, Jason Wei, Sarath Chandar, Soroush Vosoughi, Teruko Mitamura, and Eduard Hovy. 2021. A survey of data augmentation approaches for nlp. In Findings of the Association for Computational Linguistics: ACL-IJCNLP 2021, pages 968–988.
- Freitag et al. (2020) Markus Freitag, David Grangier, and Isaac Caswell. 2020. Bleu might be guilty but references are not innocent. In Proceedings of the 2020 Conference on Empirical Methods in Natural Language Processing (EMNLP), pages 61–71.
- Gan and Ng (2019) Wee Chung Gan and Hwee Tou Ng. 2019. Improving the robustness of question answering systems to question paraphrasing. In Proceedings of the 57th Annual Meeting of the Association for Computational Linguistics, pages 6065–6075.
- Gao et al. (2021) Tianyu Gao, Xingcheng Yao, and Danqi Chen. 2021. Simcse: Simple contrastive learning of sentence embeddings. In Proceedings of the 2021 Conference on Empirical Methods in Natural Language Processing, pages 6894–6910.
- Gleitman and Gleitman (1970) Lila R Gleitman and Henry Gleitman. 1970. Phrase and paraphrase: Some innovative uses of language.
- Goyal and Durrett (2020) Tanya Goyal and Greg Durrett. 2020. Neural syntactic preordering for controlled paraphrase generation. In Proceedings of the 58th Annual Meeting of the Association for Computational Linguistics, pages 238–252.
- He et al. (2021) Qiuxiang He, Guoping Huang, Qu Cui, Li Li, and Lemao Liu. 2021. Fast and accurate neural machine translation with translation memory. In Proceedings of the 59th Annual Meeting of the Association for Computational Linguistics and the 11th International Joint Conference on Natural Language Processing (Volume 1: Long Papers), pages 3170–3180.
- Hegde and Patil (2020) Chaitra Hegde and Shrikumar Patil. 2020. Unsupervised paraphrase generation using pre-trained language models. arXiv preprint arXiv:2006.05477.
- Herzig and Berant (2019) Jonathan Herzig and Jonathan Berant. 2019. Don’t paraphrase, detect! rapid and effective data collection for semantic parsing. In Proceedings of the 2019 Conference on Empirical Methods in Natural Language Processing and the 9th International Joint Conference on Natural Language Processing (EMNLP-IJCNLP), pages 3810–3820.
- Huang and Chang (2021) Kuan-Hao Huang and Kai-Wei Chang. 2021. Generating syntactically controlled paraphrases without using annotated parallel pairs. In Proceedings of the 16th Conference of the European Chapter of the Association for Computational Linguistics: Main Volume, pages 1022–1033.
- Kajiwara (2019) Tomoyuki Kajiwara. 2019. Negative lexically constrained decoding for paraphrase generation. In Proceedings of the 57th Annual Meeting of the Association for Computational Linguistics, pages 6047–6052.
- Kumar et al. (2020) Ashutosh Kumar, Kabir Ahuja, Raghuram Vadapalli, and Partha Talukdar. 2020. Syntax-guided controlled generation of paraphrases. Transactions of the Association for Computational Linguistics, 8:330–345.
- Kumar et al. (2019) Ashutosh Kumar, Satwik Bhattamishra, Manik Bhandari, and Partha Talukdar. 2019. Submodular optimization-based diverse paraphrasing and its effectiveness in data augmentation. In Proceedings of the 2019 Conference of the North American Chapter of the Association for Computational Linguistics: Human Language Technologies, Volume 1 (Long and Short Papers), pages 3609–3619.
- Lan and Xu (2018) Wuwei Lan and Wei Xu. 2018. Neural network models for paraphrase identification, semantic textual similarity, natural language inference, and question answering. In Proceedings of the 27th International Conference on Computational Linguistics, pages 3890–3902.
- Lin (2004) Chin-Yew Lin. 2004. Rouge: A package for automatic evaluation of summaries. In Text summarization branches out, pages 74–81.
- Liu et al. (2020) Xianggen Liu, Lili Mou, Fandong Meng, Hao Zhou, Jie Zhou, and Sen Song. 2020. Unsupervised paraphrasing by simulated annealing. In Proceedings of the 58th Annual Meeting of the Association for Computational Linguistics, pages 302–312.
- Liu et al. (2019) Yinhan Liu, Myle Ott, Naman Goyal, Jingfei Du, Mandar Joshi, Danqi Chen, Omer Levy, Mike Lewis, Luke Zettlemoyer, and Veselin Stoyanov. 2019. Roberta: A robustly optimized bert pretraining approach. arXiv preprint arXiv:1907.11692.
- Madnani et al. (2012) Nitin Madnani, Joel Tetreault, and Martin Chodorow. 2012. Re-examining machine translation metrics for paraphrase identification. In Proceedings of the 2012 conference of the north american chapter of the association for computational linguistics: Human language technologies, pages 182–190.
- Miller (1995) George A Miller. 1995. Wordnet: a lexical database for english. Communications of the ACM, 38(11):39–41.
- Niu et al. (2021) Tong Niu, Semih Yavuz, Yingbo Zhou, Nitish Shirish Keskar, Huan Wang, and Caiming Xiong. 2021. Unsupervised paraphrasing with pretrained language models. In Proceedings of the 2021 Conference on Empirical Methods in Natural Language Processing, pages 5136–5150.
- Papineni et al. (2002) Kishore Papineni, Salim Roukos, Todd Ward, and Wei-Jing Zhu. 2002. Bleu: a method for automatic evaluation of machine translation. In Proceedings of the 40th annual meeting of the Association for Computational Linguistics, pages 311–318.
- Rei et al. (2021) Ricardo Rei, Ana C Farinha, Chrysoula Zerva, Daan van Stigt, Craig Stewart, Pedro Ramos, Taisiya Glushkova, André FT Martins, and Alon Lavie. 2021. Are references really needed? unbabel-ist 2021 submission for the metrics shared task. In Proceedings of the Sixth Conference on Machine Translation, pages 1030–1040.
- Shu et al. (2019) Raphael Shu, Hideki Nakayama, and Kyunghyun Cho. 2019. Generating diverse translations with sentence codes. In Proceedings of the 57th Annual Meeting of the Association for Computational Linguistics, pages 1823–1827.
- Siddique et al. (2020) AB Siddique, Samet Oymak, and Vagelis Hristidis. 2020. Unsupervised paraphrasing via deep reinforcement learning. In Proceedings of the 26th ACM SIGKDD International Conference on Knowledge Discovery & Data Mining, pages 1800–1809.
- Sun et al. (2021) Jiao Sun, Xuezhe Ma, and Nanyun Peng. 2021. Aesop: Paraphrase generation with adaptive syntactic control. In Proceedings of the 2021 Conference on Empirical Methods in Natural Language Processing, pages 5176–5189.
- Wagner (1982) Clifford H Wagner. 1982. Simpson’s paradox in real life. The American Statistician, 36(1):46–48.
- Wu et al. (2021) Shan Wu, Bo Chen, Chunlei Xin, Xianpei Han, Le Sun, Weipeng Zhang, Jiansong Chen, Fan Yang, and Xunliang Cai. 2021. From paraphrasing to semantic parsing: Unsupervised semantic parsing via synchronous semantic decoding. In Proceedings of the 59th Annual Meeting of the Association for Computational Linguistics and the 11th International Joint Conference on Natural Language Processing (Volume 1: Long Papers), pages 5110–5121.
- Xu et al. (2015) Wei Xu, Chris Callison-Burch, and William B Dolan. 2015. Semeval-2015 task 1: Paraphrase and semantic similarity in twitter (pit). In Proceedings of the 9th international workshop on semantic evaluation (SemEval 2015), pages 1–11.
- Xu et al. (2014) Wei Xu, Alan Ritter, Chris Callison-Burch, William B Dolan, and Yangfeng Ji. 2014. Extracting lexically divergent paraphrases from twitter. Transactions of the Association for Computational Linguistics, 2:435–448.
- Yuan et al. (2021) Weizhe Yuan, Graham Neubig, and Pengfei Liu. 2021. Bartscore: Evaluating generated text as text generation. Advances in Neural Information Processing Systems, 34.
- Zhang et al. (2019) Tianyi Zhang, Varsha Kishore, Felix Wu, Kilian Q Weinberger, and Yoav Artzi. 2019. Bertscore: Evaluating text generation with bert. In International Conference on Learning Representations.
- Zhou and Bhat (2021) Jianing Zhou and Suma Bhat. 2021. Paraphrase generation: A survey of the state of the art. In Proceedings of the 2021 Conference on Empirical Methods in Natural Language Processing, pages 5075–5086.
Appendix A Details of Twitter-Para
Our Twitter-Para is a pre-processed dataset based on Xu et al. (2014, 2015). In the original dataset Xu et al. (2014, 2015), there are some input sentences that have no corresponding references, so we drop such input-candidate pairs to create Twitter-Para. Specifically, the human-annotated score ranges from 01.0, where higher scores mean better quality. The basic statistics of Twitter-Para are listed in Table 11.
| #input | #candidate | #reference | avg candidate |
|---|---|---|---|
| 761 | 7159 | 761 | 9.41 |
Appendix B Details of BQ-Para
Considering the absence of Chinese paraphrase evaluation benchmarks, we build BQ-Para based on the BQ dataset. We select 550 sentences as input sentences from BQ-dataset. Each sentence owns a manually-written reference and also owns ten candidates. Specifically, such candidates are generated by popular paraphrase generation algorithms. Then, for such a candidate, given the input sentence, we hire professional annotators to provide a score between to reflect its paraphrase quality. The basic statistics of BQ-Para are listed in Table 12.
| #input | #candidate | #reference | avg candidate |
|---|---|---|---|
| 550 | 5550 | 550 | 10 |
Appendix C Definition of normalized edit distance
Given two sentences and , the definition of normalized edit score is defined as follows:
| (9) |
where is the length of sentence .
Appendix D Definition of BERT-iBLEU and iBLEU
BERT-iBLEU is defined as follows:
| BERT-iBLEU | (10) | |||
| SelfBLEU |
where is a constant (usually set as 4).
iBLEU is a hybrid metric that computes the difference between BLEU and SelfBLEU, which is defined as follows:
| (11) |
where is a constant (usually set as 0.3).
Appendix E A detailed analysis towards BERT-iBLEU
Principally, we can formulate any existing metrics into the combination of semantic similarity (Sim) and lexical divergence(Div), including BERT-iBLEU. Firstly, we recall the definition of BERT-iBLEU:
| BERT-iBLEU |
Naturally, we re-write BERT-iBLEU as the following formation:
| BERT-iBLEU |
where Sim represents the BERTScore and Div denotes (1-SelfBLEU). Though such a formation indeed contains both lexical divergence and semantic similarity, it can not gaurantee that BERT-iBLEU is a good paraphrase metric that serves as a human-like automatic metric. Existing work Niu et al. (2021) only shows that it outperforms n-gram-based metrics. The following experiments demonstrate an interesting conclusion: BERT-iBLEU consistently performs worse than SelfBERTScore, and then we present our analysis. The results are demonstrated in Table 13, from where we can see that BERT-iBLEU(B) consistently under-perform than BERTScore(B).
| Metric | Twitter-Para | BQ-Para | ||
|---|---|---|---|---|
| Pr. | Spr. | Pr. | Spr. | |
| BERTScore(B).Free | 0.491 | 0.488 | 0.397 | 0.392 |
| BERT-iBLEU(B,4) | 0.488 | 0.485 | 0.393 | 0.383 |
| BERT-iBLEU(B,5) | 0.490 | 0.488 | 0.395 | 0.392 |
| BERT-iBLEU(B,10) | 0.490 | 0.488 | 0.396 | 0.389 |
To explain such interesting results, we re-write BERT-iBLEU as follows:
| BERT-iBLEU | |||
As we can see, BERT-iBLEU can be decoupled into two terms Sim and (We denote it as term ‘Mix’). According to the analysis in our paper, after removing the Sim, the remaining part, the ‘Mix’ term should be able to reflect diversity. However, the ‘Mix’ term does not represent meaningful aspects of paraphrase quality. Specifically, we investigate the correlation between the ‘Mix’ term and human annotation, only resulting in correlations close to zero, indicating that the ‘Mix’ term is improper since there is nearly no correlation between it and human annotation. Overall, BERT-iBLEU owns an improper combination of semantic similarity and diversity.