Optimal designs in regression with correlated errors
Abstract
This paper discusses the problem of determining optimal designs for regression models, when the observations are dependent and
taken on an interval. A complete solution of this challenging
optimal design problem is given for a broad class of regression models and covariance kernels.
We propose a class of estimators which are only slightly more complicated than the ordinary least-squares estimators.
We then demonstrate that we can design the experiments, such that asymptotically the new estimators achieve the same precision as the
best linear unbiased estimator computed for the whole trajectory
of the process. As a by-product we derive explicit expressions for the BLUE in the continuous time model and analytic expressions for the optimal designs in a wide class of regression models. We also demonstrate that for a finite number of observations the precision of the proposed procedure, which includes the estimator and design, is very close to the best achievable. The results are illustrated on a few numerical examples.
Keywords and Phrases: linear regression, correlated observations, signed measures, optimal design, BLUE, Gaussian processes, Doob representation
AMS Subject classification: Primary 62K05; Secondary 31A10
1 Introduction
Optimal design theory is a classical field of mathematical statistics with numerous applications in life sciences, physics and engineering. In many cases the use of optimal or efficient designs yields to a reduction of costs by a statistical inference with a minimal number of experiments without loosing any accuracy. Most work on optimal design theory concentrates on experiments with independent observations. Under this assumption the field is very well developed and a powerful methodology for the construction of optimal designs has been established [see for example the monograph of Pukelsheim, (2006)]. While important and elegant results have been derived in the case of independence, there exist numerous situations where correlation between different observations is present and these classical optimal designs are not applicable.
The theory of optimal design for correlated observations is much less developed and explicit results are only available in rare circumstances. The challenging difficulty consists here in the fact that - in contrast to the independent case - correlations yield to non-convex optimization problems and classical tools of convex optimization theory are not applicable. Some exact optimal designs for specific linear models have been studied in Dette et al., (2008); Kiselak and Stehlík, (2008); Harman and Štulajter, (2010). Because explicit solutions of optimal design problems for correlated observations are rarely available, several authors have proposed to determine optimal designs based on asymptotic arguments [see for example Sacks and Ylvisaker, (1966, 1968), Bickel and Herzberg, (1979), Näther, 1985a , Zhigljavsky et al., (2010)], where the references differ in the asymptotic arguments used to embed the discrete (non-convex) optimization problem in a continuous (or approximate) one. However, in contrast to the uncorrelated case, this approach does not simplify the problem substantially and due to the lack of convexity the resulting approximate optimal design problems are still extremely difficult to solve. As a consequence, optimal designs have mainly been determined analytically for the location model (in this case the optimization problems are in fact convex) and for a few one-parameter linear models [see Boltze and Näther, (1982), Näther, 1985a , Ch. 4, Näther, 1985b , Pázman and Müller, (2001) and Müller and Pázman, (2003) among others]. Only recently, Dette et al., (2013) determined (asymptotic) optimal designs for least squares estimation in models with more parameters under the additional assumption that the regression functions are eigenfunctions of an integral operator associated with the covariance kernel of the error process. However, due to this assumption, the class of models for which approximate optimal designs can be determined explicitly is rather small.
The present paper provides a complete solution of this challenging optimal design problem for a broad class of regression models and covariance kernels. Roughly speaking, we determine (asymptotic) optimal designs for a slightly modified ordinary least squares estimator (OLSE), such that the new estimate and the corresponding optimal design achieve the same accuracy as the best unbiased linear estimate (BLUE) with corresponding optimal designs.
To be more precise, consider a general regression observation scheme given by
| (1.1) |
where denotes the covariance between observations at the points and . (), is a vector of unknown parameters, is a vector of linearly independent functions, the explanatory variables vary in a compact interval, say . Parallel to model (1.1) we also consider its continuous time version
| (1.2) |
where the full trajectory of the process can be observed and is a centered Gaussian process with covariance kernel , i.e. . This kernel is assumed to be continuous throughout this paper.
We pay much attention to the one-parameter case and develop a general method for solving the optimal design problem in model (1.2) explicitly for the OLSE, perhaps slightly modified. The new estimate and the corresponding optimal design achieve the minimal variance among all linear estimates (obtained by the BLUE). In particular, our approach allows to calculate this optimal variance explicitly. As a by-product we also identify the BLUE in the continuous time model (1.2). Based on these asymptotic considerations, we consider the finite sample case and suggest designs for a new estimation procedure (which is very similar to OLSE) with an efficiency very close to the best possible (obtained by the BLUE and the corresponding optimal design), for any number of observations. In doing this, we show how to implement the optimal strategies from the continuous time model in practice and demonstrate that even for very small sample sizes the loss of efficiency with respect to the best strategies based on the use of BLUE with a corresponding optimal design can be considered as negligible. We would like to point out at this point that - even in the one-dimensional case - the problem of numerically calculating optimal designs for the BLUE for a fixed sample size is an extremely challenging one due to the lack of convexity of the optimization problem.
In our approach, the importance of the one-parameter design problem is also related to the fact that the optimal design problem for multi-parameter models can be reduced component-wisely to problems in the one-parameter models. This gives us a way to generate analytically constructed universally optimal designs for a wide range of continuous time multi-parameter models of the form (1.2). Our technique is based on the observation that for a finite number of observations we can always emulate the BLUE in model (1.1) by a different linear estimator. To achieve that theoretically we assign signs to the support points of a discrete design and not only weights in the one-parameter models, but in the multi-parameter case we use matrix weights. We then determine “optimal” signs and weights and consider the weak convergence of these ‘designs” and estimators as the sample size converges to infinity. Finally, we prove the (universal) optimality of the limits in the continuous time model (1.2).
Theoretically, we construct a sequence of designs for either the pure or a modified OLSE, say , such that its variance or covariance matrix satisfies as the sample size converges to infinity, where is the variance (if ) or covariance matrix (if ) for the BLUE in the continuous time model (1.2). In other words, is the smallest possible variance (or covariance matrix with respect to the Loewner ordering) of any unbiased linear estimator and any design. This makes the designs derived in this paper very competitive in applications against the designs proposed by Sacks and Ylvisaker, (1966) and optimal designs constructed numerically for the BLUE (using the Brimkulov-Krug-Savanov algorithm, for example). We emphasize once again that due to non-convexity the numerical construction of optimal designs for the BLUE is extremely difficult. An additional advantage of our approach is that we can analytically compute the BLUE with the corresponding optimal variance (covariance matrix) in the continuous time model (1.2) and therefore monitor the proximity of different approximations to the optimal variance obtained by the BLUE.
The methodology developed in this paper results in a non-standard estimation and optimal design theory and consists in a delicate interplay between new linear estimators and designs in the models (1.1) and (1.2). For this reason let us briefly introduce various estimators, which we will often refer to in the following discussion. Consider the model (1.1) and suppose that observations are taken at experimental conditions . For the corresponding vector of observations , a general weighted least squares estimator (WLSE) of is defined by
| (1.3) |
where is an design matrix and is some matrix such that exists. For any such the estimator (1.3) is obviously unbiased. The covariance matrix of the estimator (1.3) is given by
| (1.4) |
where is an matrix of variances/covariances. For the standard WLSE the matrix is symmetric non-negative definite; in this case minimizes the weighted sum of squares with respect to . Important particular cases of estimators of the form (1.3) are the OLSE, the best unbiased linear estimate (BLUE) and the signed least squares estimate (SLSE):
| (1.5) | |||||
| (1.6) | |||||
| (1.7) |
Here is an diagonal matrix with entries and on the diagonal; note that if then SLSE is not a standard WLSE. While the use of BLUE and OLSE is standard, the SLSE is less common. It was introduced in Boltze and Näther, (1982) and further studied in Chapter 5.3 of Näther, 1985a . In the content of the present paper, the SLSE will turn out to be very useful for constructing optimal designs for OLSE and the BLUE in the model (1.2) with one parameter, where the full trajectory can be observed. Another estimate of , which is not a special case of the WLSE, will be introduced in Section 3 and used in the multi-parameter models.
The remaining structure of the paper is as follows. In Section 2 we derive optimal designs for continuous time one-parameter models and discuss how to implement the designs in practice. In Section 3 we extend the results of Section 2 to multi-parameter models. In Appendix B we discuss transformations of regression models and associated designs, which are a main tool in the proofs of our result but also of own interest. In particular, we provide an extension of the famous Doob representation for Gaussian processes [see Doob, (1949) and Mehr and McFadden, (1965)], which turns out to be a very important ingredient in proving the design optimality results of Sections 2 and 3. Finally, in Appendix A we collect some auxiliary statements and proofs for the main results of this paper.
2 Optimal designs for one-parameter models
In this section we concentrate on the one-parameter model
| (2.1) |
on the interval and its continuous time analogue, where and . Our approach uses some non-standard ideas and estimators in linear models and therefore we begin this section with a careful explanation of the logic of the material.
-
Sect. 2.1. Under the assumption that the design space is finite we show in Lemma 2.1 that by assigning weights and signs to the observation points we can construct a WLSE which is equivalent to the BLUE. Then, we derive in Corollary 2.1 an explicit form for the optimal weights for a broad class of covariance kernels, which are called triangular covariance kernels.
-
Sect. 2.3. We consider model (2.1) under the assumption that the full trajectory of the process can be observed. For the specific case of Brownian motion, that is , we prove analytically the optimality of the signed measure derived in Theorem 2.1 for OLSE. Then, in Theorem 2.3 we establish optimality of the asymptotic measures from Theorem 2.1 for general covariance kernels. As a by-product we also identify the BLUE in the continuous time model (1.2) (in the one-dimensional case). For this purpose, we introduce a transformation which maps any regression model with a triangular covariance kernel into another model with different triangular kernels. These transformations allow us to reduce any optimization problem to the situation considered in Theorem 2.2, which refers to the case of Brownian motion. The construction of this map is based on an extension of the celebrated Doob’s representation which will be developed in Appendix B.
-
Sect. 2.4. We provide some examples of asymptotic optimal measures for specific models.
-
Sect. 2.5. We introduce a practical implementation of the asymptotic theory derived in the previous sections. For a finite sample size we construct WLSE with corresponding designs which can achieve very high efficiency compared to the BLUE with corresponding optimal design. It turns out that these estimators are slightly modified OLSE, where only observations at the end-points obtain a weight (and in some cases also a sign).
-
Sect. 2.6. We illustrate the new methodology in several examples. In particular, we give a comparison with the best known procedures based on BLUE and show that the loss in precision for the procedures derived in this paper is negligible with our procedures being much simpler and more robust than the procedures based on BLUE.
2.1 Optimal designs for SLSE on a finite design space
In this section, we suppose that the design space for model (2.1) is finite, say , and demonstrate that in this case the approximate optimal designs for the SLSE (1.7) can be found explicitly. Since we consider the SLSE (1.7) rather than the OLSE (1.5), a generic approximate design on the design space is an arbitrary discrete signed measure , where , , () and . We assume that the support of the design is fixed but the weights and signs , or equivalently the signed weights , will be chosen to minimize the variance of the SLSE (1.7). In view of (1.4), this variance is given by
| (2.2) |
Note that this expression coincides with the variance of the WLSE (1.2), where the matrix is defined by .
We assume that for all . If for some then the point can be removed from the design space without changing the SLSE estimator, its variance and the corresponding value . In the above definition of the weights , we have . Note, however, that the value of the criterion (2.2) does not change if we change all the weights from to () for arbitrary .
Despite the fact that the functional in (2.2) is not convex as a function of , the problem of determining the optimal design can be easily solved by a simple application of the Cauchy-Schwarz inequality. The proof of the following lemma is given in Appendix A [see also Theorem 5.3 in Näther, 1985a , where this result was proved in a slightly different form].
Lemma 2.1
Assume that the matrix is positive definite and for all . Then the optimal weights minimizing (2.2) subject to the constraint are given by
| (2.3) |
where , is the -th unit vector, and
Moreover, for the design with weights (2.3) we have , where , the variance of the BLUE defined in (1.6) using all observations .
Lemma 2.1 shows, in particular, that the pair {SLS estimate, corresponding optimal design } provides an unbiased estimator with the best possible variance for the one-parameter model (2.1). This results in a WLSE (1.2) with which is BLUE. In other words, by a slight modification of the OLSE we are able to emulate the BLUE using the appropriate design or WLSE.
While the statement of Lemma 2.1 holds for arbitrary kernels, we are able to determine the optimal weights more explicitly for a broad class, which are called triangular kernels and are of the form
| (2.4) |
where and are some functions on the interval . Note that the majority of covariance kernels considered in literature belong to this class, see for example Näther, 1985a ; Zhigljavsky et al., (2010) or Harman and Štulajter, (2011). The following result is a direct consequence of Lemma A.1 from Appendix A .
Corollary 2.1
Assume that the covariance kernel has the form (2.4) so that the matrix is positive definite and has the entries for , where for we denote , , and also , . If , the weights in (2.3) can be represented explicitly as follows:
| (2.5) | |||||
| (2.6) | |||||
for . In formulas (2.5), (2.6) and (2.1), the quantity denotes the element in the position of the matrix .
2.2 Weak convergence of designs
In this section, we consider the asymptotic properties of designs with weights (2.5) - (2.1). Recall that the design space is an interval, say , and that we assume a triangular covariance function of the form (2.4). According to the discussion of triangular covariance kernels provided in Section 4.1 of Appendix B, the functions and are continuous and strictly positive on the interval and the function is positive, continuous and strictly increasing on . We also assume that the regression function in (2.1) is continuous and strictly positive on the interval . We define the transformation
| (2.8) |
and note that the function is increasing on the interval with and , that is is a cumulative distribution function (c.d.f.). For fixed and , define and the design points
| (2.9) |
Theorem 2.1
Consider the optimal design problem for the model (2.1), where the error process has the covariance kernel of the form (2.4). Assume that , , and are strictly positive, twice continuously differentiable functions on the interval . Consider the sequence of signed measures
where the support points are defined in (2.9) and the weights are assigned to these points according to the rule (2.3) of Lemma 2.1. Then the sequence of measures converges in distribution to a signed measure , which has masses
| (2.10) |
at the points and , respectively, and the signed density
| (2.11) |
(that is, the Radon-Nikodym derivative of with respect to the Lebesque measure) on the interval , where the function is defined by .
The proof of Theorem 2.1 is technically complicated and therefore given in Appendix A. The constant in (2.10) and (2.11) is arbitrary. If a normalization is required, then can be found from the normalizing condition
Throughout this paper we write the limiting designs of Theorem 2.1 in the form
| (2.12) |
where and are the Dirac-measures concentrated at the points and , respectively, and the function is defined by (2.11). Note also that under the assumptions of Theorem 2.1, the function is continuous on the interval . In the case of Brownian motion, the limiting design of Theorem 2.1 is particularly simple.
2.3 Optimal designs and the BLUE
In this section we consider the continuous time model (1.2) in the case and demonstrate that the limiting designs derived in Theorem 2.1 are in fact optimal. A linear estimator for the parameter in model (1.2) is defined by , where is a signed measure on the interval . Special cases include the OLSE and SLSE , where is a measure or a signed measure on the interval , respectively. Note that is unbiased if and only if and is unbiased by construction. The BLUE (in the continuous time model (1.2)) minimizes
in the class of all signed measures satisfying , and
| (2.14) |
denotes the best possible variance of all linear unbiased estimators in the continuous time model (1.2).
Similarly, a signed measure on the interval is called optimal for least squares estimation in the one-parameter model (1.2), if it minimizes the functional
| (2.15) |
in the set of all signed measures on the interval , such that . In the case of a Brownian motion, we are able to establish the optimality of the design of Example 2.1. A proof of the following result is given in Appendix A.
Theorem 2.2
Let be a Brownian motion, so that , and be a positive, twice continuously differentiable function on the interval . Then the signed measure , defined by (2.12) and (2.13) with arbitrary , minimizes the functional (2.15). The minimal value in (2.15) is obtained as
Moreover, the BLUE in model (1.2) is given by , where and is the signed measure defined by (2.12) and (2.13) with constant . This further implies
Based on the design optimality established in Theorem 2.2 for the special case of Brownian motion and the technique of transformation of regression models described in Appendix B, we can establish the optimality of the asymptotic designs derived in Theorem 2.1 for more general covariance kernels; see Appendix A for the proof.
Theorem 2.3
Under the conditions of Theorem 2.1, the optimal design minimizing the functional (2.15) is defined by the formulas (2.10) - (2.12) with arbitrary . The minimal value in (2.15) is obtained as
| (2.16) |
where . Moreover, the BLUE in model (1.2) is given by , where , is the signed measure defined in (2.10) - (2.12) with constant , and
2.4 Examples of optimal designs
In this section, we provide the values of , and the function in the general expression (2.12) for the optimal designs in a number of important special cases for the one-parameter continuous time model (1.2), where the design space is . Specifically, optimal designs are given in Table 1 for the location model, in Table 2 for the linear model, in Table 3 for a quadratic model and in Table 4 for a trigonometric model. The last named model was especially chosen to demonstrate the existence of optimal designs with a density which changes sign in the interval . In the tables several triangular covariance kernels are considered. The parameters of these covariance kernels satisfy the constraints , , , . For the sake of a transparent presentation, we use the factor in all tables, but we emphasize once again that the optimal designs do not depend on the scaling factor.
As an example, if for some , we have from the last row of Table 2 that the optimal design for the continuous time model is , and as a consequence, .
| any | 1 | 0 | 0 | |
|---|---|---|---|---|
| 0 | 1 | 0 | ||
| 0 | ||||
2.5 Practical implementation: designs for finite sample size
In practice, efficient designs and corresponding estimators for the model (1.1) have to be derived from the optimal solutions in the continuous time model (1.2), and in this section a procedure with a good finite sample performance is proposed. Roughly speaking, it consists of a slight modification of the ordinary least squares estimator and a discretization of a continuous signed measure with the asymptotic optimal density in (2.11) .
We assume that the experimenter can take observations with observations inside the interval . In principle, any probability measure on the interval can be approximated by an -point measure with weights and similarly any finite signed measure can be approximated by an -point signed measure with equal weights (in absolute value). We hence could use a direct approximation of the optimal signed measures of the form (2.12) by a sequence of -point signed measures with equal weights (in absolute value). For an increasing sample size this sequence will eventually converge to the optimal measure of Theorem 2.3. However, this convergence will typically be very slow, where we measure the speed of convergence by the differences between the variances of the corresponding estimates and the optimal value defined in (2.16). The main difficulty lies in the fact that a typical optimal measure has masses at the boundary points and , in addition to some density on the interval . The convergence of discrete measures with equal (in absolute value) weights to such a measure will be very slow, especially in view of the fact that in our approximating measures the points cannot be repeated. Summarizing, approximation of the optimal signed measures by measures with equal weights is possible but cannot be accurate for small .
In order to improve the rate of convergence we propose a slight modification of the ordinary least squares procedure. In particular, we propose a WLSE with weights at the points and (the end-points of the interval ), which correspond to the masses and of the asymptotic optimal design. We thus only need to approximate the continuous part of the optimal signed measure, which has a density on , by an -point design with equal masses. To be precise, consider an optimal measure of the form (2.12). We assume that the density is not identically zero on the interval and choose the constant such that . Note that unless changes sign in , we can choose for all . Define for and denote by the corresponding distribution function. The -point design we use as an -point approximation to the measure with density is , where with , . If on a sub-interval of and is not uniquely defined then we choose the smallest element from the set as . Finally, the design we suggest as an ()-point approximation to the optimal measure in (2.12) is
where ,
and
.
The matrix , which corresponds to the design and is used in the corresponding WLSE (1.3),
is a diagonal matrix of size .
The set of design points, where the observations should be taken, is given by
and the resulting estimate is
defined by
| (2.17) |
It follows from (1.4), (2.15) and the discussion of the previous paragraph that
where is defined in (2.14).
2.6 Some numerical results
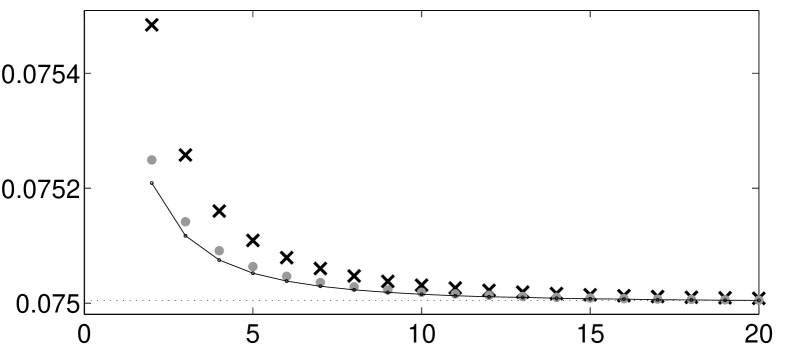
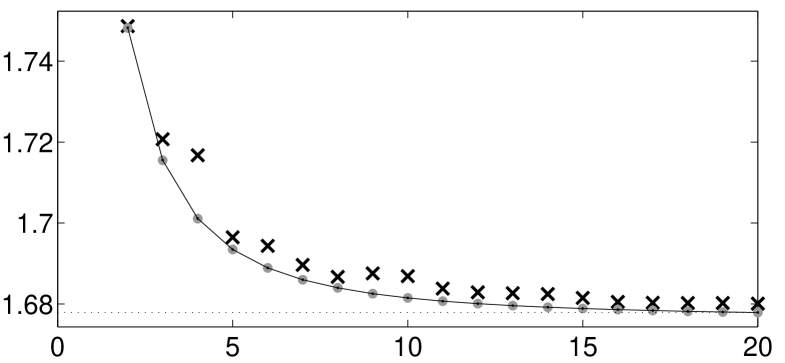
Consider the regression model (2.1) with , , where the error process is given by the Brownian motion. The optimal design for this model can be obtained from Table 3, and we have , , and . By computing the quantiles from the c.d.f. corresponding to we can easily obtain support points of -point designs. For example, , and .
In Figure 1 we display the variance of various linear unbiased estimators for different sample sizes. We observe that the variance of the WLSE defined by (2.17) for the proposed -point design is slightly larger than the variance of the BLUE for the proposed -point design, which is very close to the variance of the BLUE with corresponding optimal -point design. The calculation of these designs is complicated and has been performed numerically by the Nelder-Mead algorithm in MATLAB. We also note that due to the non-convexity of the optimization problem it is not clear that the algorithm finds the optimal design. However, by Theorem 2.2 and 2.3 we determined the optimal value (2.14), which is . This means that for the proposed designs WLSE has almost the same precision as BLUE.
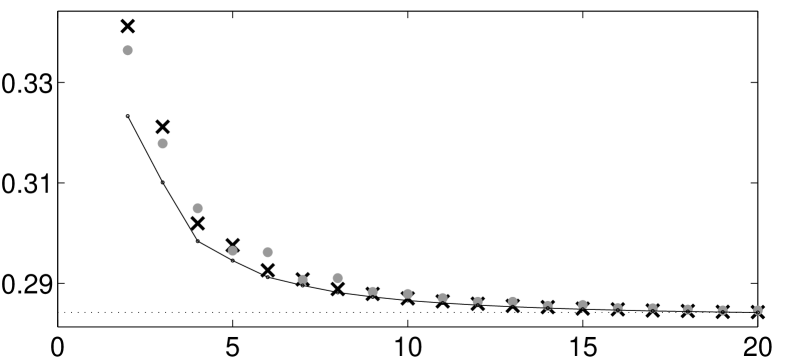
In our second example we compare the proposed optimal designs with the designs from Sacks and Ylvisaker, (1966), which are constructed for the BLUE. For this purpose we consider the model (2.1) with regression function , , and triangular covariance kernel of the form (2.4) with and . The optimal design in the continuous time model can be obtained from Table 4 and its density is depicted in Figure 2.
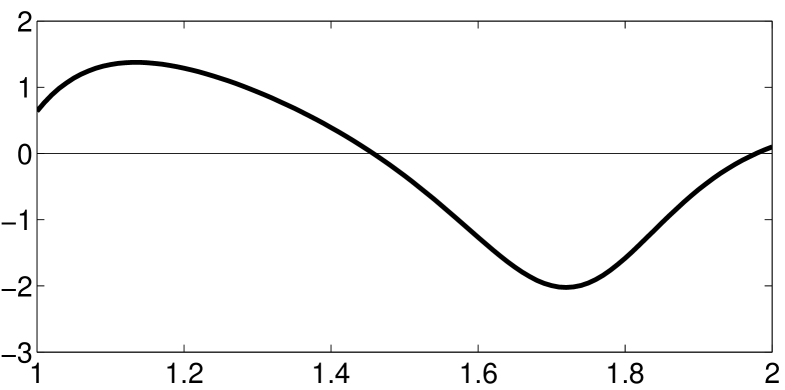
By computing quantiles using this optimal design, we obtain that the 4-point design is supported at points 1, 1.27, 1.68 and 2. For , the variance of the BLUE is . Using the optimal density from Sacks and Ylvisaker, (1966), we obtain the 4-point design supported at 1, 1.25, 1.63 and 2. For , the variance of the BLUE is . For , the variances of the BLUE for the proposed -point designs, the -point designs from Sacks and Ylvisaker, (1966) and the optimal -point designs for the BLUE are depicted in Figure 3. We observe that for the new designs yield a smaller variance of the BLUE, while for the design of Sacks and Ylvisaker, (1966) shows a better performance. In all other cases the results for both designs are very similar. In particular, for the variances from the optimal -point designs proposed in this paper and in the paper of Sacks and Ylvisaker, (1966) are only slightly worse than the variances of the BLUE with corresponding best -point designs (which is computed by direct optimization).
3 Multi-parameter models
In this section we discuss optimal design problems for models with more than one parameter.
The structure of this section is somewhat similar to the structure of Section 2.
In Section 3.1 we introduce a new class of linear estimators of the parameters in model (1.3),
which we call matrix-weighted estimators (MWE) and
show in Lemma 3.3 that for some special choices of the matrix weights the MWE can always emulate the BLUE.
In Section 3.2 matrix-weighted designs associated with the MWE are defined.
Then, for the case of triangular kernels, in Corollary 3.1 we derive the asymptotic forms for the sequence of designs that are associated
with the version of the MWE which emulates the BLUE.
In Section 3.3 we prove optimality
of the asymptotic matrix-weighted measure derived in Corollary 3.1 in the continuous time model (1.2)
(see Theorem 3.1),
while some examples of asymptotically optimal measures are provided in Section 3.4. Finally,
the practical implementation of the asymptotic measures is discussed in Section 3.5 and numerical examples are provided
in Section 3.6.
The proofs of many statements in this section use the results of Section 2. This is possible as there is a lot of freedom in choosing the form of the MWE to emulate the BLUE and we choose a special form which could be considered as component-wise SLSE. Correspondingly, the resulting matrix-weighted designs (including the asymptotic ones) become combinations of designs for one-parameter models.
3.1 Matrix-weighted estimators and designs
Consider the regression model (1.1) and assume that observations at points () have been made. Let be an matrix associated with the observation point ; Recall the definition of the design matrix and the definition of We introduce the matrix whose -th column is . Assuming that the matrix
| (3.1) |
is non-singular we define the linear estimator
| (3.2) |
for the vector in model (1.1). We call this estimator the matrix-weighted estimator (MWE), because each column of the matrix is multiplied by a matrix weight. It is easy to see that for any the MWE is unbiased and its covariance matrix is given by
| (3.3) |
where is the matrix of covariances of the errors. Note that the matrix defined in (3.1) generalizes the standard information matrix and that is not necessarily a symmetric matrix. The following result shows that different matrices may yield the same matrix-weighted estimator . Its proof is obvious and therefore omitted.
Lemma 3.1
The estimator introduced in Lemma 3.1 is the MWE defined by the matrix weights . Lemma 3.1 implies that the is exactly the same for any set of matrices as long as is non-singular. In the asymptotic considerations below it will be convenient to interpret the combination of the set of experimental conditions and the set of corresponding matrices in the MWE as an -point matrix-weighted design.
Definition 3.1
Any combination of points and matrices will be called -point matrix-weighted design and denoted by
| (3.4) |
The covariance matrix of a matrix-weighted design is defined as the covariance matrix in (3.3) of the corresponding estimate .
The estimator is not necessarily a least-squares type estimator; that is, it may not be representable in the form (1.3) for some weight matrix and hence there may be no associated weighted sum of squares which is minimized by the MWE. However, for any given , we can always find matrices such that
| (3.5) |
and therefore achieve . The following result gives a constructive solution to the matrix equations (3.5).
Lemma 3.2
Assume that for all . Define ,
| (3.6) |
where is the first unit vector and denotes the -th column of the matrix . Then the corresponding matrix-weighted estimator satisfies .
Proof. The matrix equation (3.5) can be written as vector equations
| (3.7) |
with respect to the matrices . Assume that for some . Then
The form for the matrices considered in Lemma 3.2 means that the matrix has the vector as its first column while all other entries in this matrix are zero. We shall refer to this form as the one-column form. We can choose other forms for the matrices , but then we would require different, somewhat stronger, assumptions regarding the vector . For example, if for all , then we can always choose diagonal matrices to satisfy (3.5) (see Lemma 3.5 below).
The following choices for ensure coincidence of with the three popular estimators defined in the Introduction.
If for all , then .
If for all , then .
If and with , then .
We shall call any MWE optimal if it coincides with the BLUE. In view of the importance of the last case, the corresponding result is summarized in the following lemma.
Lemma 3.3
Consider the regression model (1.1) and let for all . For a given set of observation points the MWE defines a BLUE if with .
If the covariance kernel of the error process has triangular form (2.4) then we can derive the explicit form for the optimal MWE. The result follows by a direct application of Lemma A.1.
Lemma 3.4
Assume that the covariance kernel has the form (2.4) and that the matrix is positive definite with entries for , where for we denote , and . Then we have the following representation for the optimal vectors introduced in Lemma 3.3:
| (3.8) | |||||
for . Here in formulas (3.8), (3.4) and (3.4) denote the elements of the matrix .
The following provides a result similar to Lemmas 3.2 and 3.3 in the case where the matrices are diagonal. An extension of Lemma 3.4 to the matrices of the diagonal form is straightforward and omitted for the sake of brevity.
Lemma 3.5
Consider the regression model (1.1) and let for all and all . For each , define the diagonal matrix by its diagonal elements
where denotes the -th element of the matrix . Then .
If additionally so that , then .
3.2 Weak convergence of matrix-weighted designs
Let be an increasing function on the interval with and so that is a c.d.f. For a fixed and , define the points by (2.9). Suppose that with each we can associate an matrix and consider an -point matrix-weighted design of the form (3.4) with and . In view of (3.1) and (3.3) this design has the covariance matrix
where the matrices and are defined by
In addition to the sequence of matrix-weighted designs consider the sequence of uniform distributions on the set As , this sequence converges weakly to the design (probability measure) on the interval with distribution function . This implies
and
| (3.11) |
under the assumptions that the vector-valued function , the matrix-valued function , the kernel are continuous on the interval and the generalized information matrix are non-singular. Moreover, the sequence of estimators (3.2) converges (almost surely as ) to
| (3.12) |
where is the stochastic process in the continuous time model (1.2). Bearing these limiting expressions in mind we say that the sequence of matrix-weighted designs defined by (3.4) converges to the limiting matrix-weighted design as . This relation justifies the notation and of the previous paragraph.
The (optimal) limiting matrix-weighted designs which will be constructed below will have a similar structure as the signed measures in (2.12). They will assign matrix weights and to the end-points of the interval and a ‘matrix density’ to the points ; that is, these designs will have the form
| (3.13) |
In view of (3.12), the MWE in the continuous time model (1.2) associated with any design of the form (3.13) can be written as
| (3.14) |
where . In the particular case associated with Lemma 3.4, we have the following structure of the matrices and and the matrix function in (3.13):
| (3.15) |
where and are some -dimensional vectors and is some vector-valued function defined on the interval . Note that does not have to approach and as and , respectively.
When the sequence of matrix-weighted designs is defined by the formulas of Lemma 3.3 we can compute the limiting matrix-weighted design. The proof follows by similar arguments as given in the proof of Theorem 2.1 and is therefore omitted.
Corollary 3.1
Consider model (1.1), where the error process has a covariance kernel of the form (2.4). Assume that , , are strictly positive, twice continuously differentiable functions on the interval and that the vector-valued function is twice continuously differentiable with for all . Consider the matrix-weighted design of the form (3.4), where the support points are generated by (2.9) and the matrix weights are defined in Lemma 3.3. The sequence converges (in the sense defined above in the previous paragraph) to a matrix-weighted design defined by (3.13) and (3.15) with
| (3.16) |
where and the constant is arbitrary.
In Corollary 3.1, the one-column representation of the matrices is used. The following statement contains a similar result for the case where the matrices are diagonal.
Corollary 3.2
Let the conditions of Corollary 3.1 hold and assume additionally that for all and all . Consider the matrix-weighted design of the form (3.4), where the support points are generated by (2.9) and the matrices are defined in Lemma 3.5 with diagonal elements given by . Then the sequence converges to the optimal matrix-weighted design of the form (3.13), where the diagonal elements of the matrices , and are given by
respectively, , and the constant is arbitrary.
3.3 Optimal designs and best linear estimators
In this section we consider again the continuous time model (1.2), where the full trajectory of the process can be observed. We start recalling some known facts concerning best linear unbiased estimation. For details we refer the interested reader to the work of Grenander, (1950) or Section 2.2 in Näther, 1985a . Any linear estimator of can be written in the form of the integral
| (3.17) |
where is a vector of signed measures on the interval . For given , the estimator is unbiased if and only if , where denotes the -dimensional identity matrix. Theorem 2.3 in Näther, 1985a states that the estimator is BLUE if and only if and the identity
holds for all , where is some matrix. The matrix is uniquely defined and coincides with the matrix
| (3.18) |
The Gauss-Markov theorem further implies that , where is any other linear unbiased estimator of
Definition 3.2
The designs we consider have the form (3.13) and the corresponding MWE are expressed by (3.14). The estimator (3.14) can be expressed in the form (3.17), that is with
The estimators defined in (3.14) are always unbiased and the following result provides the matrix-weighted optimal design and the BLUE in the continuous time model (1.2). The proof follows by similar arguments as given in the proof of Theorem 2.2 and 2.3 and is therefore omitted.
Theorem 3.1
Let be a covariance kernel of the form (2.4) and the vector-function be twice continuously differentiable with for all . Under the assumptions of Corollary 3.1 the matrix-weighted design defined by the formulas (3.13) and (3.16) with is optimal in the sense of Definition 3.2. Moreover, if
then defines the BLUE in model (1.2). Additionally, we have
where the matrix is given by
and .
3.4 Examples of optimal matrix-weighted designs
Consider the polynomial regression model with , and the covariance kernel of the Brownian motion . For the construction of matrix-weighted designs we use matrices in the one-column and diagonal representations.
For the one-column representation we have from Corollary 3.1 and Theorem 3.1 that the optimal matrix weighted design has masses and at points and , respectively, and the density . Here the vectors and are given by
respectively. For the diagonal representation we have from Corollary 3.2 (and an analogue of Theorem 3.1) that the optimal matrix weighted design has masses and at points and , respectively, and the density , where
Note that in this case all non-vanishing diagonal elements of the matrix are proportional to the function . According to Lemma 3.1, we can use instead of , for any non-singular matrix . By taking the matrix
we obtain
As another example, consider the polynomial regression model with , , and the triangular covariance kernel of the function (2.4) with and .
For the diagonal representation we have from Corollary 3.2 that the optimal matrix weighted design has masses and at points and , respectively, and the density , where
with , . If we further use then we obtain ; that is, all components of the matrix have exactly the same density.
3.5 Practical implementation
Here we only consider the diagonal representation of the matrices , and ; the case of one-column representation of the matrices can be treated similarly. We assign matrix weights and to the boundary points and and use an -point approximation to an absolutely continuous probability measure on with some density . The density is defined to be either the uniform density on (if nonzero elements of different components of are not proportional to each other) or for some (if nonzero elements of different components of are proportional to each other), where is the normalization constant and is such that the density is not identically zero on the interval . Denote by the corresponding c.d.f. For given , we calculate an -point approximation , where with , , to the probability measure with density .
To each point we assign a vector of weights such that (). The values correspond to the sign of the point in the estimation of exactly as in the procedure for one-parameter models described in Section 2.5. Some of the values could be 0. If for some then the point is not used for the estimation of . By assigning zero weight to a point in the -th estimation direction, we perform a thinning of the sample of points in -th direction and thus achieve a required density in the each estimation direction. This is a deterministic version of the well-known ‘rejection method’ widely used to generate samples from various probability distributions. If the nonzero components of the matrix weight are proportional to each other then for these components for all and .
The resulting estimator has the form (3.2) where
and is the diagonal matrix whose diagonal elements are given by
If nonzero elements of different components of the matrix weight are proportional to each other (as was the case in the examples of Section 3.4) then the -point approximations to the limiting design are very similar to the approximations in the one-parameter case considered in Section 2.5; their accuracy is also very high. Otherwise, when the diagonal elements of are possibly non-proportional, the accuracy of approximations will depend on the degree of non-homogeneity of components of the matrix weight .
3.6 Some numerical results
For comparison of competing matrix weighted designs for multiparameter models it is convenient to consider
a functional of the covariance matrix. Exemplarily we investigate in this Section the classical -optimality criterion defined as
which has to be minimized.
As an example where all nonzero elements of the matrix
are proportional to each other,
let us consider the cubic regression model with
and the Brownian motion error process.
The optimal value in the continuous time model (1.2) is
.
In Figure 4 we display the -criterion of the covariance matrices of
the MWE and the BLUE for the proposed -point designs and
the covariance matrix of the BLUE with corresponding optimal -point designs.
We can see that the -efficiency of the proposed matrix-weighted design is very high,
even for small .
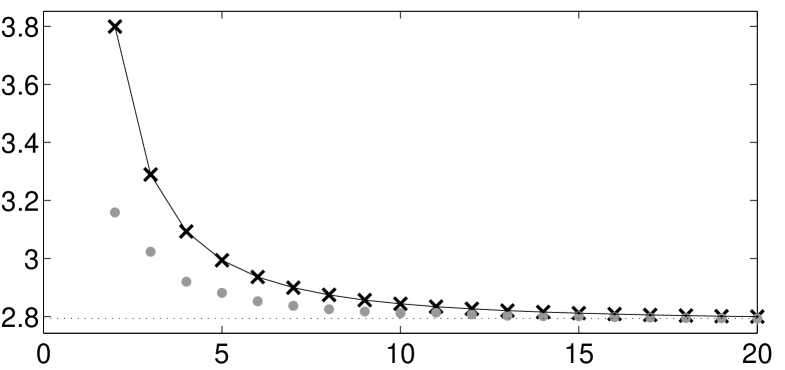
The second example of this section considers a situation where nonzero elements of the matrix are not proportional to each other. For this purpose we consider the model (2.1) with , and covariance kernel with and . Using the diagonal representation, we obtain for the optimal matrix-weighted designs
The optimal value in the continuous time model (1.2) is given by
.
Since some diagonal elements of are constant functions,
we take the support points of the design to be equidistant: for .
Then we have for all and .
However, some elements of should be zero
because is not proportional to .
For example, for the vector of signs is
and for it is
In Figure 5 we depict the -optimality criterion of the covariance matrices for various estimators. We observe that in this example for all the -optimality criterion of the covariance matrices of the MWE is slightly larger than the -optimality criterion of the covariance matrices of the BLUE. However, we can also see that the proposed -point designs are very efficient compared to the BLUE with corresponding -optimal -point designs even for small .
Acknowledgements. This work has been supported in part by the Collaborative Research Center “Statistical modeling of nonlinear dynamic processes” (SFB 823, Teilprojekt C2) of the German Research Foundation (DFG). The research of H. Dette reported in this publication was also partially supported by the National Institute of General Medical Sciences of the National Institutes of Health under Award Number R01GM107639. The content is solely the responsibility of the authors and does not necessarily represent the official views of the National Institutes of Health. We would also like to thank Martina Stein who typed parts of this paper with considerable technical expertise. The work of Andrey Pepelyshev was partly supported by Russian Foundation of Basic Research, project 12-01-00747.
Appendix A Proof of main results
A.1 Explicit form of the inverse of the covariance matrix of errors
Here we state an auxiliary result, which gives an explicit form for the inverse of the matrix , with a triangular covariance kernel . We did not find this result (as formulated below) in the literature. Versions of Lemma A.1, however, have been derived independently by different authors; see, for example, Lemma 7.3.2 in Zhigljavsky, (1991) and formula (8) in Harman and Štulajter, (2011). The proof follows from straightforward checking the condition .
Lemma A.1
Consider a symmetric matrix which elements are defined by the formula for . Assume that where . Then the inverse matrix is a symmetric tri-diagonal matrix and its elements with can be computed as follows:
A.2 Proof of Lemma 2.1
Denote , , , , . Then for any signed measure we have
Since is symmetric and , there exists and a symmetric matrix such that . Denote and . Then we can write the design optimality criterion as . The Cauchy-Schwartz inequality gives for any two vectors and the inequality , that is, . This inequality with and as above is equivalent to for all . Equality is attained if the vector is proportional to the vector ; that is, if for all and any . Finally, the equality can be rewritten in the form .
A.3 Proof of Theorem 2.1
Before starting the main proof we recall the definition of the design points (2.9) and prove the following auxiliary result.
Lemma A.2
Assume that is a twice continuously differentiable function on the interval . Then for all , we have
| (A.1) | |||||
| (A.2) |
Proof of Lemma A.2. Recall the definition () and set
From the definition of the function in (2.8) we have
| (A.3) |
for all . Observing Taylor’s formula yields for any
In this formula, set and so that . We thus obtain
By using (2.9) and the relation we can rewrite this in the form (A.1). The second statement obviously follows from (A.1).
Proof of Theorem 2.1. In view of Lemma 2.1 and (2.5) - (2.1) we have
where we have used the relations (A.3). Here is the normalization constant providing and we use the notation , and .
Consider first . Denote , then
| (A.4) |
which gives
| (A.5) |
as . Similarly
yielding
| (A.6) |
Combining (A.4), (A.5) and (A.6) we obtain
| (A.7) | |||||
as . Similarly to (A.7) we get the asymptotic expression for :
| (A.8) |
as . Consider now the weights
| (A.9) |
Assume and is such that as for some , and set .
We are going to prove that
| (A.11) |
First, in view of (2.9) we have and hence
Consider the numerator in (A.3) and rewrite it as follows:
where We obviously have and where is defined in (A.2). This yields
| (A.12) |
Next we consider
For the first factor we have
while the second factor gives
where we have used the relation in the last equation. This gives, as ,
| (A.13) |
A.4 Proof of Theorem 2.2
By Theorem 3.3 in Dette et al., (2013) a design minimizes the functional (2.15) if the identity
| (A.14) |
holds , where is some constant. We consider the design defined by (2.12) and (2.13) and verify for this design the condition (A.14). To do this we calculate by partial integration
Observing the definition of the masses in (2.13), the identify (A.14) follows with . This proves the first part of Theorem 2.2.
For a proof of the second statement consider a linear unbiased estimator in model (2.1) based on the full trajectory, where and is the design in (2.12), (2.13) with a constant chosen such that is unbiased, that is
Standard arguments of optimal design theory show that minimizes (that is, is BLUE in model (2.1) where the full trajectory can be observed) if and only if the inequality
| (A.15) |
holds for all signed measures satisfying . Observing this condition and the identity (A.14) we obtain
for all signed measures on with . By (A.15) minimizes . Consequently, the corresponding estimator is BLUE with minimal variance
A.5 Proof of Theorem 2.3
Let be a Brownian motion on the interval and consider the regression model (2.1) with some function and the error process. By Theorem 2.2 the optimal design is given by
with
We shall now use Theorem B.1 to derive the optimal design for the original regression model (2.1) with regression function and covariance kernel from the design for the function , where .
For the Brownian motion, the covariance function is defined by (B.4) with and so that by (B.6) we have , and According to (B.14) the optimal design transforms to .
Consider first the mass at . We have . By using the transformation of into , we obtain
as required. From the representation of we obtain by similar arguments
Let us now consider the density , and rewrite , the absolutely continuous part of the measure . The transformation of the variable into induces the density
| (A.16) |
Differentiating the equality , we have
Now we obtain
Inserting this into (A.16) and taking into account that , we obtain the density
| (A.17) |
In view of the relation we need to divide the right hand side in (A.17) by and obtain the expression for the density (2.11). This completes the proof of Theorem 2.3.
Appendix B Gaussian processes with triangular covariance kernels
B.1 Extended Doob’s representation
Assume that is a Gaussian process with covariance kernel of the form (2.4); that is, for , where and are functions defined on the interval . According to the terminology introduced in Mehr and McFadden, (1965) kernels of the form (2.4) are called triangular. An alternative way of writing these covariance kernels is
| (B.1) |
where . We assume that is non-degenerate on the open interval , which implies that the function is strictly increasing and continuous on the interval [see Mehr and McFadden, (1965), Remark 2]. Moreover, this function is also positive on the interval [see Remark 1 in Mehr and McFadden, (1965)], which yields that the functions and must have the same sign and can be assumed to be positive on the interval without loss of generality. We repeatedly use the following extension of the celebrated Doob’s representation [see Doob, (1949)], which relates to two Gaussian processes (on compact intervals) by a time-space transformation.
Lemma B.1
Let be a non-degenerate Gaussian process with zero mean and covariance function (B.1) and let and be continuous positive functions on , such that is strictly increasing and . Define the transformations and by
| (B.2) |
Then the Gaussian process defined by
| (B.3) |
has zero mean and the covariance function is given by
| (B.4) |
Conversely, the Gaussian process can be expressed via by the transformation
| (B.5) |
where
| (B.6) |
Proof. Since is Gaussian and has zero mean, the process defined by (B.3) is also Gaussian and has zero mean. For the covariance function of the process (B.3) we have
The second part of the proof follows by the same arguments and the details are therefore omitted.
Remark B.1
(a) The classical result of Doob is a particular case of (B.5) when is the Brownian motion with covariance function . In this case we have , , and . Specifically, the Doob’s representation is given by [see Doob, (1949)].
(b) Both functions and are positive strictly increasing functions and are inverses of each other; that is,
| (B.7) |
(c) The functions and are positive and satisfy the relation
| (B.8) |
B.2 Transformation of regression models
Associated with the transformation of the triangular covariance kernels there exists a canonical transformation for the corresponding regression models. To be precise, consider the regression model (1.1) or its continuous time version (1.2), where the covariance kernel has the form (B.1). Recall the definition of the transformation defined in (B.6), which maps the observation points to , and define
| (B.9) |
where so that . The regression model (1.1) can now be rewritten in the form
| (B.10) |
The errors in (B.10) have zero mean and, by Lemma B.1 and the identity (B.8), their covariances are given by
| (B.11) |
Hence we have transformed the regression observation scheme (1.1) with error covariances to the scheme (B.10) with covariances (B.11). Conversely, we can transform the model (B.10) with covariances (B.11) to the model (1.1) using the transformations
| (B.12) |
Lemma B.2
B.3 Transformation of designs
In this section we consider a transformation of the matrix-weighted designs under a given transformation of the regression models. In the one-parameter case with , these matrix-weighted designs become signed measures; that is, signed designs as considered in Section 2. In this section, it is convenient to define all integrals as Lebesgue-Stieltjes integrals with respect to the distribution functions of the measures and .
To be precise, let be a matrix-weighted design on the interval . Recalling the definition of and in (B.2) and (B.6) we define a matrix-weighted design by
| (B.13) |
Note that and are probability measures on the intervals and , respectively. Similarly, for a given matrix-weighted design on the interval we define a matrix-weighted design on the interval by
| (B.14) |
Similar to Lemma B.2 we can see that the transformation defined by (B.14) is the inverse to the transformation defined by (B.13).
For the following discussion we recall the definition of the covariance matrix in (3.11). For the model (B.10), the covariance matrix of the design , defined by (B.13), is given by
| (B.15) |
where
and the kernel is defined by (B.4).
Theorem B.1
Proof. Using the variable transformation and (B.9), we have
Next, we calculate the corresponding expression for , that is
Define and so that and similarly . Changing the variables in the integrals above we obtain
Using the definition of in (B.6) yields and by the definition of in (B.6) we finally get
The result follows now from the definitions (3.11) and (B.15).
References
- Bickel and Herzberg, (1979) Bickel, P. J. and Herzberg, A. M. (1979). Robustness of design against autocorrelation in time I: Asymptotic theory, optimality for location and linear regression. Annals of Statistics, 7(1):77–95.
- Boltze and Näther, (1982) Boltze, L. and Näther, W. (1982). On effective observation methods in regression models with correlated errors. Math. Operationsforsch. Statist. Ser. Statist., 13:507–519.
- Dette et al., (2008) Dette, H., Kunert, J., and Pepelyshev, A. (2008). Exact optimal designs for weighted least squares analysis with correlated errors. Statistica Sinica, 18(1):135–154.
- Dette et al., (2013) Dette, H., Pepelyshev, A., and Zhigljavsky, A. (2013). Optimal design for linear models with correlated observations. The Annals of Statistics, 41(1):143–176.
- Doob, (1949) Doob, J. L. (1949). Heuristic approach to the Kolmogorov-Smirnov theorems. The Annals of Mathematical Statistics, 20(3):393–403.
- Grenander, (1950) Grenander, U. (1950). Stochastic processes and statistical inference. Ark. Mat., 1:195–277.
- Harman and Štulajter, (2010) Harman, R. and Štulajter, F. (2010). Optimal prediction designs in finite discrete spectrum linear regression models. Metrika, 72(2):281–294.
- Harman and Štulajter, (2011) Harman, R. and Štulajter, F. (2011). Optimality of equidistant sampling designs for the Brownian motion with a quadratic drift. Journal of Statistical Planning and Inference, 141(8):2750–2758.
- Kiselak and Stehlík, (2008) Kiselak, J. and Stehlík, M. (2008). Equidistant -optimal designs for parameters of Ornstein-Uhlenbeck process. Statistics and Probability Letters, 78:1388–1396.
- Mehr and McFadden, (1965) Mehr, C. and McFadden, J. (1965). Certain properties of Gaussian processes and their first-passage times. Journal of the Royal Statistical Society. Series B (Methodological), pages 505–522.
- Müller and Pázman, (2003) Müller, W. G. and Pázman, A. (2003). Measures for designs in experiments with correlated errors. Biometrika, 90:423–434.
- (12) Näther, W. (1985a). Effective Observation of Random Fields. Teubner Verlagsgesellschaft, Leipzig.
- (13) Näther, W. (1985b). Exact design for regression models with correlated errors. Statistics, 16:479–484.
- Pázman and Müller, (2001) Pázman, A. and Müller, W. G. (2001). Optimal design of experiments subject to correlated errors. Statist. Probab. Lett., 52(1):29–34.
- Pukelsheim, (2006) Pukelsheim, F. (2006). Optimal Design of Experiments. SIAM, Philadelphia.
- Sacks and Ylvisaker, (1966) Sacks, J. and Ylvisaker, N. D. (1966). Designs for regression problems with correlated errors. Annals of Mathematical Statistics, 37:66–89.
- Sacks and Ylvisaker, (1968) Sacks, J. and Ylvisaker, N. D. (1968). Designs for regression problems with correlated errors; many parameters. Annals of Mathematical Statistics, 39:49–69.
- Zhigljavsky et al., (2010) Zhigljavsky, A., Dette, H., and Pepelyshev, A. (2010). A new approach to optimal design for linear models with correlated observations. Journal of the American Statistical Association, 105:1093–1103.
- Zhigljavsky, (1991) Zhigljavsky, A. A. (1991). Theory of Global Random Search. Springer, Netherlands.