thu]Department of Automation, Tsinghua University, Beijing 100084, P. R. China
Optimal Investment with Herd Behaviour Using Rational Decision Decomposition
Abstract
In this paper, we study the optimal investment problem considering the herd behaviour between two agents, including one leading expert and one following agent whose decisions are influenced by those of the leading expert. In the objective functional of the optimal investment problem, we introduce the average deviation term to measure the distance between the two agents’ decisions and use the variational method to find its analytical solution. To theoretically analyze the impact of the following agent’s herd behaviour on his/her decision, we decompose his/her optimal decision into a convex linear combination of the two agents’ rational decisions, which we call the rational decision decomposition. Furthermore, we define the weight function in the rational decision decomposition as the following agent’s investment opinion to measure the preference of his/her own rational decision over that of the leading expert. We use the investment opinion to quantitatively analyze the impact of the herd behaviour, the following agent’s initial wealth, the excess return, and the volatility of the risky asset on the optimal decision. We validate our analyses through numerical experiments on real stock data. This study is crucial to understanding investors’ herd behaviour in decision-making and designing effective mechanisms to guide their decisions.
keywords:
Herd behaviour, Investment opinion, Optimal investment, Rational decision decomposition, Variational method1 Introduction
There exists a category of leading experts in the financial markets, such as financial analysts, fund managers, or other professionals, who share their decisions through channels like social media and websites [1]. As these leading experts’ decisions are often considered valuable investment guides, investors, referred to as agents below, tend to mimic their decisions [2]. Additionally, agents may have an intrinsic preference for conformity, and lean towards the decisions of the other agents to build consensus and trust [3]. This phenomenon is commonly known as herd behaviour in behavioural finance [4, 5, 6]. Prior studies have qualitatively verified the existence of herd behaviour in agents’ decisions in financial markets [7, 8, 9, 10, 11]. However, to quantitatively analyze the influence of herd behaviour on agents’ decisions, it is necessary to employ mathematical models based on the optimal investment theory.
Optimal investment theory provides a theoretical framework to study how agents dynamically adjust their investment decisions throughout the investment period to maximize the return and minimize the volatility using the stochastic optimal control theory [12, 13, 14, 15, 16, 17, 18]. The Merton problem is one of the classical optimal investment problems [19], where the agent allocates a certain amount of money to a risky asset at each moment to maximize the expected utility of the terminal wealth, i.e., the wealth at the end of the investment period. There have been many quantitative studies analyzing the impact of interactions among agents on the optimal investment. The previous studies in [20, 21, 22, 23, 24, 25, 26, 27] examined the impact of relative wealth and consumption among agents on their decisions, where the objective was a functional of each agent’s excess wealth or consumption relative to other agents during the investment period. However, to the best of our knowledge, few studies have investigated how herd behaviour affects agents’ decisions on the allocation of risky assets in the Merton problem.
In this paper, we study an optimal investment problem involving two agents, one leading expert, and one following agent whose decisions are influenced by those of the leading expert, and we quantitatively analyze the impact of herd behaviour on the following agent’s decision. The prior work in [28] used the traditional Euclidean distance to quantitatively measure the disparity between agents’ decisions. In this paper, we incorporate an exponential decay term into the traditional Euclidean distance to reflect the fact that agents often give less weight to future rewards when making decisions [29], and we call the modified Euclidean distance the average deviation. We introduce the average deviation into the objective functional of the traditional Merton problem and employ the variational method to analytically solve the stochastic optimal control problem and find the following agent’s optimal decision.
Note that with the above analytical solution of the following agent’s optimal decision, it is theoretically difficult to directly examine the influence of herd behaviour due to its complicated expression. To address this problem, we introduce a method called rational decision decomposition to transform the following agent’s optimal decision into a convex linear combination of the two agents’ rational decisions, i.e., the optimal decisions in the traditional Merton problem, where the agents make independent decisions without the influence of other agents. Furthermore, we define the weight function as the following agent’s investment opinion, which indicates the extent to which the following agent’s decision aligns with his/her own rational decision. We use the following agent’s investment opinion to quantitatively analyze the impact of the herd behaviour, the following agent’s initial wealth, the excess return, and the volatility of the risky asset on the optimal decision.
The rest of this paper is organized as follows. We introduce the average deviation to quantify the disparity between the two agents’ decisions, and present the dual-agent optimal investment problem considering herd behaviour in Section 2. We derive the analytical solution of the following agent’s optimal decision using the variational method in Section 3, and quantitatively analyze the impact of herd behaviour on the following agent’s optimal decisions using the rational decision decomposition in Section 4. In Section 5, we conduct numerical experiments on a real stock dataset to validate our analyses. Section 6 is the conclusion.
2 Problem Formulation
2.1 The Traditional Merton Problem
Following the prior work in [19], we consider the problem of an agent investing in the period in a financial market consisting of a risk-free asset and a risky asset. Let be a complete filtered probability space on which a standard Brownian motion is defined. The price process of the risk-free asset and the risky asset are given by
| (1) | ||||
| (2) |
respectively, where is the interest rate of the risk-free asset, and and are the appreciation rate and the volatility of the risky asset. We define as the excess return rate of the risky asset. Let denote the agent’s initial wealth, and let denote the amount of the risky asset held by the agent at time . According to [19], the agent’s wealth process can be expressed as
| (3) |
subject to . In the traditional Merton problem, the agent determines to maximize the expected utility of the terminal wealth . The utility function satisfies the characteristics of diminishing marginal returns and concavity [30]. In this paper, we consider the Constant Absolute Risk Aversion form [30]:
| (4) |
where is referred to as the risk aversion coefficient. As the risk aversion coefficient increases, the utility function becomes more sensitive to changes in the terminal wealth.
In summary, the traditional Merton problem becomes
| Problem 1. | |||
| s.t. | |||
which is a stochastic optimal control problem. In Problem 1, is the set of admissible decisions, which is a subset of .
2.2 Optimal Investment with Herd Behaviour
Given the traditional Merton problem, we study the optimal investment problem with consideration of herd behaviour. The problem involves two agents, A1 and A2, where A1 is the following agent and A2 is the leading expert. We denote and as their risk aversion coefficients, respectively. We assume that A2’s decision follows the form of the rational decision as in (5), and A1’s decision is unilaterally influenced by A2’s decision. Considering the herd behaviour, A1 aims to maximize his/her expected utility of the terminal wealth while minimizing the distance between his/her decision and A2’s decision. The prior work in [28] used the Euclidean distance to measure the distance between two decisions, i.e., in continuous-time format. In this paper, we introduce an exponential decay term to reflect the fact that agents often give less weight to future rewards when making decisions, and we call the modified Euclidean distance the average deviation.
Definition 1.
The average deviation between A1 and A2’s decisions and is defined as:
| (6) |
where is the decay rate.
A higher decay rate implies that deviations occurring later carry less weight. When , deviations for all times are equally weighted, and (6) becomes the same as the traditional Euclidean distance in [28]. Let denote A1’s wealth process.
With Definition 1, we define the following optimal investment problem for A1’s decision:
| Problem 2. | |||
| s.t. | |||
where the herd coefficient is to address the tradeoff between the two different objectives, i.e., maximizing the expected utility of the terminal wealth and minimizing the average deviation . When , A1’s optimal decision is entirely independent of A2’s decision, and Problem 2 degenerates into the traditional Merton Problem, i.e., for all . As approaches infinity, A1’s optimal decision is equal to A2’s decision, i.e., for all .
3 Solution to the Optimal Investment Problem
Next, we use the variational method to solve Problem 2. For the convenience of expression, we define and as the modified herd coefficient and decay rate, respectively.
Theorem 1.
The optimal decision in Problem 2 is given by
| (7) |
where is the integral constant calculated by Algorithm 1.
Proof.
First, by solving (3), A1’s terminal wealth is
| (8) |
Therefore, the terminal wealth is a normal random variable whose expectation and variance are
| (9) | ||||
| (10) |
respectively. Because the set of admissible decisions is a subset of , we have and . Because is an exponential function of , it is a lognormal random variable whose expectation is
| (11) |
Therefore, the objective functional of Problem 2 can be expressed as a functional of , i.e.,
| (12) |
According to the variational method, the first and second variations are
| (13) |
| (14) |
According to the Jacobi condition, the sufficient and necessary condition for the functional supremum is given by for . Therefore, we have
| (15) |
Given as in (5), we have (7), where the integral constant is defined as
| (16) |
From (16), is proportional to the utility of the optimal terminal wealth , the terminal wealth under the optimal decision , and the weight is . Therefore, the integral constant is a decreasing function of the expected utility of the terminal wealth . By substituting (7) into (16), we have
| (17) |
However, (17) has no closed-form solution. Thus, we propose Algorithm 1 to calculate its numerical solution. ∎
Theorem 2.
Proof.
We define the following iteration function:
| (19) |
which satisfies , i.e., is a fixed point of the iteration function . To prove the convergence, we need to find a self-mapping interval, and then prove that the iteration function satisfies the Lipschitz continuity condition on the self-mapping interval. First, it is obvious that for all because the exponential term in (19) is greater than . Second, it can be easily proved that is a monotonically decreasing function with respect to for all , so we have for all . Therefore, there is always for all , i.e., . It should be noted that is a continuously differentiable function on . To check the Lipschitz continuity condition, note that
| (20) |
If (18) holds, then we have
| (21) |
for all . Therefore, Algorithm 1 converges when the initial value . Because the initial value in Algorithm 1 is , Algorithm 1 converges to . ∎
4 Impact of Herd Behaviour on Optimal Decision
4.1 Rational Decision Decomposition and Investment Opinion
Theorem 1 and Algorithm 1 provide the analytical solution for A1’s optimal decision in Problem 2. However, due to the complexity of the expression of (7), it is complicated to theoretically analyze the impact of herd behaviour on A1’s optimal decision. Because the objective functional in Problem 2 is a weighted average of the expected utility of terminal wealth and the average deviation , an intuitive notion is that A1’s optimal decision is a function of both A1 and A2’s rational decisions. In Theorem 3, we prove that A1’s optimal decision is a convex linear combination of the two agents’ rational decisions, which we call the rational decision decomposition.
Theorem 3.
The optimal decision in Problem 2 is a convex linear combination of the two agents’ rational decisions and , i.e.,
| (22) |
where the weight function is given by
| (23) |
Proof.
From (22), quantitatively describes the extent to which A1 adheres to his/her own rational decision, reflecting A1’s opinion on how good his/her own rational decision is, and thereby influencing the amount of the risky asset. Therefore, we define it as A1’s investment opinion. A smaller indicates that A1’s decision is more inclined to that of A2.
To analyze the temporal evolution of herd behaviour and its impact on A1’s decision, it is essential to examine the dynamics of A1’s investment opinion. In Theorem 4, we derive the differential equation of the investment opinion.
Theorem 4.
The differential equation of the investment opinion in (23) is given by
| (25) | ||||
| (26) |
In the following, we reframe Problem 2 from the perspective of the investment opinion and show that Problem 2 is essentially equivalent to the following problem where A1 determines his/her optimal investment opinion.
| Problem 3. | |||
| s.t. | |||
where and is a constant.
Theorem 5.
Proof.
Substituting (22) into Problem 2, we have
| (28) |
In this case, Problem 2 and Problem 3 are equivalent. ∎
4.2 Parameters’ Influence on the Optimal Decision
With Theorem 3 and Theorem 4, we can quantitatively analyze the impact of herd behaviour on A1’s optimal decision.
4.2.1 Decay rate
When , we have for all , which indicates a monotonic decrease in A1’s investment opinion over time. Consequently, A1’s decision converges to that of A2 over time. This is because later deviations exert a significant impact when the decay rate is relatively small.
When , we have and for all . Therefore, A1’s optimal decision is a time-invariant convex linear combination of the two agents’ rational decisions, i.e., for all .
When , we have for all , which indicates that A1’s investment opinion displays a monotonically increasing trend over time, while the level of convergence gradually diminishes. This is due to the relatively large decay rate of the average deviation, where later deviations have less impact. Hence, A1’s decision increasingly tends toward his/her own rational decision, diverging from that of A2.
4.2.2 Herd coefficient
Theorem 6.
The investment opinion is a decreasing function of with .
Proof.
According to (17), we have
| (29) |
Assume is a decreasing function of . As increases, the left-hand side of (29) will decrease, while the right-hand side of (29) will increase, which is contradictory. Therefore, must be an increasing function of , i.e., . Let , and we have
| (30) |
It can be easily proved that . Therefore, we have . According to (23), we have
| (31) | ||||
| (32) |
Therefore, we have . ∎
Theorem 6 indicates that the investment opinion is a decreasing function of the herd coefficient . Therefore, the following agent’s decision aligns more closely with that of the leading expert when the herd coefficient is larger.
4.2.3 Initial wealth, excess return rate and volatility
Next, we analyze the influence of other parameters, including the following agent’s initial wealth , the excess return rate , and the volatility of the risky asset. We first study the influence of these parameters on the integral constant .
Theorem 7.
The integral constant is a decreasing function of with . When , is a decreasing function of with . When , is an increasing function of with .
Proof.
So far, we have finished the proof of Theorem 7. ∎
Given Theorem 7, we can further analyze the impact of these parameters on the investment opinion.
Theorem 8.
The investment opinion is a decreasing function of with . When , is a decreasing function of with . When , is an increasing function of with .
Proof.
From Theorem 8, we can draw the following conclusions.
The following agent’s investment opinion is a decreasing function of his/her initial wealth , indicating that when the following agent has a higher initial wealth, the investment opinion is smaller, and from (22), his/her decision tends to converge more to that of the leading expert. This can also be intuitively explained using the diminishing margin feature of the utility function. As the initial wealth increases, the additional utility gained from terminal wealth diminishes. Therefore, the following agent pays more attention to reducing the disparity from the leading expert’s decision, causing the convergence of the two agents’ decisions.
Similarly, when the two agents’ risk aversion coefficients are close, a higher excess return rate and lower volatility result in a smaller investment opinion from Theorem 8. Therefore, from (23), the following agent’s decision converges more to that of the leading expert. This can be intuitively explained as follows. With a larger and a smaller , the risky asset achieves a higher expected utility of terminal wealth. Thus, from the diminishing margin feature of the utility function, the following agent’s decision tends to converge more to that of the leading expert.
5 Numerical Experiments
In this section, we conduct numerical experiments to validate our analyses in Section 3 and Section 4.
5.1 Parameter Settings
We choose a temporal span covering fifty years from January 1972 to December 2022, i.e., . During this investment period, we collect daily closing prices of the Dow Jones Industrial Average to represent the prices of the risky asset. Utilizing parameter estimation of the geometric Brownian motion, we determine the expected return to be and volatility to be for the risky asset. We use the daily average of the interest rates of U.S. 1-Year Treasury Bills in 2022 and 2023 to represent the risk-free interest rate , which is approximately equal to . From the prior work in [31], we set and as the risk aversion coefficients for the following agent and leading expert, respectively. We set the modified herd coefficient to values of , , , and . We set the following agent’s initial wealth as . We observe the same trend for other values of the parameters.
5.2 Optimal Decision
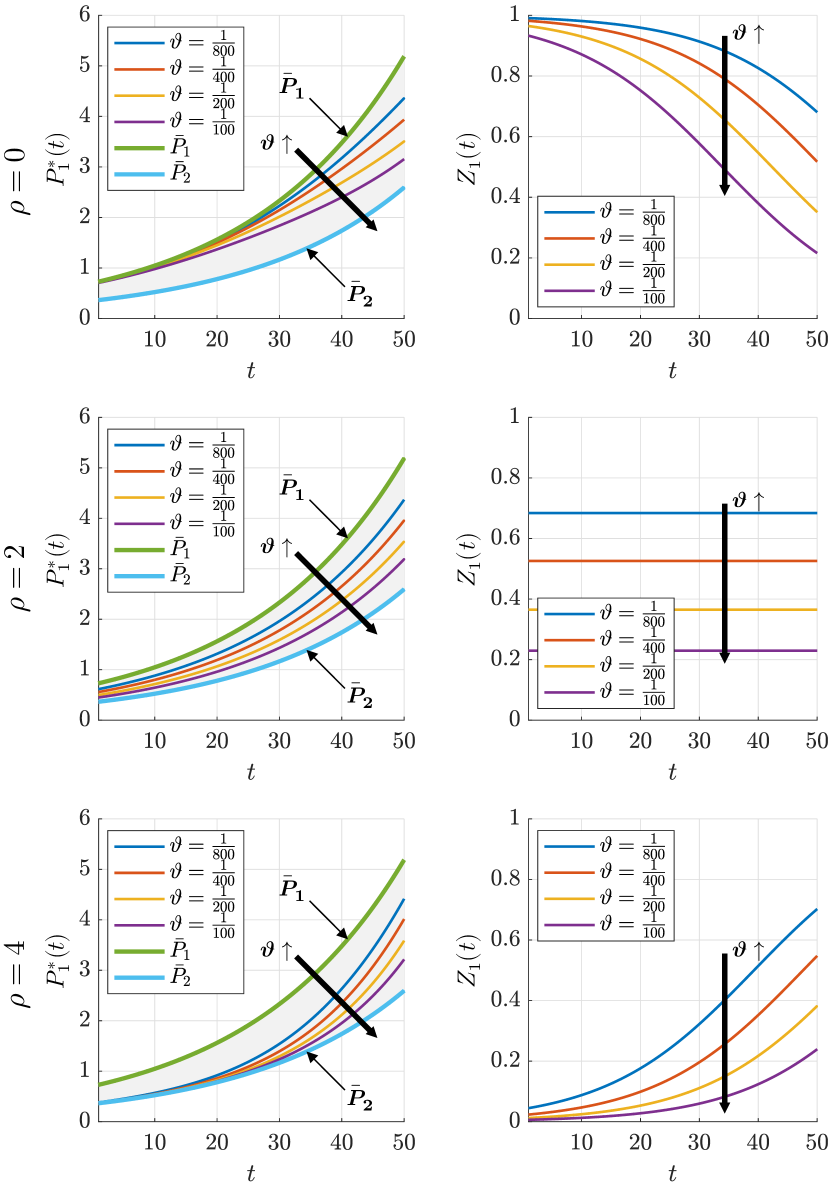
We consider three cases with different decay rates: , , and . Experiment results are shown in Fig. 1. It can be seen that A1’s optimal decision consistently remains within the region bounded by the rational decisions of the two agents and . Furthermore, the optimal decision progressively approaches A2’s rational decision as the herd coefficient increases. When , the optimal decision increasingly converges towards A2’s rational decision , and the investment opinion decreases over time. When , the optimal decision maintains a constant distance from the rational decisions of the two agents, and the investment opinion remains constant. When , the optimal decision increasingly converges towards A1’s rational decision , and the investment opinion increases over time. These observations agree with our analyses of the optimal decision and investment opinion in Theorem 3.
5.3 Parameters’ Influence on the Optimal Decision
Next, we study the parameters’ influence on A1’s optimal decision. As shown in Fig. 1, when increases, the investment opinion decreases. Therefore, is a decreasing function of the modified herd coefficient . Because , is also a decreasing function of the herd coefficient , which validates the correctness of Theorem 6.
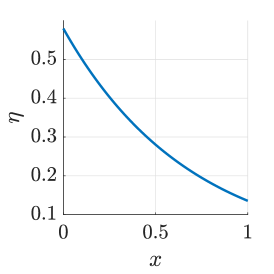
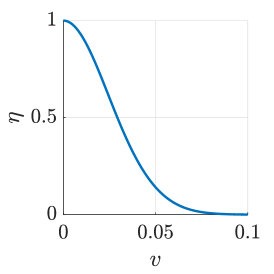
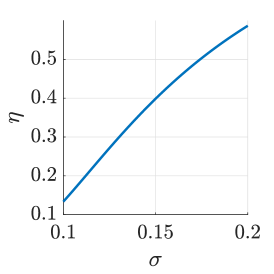
Keeping other parameters constant and ensuring , we plot the curves of the integral constant with respect to the initial wealth , excess return rate , and volatility . As shown in Fig. 2, increases with the decrease of and , and increases with the increase of , thereby validating the correctness of Theorem 7.
6 Conclusion
In this paper, we formulate a dual-agent optimal investment problem considering herd behaviour and introduce the average deviation term in the traditional Merton problem’s objective functional to measure the distance between the two agents’ decisions. We obtain the analytical solution using the variational method and quantitatively analyze the impact of herd behaviour on the following agent’s optimal decision using the rational decision decomposition. Furthermore, we introduce the concept of investment opinion to quantify the following agent’s preference for his/her own rational decision over that of the leading expert. We validate our analyses through numerical experiments on real stock data.
References
- [1] A. Bodnaruk and A. Simonov, “Do financial experts make better investment decisions?” Journal of Financial Intermediation, vol. 24, no. 4, pp. 514–536, 2015.
- [2] J. R. Brown, Z. Ivković, P. A. Smith, and S. Weisbenner, “Neighbors matter: Causal community effects and stock market participation,” Journal of Finance, vol. 63, no. 3, pp. 1509–1531, 2008.
- [3] H. Hong, J. D. Kubik, and J. C. Stein, “Social interaction and stock-market participation,” Journal of Finance, vol. 59, no. 1, pp. 137–163, 2004.
- [4] V. M. Eguiluz and M. G. Zimmermann, “Transmission of information and herd behavior: An application to financial markets,” Physical Review Letters, vol. 85, no. 26, p. 5659, 2000.
- [5] S. Alfarano, T. Lux, and F. Wagner, “Estimation of agent-based models: The case of an asymmetric herding model,” Computational Economics, vol. 26, pp. 19–49, 2005.
- [6] W. Hu, G. Liu, W. Zhang, and T. Wu, “Study on random trading behavior, herd behavior and asset price volatility,” in 2016 Chinese Control and Decision Conference (CCDC). IEEE, 2016, pp. 3157–3163.
- [7] E. C. Chang, J. W. Cheng, and A. Khorana, “An examination of herd behavior in equity markets: An international perspective,” Journal of Banking & Finance, vol. 24, no. 10, pp. 1651–1679, 2000.
- [8] T. T.-L. Chong, X. Liu, and C. Zhu, “What explains herd behavior in the Chinese stock market?” Journal of Behavioral Finance, vol. 18, no. 4, pp. 448–456, 2017.
- [9] K. Yu, Y. Li, and Z. Cao, “Detection and estimation of herd behavior in futures market,” in 2019 International Conference on Economic Management and Model Engineering (ICEMME). IEEE, 2019, pp. 213–223.
- [10] P. Wanidwaranan and C. Padungsaksawasdi, “Unintentional herd behavior via the Google search volume index in international equity markets,” Journal of International Financial Markets, Institutions and Money, vol. 77, p. 101503, 2022.
- [11] S. Zhou and X. Liu, “Internet postings and investor herd behavior: evidence from China’s open-end fund market,” Humanities and Social Sciences Communications, vol. 9, no. 1, pp. 1–11, 2022.
- [12] H. M. Markowitz, “Portfolio selection,” Journal of Finance, vol. 7, no. 1, p. 77, 1952.
- [13] P. A. Samuelson, “Lifetime portfolio selection by dynamic stochastic programming,” Stochastic optimization models in finance, pp. 517–524, 1975.
- [14] G. C. Calafiore, “Multi-period portfolio optimization with linear control policies,” Automatica, vol. 44, no. 10, pp. 2463–2473, 2008.
- [15] L. Yang, Y. Zheng, and J. Shi, “Risk-sensitive stochastic control with applications to an optimal investment problem under correlated noises,” in 2019 Chinese Control Conference (CCC). IEEE, 2019, pp. 1356–1363.
- [16] G. Li, Z. Huang, and Z. Wu, “A kind of optimal investment problem under inflation and uncertain exit time,” in 2022 Chinese Control Conference (CCC). IEEE, 2022, pp. 1739–1744.
- [17] A. Aljalal and B. Gashi, “Optimal investment in a market with random interest rate for borrowing: an explicit closed-form solution,” in 2022 International Conference on Control, Decision and Information Technologies (CoDIT), vol. 1. IEEE, 2022, pp. 764–769.
- [18] N. Alasmi and B. Gashi, “Optimal investment in a market with borrowing and a combined interest rate model,” in 2023 International Conference on Control, Decision and Information Technologies (CoDIT). IEEE, 2023, pp. 01–06.
- [19] R. C. Merton, “Lifetime portfolio selection under uncertainty: The continuous-time case,” The Review of Economics and Statistics, pp. 247–257, 1969.
- [20] J. Gali, “Keeping up with the Joneses: Consumption externalities, portfolio choice, and asset prices,” Journal of Money, Credit and Banking, vol. 26, no. 1, pp. 1–8, 1994.
- [21] C. Gollier, “Misery loves company: Equilibrium portfolios with heterogeneous consumption externalities,” International Economic Review, vol. 45, no. 4, pp. 1169–1192, 2004.
- [22] B. Lauterbach and H. Reisman, “Keeping up with the Joneses and the home bias,” European Financial Management, vol. 10, no. 2, pp. 225–234, 2004.
- [23] J.-P. Gómez, “The impact of keeping up with the Joneses behavior on asset prices and portfolio choice,” Finance Research Letters, vol. 4, no. 2, pp. 95–103, 2007.
- [24] J.-P. Gómez, R. Priestley, and F. Zapatero, “Implications of keeping-up-with-the-Joneses behavior for the equilibrium cross section of stock returns: International evidence,” Journal of Finance, vol. 64, no. 6, pp. 2703–2737, 2009.
- [25] N. Roussanov, “Diversification and its discontents: Idiosyncratic and entrepreneurial risk in the quest for social status,” Journal of Finance, vol. 65, no. 5, pp. 1755–1788, 2010.
- [26] D. Garcia and G. Strobl, “Relative wealth concerns and complementarities in information acquisition,” The Review of Financial Studies, vol. 24, no. 1, pp. 169–207, 2011.
- [27] M. Levy and H. Levy, “Keeping up with the Joneses and optimal diversification,” Journal of Banking & Finance, vol. 58, pp. 29–38, 2015.
- [28] J. M. Merigo and M. Casanovas, “Induced aggregation operators in the Euclidean distance and its application in financial decision making,” Expert Systems with Applications, vol. 38, no. 6, pp. 7603–7608, 2011.
- [29] S. Frederick, G. Loewenstein, and T. O’donoghue, “Time discounting and time preference: A critical review,” Journal of Economic Literature, vol. 40, no. 2, pp. 351–401, 2002.
- [30] J. W. Pratt, “Risk aversion in the small and in the large,” in Uncertainty in economics. Elsevier, 1978, pp. 59–79.
- [31] K. Yuen, H. Yang, and K. Chu, “Estimation in the constant elasticity of variance model,” British Actuarial Journal, vol. 7, no. 2, pp. 275–292, 2001.