Optimization of a lattice spring model with elastoplastic conducting springs: A case study
Abstract
We consider a simple lattice spring model in which every spring is elastoplastic and is capable to conduct current. The elasticity bounds of spring are taken as and the resistance of spring is taken as , which allows us to compute the resistance of the system. The model is further subjected to a gradual stretching and, due to plasticity, the response force increases until a certain terminal value. We demonstrate that the recently developed sweeping process theory can be used to optimize the interplay between the terminal response force and the resistance on a physical domain of parameters The proposed methodology can be used by practitioners for the design of multi-functional materials as an alternative to topological optimization.
keywords:
component, formatting, style, styling, insert1 Introduction
Multi-functionality, e.g. when the stiffness and electrical conductivity of a composite are simultaneously optimized, is a key principle for novel lightweight 3D printed network materials (also called metamaterials). Such materials are highly desirable for a wide spectrum of applications from aerospace engineering to soft robotics and flexible electronics [22; 26; 16]. Despite of the fact that, in the presence of mechanical loading, the reliable estimation of plastic behavior of the material requires accounting for plasticity of individual bonds of material’s microstructure [2; 12], current systematic theories for optimization of multi-functional properties focus on just elastic materials. The goal of the paper is to examine the opportunities that the recently developed theory of sweeping processes [6; 5] opens for optimization of multi-functional materials with plasticity.
To model multi-functional materials with plasticity, this paper proposes to employ the so-called lattice spring model where the sweeping process theory [15; 6] recently provided algebraic formulas [5] for the response force and where the springs can simultaneously be viewed as conductors. Efficient methods that map actual materials to lattice spring models are developed in e.g. Chen et al [3] and Kale and Ostoja-Starzewski [10].
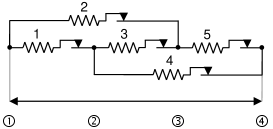
The analysis in this paper concerns the lattice spring model of Fig. 1, because this is the minimal irreducible model that requires a 3D (i.e. non-planar) sweeping process framework (Rachinskiy [18]). Therefore, we expect that all interesting non-trivial optimization phenomena are to be captured by the model of Fig. 1. In other words, we expect that model of Fig. 1 is an efficient benchmark to assess the capabilities of the sweeping process framework in the optimization of most typical multi-functional properties of lattice-spring models of general form. Indeed, using the model of Fig. 1 we conjectured a number of qualitative properties of universe nature (see Conclusions section). On the other hand, we included quotes from Wolfram Mathematica code and a computational guide (Appendix 8) that allow to generalize simulations of this paper to arbitrary lattice-spring models with 1-dimensional nodes (as long as the resistance of the network is computable via the known methods of e.g. [4; 9]). Further extension of the sweeping process framework to the case of nodes of arbitrary dimension and hyperuniform network materials is available in [8] whose formulas can also be used for optimization of multi-functional properties along the strategy of the current paper.
In what follows, denotes the elastic limit of spring , so that the relaxed length of the spring changes when the stress attempts to exceed the interval For lattice spring models coming from fiber-reinforced composites, the sum can be viewed as the fabrication cost of the material because the cost of such composites is mainly determined by fabrication of the nano-carbon fibers [14]. When the displacement-controlled loading (applied to nodes ① and ④) stretches the system gradually, the response force of the system will increase up to a certain terminal value that quantifies the strength of the material. Viewing Fig. 1 as an electric circuit, and using and to denote the resistance and conductance between nodes ① and ④, the present paper addresses optimization of the functionals
| (1) |
Using Wolfram Mathematica we make a variety of qualitative observations (listed in Conclusions section) that could motivate a good deal of new theoretical research in optimization theory. Some of these observations are uniqueness of optimal values of parameters in the optimization of and , non-uniqueness of in the optimization of , existence of linear thresholds in the space of parameters that separate topologically different patterns of optimal
The paper is organized as follows. In the next section of the paper we introduce the ingredients , , and used in the definition of the functionals and . In particular, we introduce two domains (6) and (8) for the parameters that this paper restricts the analysis to (taken from Gudoshnikov et al [5]). Section 3 discusses the numerical methods used for optimization of the functionals , , , along with computational complexity of the method of our choice. Section 4 is devoted to maximization of the functionals and with a constraint on the cost In this section we first determine the maximal value of (Section 4.1) that can be reached by the system of Fig. 1 with the chosen constraint on the cost and then maximize and (Sections 4.2 and 4.3 respectively) restricting on the domain of for which the value of doesn’t go below by more than (constraint (13)). In other words, we forbid improved multi-functional properties of a lattice-spring system to compromise the strength of the system by more than Minimization of the cost under constraint on and (from below) is addressed in Sections 5.1 and 5.2. Sections 5.1 and 5.2 are restricted on the domain of for which the value of doesn’t go below too. The conclusions from numerical simulations of Sections 4 and 5 are formulated as Propositions 4.2, 4.3, 5.1, 5.2. Additionally, Section 4.1 quotes the Mathematica’s command we use, which clarifies that all numerical computations can be executed analytically by hand over the methods of linear programming. The conclusion section interprets the numerical results of Sections 4 and 5.1 from more general theoretic perspectives and draws a list of analytic questions inspired by Propositions 4.2, 4.3, 5.1, 5.2. Two appendixes that compute the resistance of the circuit of Fig. 1 (Appendix 7) and outline the sweeping process framework of [5] based conclusions about plastic regimes in elastoplastic system of Fig. 1 (Appendix 8) conclude the paper. Wolfram Mathematica Notebook is attached as supplementary material.
2 Algebraic formulas for the optimization functionals
Resistance of the System of Springs. Assuming that the elastic limits of the 5 springs of Fig. 1 are given by , , the resistance of spring will be taken as
| (2) |
The relation (2) is inspired by typical design mechanisms used in composite materials. For example, one possible realization of the spring can be achieved by fiber-reinforced polymer matrix composites [14]. In this system, both the mechanical strength (i.e. ) and conductivity (i.e. ) are determined by the fiber phase and thus, are positively correlated [21]. With the values of resistances of springs given by , the resultant resistance between nodes ① and ④ computes as (see Appendix 7)
| (3) |
and conductance is computed as
| (4) |
Terminal Response Force. According to the sweeping process framework by Gudoshnikov et al [5] (see Appendix 8 for details), gradual stretching of the lattice of Fig. 1 via the displacement-controlled loading that is applied between nodes ① and ④ increases the response force of the lattice up to a certain terminal value whose formula takes different forms depending on the values of . These formulas can be summarized as follows
| (6) | |||||
| (8) | |||||
where we restrict ourselves to parameters that ensure the greatest number of springs reaches the plastic mode. The later property corresponds to the most uniform distribution of plastic deformation across the lattice that reduces the risk of crack initialization. Specifically, if inequalities (6) hold in a strict sense then springs 1, 3, 5 reach plastic deformation as the magnitude of the displacement-controlled loading crosses a threshold (i.e. springs 1, 3, 5 get to the plastic mode terminally, see [5] for explicit formulas), while if condition (8) holds in a strict sense then those are springs 2, 3, 4 that get to plastic mode terminally111Note, the non-strict inequalities in (8.4) and (8.5) of [5] is a typo. There should be strict inequalities because (8.4) and (8.5) come from (7.10) whose inequalities are strict.. The inequalities (6) and (8) will be referred to as feasibility conditions. In what follows, we use feasibility conditions as optimization constraints, so that we will usually get optimal on the boundary of the domains (6) and (8) and strict inequalities in (6) and (8) won’t hold for our optimal . Arbitrary small perturbation will be needed to move such optimal to the interior of the domain (6) or (8) to make the plastic behavior of the model predictable according to [5].
Remark 1.
We note that if satisfies (6) then
| (9) |
satisfies (8) and computed for coincides with computed for . Therefore, solving an optimization problem involving and on the domain (6) is equivalent to solving same optimization problem on the domain (8). We will, however, run Wolfram Mathematica code for both problems to assess uniquness/nonuniqueness of optimal values . In other words, if Mathematica code executed for domains (6) and (8) returns us and that are related over (9), then we conclude that the optimal value is unique in the domain (6) and that the optimal value is unique in the domain (8).
3 The methods used for numerical simulations
We analyze the results for the optimization problem based on two different optimization methods for constrained global optimization available within Wolfram Mathematica. We use NMaximize and NMinimize which are global optimization algorithms for solving problems numerically. Within those we have other optimization methods, the ones that we consider for our problem are ”RandomSearch” and ”Differential Evolution”. Differential evolution is a simple stochastic function minimizer. It starts [23; 24] with a population of candidate solutions randomly distributed in the search space. At each iteration, new candidate solutions are generated by combining and mutating existing solutions according to certain rules. These new solutions are then evaluated, and the best ones are retained for the next generation. Random search on the other hand works [23] by generating a population of random starting points and uses a local optimization method from each of the starting points to converge to a local minimum. When the results from the two methods do not coincide, Differential Evolution was the one showing the correct extremum except of a negligible number of exceptions that we furter verified using Phyton SLSQP algorithm. We therefore conclude that Differential Evolution is a reliable method for the optimization problem considered in this paper.
According to [17], the computational complexity of the method of Differential Evolution for large networks is determined by the dimensions of the search space, the population size, and the number of iterations. Specifically, the general computational complexity for Differential Evolution is given by [17]
| (10) |
under assumption that the computational complexity of evaluating the objective function grows at most linearly with the dimension of the search space (which is the case for the objective functions of the present paper because is linear by construction, is linear by [6, formula (3.23)], and computational time for scales close to linear if using the algorithm [13], see [13, table I]). Formula (10) says that the number of operations required by Differential Evolution is proportional to the product of the problem’s dimensionality (), the population size (), and the number of iterations (). The population size is usually a fixed constant between and [20]. The number of iterations depends on the desired accuracy and can be viewed as another fixed constant independent of and . Therefore, if the population size is proportional to , then computational complexity of the method of Differential Evolution scales quadratically with respect to the dimension of the problem.
4 Maximization of multi-functional properties under constraint on the cost of the material
In this section we search for the parameters that optimize and under assumption that
| (11) |
4.1 Maximization of strength in the absence of electrical properties
We first determine the maximal possible strength of the material (i.e. the maximal possible ) in the absence of conductance and resistance because we want that addition of conductivity and resistance does not compromise the strength by more than 25%, which is desirable in, e.g., soft robotic applications [14; 16; 25; 19].
Case 1: (6) holds. Using Wolfram Mathematica with the command
-
Maximize
Case 2: (8) holds. Using Wolfram Mathematica (with a command analogous to Case 1) to maximize given by (8) under constraints (8) and (11) leads to the same value (12) of , which is now attained at , (mirroring Case 1 as expected).
The results of Case 1 and Case 2 can be concluded as follows.
Proposition 4.1.

Based on the value (12) we impose the following additional constraint
| (13) |
saying that we don’t want to reduce the strength by more than 25% when optimizing conductance and resistance.
4.2 Maximization of the strength-resistance functional
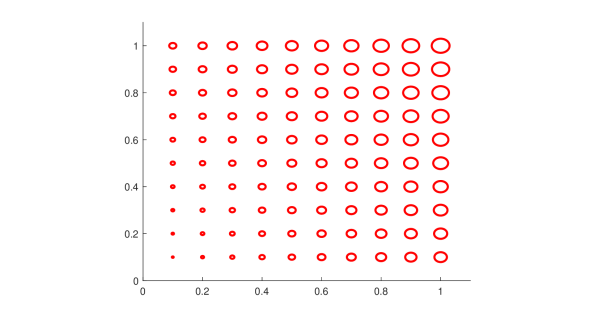
In this section we use Wolfram Mathematica to find the maximal value of the functional (given by (1)) on set of parameters satisfying constraints (11) and (13) along with either (6) or (8). This optimization problem is solved for each fixed pair of coefficients varying from 0.1 to 1 with the step 0.1. We use two commands of the code:
-
Table
NMinimize -
Table
NMinimize
and choose the best result for each of the values of and .
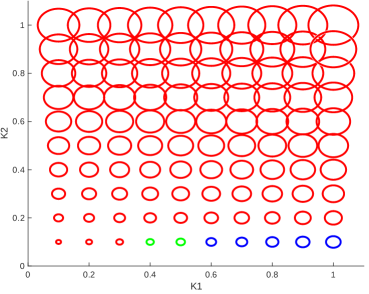
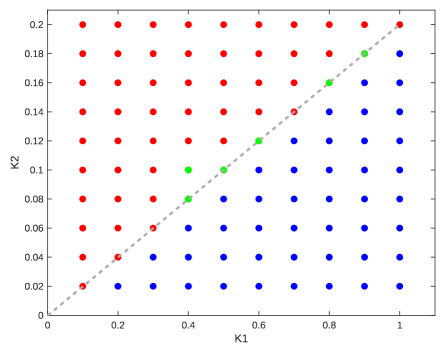
We conclude that for each fixed and , the maximal value of and the corresponding values of and do not depend on whether constraint (6) or (8) is used. These values are presented in Fig. 3. Increase of the maximal value of when and increase is expected because of the structure of the functional . However, the switch from to when crosses a threshold (solid gray line in Fig. 4) is an interesting discovery.
The optimal values of at which the maximum of is attained turned out to be strictly related to whether or holds.
For the points where (i.e. above the threshold of Fig. 4), we have in the domain (6) and in the domain (8). The green points in Fig. 4 is where Mathematica computes different optimal values ( in the domain (6) and in the domain (8)), however, the value of the functional for these points roughly coincides (up to error of ) with what we get if consider and instead.
For the points where (i.e. below the threshold of Fig. 4), the optimal values of are (Mathematica computes these values with a error) regardless of whether (6) or (8) is used.

Proposition 4.2.
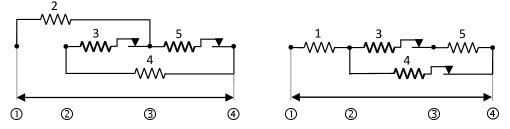
In order to obtain the maximal interplay between strength and resistance of the network of Fig. 1 (functional ) keeping the cost of the network under a fixed value, only 4 of 5 springs of Fig. 1 are needed for most of the values of except for a few exceptional values of shown in green in Figs. 3 and 4 where all 5 springs are needed. In the case where 4 springs are needed, the 4 springs should be connected as in Fig. 5 or as in Fig. 6 according to whether the parameters are above of a certain threshold (shown in Fig. 4) or below. For parameters above the threshold and on the threshold, the equal maximums of are attained at (domain (6)) and (domain (8)) except for special values of near the threshold (indicated in Fig. 4 in green) where equal maximums of are attained at (domain (6)) and (domain (8)). For parameters below the threshold, the maximum of is attained at These values of belong to the boundaries of both domains (6) and (8) simultaneously.
Proposition 4.2 implies that, if electrical resistance of the material is a more critical objective compared to mechanical strength, then the topology of Fig. 5 has to be chosen for the model design; if mechanical strength is valued more over the electrical resistance then the topology of Fig. 6 needs to be used.
From Fig. 3 we can also conclude that increases faster along the direction (of the coordinate plane) compared to the direction
4.3 Maximization of the strength-conductance functional
The settings for optimization of the functional (given by (1)) and Wolfram Mathematica code are analogous to those of functional , see the beginning of Section 4.2.
We conclude that for each , the maximal value of is attained at , and the corresponding values of and are .
Proposition 4.3.
In order to obtain the maximal interplay between strength and conductance of the network of Fig. 1 (functional ) keeping the cost of the network under a fixed value, only 4 of 5 springs of Fig. 1 are needed and the topology of the network should be taken as in Fig. 5. The values of at which the maximum of is attained are for all These values of belong to the boundaries of both domains (6) and (8) simultaneously.
The ratios of how increases across different directions of can be learned from Fig. 7. We conclude that increases faster along the direction (of the coordinate plane) compared to the direction
5 Minimization of the cost of material under constraint on the multi-functional properties
Since the optimal values of the functionals and vary in the intervals [0.1,1.2] and [0.1,1.5] when the cost of the material is constrained (Sections 4.2 and 4.3), we will pick a constant inside both of the intervals as a constraint (lower bound) for the functionals and when optimizing . Specifically, we will consider
| (14) |
and
| (15) |
5.1 Minimization of the cost under constraint on the strength-resistance functional
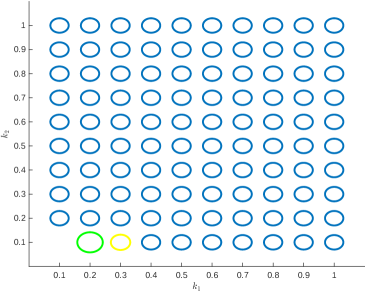
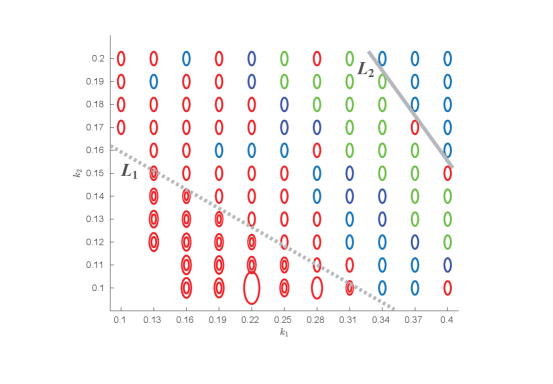
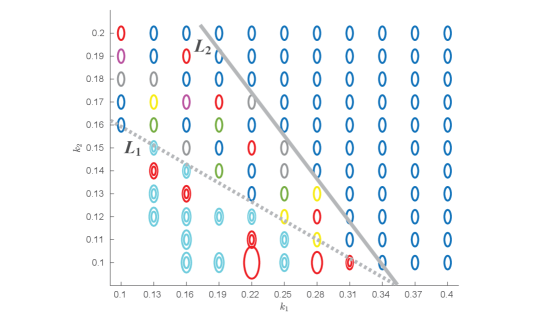
For each of the two domains (6) and (8), and any , the minimal value of with the constraints (13) and (14) is always attained on the boundary. As Fig. 8 illustrates, optimal values of and don’t change for almost the entire range of parameters with some changes taking place closer to To get insight into these changes we zoom the region in Figs. 9 and 10 (corresponding to domains (6) and (8) accordingly).
From Figures 9 and 10 we observe that the optimal values and the cost value stay constant in the upper right part of the plane, specifically
| (16) | |||
| (17) |
(which differ by that we relate to computational error), until crosses a straight line (threshold) of an approximate slope of (solid gray lines in Figs. 9 and 10). Moving further towards , we observe another threshold (dotted gray lines in Figs. 9 and 10 close to slope-wise too) when switches from zero to positive. In between the solid and dotted lines, we discovered several collections of equal indicated in Figs. 9 and 10 in different colors. As follows from Figs. 8, 9, 10, at least one vanishes in each of the optimal values . In particular, in the case of domain (6), non-vanishing implies that either or (i.e. the topology of the network takes the form of Fig. 6 (left)), while in the case of domain (8), non-vanishing implies that either or (i.e. the topology of the network takes the form of Fig. 6 (right)).
We discover that the minimal value of for the values of above the dotted threshold and below the dotted threshold, i.e. whether or turns out to be strictly related to whether or with 4 exceptions listed in Tables 1 and 2.
| 1.75 | 1.14 | 3.51 | ||
| 1.18 | 1.69 | 2.36 |
| 1.75 | 1.14 | 3.51 | ||
| 1.18 | 1.69 | 2.36 |
Notice, the values of in Tables 1 and 2 is what we obtain with Wolfram Mathematica. However, one can immediately see that each of the in Tables 1 and 2 satisfy both domains (6) and (8) at the same time.
The optimal value of the functional below the dotted threshold and above the dotted threshold. The corresponding value of response force is always except for the cases listed in Tables 1 and 2.
Proposition 5.1.
In order to minimize the manufacturing cost of the network of Fig. 1 keeping both the strength and strength-resistance above fixed values, only 4 of 5 springs of Fig. 1 are needed (connected as in Fig. 5 above the dotted threshold of Figs. 9-10 and connected as in Fig. 6 below ). The optimal values are approximately above the solid threshold and are grouped in patterns shown in Figs. 9-10 below . The minimal value of above and below except for a few exceptions that occur at (and that are listed in Tables 1 and 2). The values and above suggest the cost above is determined solely by constraint (13) and constraint (14) is redundant above On the other hand and below suggests that both constraints (13) and (14) come to play below . The slopes of both thresholds and are approximately For each of the domains (6) and (8), the maximal value of the minimum of (the biggest oval in Figs. 9 and 10) is unique across all parameters and attained at approximately The optimal values are non-unique, but the threshold doesn’t depend on the domain. While for above the optimal values of on (6) coincide with the optimal values of on (8) (i.e. common optimal values belong to the boundaries of both domains simultaneously), for values of below , the optimal values on (6) are different from the optimal values on (8).
5.2 Minimization of the cost under constraint on the strength-conductance functional
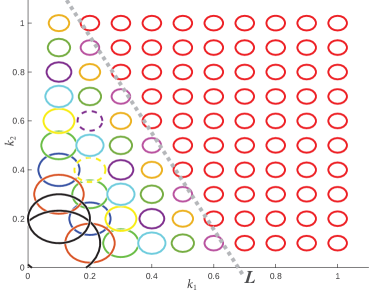
For each of the two domains (6) and (8), and any , the minimal value of with the constraints (13) and (15) is always attained on the boundary. As Fig. 11 illustrates, optimal value or according to whether is above or below the dotted threshold (of approximate slope ). For all , the optimal values of satisfy either
(i) , or
(ii) , .
In particular, the optimal value of is always 0. For the values below the dotted threshold, we observe lines (with the slope roughly equal to the slope of the dotted threshold) of equal optimal values of , which can be seen in different colors in Fig. 11. At the same time, we do not see any distinguishable patterns of equal optimal values of when is above the solid threshold.
For all the cases where the minimal cost is (red circles in the graph), we get , and . For all the cases where (non-red circles) we get , but, interestingly, .
Proposition 5.2.
In order to minimize the manufacturing cost of the network of Fig. 1 keeping both the strength and strength-conductance above fixed values (constraints (13) and (15)), only 4 of 5 springs of Fig. 1 are needed connected as in Fig. 5. For each of the domains (6) and (8), the minimal value of above the dotted threshold (of approximate slope ) of Fig. 11 and below . The value above suggests that constraint (13) doesn’t allow the cost to go below for above and constraint (15) doesn’t come to play above On the other hand, below suggests that constraint (13) is redundant below . For each , the optimal values belong to the boundaries of both domains (6) and (8) simultaneously (and is always 0). The other optimal parameters form lines (of approximate slope ) of equal values below the threshold, as shown in Fig. 11. The minimal value of increases as approaches .
6 Conclusions
In this paper we considered a prototypic model of 5 elastoplastic conducting springs on 4 nodes and used formulas from the sweeping process theory to determine parameters of the springs that solve the following optimization problems:
-
(A)
maximize the combined strength and electric resistance of material (functional ) under constraint on the maximal fabrication cost and strength ;
-
(B)
maximize the combined strength and electric conductance of the material (functional ) under constraint on the maximal values of and strength ;
-
(C)
minimize the fabrication cost assuming that neither , nor , go below given constraints;
-
(D)
minimize the fabrication cost assuming that neither , nor , go below given constraints.
The conclusions obtained with Wolfram Mathematica NMaximize command are summarized in Propositions 4.2, 4.3, 5.1, 5.2 and motivate several tasks towards rigorous mathematical proofs that we group below according to the above stated Problems A, B, C, and D. We recall that we refer to an optimal value as unique, if is unique in one of the domains (6) and (8), see Remark 1.
A1: Prove uniqueness of the optimal value for each value of
A2: Prove that the space of parameters splits into 3 groups so that the optimal values in each group coincide.
A3: Examine whether or not one of the 3 groups from A1 always forms a straight line that separates the other 2 groups. At the very least, prove that the above-mentioned 2 groups are always separated by a straight line . Find the equation of , which is expected to be independent of the chosen domain of parameters (domains (6) and (8) in this paper).
A4: Prove that the optimal values below belong to the boundaries of both domains (6) and (8) simultaneously. Prove that the optimal values above and on do not belong to the boundaries of (6) and (8) simultaneously.
B1: Prove that optimal values are unique, independent of parameters and belong to the boundaries of both domains (6) and (8) simultaneously.
C1: Prove the existence of a linear threshold in the space of parameters on so that the optimal values above coincide. Find the equation of , which is expected to depend on the chosen domain of parameters .
C2: For the values of below , prove the existence of lines (presumably parallel to ) so that the optimal values of are constant alone these lines.
C3: Prove the existence of another linear threshold in the space of parameters (below ) such that keeps a constant value above and is larger than this constant value below Find the equation of , which (in contrast with ) is expected to be independent on the chosen domain of parameters and expected to be parallel to .
C4: Prove that crossing the threshold corresponds to reaching its chosen bound (in this paper, crossing from above to below, reaches the lower bound of ).
C5: Prove that equals its chosen bound (0.75 in this paper) for all except for isolated special values. Determine the nature of these special values.
C6: Prove that, across all values of , the maximum of the minimal values of is attained at some Moreover, such a value of is unique.
C7: Prove the existence of a linear threshold such that the optimal values are unique above the threshold and non-unique below the threshold.
C8: Prove that the optimal values above belong to the boundaries of both domains (6) and (8) simultaneously. Prove that the optimal values below do not belong to the boundaries of (6) and (8) simultaneously.
D1: Prove the existence of a linear threshold in the space of parameters such that keeps a constant value above and is larger than this constant value below Find the equation of , which is expected to be independent of the chosen domain of parameters .
D2: Prove that crossing the threshold corresponds to switching from to ( in this paper) and switching from to (), if moving from under to above .
D3: For the values of below , prove the existence of lines along where the optimal values of are constant.
D4: Prove uniqueness of the optimal values for every potentially disproving the existence of those special pairs (such as and in Fig. 11) where nonuniqueness is detected by Wolfram Mathematica (or explain the nature of where nonuniquness of the optimal values takes places).
Simulations of this paper are executed under assumption that the plastic mode is terminally reached by a maximally possible number of springs. Dropping this assumption might be of interest in applications outside of materials science. This would require extension of our numerical analysis from domains (6) and (8) to all positive values of , that might stimulate further development of the theory of [5] and further derivation of the corresponding terminal forces (6) and (8) (that are not yet available for all positive values of ).
We hope that simulation results reported and theoretical questions motivated by these simulation results will attract interest of future researchers.
7 Appendix: Conductance of a Wheatstone Bridge
This section follows the lines of [9] to calculate the equivalent conductance of the circuit of Fig. 1 where spring is viewed as resistance . We assume that node 1 is connected to the positive terminal of the battery of potential and node 4 is connected to the negative terminal of zero potential. As per the junction law, the sum of currents into node 2 and node 3 is .
We consider and , so we get ,
and can be expressed as :
The equivalent conductance of the circuit denoted by is the current flowing from the positive to the negative terminal of the battery, given by
The equivalent resistance of the system denoted by is given by
8 Appendix: Sweeping process framework for finite-time stability of elastoplastic systems with application to the benchmark example
8.1 The outline of the general framework
According to Moreau [15] a network of elastoplastic springs on 1-dimensional nodes with one displacement-controlled loading (we refer the reader to [8] for the case of -dimensional nodes) is fully defined by an kinematic matrix of the topology of the network, matrix of stiffnesses (Hooke’s coefficients) , an -dimensional hyperrectangle of the achievable stresses of springs (beyond which plastic deformation begins), a vector of the location of the displacement-controlled loading, and a scalar function that defines the magnitude of the displacement-controlled loading. Based on the parameters the space is decomposed into a direct product of two supspaces which can be used to formulate a dynamical system that governs the stress vector of the network. A concise step-by-step guide for computation of all the quantities listed above is available in [7].
Sweeping process. To define a dynamical system that governs the stress-vector of , let
denote the normal cone to a set at point . The stress-vector of is then
| (18) |
where is the solutions of the differential inclusion (called sweeping process)
| (19) |
and is a suitably constructed vector of (see [7; 5] for the formula of ).
Admissibility condition. To understand how the sweeping process approach helps to predict the asymptotic behavior of we recall that the polyhedron in (19) computes as
where
and are suitable vectors of , whose computational formulas (in terms of the mechanical parameters of the network) are also available in [7]. Let be the vector whose -th component equal and all other components equal 0. According to [5], if relation
| (20) |
holds for an irreducible (i.e. (20) fails for any ), where is a certain orthogonal to matrix (see [7] for the formula), then
| (21) |
where is the boundary of , is a candidate finite-time attractor for sweeping process (19). If satisfies (20), we say that is admissible. Therefore, if (20) holds, then combining (18) and (21),
| (22) |
is a candidate attractor for the stress-vector of elastoplastic system
.
Feasibility condition. To determine, which of the candidate attractors is actually attained, the facet has to verify a so-called feasibility condition, i.e. the condition To verify the latter condition computationally, the paper [5] determines the vertices of :
| (23) |
where the columns of are basis vectors of and is such that When , is just a vertex, i.e. no computation of additional is needed and formula (23) is used with just . When , the dimension of is greater than , i.e. is a polyhedron whose number of vertices is denoted by In terms of the vertices , the feasibility condition is found in [5] as follows:
| (24) |
Specifically, if (20) and (24) hold then each solution of (19) converges in finite time to (21) and, accordingly, the stress-vector of converges in finite time to (22).
Terminal response force. The knowledge of the terminal value of stress-vector allows to compute the terminal response force of elastoplastic system . According to [6, formulas (7) and (30)], the terminal response force of is the solution of
8.2 Computations for the benchmark example
Following [5], computation of (20) for the example of Fig. 1 gives
One can observe that the only 4 possibilities for irreducible and admissible are
-
•
,
-
•
,
-
•
-
•
,
where, for clarity, we use ”+” for and ”” for . The paper [5] shows that feasibility condition (24) for first two bullet points to take place are (6) and (8) respectively, and the corresponding terminal response force is given by formulas (6) and (8) accordingly.
References
- [1] S. Adly, H. Attouch, A. Cabot, Finite time stabilization of nonlinear oscillators subject to dry friction. Nonsmooth mechanics and analysis, 289–304, Adv. Mech. Math., 12, Springer, New York, 2006.
- [2] I. Blechman, Paradox of fatigue of perfect soft metals in terms of micro plasticity and damage, Int. J. Fatigue 120 (2019) 353–375.
- [3] H. Chen, Y. Xu, Y. Jiao and Y. Liu, A Novel Discrete Computational Tool for Microstructure- Sensitive Mechanical Analysis of Composite Materials, Materials Science and Engineering A, Vol. 659, 234–241, 2016.
- [4] E. B. Curtis, D. Ingerman, J. A. Morrow, Circular planar graphs and resistor networks. Linear Algebra Appl. 283 (1998), no. 1-3, 115–150.
- [5] I. Gudoshnikov, O. Makarenkov, D. Rachinskii, Finite-time stability of polyhedral sweeping processes with application to elastoplastic systems. SIAM J. Control Optim. 60 (2022), no. 3, 1320–1346.
- [6] I. Gudoshnikov, O. Makarenkov, Stabilization of the response of cyclically loaded lattice spring models with plasticity. ESAIM Control Optim. Calc. Var. Vol. 27, suppl., Paper No. S8, 43 pp., 2021.
- [7] I. Gudoshnikov, O. Makarenkov, Structurally stable families of periodic solutions in sweeping processes of networks of elastoplastic springs, Phys. D 406 (2020), 132443, 6 pp.
- [8] I. Gudoshnikov, Y. Jiao, O. Makarenkov, D. Chen, Sweeping process approach to stress analysis in elastoplastic Lattice Springs Models with applications to Hyperuniform Network Materials, arXiv preprint, https://arxiv.org/abs/2204.03015.
- [9] M. Kagan, On equivalent resistance of electrical circuits, American Journal of Physics, 83, 53-63 (2015).
- [10] S. Kale, M. Ostoja-Starzewski, Lattice and Particle Modeling of Damage Phenomena, G. Z. Voyiadjis (ed.), Handbook of Damage Mechanics, Springer, 203–238, 2015.
- [11] P. Krejci, Hysteresis, Convexity and Dissipation in Hyperbolic Equations, Gattotoscho (1996).
- [12] J. Liu, A. T. Gaynor, S. Chen, Z. Kang, K. Suresh, A. Takezawa, L. Li, J. Kato, J. Tang, C. C. L. Wang, L. Cheng, X. Liang, A. C. To, Current and future trends in topology optimization for additive manufacturing, Structural and Multidisciplinary Optimization 57 (2018) 2457–2483.
- [13] Z. Liu and W. Yu, Computing Effective Resistances on Large Graphs Based on Approximate Inverse of Cholesky Factor, 2023 Design, Automation & Test in Europe Conference & Exhibition (DATE), Antwerp, Belgium, 2023, pp. 1-6, doi: 10.23919/DATE56975.2023.10137201.
- [14] N. Mohammadi, et al. Robust Three-Component Elastomer Particle Fiber Composites with Tunable Properties for Soft Robotics, Advanced Intelligent Systems, 2000166 (2021)
- [15] J.-J. Moreau, On unilateral constraints, friction and plasticity. New variational techniques in mathematical physics (Centro Internaz. Mat. Estivo (C.I.M.E.), II Ciclo, Bressanone, 1973), pp. 171-322. Edizioni Cremonese, Rome, 1974.
- [16] A. M. Nasab, S. Sharifi, S. Chen, Y. Jiao, W. Shan, Robust Three-Component Elastomer–Particle–Fiber Composites with Tunable Properties for Soft Robotics, Advanced Intelligent Systems 3 (2021), no. 2, 2000166.
- [17] K. Opara, J. Arabas, Differential Evolution: A survey of theoretic analyses, Swarm and Evolutionary Computation, Volume 44 (2019) 546–558.
- [18] D. Rachinskii, On geometric conditions for reduction of the Moreau sweeping process to the Prandtl-Ishlinskii operator. (English summary) Discrete Contin. Dyn. Syst. Ser. B, Vol. 23, no. 8, 3361–3386, 2018.
- [19] S. Sharifi, A. M. Nasab, P. E. Chen, Y. Liao, Y. Jiao, and W. Shan, Robust Bicontinuous Metal-Elastomer Foam Composites with Highly Tunable Stiffness, Advanced Engineering Materials 24, 2101533 (2022)
- [20] R. Storn, K. Price, Differential Evolution – A Simple and Efficient Heuristic for Global Optimization over Continuous Spaces, Journal of Global Optimization, Journal of Global Optimization 11 (1997) 341–359.
- [21] S. Torquato, Modeling of physical properties of composite materials. International Journal of Solids and Structures, 37, 411 (2000).
- [22] X. Wang, M. Jiang, Z. Zhou, J. Gou, D. Hui, 3D printing of polymer matrix composites: A review and prospective, Composites Part B 110 (2017) 442–458.
-
[23]
Wolfram Mathematica Tutorial,
https://reference.wolfram.com/
language/tutorial/ConstrainedOptimizationGlobalNumerical.html - [24] Wolfram MathWorld, https://mathworld.wolfram.com/DifferentialEvolution.html
- [25] Y. Xu, P. E. Chen, H. Li, W. Xu, Y. Ren, W. Shan, and Y. Jiao, Correlation-function-based microstructure design of alloy-polymer composites for dynamic dry adhesion tuning in soft gripping, Journal of Applied Physics 131, 115104 (2022).
- [26] M. Yang, L. Weng, H. Zhu, T. Fan, D. Zhang, Simultaneously enhancing the strength, ductility and conductivity of copper matrix composites with graphene nanoribbons, Carbon 118 (2017) 250–260.