[1,2,1,1]Charles Kemp, Duane W. Hamacher, Daniel R. Little, Simon J. Cropper \authorsaffiliationsMelbourne School of Psychological Sciences, University of Melbourne,School of Physics, University of Melbourne
Perceptual grouping explains similarities in constellations across cultures
Abstract
Cultures around the world organise stars into constellations, or asterisms, and these groupings are often considered to be arbitrary and culture-specific. Yet there are striking similarities in asterisms across cultures, and groupings such as Orion, the Big Dipper, the Pleiades and the Southern Cross are widely recognized across many different cultures. Psychologists have informally suggested that these shared patterns are explained by Gestalt laws of grouping, but there have been no systematic attempts to catalog asterisms that recur across cultures or to explain the perceptual basis of these groupings. Here we compile data from 27 cultures around the world and show that a simple computational model of perceptual grouping accounts for many of the recurring cross-cultural asterisms. Our results suggest that basic perceptual principles account for more of the structure of asterisms across cultures than previously acknowledged and highlight ways in which specific cultures depart from this shared baseline.
keywords:
perceptual grouping, Gestalt principles, clustering, cultural astronomyStatement of Relevance: Throughout history, people from many cultures have organized the night sky into constellations and embedded these constellations in stories. Psychologists have informally suggested that constellations result from a process of perceptual grouping, and here we systematically explore the extent to which this idea accounts for constellations across cultures. Using data from 27 cultures, we establish which constellations appear frequently across cultures and find that the list of recurring constellations extends beyond familiar examples such as Orion and the Big Dipper. We then present and evaluate a computational model that aims to capture how humans group stars into constellations. The model groups stars based on proximity and brightness, and these factors alone are enough to account for many of the constellations that recur across cultures. Although constellations are clearly shaped by culture-specific knowledge, our results reveal that basic perceptual factors account for a large set of similarities in constellations across cultures.
Charles Kemp0000-0001-9683-8737
\addORCIDlinkDuane W. Hamacher0000-0003-3072-8468
\addORCIDlinkDaniel R. Little0000-0003-3607-5525
\addORCIDlinkSimon J. Cropper0000-0002-3574-6414
Code and data are available at https://github.com/cskemp/constellations
We acknowledge the Indigenous custodians of the traditional astronomical knowledge used in this paper, and thank Joshua Abbott, Celia Kemp, Bradley Schaefer and Yuting Zhang for comments on the manuscript. This work was supported in part by ARC FT190100200, ARC DE140101600, the McCoy Seed Fund, the Laby Foundation, the Pierce Bequest, and by a seed grant from the Royal Society of Victoria.
Correspondence concerning this article should be addressed to Charles Kemp,
Melbourne School of Psychological Sciences, University of Melbourne, Victoria 3010, Australia. E-mail: c.kemp@unimelb.edu.au
Anyone who has tried to learn the full set of 88 Western constellations will sympathize with herschel1842, who wrote that “the constellations seem to have been almost purposely named and delineated to cause as much confusion and inconvenience as possible,” and that “innumerable snakes twine through long and contorted areas of the heavens, where no memory can follow them.” Yet herschel1841 and others also point out that there are “well-defined natural groups of conspicuous stars” that have been picked out and named by multiple cultures around the world (krupp00; aveni08; kelley11). For example, the Southern Cross is recognized as a cross by multiple cultures (urton05; roe05), and is identified as a stingray by the Yolngu of northern Australia (mountford56), an anchor by the Tainui of Aotearoa/New Zealand (best22), and as a curassow bird by the Lokono of the Guianas (maganaj82).
Asterisms (e.g. the Southern Cross) are sometimes distinguished from constellations (e.g. the region of the sky within which the Southern Cross lies), but in cross-cultural work these two terms are often used interchangeably. It is widely acknowledged that asterisms reflect both universal perceptual principles and culture-specific traditions. For example, urton81 notes that “almost every culture seems to have recognized a few of the same celestial groupings (e.g., the tight cluster of the Pleiades, the V of the Hyades, the straight line of the belt of Orion), but the large constellation shapes of European astronomy and astrology simply are not universally recognized; the shapes were projected onto the stars because the shapes were important objects or characters in the Western religious, mythological, and calendrical tradition.” Even groupings as apparently salient as the Southern Cross are not inevitable—some Australian cultures have many names for individual stars but tend not to “connect the dots” to form figured constellations (johnson14; maegraith32; cairnsh04).
Although cultural factors are undeniably important, we will argue that perceptual factors explain more of the inventory of asterisms across cultures than has previously been recognized. krupp00 suggests that a “narrow company” of asterisms is common across cultures and lists just four: Orion’s Belt, the Pleiades, the Big Dipper, and the Southern Cross. Here we draw on existing resources to compile a detailed catalog of asterisms across cultures, and find that the list of recurring asterisms goes deeper than the handful of examples typically given by Krupp and others (Aveni,1980; Krupp, 2000a, 2000b). To demonstrate that these asterisms are mostly consistent with universal perceptual principles, we present a computational model of perceptual grouping and show that it accounts for many of the asterisms that recur across cultures.
1 A catalog of asterisms across cultures
Our data set includes 22 systems drawn from the Stellarium software package (stellarium) and 5 from the ethnographic literature (all sources are listed in the captions of Figures S16-S42). To allow us to focus on the brighter stars, each system was pre-processed by removing stars fainter than 4.5 in magnitude then removing all asterisms that included no stars or just one star after filtering. The data span six major regions (Asia, Australia, Europe, North America, Oceania, and South America), and include systems from both oral (e.g. Inuit) and literate cultures (e.g. Chinese). Stellarium currently includes a total of 42 systems, and we excluded 20 because they were closely related to a system already included or because their documentation was not sufficiently grounded in the scholarly literature. Most of our sources specify asterism figures in addition to the stars included in each asterism, but we chose not to use these figures because they can vary significantly within a culture and because they were not available for all cultures. Some of our analyses do not require asterism figures, and for those that do we used minimum spanning trees computed over the stars within each asterism.
| Human Score | Weighted Human Score | Model Score | Stars | Description | |
| 1 | 0.66 | 0.73 | 1.0 | 25EtaTau, 17Tau, 19Tau, 20Tau, 23Tau, 27Tau | Pleiades |
| 2 | 0.65 | 0.64 | 1.0 | 34DelOri, 46EpsOri, 50ZetOri | Orion’s Belt |
| 3 | 0.61 | 0.52 | 1.0 | 87AlpTau, 54GamTau, 61Del1Tau, 74EpsTau, 78The2Tau | Hyades |
| 4 | 0.58 | 0.47 | 0.88 | 50AlpUMa, 48BetUMa, 64GamUMa, 69DelUMa, 77EpsUMa, 79ZetUMa, 85EtaUMa | Big Dipper |
| 5 | 0.43 | 0.4 | 1.0 | Alp1Cru, BetCru, GamCru, DelCru | Southern Cross |
| 6 | 0.38 | 0.27 | 0.83 | 5AlpCrB, 3BetCrB, 8GamCrB, 13EpsCrB, 4TheCrB | Corona Borealis |
| 7 | 0.35 | 0.28 | 1.0 | 66AlpGem, 78BetGem | Castor and Pollux |
| 8 | 0.35 | 0.34 | 0.45 | 58AlpOri, 24GamOri, 34DelOri, 46EpsOri, 50ZetOri | |
| 9 | 0.31 | 0.35 | 0.6 | 34DelOri, 46EpsOri, 50ZetOri, 44IotOri, 42Ori | Orion’s Belt and Sword |
| 10 | 0.31 | 0.25 | 0.56 | 50AlpUMa, 48BetUMa, 64GamUMa, 69DelUMa, 77EpsUMa, 79ZetUMa, 85EtaUMa, 1OmiUMa, 29UpsUMa, 63ChiUMa, 23UMa | |
| 11 | 0.3 | 0.22 | 0.71 | 18AlpCas, 11BetCas, 27GamCas, 37DelCas, 45EpsCas | Cassiopeia |
| 12 | 0.3 | 0.35 | 1.0 | 9AlpDel, 6BetDel, 12Gam2Del, 11DelDel | Delphinus |
| 13 | 0.28 | 0.23 | 0.38 | 11AlpDra, 50AlpUMa, 48BetUMa, 64GamUMa, 69DelUMa, 77EpsUMa, 79ZetUMa, 85EtaUMa, 23UMa, 26UMa, 12Alp2CVn | |
| 14 | 0.27 | 0.25 | 0.75 | 46EpsOri, 50ZetOri, 48SigOri | |
| 15 | 0.24 | 0.21 | 1.0 | 13AlpAri, 6BetAri, 5Gam2Ari | Head of Aries |
| 16 | 0.24 | 0.22 | 1.0 | 53AlpAql, 60BetAql, 50GamAql | Shaft of Aquila |
| 17 | 0.24 | 0.34 | 1.0 | Alp1Cen, BetCen | Southern Pointers |
| 18 | 0.23 | 0.33 | 1.0 | AlpCrA, BetCrA, GamCrA | Corona Australis |
| 19 | 0.23 | 0.15 | 0.75 | 1AlpUMi, 7BetUMi, 13GamUMi, 23DelUMi, 22EpsUMi, 16ZetUMi | Little Dipper |
| 20 | 0.22 | 0.19 | 1.0 | 50AlpUMa, 48BetUMa | |
| 21 | 0.22 | 0.22 | 1.0 | 8Bet1Sco, 7DelSco, 6PiSco | Head of Scorpius |
| 22 | 0.21 | 0.21 | 0.04 | 54AlpPeg, 53BetPeg | |
| 23 | 0.21 | 0.2 | 1.0 | 35LamSco, 34UpsSco | Stinger of Scorpius |
| 24 | 0.21 | 0.21 | 1.0 | Iot1Sco, KapSco, 35LamSco, 34UpsSco | |
| 25 | 0.2 | 0.17 | 0.75 | 32AlpLeo, 41Gam1Leo, 17EpsLeo, 36ZetLeo, 30EtaLeo, 24MuLeo | Sickle |
| 26 | 0.2 | 0.15 | 0.83 | 1AlpCrv, 9BetCrv, 4GamCrv, 7DelCrv, 2EpsCrv | Corvus |
| 27 | 0.19 | 0.18 | 0.56 | 21AlpSco, 8Bet1Sco, 7DelSco, 6PiSco, 20SigSco | |
| 28 | 0.19 | 0.19 | 0.0 | 21AlpAnd, 88GamPeg | |
| 29 | 0.18 | 0.16 | 0.58 | 21AlpSco, 8Bet1Sco, 7DelSco, 26EpsSco, Zet2Sco, Mu1Sco, 6PiSco, 20SigSco, 23TauSco | |
| 30 | 0.18 | 0.13 | 0.33 | 50AlpCyg, 6Bet1Cyg, 37GamCyg, 18DelCyg, 53EpsCyg, 21EtaCyg | Northern Cross |
| 31 | 0.17 | 0.16 | 0.56 | 26EpsSco, Zet2Sco, EtaSco, TheSco, Iot1Sco, KapSco, 35LamSco, Mu1Sco, 34UpsSco | Tail of Scorpius |
| 32 | 0.17 | 0.17 | 1.0 | 21AlpSco, 20SigSco, 23TauSco | |
| 33 | 0.17 | 0.09 | 0.83 | 3AlpLyr, 10BetLyr, 14GamLyr, 12Del2Lyr, 6Zet1Lyr | Lyra |
| 34 | 0.16 | 0.13 | 0.01 | 21AlpAnd, 54AlpPeg, 53BetPeg, 88GamPeg | Square of Pegasus |
| 35 | 0.16 | 0.08 | 0.56 | 6Alp2Cap, 9BetCap, 40GamCap, 49DelCap, 34ZetCap, 23TheCap, 32IotCap, 16PsiCap, 18OmeCap | Capricornus |
| 36 | 0.16 | 0.12 | 0.35 | 21AlpSco, 8Bet1Sco, 7DelSco, 26EpsSco, EtaSco, TheSco, Iot1Sco, KapSco, 35LamSco, Mu1Sco, 6PiSco, 23TauSco | Scorpius |
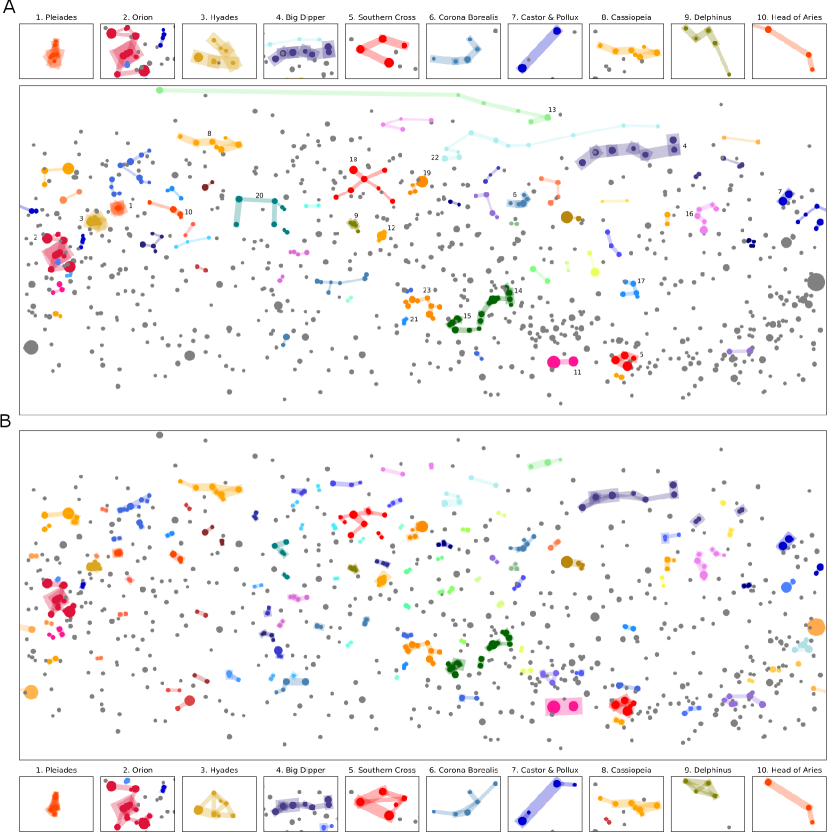
Figure 1A shows a consensus system generated by overlaying minimum spanning trees for asterisms from all 27 cultures. The thick edges in the plot join stars that are grouped by many cultures. The most common asterisms include familiar groups such as Orion’s belt, the Pleiades, the Hyades, the Big Dipper, the Southern Cross, and Cassiopeia. The plot also highlights asterisms such as Corona Borealis, Delphinus and the head of Aries that are discussed less often but nevertheless picked out by multiple cultures. All of these asterisms and more are listed in Table 1, which ranks 36 asterisms based on how frequently they recur across cultures (an extended version of the table appears as Table S2).
The ranking in Table 1 is based on a quantitative approach that allows for partial matches between asterisms in different cultures. We first define the match between an asterism and a reference asterism as
| (1) |
where is the number of stars shared by and , is the number of stars in that are not shared by , and is the number of stars in . The function attains its maximum value of 1 when and are identical. There are two ways in which can differ from : it can include extraneous stars, and it can fail to include some of the stars in . The match function penalizes the first of these failings more heavily than the second. This property is especially useful when comparing an asterism against a reference that includes a relatively large number of stars. For example, the teapot asterism includes 8 of the brightest stars in Sagittarius, and the version of Sagittarius in our Western system includes 17 stars after thresholding at magnitude 4.5. Intuitively, the teapot matches Sagittarius fairly well, and the function in Equation 1 assigns a match of 0.47 between the teapot () and Sagittarius (). If we used an alternative match function where the numerator included penalties for both and , then the match between the teapot and Sagittarius would be 0.
The match between asterism and an entire system of asterisms is defined as
| (2) |
Equation 2 captures the idea that matches well if there is at least one asterism in such that the match between and is high. Finally, the human scores in Table 1 are calculated using
| (3) |
where is the set of all 27 systems in our data set. We computed scores for all asterisms in the entire data set, but to avoid listing variants of the same basic asterism, an asterism is included in Table 1 only if for all asterisms previously listed in the table. To establish a somewhat arbitrary threshold, we will say that an asterism recurs across cultures if it achieves a human score of 0.2 or greater. 28% of the 605 asterisms in our data set meet this criterion, and these recurring asterisms are the subset most likely to be explained by principles of perceptual grouping.
Our data set is tilted towards cultures from the Northern Hemisphere and cultures with historical relationships to the Western system, and both factors may have distorted the human scores in Table 1. To adjust for this imbalance we sorted the 27 cultures into six geographic regions that are listed in the caption of Figure 3. We then computed weighted human scores for each asterism by replacing the mean in Equation 3 with a weighted mean that gives equal weight to each of the six geographic regions. Weighted human scores are included in Table 1, and these scores suggest that southern asterisms including the Southern Pointers and Corona Australis deserve to be listed alongside the ten recurring asterisms singled out at the top of Figure 1A. Regardless of whether we consider human scores or weighted human scores, we find that convergences in asterisms across cultures go beyond the handful of prominent examples typically cited in the literature.
2 A computational model of the grouping of stars into asterisms
To explain shared patterns in the night sky, scholars from multiple disciplines have suggested that asterisms are shaped in part by universal perceptual principles, including the principle that bright objects are especially salient, and that nearby objects are especially likely to be grouped (metzger36; yantis92; hutchins08). yantis92, for example, writes that “certain stellar configurations are ‘seen’ by virtually all cultures (e.g. the Big Dipper)”, and that ‘these constellations are universal in that they satisfy certain of the classic Gestalt laws of proximity, good continuation, similarity (in brightness) and Pragnanz.” Claims that Gestalt principles account for star grouping across cultures are mostly anecdotal, but the principles themselves have been studied in detail by psychologists (Wagemans et al., 2012a, 2012b; Elder, 2015) and have inspired the development of formal models of perceptual grouping (comptonl93; kubovyhw98; dry09; vandenberg98; froyenfm15; imzh16). We build on this tradition by using a computational model (the Graph Clustering model, or GC model for short) to explore the extent to which the factors of brightness and proximity account for asterisms across cultures.
The GC model constructs a graph with the stars as nodes, assigns strengths to the edges based on proximity and brightness, and thresholds the graph so that only the strongest edges remain. Figure 1B shows the model graph when the threshold is set to 320. The connected components of this thresholded graph are the asterisms formed by the model. There is a strong resemblance between these model asterisms and the consensus system in Figure 1A. The model picks out groups that correspond closely to the ten frequently-occurring asterisms highlighted in the inset panels of Figure 1A. Beyond these ten asterisms the model also picks out the Southern Pointers, the teapot in Sagittarius, the head of Draco, the head and stinger of Scorpius, Lyra, the sickle in Leo, the shaft of Aquila, and more. Table S3 lists all groups found by the model and indicates which of them are similar to human asterisms attested in Table S2.
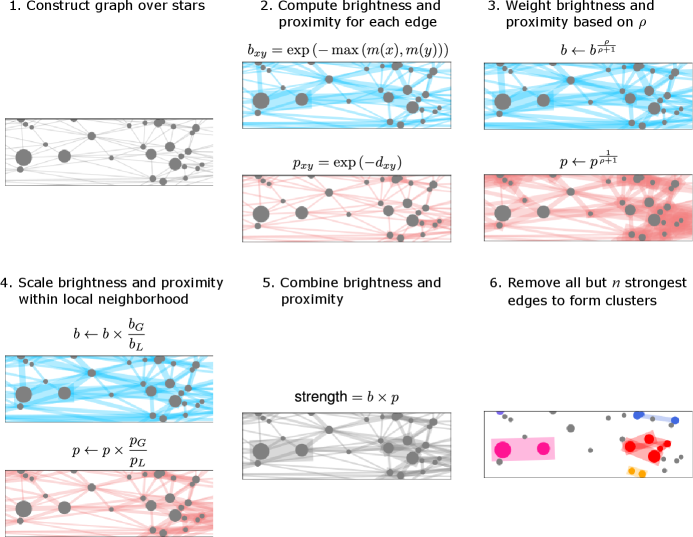
The steps carried out by the model are summarized by Figure 2. The first step is to construct a graph over stars. Existing graph-based clustering models typically operate over a graph corresponding to a minimal spanning tree (zahn71) or Delaunay Triangulation (ahuja82; vandenberg98), and the GC model uses the union of three Delaunay triangulations defined over stars with apparent magnitudes brighter than 3.5, 4.0 and 4.5. Delaunay-like representations are hypothesized to play a role in early stages of human visual processing (dry09), and combining Delaunay triangulations at multiple scales ensures that the resulting graph includes both edges between bright stars that are relatively distant and edges between fainter stars that are relatively close. The second step assigns a brightness and proximity to each edge. For an edge joining two stars, proximity is inversely related to the angular distance between the stars, and brightness is based on the apparent magnitude of the fainter of the two stars. The third step weights brightness and proximity based on a parameter . For all analyses we set , which means that brightness is weighted more heavily than proximity. The fourth step scales brightness and proximity so that the distribution of these variables within a local neighborhood of 60° is comparable with the distribution across the entire celestial sphere. Scaling in this way allows the impact of brightness and proximity to depend on the local context. For example, the Southern Cross lies in a region that contains many stars in close proximity, and we propose that stars need to be especially close to stand out in this context. Previous psychological models of perceptual grouping incorporate analogous local scaling steps (comptonl93; vandenberg98), and the neighborhood size of 60° was chosen to match the extent of mid-peripheral vision. The fifth step multiplies brightness and proximity to assign an overall strength to each edge, and the final step thresholds the graph so that only the strongest edges remain.
We compared the GC model to several alternatives, including variants that lack one of its components, and variants that rely on either collinearity or good continuation in addition to brightness and proximity. We also evaluated a pair of models that rely on k-means clustering, and the CODE model of perceptual grouping (comptonl93). The results reveal that the GC model performs better than all of these alternatives, and full details are provided in the supplemental material. Although adding good continuation to the model did not improve its performance, future work may be able to improve on our efforts in this direction. For example, the current model combines Corona Borealis with an extraneous star and does not connect the tail of Scorpius into a single arc, and finding the right way to incorporate good continuation may resolve both shortcomings.
Each human asterism can be assigned a score between 0 and 1 that measures how well it is captured by the GC model. For this purpose we created a set that includes model systems for all values of the threshold parameter between 1 and 2000. The model score for each human asterism is defined as
| (4) |
which is 1 if belongs to some system in . This approach makes it possible for nested asterisms (e.g. Orion’s belt and Orion) to both be captured by the model, even though a single setting of could capture at most one of these asterisms. Model scores are included in Table 1, and we will say that an asterism is captured by the model if it achieves a model score of 0.2 or higher. By this criterion 98% of the asterisms that recur across cultures and 80% of the entire data set are captured by the model.
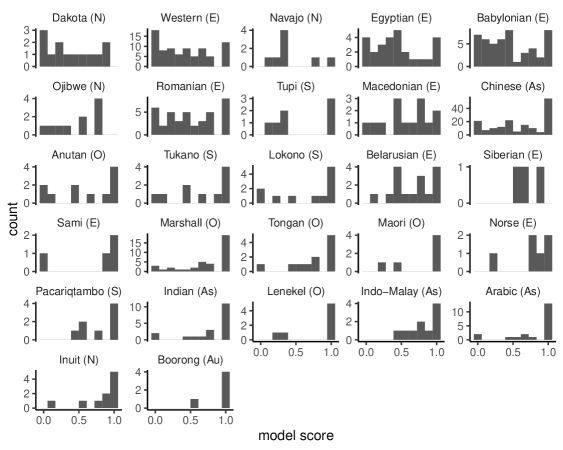
Distributions of model scores for each culture in our data set are plotted in Figure 3. The model accounts for some cultures well — for example, 13 of 20 Arabic asterisms, 19 of 38 Marshall Islands asterisms and 55 of 161 Chinese asterisms are captured perfectly by the model. The systems captured well by the model are drawn from a diverse set of geographical regions, suggesting that genealogical relationships between cultures are not enough to explain the recurring patterns captured by the model. Yet there are also many asterisms that are not captured by the model, and the Chinese and Western systems in particular both include many asterisms with a model score of 0. Both systems partition virtually all of the visible sky into asterisms, and achieving this kind of comprehensive coverage may require introducing asterisms (including Herschel’s “innumerable snakes”) that do not correspond to natural perceptual units.
Although some attested asterisms missed by the GC model will probably resist explanation by any model of perceptual grouping, others can perhaps be captured by extensions of the model. For example, the model tends not to group stars separated by a relatively large distance. As a result it misses the lower arm of the Northern Cross (Cygnus) and misses the Great Square of Pegasus entirely. These errors could perhaps be addressed by developing a multi-scale approach that forms groups at different levels of spatial resolution (froyenfm15; estradae06). Another possible extension is to incorporate additional grouping cues such as symmetry and parallelism, which are known to influence human judgments (feldman07; machilsenpw09) and have been explored in previous computational work (jacobs03; stahlw08).
In addition to scoring each system in our data relative to the GC model, we also examined how closely each system resembles other systems in our data set (see Figure S13). The system most different from all others is the Chinese system, which includes more than 300 asterisms, many of which are small and have no counterparts in records for other cultures. In future work, the model may prove useful for evaluating hypotheses about historical relationships between systems from different cultures (gibbon64; berezkin05). For example, the model could be used to ask whether Oceanic constellations are more similar to Eurasian constellations than would be expected based on perceptual grouping alone.
3 Discussion
For around a century, constellations have been informally used by Gestalt psychologists and their successors to illustrate basic principles of perceptual grouping (kohler29; metzger36). To our knowledge, however, our work is the first to systematically explore the extent to which perceptual grouping can account for constellations across cultures. We began by asking which asterisms appear frequently across cultures, and our data suggest that lesser-known asterisms such as Delphinus and the head of Aries should be included alongside more familiar asterisms such as the Pleaides and the Big Dipper. We then presented a computational analysis which suggests that perceptual grouping based on brightness and proximity is enough to account for many of the asterisms that recur across cultures. Previous discussions of convergence in asterisms across cultures typically focus on a handful of familiar examples including the Pleiades and the Big Dipper, but our work suggests that similarities in asterisms across cultures go deeper than previously recognized.
Our computational model aimed to explain how the night sky is clustered into groups of stars but did not address how the stars in each group are organized into figures. Our approach therefore complements the approach of dry09, who focused on the organization of star groups into figures but did not explain how these star groups might initially have been picked out of the full night sky. Both of these approaches use a Delaunay triangulation to capture proximity relationships between stars, and future work may be able to combine them into a single computational model that both picks out groups of stars and organizes them into figures.
We focused throughout on similarities in star groups across cultures, but there are also striking similarities in the names and stories associated with these groups (gibbon64; baity73; culver08). For example, in Greek traditions Orion is known as a hunter pursuing the seven sisters of the Pleiades, and versions of the same narrative are shared by multiple Aboriginal cultures of Australia (johnson11; leamanh19). Our work suggests that perceptual grouping helps to explain which patterns of stars are singled out for attention but understanding the meanings invested in these asterisms requires a deeper knowledge of history, cognition and culture.
4 Author Contributions
C.K. and D.W.H. compiled the data, and C.K. implemented the models and analyses and wrote the paper. All authors discussed the models and analyses and commented on the manuscript.