PHANGS-JWST First Results: The Dust Filament Network of NGC 628 and its Relation to Star Formation Activity
Abstract
PHANGS-JWST mid-infrared (MIR) imaging of nearby spiral galaxies has revealed ubiquitous filaments of dust emission in intricate detail. We present a pilot study to systematically map the dust filament network (DFN) at multiple scales between 25–400 pc in NGC 628. MIRI images at 7.7, 10, 11.3 and 21 of NGC 628 are used to generate maps of the filaments in emission, while PHANGS-HST B-band imaging yields maps of dust attenuation features. We quantify the correspondence between filaments traced by MIR thermal continuum / polycyclic aromatic hydrocarbon (PAH) emission and filaments detected via extinction / scattering of visible light; the fraction of MIR flux contained in the DFN; and the fraction of HII regions, young star clusters and associations within the DFN. We examine the dependence of these quantities with the physical scale at which the DFN is extracted. With our highest resolution DFN maps (25 pc filament width), we find that filaments in emission and attenuation are co-spatial in 40% of sight lines, often exhibiting detailed morphological agreement; that 30% of the MIR flux is associated with the DFN; and that 75–80% of HII regions and 60% of star clusters younger than 5 Myr are contained within the DFN. However, the DFN at this scale is anti-correlated with looser associations of stars identified using PHANGS-HST near-UV imaging. We discuss the impact of these findings for studies of star formation and the ISM, and the broad range of new investigations enabled with multi-scale maps of the DFN.
1 Introduction
Two overwhelming impressions from inspecting JWST images of nearby galaxies are the sheer number of resolved stars seen in the near-IR (NIR) andthe stunning degree of structured, filamentary mid-IR (MIR) emission originating from small dust grains and polycyclic aromatic hydrocarbons (PAHs) in the interstellar medium (ISM). JWST provides the spatial resolution necessary to cleanly decompose the observed MIR dust emission into filament features, discrete compact sources, and a diffuse component throughout the Local Volume (11 Mpc) and beyond, as could only previously be done in the Local Group (Hinz et al., 2004; Barmby et al., 2006; Verley et al., 2007, 2009). This is of astrophysical importance not only because dust plays a central role in enabling star formation, but also hides the youngest clusters and star-forming regions from view at short wavelengths. In HST optical multi-color imaging of star-forming galaxies, dust lanes stand out as highly structured attenuation features (La Vigne et al., 2006; Dong et al., 2016) occasionally punctuated by H ii regions and clusters that have pierced the veil of their dusty natal molecular cloud.
The observation of such abundant organized extragalactic structure in dust emission and attenuation is tantalising because studies of the cold gas and dust in the Milky Way have revealed filaments (Jackson et al., 2010) of length 100 pc that have even been dubbed the ‘bones’ of the Milky Way’s cold ISM (Goodman et al., 2014; Ragan et al., 2014; Zucker et al., 2015; Soler et al., 2020). Indeed, much recent work in the Milky Way points towards a view of the cold, dusty star-forming medium that is filamentary and multi-scale (Hacar et al., 2022; Pineda et al., 2022; Zucker et al., 2018), very different from the classical ‘spherical molecular cloud’. Filamentary structure even persists at sub-pc, cloud-substructure scales (e.g. André et al., 2010, 2014) though, in the Local Volume extragalactic context, we are limited to studying larger filaments (akin to those of Syed et al., 2022). The shift to a filament-centered paradigm implies that criteria for stability and fragmentation change, becoming a mass per unit length threshold rather than a more traditional Jeans mass argument. All this filamentary structure seeds star formation and determines the rate and efficiency of collapse, and defines the medium that the stellar feedback is subsequently driven into, thereby determining how feedback drives the baryon cycle within galaxies.
A revolution in our view of the dust structure in nearby galaxies is underway, having overcome the barrier of resolution with the combined capabilities of JWST and HST . This enhanced extragalactic perspective is a critical advance we can now quantify entire filament networks on scales ranging from the size of individual GMCs up to morphological features dominating entire galaxies and reveal their intimate connection with respect to star formation, feedback, and dynamical mechanisms. This new era of dusty ISM cartography will leverage representative galaxy samples to provide systematic answers to: how the prevalence and properties of these filamentary features may depend on galactic environment; whether they universally form the backbone of the cold ISM, through comparison to CO maps; and how the joint dust and molecular gas distribution is related to structures like spiral arms and bars, contrasted to high-resolution pc-scale UV+IR tracers of star formation activity from HST and JWST . Critically, the new observations can be directly compared to state-of-the-art galaxy simulations (e.g. Smith et al., 2014, 2020; Duarte-Cabral et al., 2015; Duarte-Cabral & Dobbs, 2017; Tress et al., 2020; Treß et al., 2021; Jeffreson et al., 2020).
JWST resolution and depth are sufficient to recover filamentary dust emission features, at GMC-scales, analogous to those of the Milky Way in galaxies out to the distance of the Virgo cluster. This letter focuses on NGC 628 (also known as Messier 74, ‘The Phantom Galaxy’) an archetypal face-on SA(s)c galaxy Buta et al. (2015). NGC 628 is nearby ( = 9.840.03 Mpc; Anand et al., 2021a, b), star-forming (SFR = 1.8 0.45 M⊙yr-1), massive ( = 2.2 M⊙) and viewed at low inclination ( 9∘ 12∘, Lang et al., 2020). NGC 628 is part of a broader sample of 19 “main sequence” star-forming galaxies for which systematic, uniform surveys with HST (Lee et al., 2022), ALMA (Leroy et al., 2021) VLT-MUSE (Emsellem et al., 2022) and now JWST (Lee et al., in prep.) have been carried out by the PHANGS (Physics at High Angular resolution in Nearby GalaxieS) collaboration.111https://sites.google.com/view/phangs/home
2 Data
2.1 PHANGS-JWST imaging
NGC 628 is one of the initial targets observed for the PHANGS-JWST Cycle 1 Treasury project (GO 2107, PI J. Lee). Our observations of NGC 628 target the central region ( 5 kpc) of the star-forming disk, to overlap areas where HST , ALMA, and MUSE data have been obtained.222Footprint maps of the HST , ALMA, and MUSE observations are available at https://archive.stsci.edu/hlsp/phangs-hst. Science-ready PHANGS-HST images are also available for download. The dataset includes imaging with NIRCam (F200W, F300M, F335M and F360M) and MIRI (F770W, F1000W, F1130W and F2100W). Photospheric emission from resolved stellar populations is major component in the four NIRCam bands (excepting F335M which primarily probes the 3.3µm PAH feature), whereas MIRI traces the ISM (both PAHs and hot, small dust grains). Resolution varies from 0.066 to 0.12″(NIRCam) and 0.25 to 0.67″(MIRI). For MIRI, this corresponds to 12–32 pc at the distance of NGC 628. A detailed description of the PHANGS-JWST observations and data reduction is presented by Lee et al. (in prep.). Here, we focus on MIRI imaging, deferring analysis of filamentary structure seen in the 3.3µm PAH feature to future work in anticipation of improved astrometric alignment among the PHANGS-JWST NIRCam and MIRI imaging. Of particular importance to the analysis in Sec. 4.2 is the sky background adopted for the MIRI data. We use background-corrected images which have been tied to the sky level measured in wide-field Spitzer and WISE archival imaging, as described in the Appendix of Leroy et al. (in prep.). The MIRI background levels are currently uncertain by 0.1 MJy sr-1.
2.2 PHANGS-HST imaging
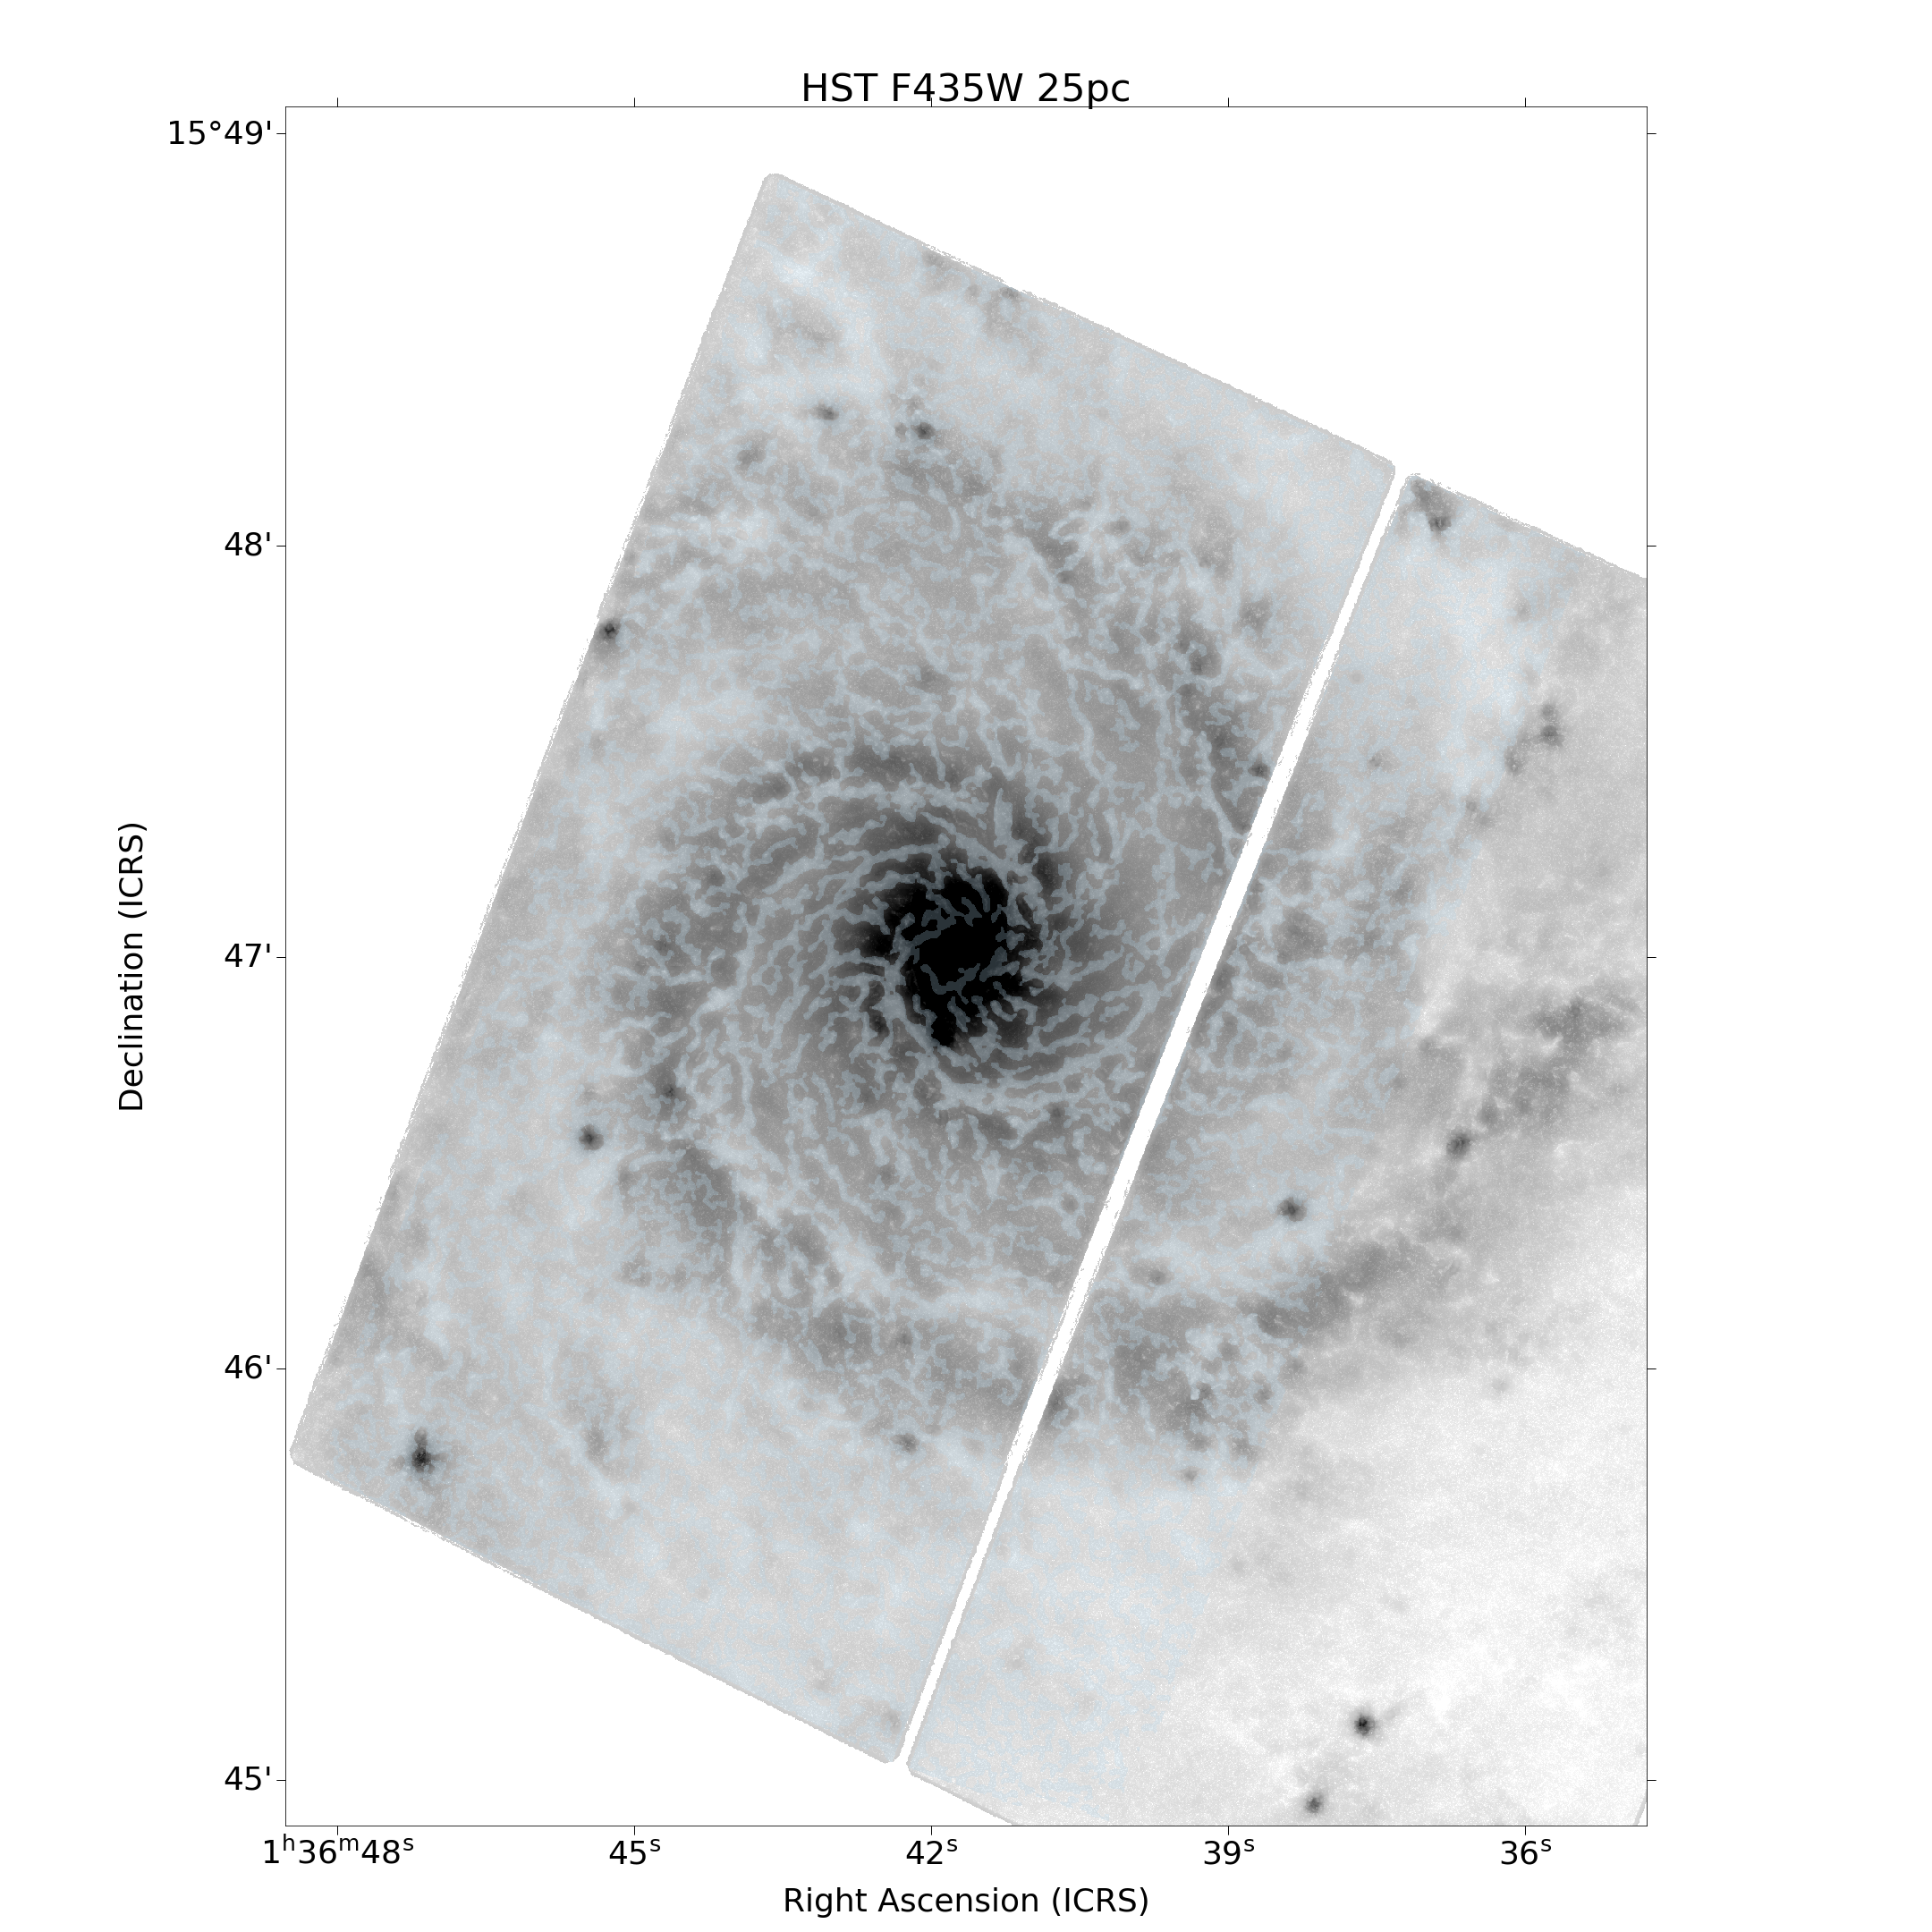
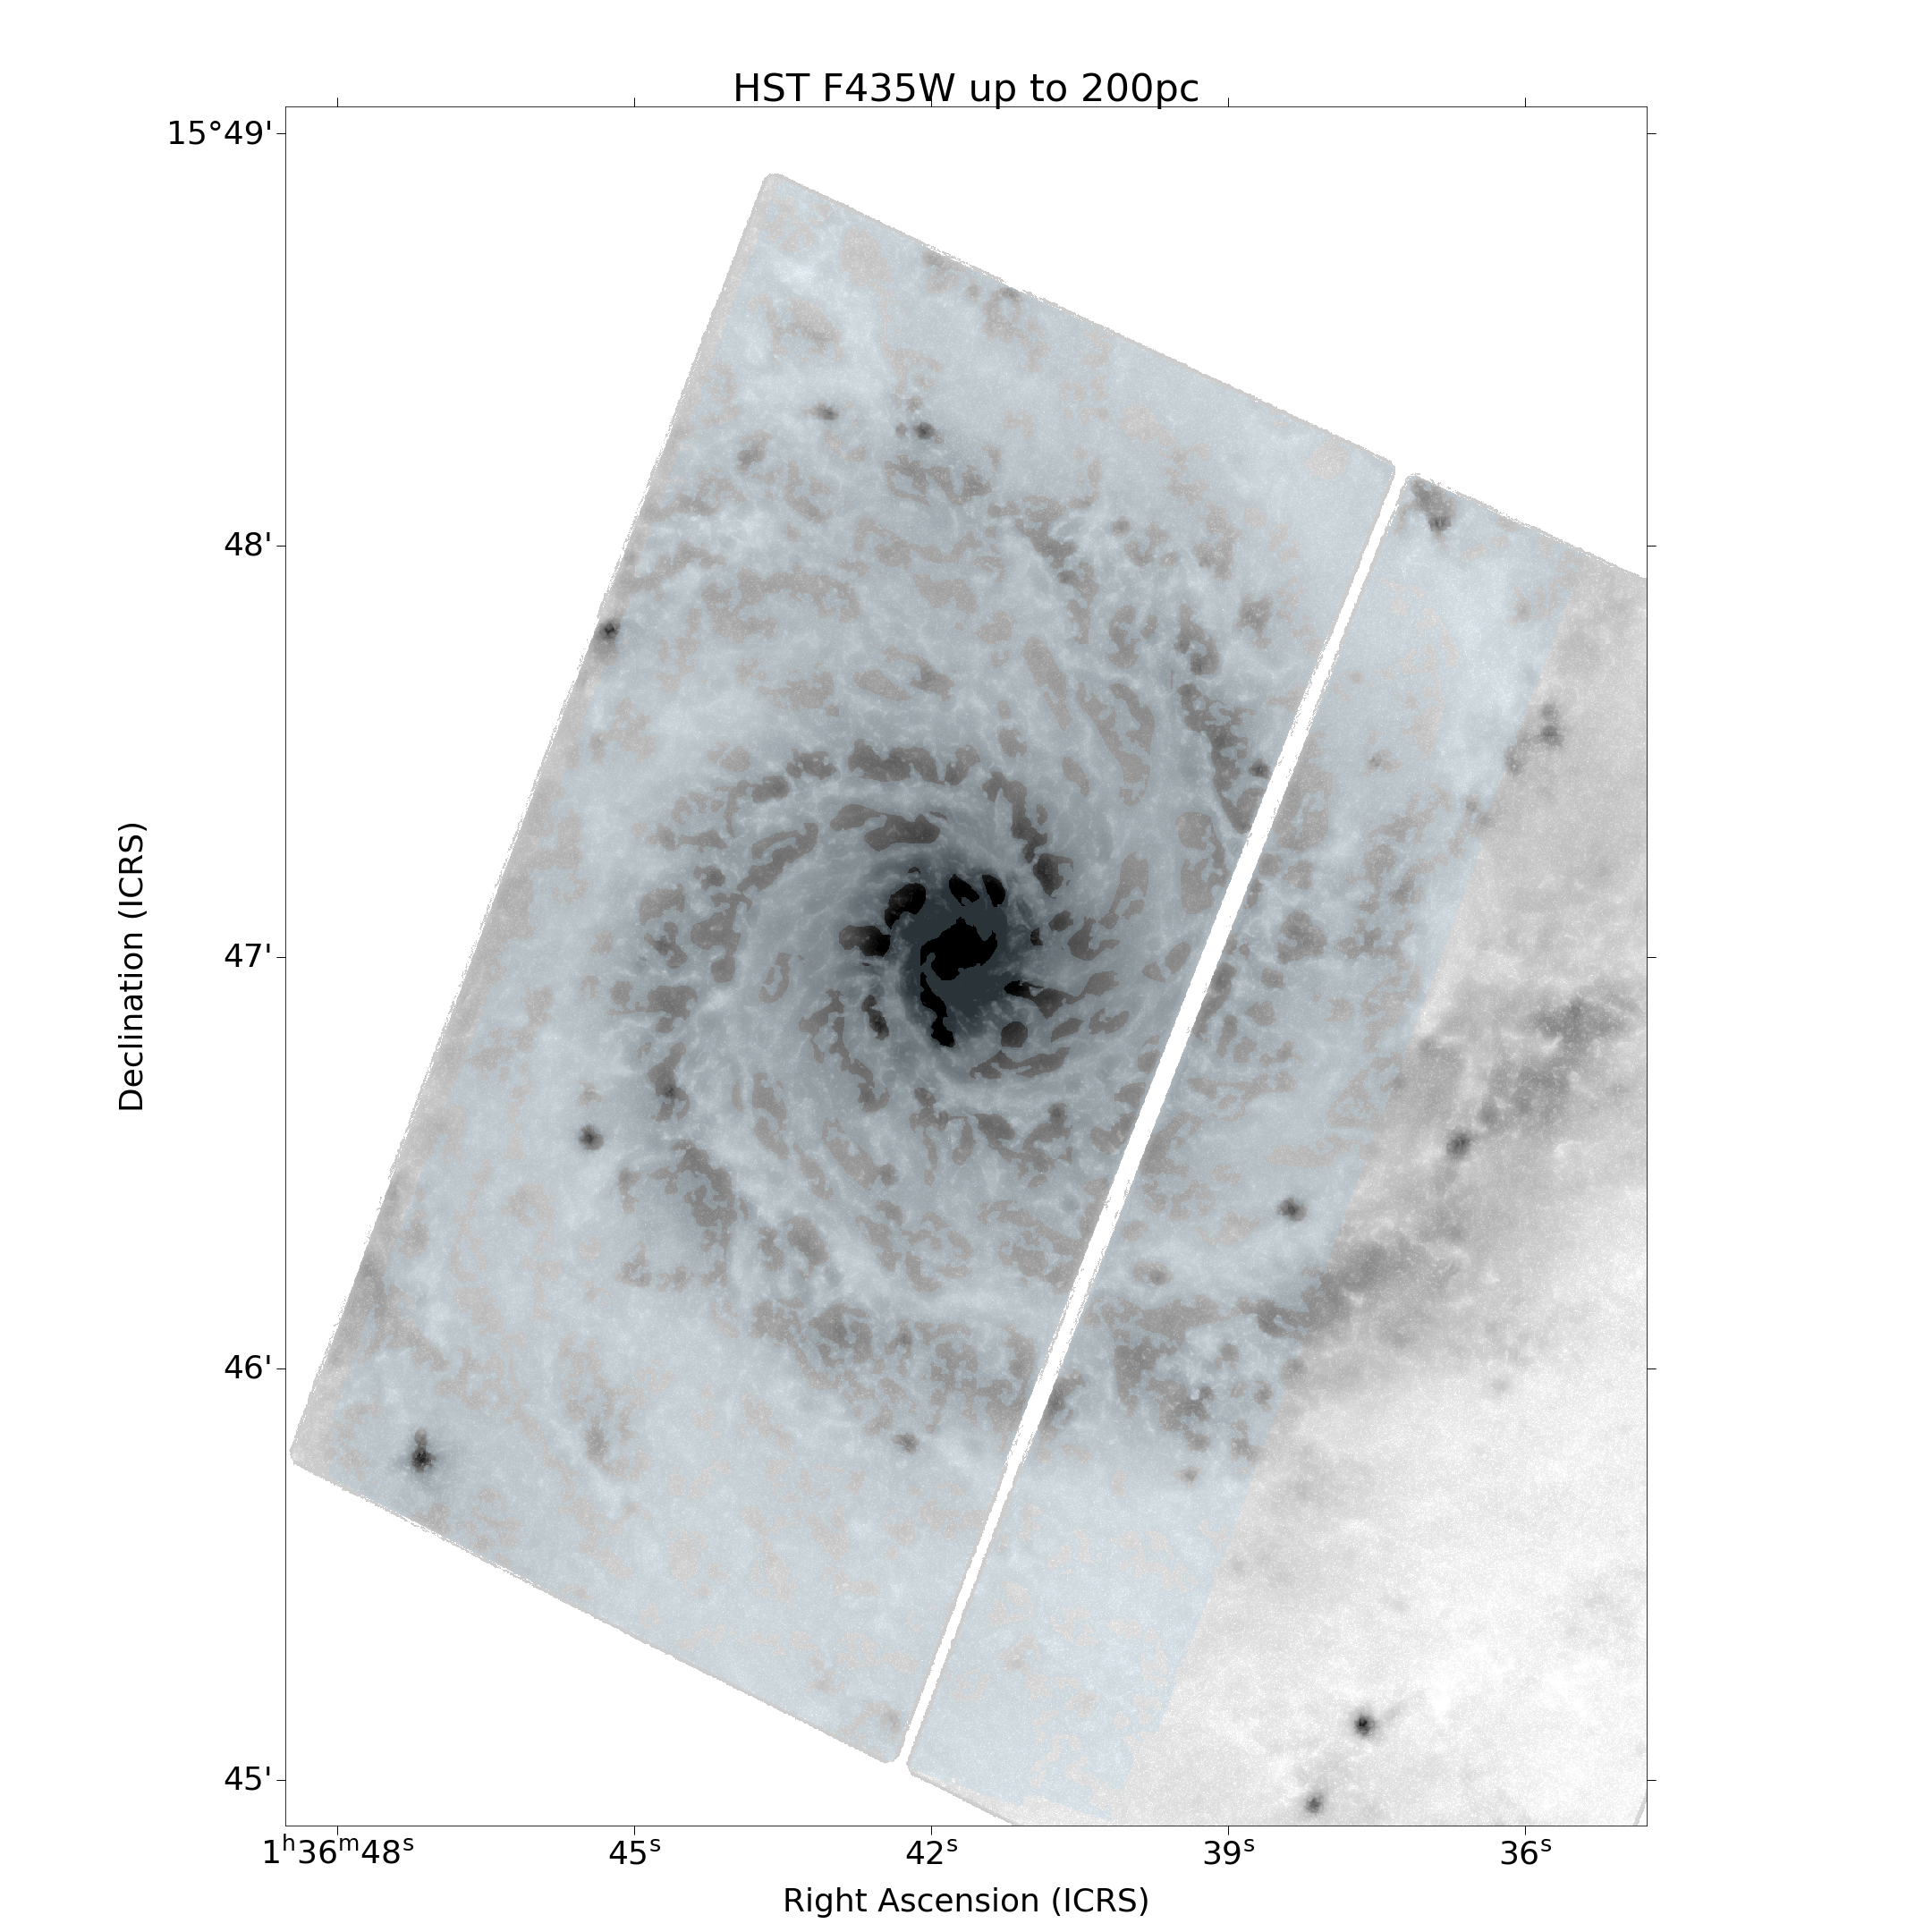
The HST NUV-U-B-V-I (F275W, F336W, F435W, F555W, F814W) observations of the central NGC 628 disk we use were obtained by LEGUS (GO 13364, Calzetti et al. 2015) using WFC3/UVIS for NUV and U, and by R. Chandar (GO 10402) using ACS/WFC for B, V and I. All data were reprocessed by PHANGS-HST. Full details are given in (Lee et al., 2022). The ACS/WFC B-band images we use to identify dust lanes in attenuation have resolution ( 0.09, 4.3 pc), approximately 2.5 finer than MIRI F770W.
2.3 MUSE H ii region catalog
We use the nebular catalog of H ii regions derived from the integral field unit (IFU) spectroscopy of the PHANGS-MUSE survey Emsellem et al. (2022). For NGC 628, the ”convolved, optimized” resolution in PHANGS-MUSE DR 2.2 is , corresponding to a spatial resolution of . Santoro et al. (2022) and Groves et al. (subm.) used PHANGS-MUSE data to create a catalog of H ii regions and provide fluxes corrected for Milky Way and internal extinction. Only star-forming regions classified using the BPT diagram (Baldwin et al., 1981) are retained in our analysis.
2.4 HST stellar association and cluster catalogs
PHANGS-HST resolved stellar photometry has been used to identify and characterize stellar associations as summarized in (Lee et al., 2022) and described in detail by Larson et al. (subm.). Stellar clusters in NGC 628 have been studied by Thilker et al. (2022). PHANGS-HST catalogs are publicly available333https://archive.stsci.edu/hlsp/phangs-cat. For both associations and clusters, fluxes for the five available HST bands were measured (using upper-limits in non-detected photometric bands) and then age, mass and reddening were estimated444Degeneracy between age and reddening is apparent for a subset of objects, and could be more relevant in our dust filaments. via fitting of observed SEDs (Turner et al., 2021) to solar metallicity stellar population models using cigale (Boquien et al., 2019).
We use the PHANGS-HST associations catalog based on local over-densities of NUV point-like detections at a scale of 32 pc for our analysis. The stellar associations have ages ranging up to 102 Myr. We use a subset selected to have age less than five Myr in order to limit the population to the most recent star formation activity. Clusters for our analysis were also selected with the same upper limit on age.
3 Dust filament analysis
3.1 Filament extraction
We identify dust filaments using FilFinder (Koch & Rosolowsky, 2015). This code applies an adaptive thresholding algorithm and graph-based medial skeleton analysis to isolate and then characterize filaments. Thresholding is conducted over local neighborhoods, allowing for the extraction of structure over a large dynamic range both in intensity and spatial scale (the latter when the code is run multiple times with different parameter choices). The potential effect of bright sources interspersed in the web of filaments is mitigated by an arctan intensity transform before thresholding. We use a slightly modified version of FilFinder in which the arctan transformed image is convolved to the filament extraction scale before each run. In the current analysis we only utilize the filament masks produced by the code, leaving FilFinder’s skeleton analysis capabilities for future work.
We apply FilFinder independently to the background-corrected image in each MIRI band and to a pre-processed version of the B-band HST image (in which attenuation features are most evident compared to NUV, U, V, and I).
For pre-processing the HST image, multi-scale median filtering is used to suppress peak-like features over a range in scale, while retaining small scale dips (concave areas). Our specific filtering method follows from Hoversten et al. (2011). At each pixel the output value is assigned to be that location’s minimum in a stack of circular median filtered images. Filter kernel diameters are taken from a ladder of physical scales (starting at the resolution limit and proceeding up to 32 pc). The result is that confusion by bright stars and stellar clusters is greatly reduced, emphasizing the dust lane structures. Fig. 1 (left) and Fig. 6 (left) show the pre-processed image. FilFinder nominally operates by finding positive filamentary features above the background. before passing the pre-processed B-band image to FilFinder, we invert the sense of the intensity (subtracting the image from a constant value equal to the maximum in the field of view)
For both attenuation and emission, we use FilFinder to identify potential filaments with narrow dimension (width) starting at 25 pc then stepping by factors of (0.15 dex) up to 400 pc (25, 35, 50, 70, 100, 140, 200, 280, 400 pc). The minimum scale of 25 pc corresponds to approximately twice the PSF FWHM of MIRI F770W. For F2100W analysis, we begin at the 35 pc scale due to the larger F2100W PSF. FilFinder parameters are set as follows: size_thresh = 6, adapt_thresh = 2, glob_thresh = 2 above sky level, smooth_size = 0.5, fill_hole_size = 0.5, where is the extraction scale (in pixels) and is the standard deviation noise level expected in the arctan transformed, convolved images.
In addition to the filament masks generated for extraction at specific scales, we also produce masks representing the union of filaments detected cumulatively at different scales. For these cumulative masks, we sum the individual masks (for scales less than or equal to the current scale) and then flatten the result, such that it has a value of one anywhere a constituent scale contributes filament coverage. The cumulative summed mask before flattening is also retained, as it highlights the multi-scale nature of the filament network. Appendix A presents individual scale and cumulative multi-scale masks for F770W, F2100W, and HST B-band as a Figure Set.
The wide range of scales initially allowed for filament extraction is exploratory. In the second half of Sec. 4.1), we argue that all emission and attenuation filament masks for scales pc not be used, although we do include them in plots allowing for the reader to make their own .
3.2 DFN characterization
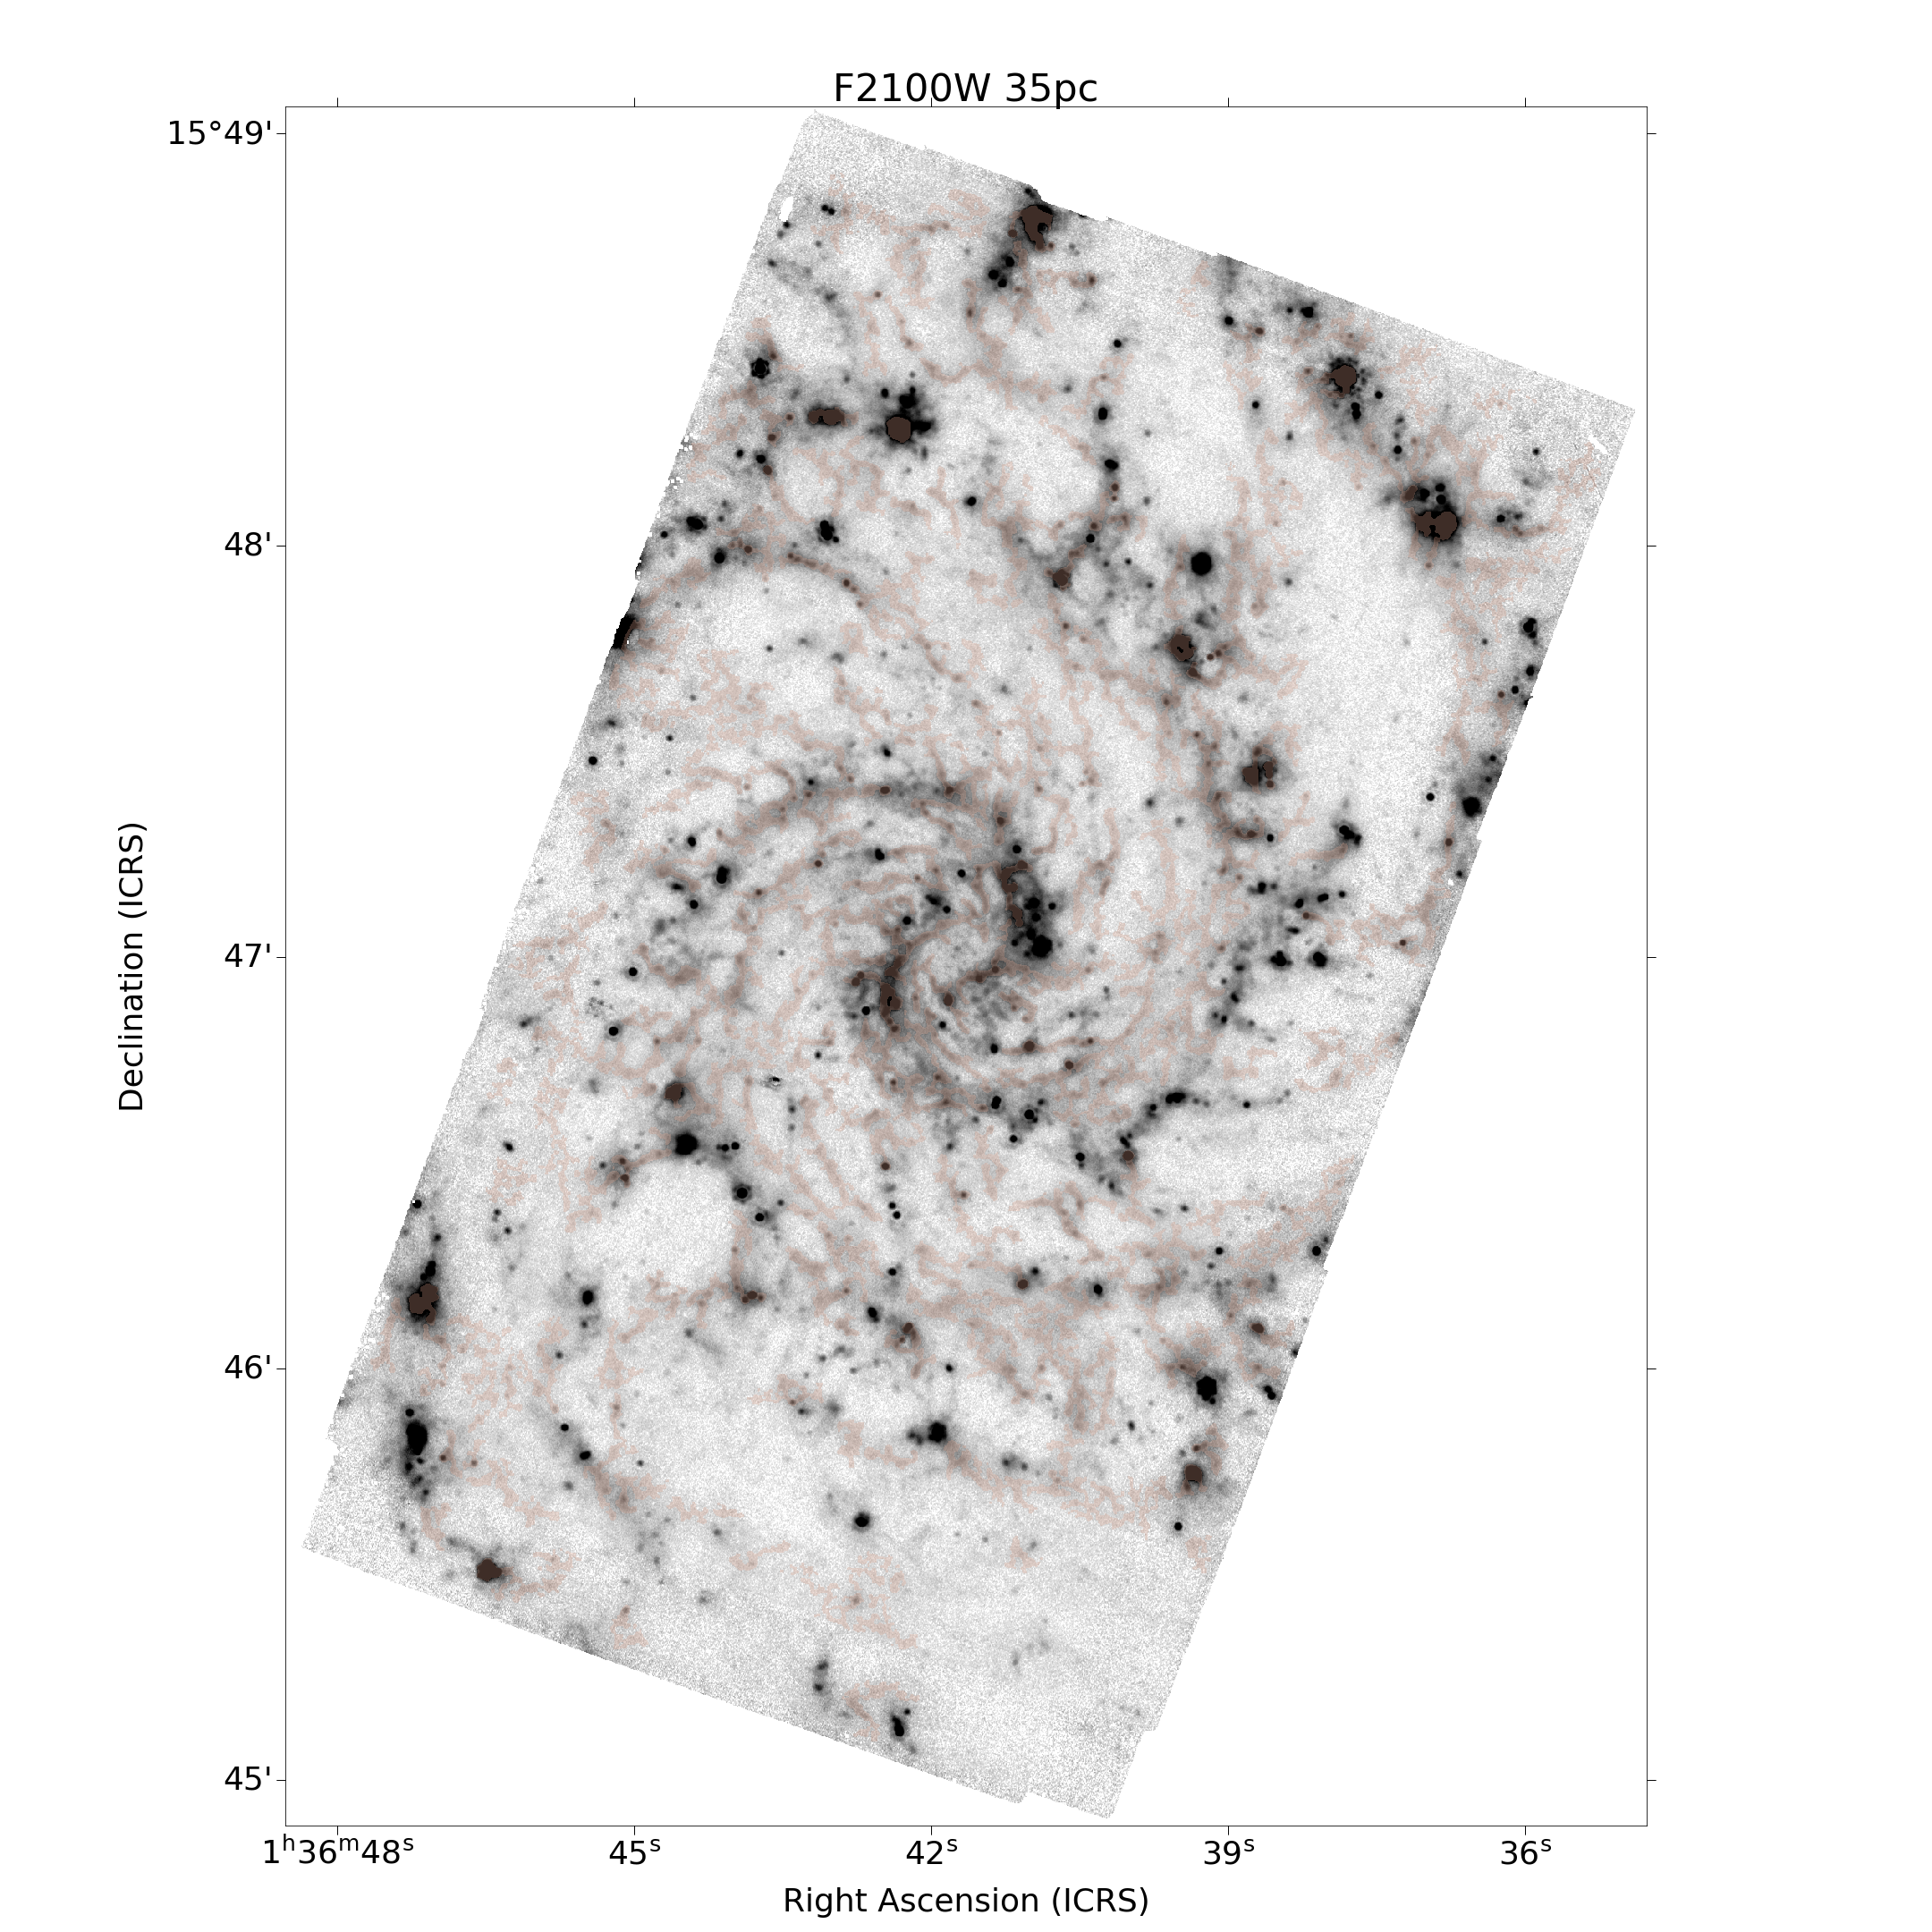
For Sec. 4.1, we measure filament mask overlap categorizing each pixel as belonging to one of four classes: (1) attenuation filament only, (2) emission filament only, (3) both attenuation and emission filaments, or (4) no filamentary features detected. Note that the sight line fractions we report in Sec. 4.1 for classes (1)-(3) are normalized to the total count of pixels with any detected filamentary feature, rather than the total count of pixels in the image. It is beyond the scope of the current study to quantify the dependence of pixel classes on the depth of the imaging – however, given the pervasive character of the detected filament network, we suggest that at least the F770W, F1000W, and F1130W observations are sensitive enough to make this a moot point. Our F2100W data is about 2 less sensitive in absolute terms of limiting surface brightness, [MJy sr-1], and also suffers from a similar loss in resolution compared to F770W. These factors likely contribute to loss of some smaller scale filamentary structure in the F2100W imaging.
Sec. 4.2 (flux fractions) requires local estimation of the diffuse emission to obtain background-subtracted filament flux. the photutils (Bradley et al., 2022) background2D code, supplying filament masks to indicate which pixels the procedure should ignore. A mesh of bins (each having size two-thirds the filament extraction scale) is defined, and the mode of unmasked pixels is determined in each bin. These mesh modes are median filtered with a 33 boxcar (ignoring bins with too many pixels masked as within a filament) and the resulting values are interpolated across the image grid. from the input image and non-filament pixels are set to zero. Integrating this result gives the background subtracted flux of the filament structures, which is then divided by the total flux in the MIRI footprint to obtain flux fractions.
4 Results
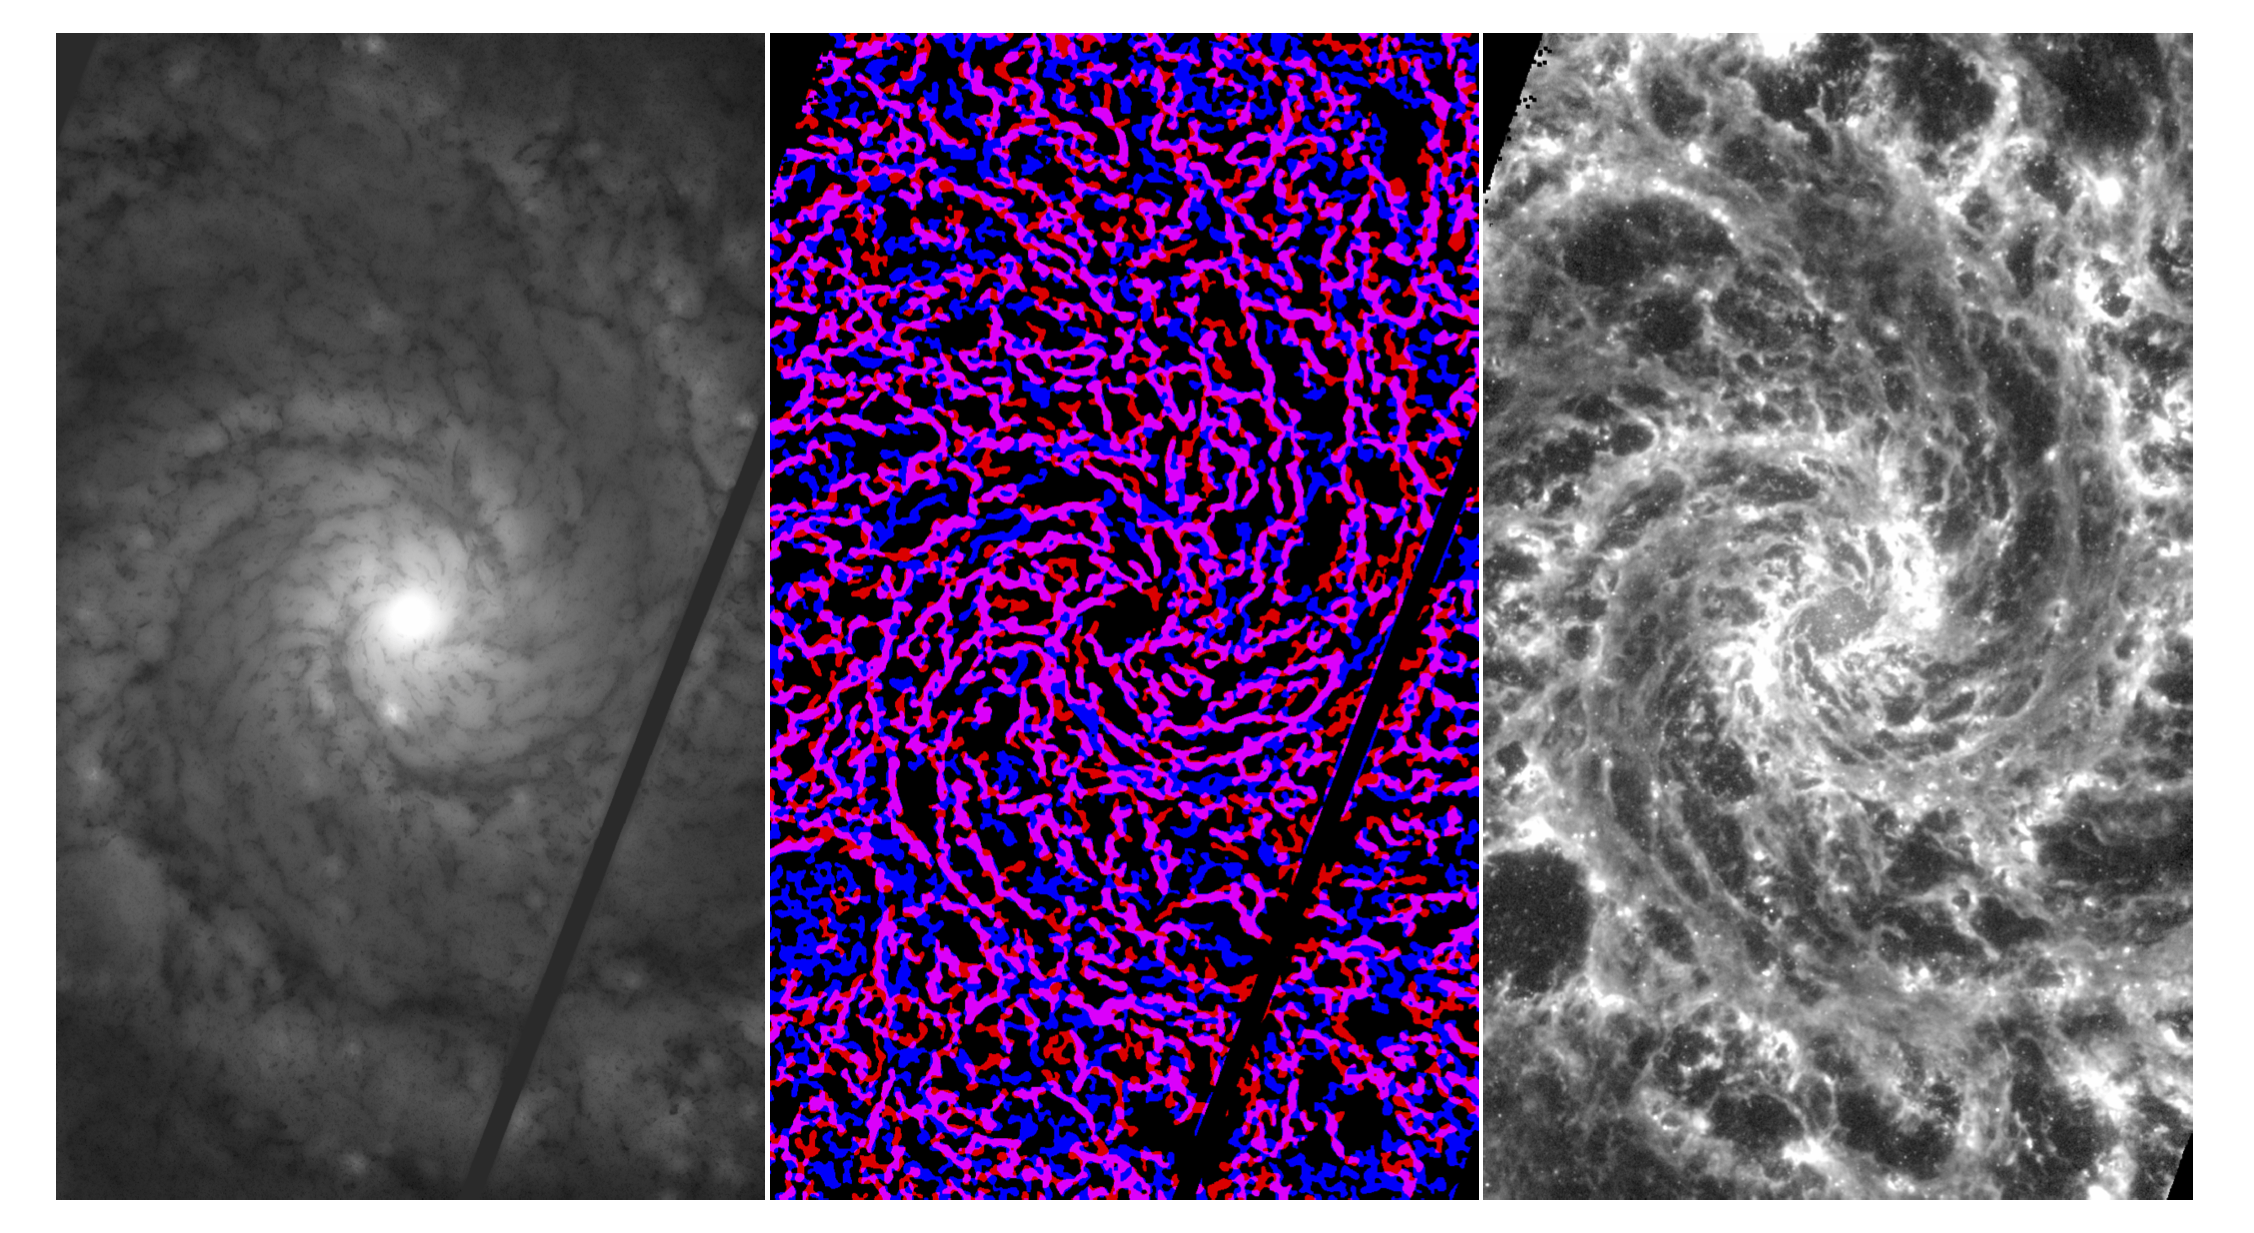
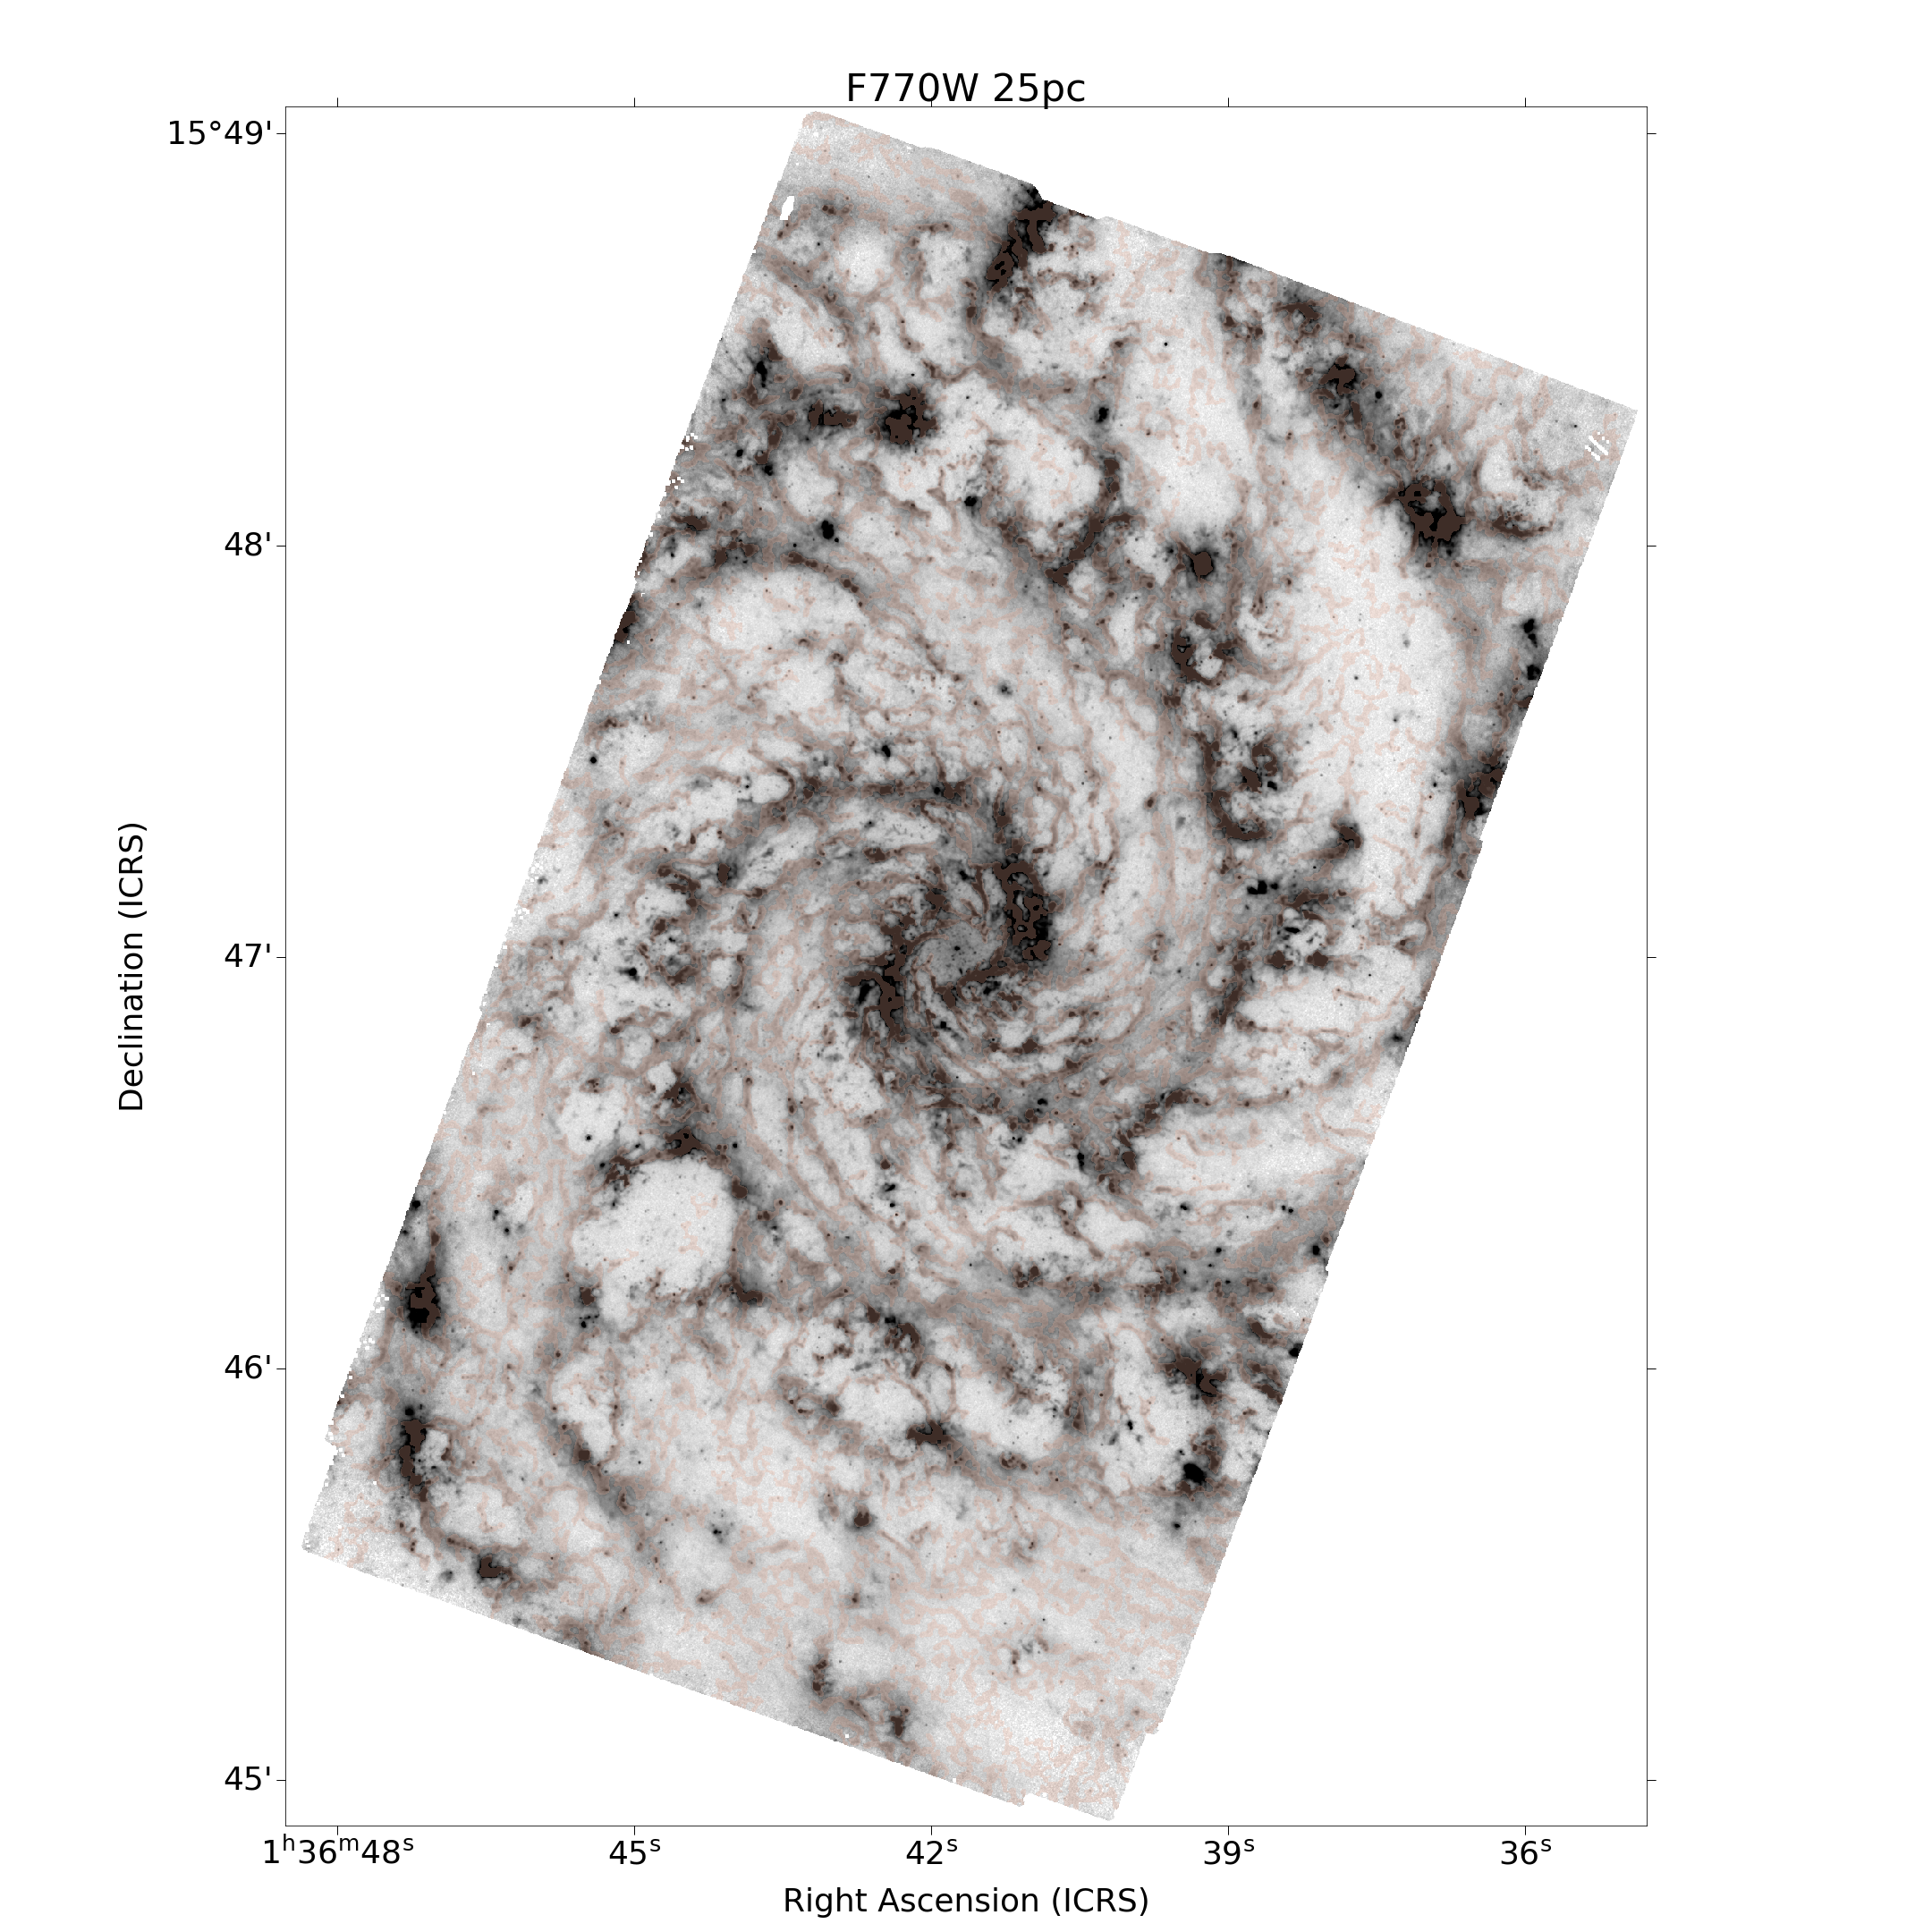
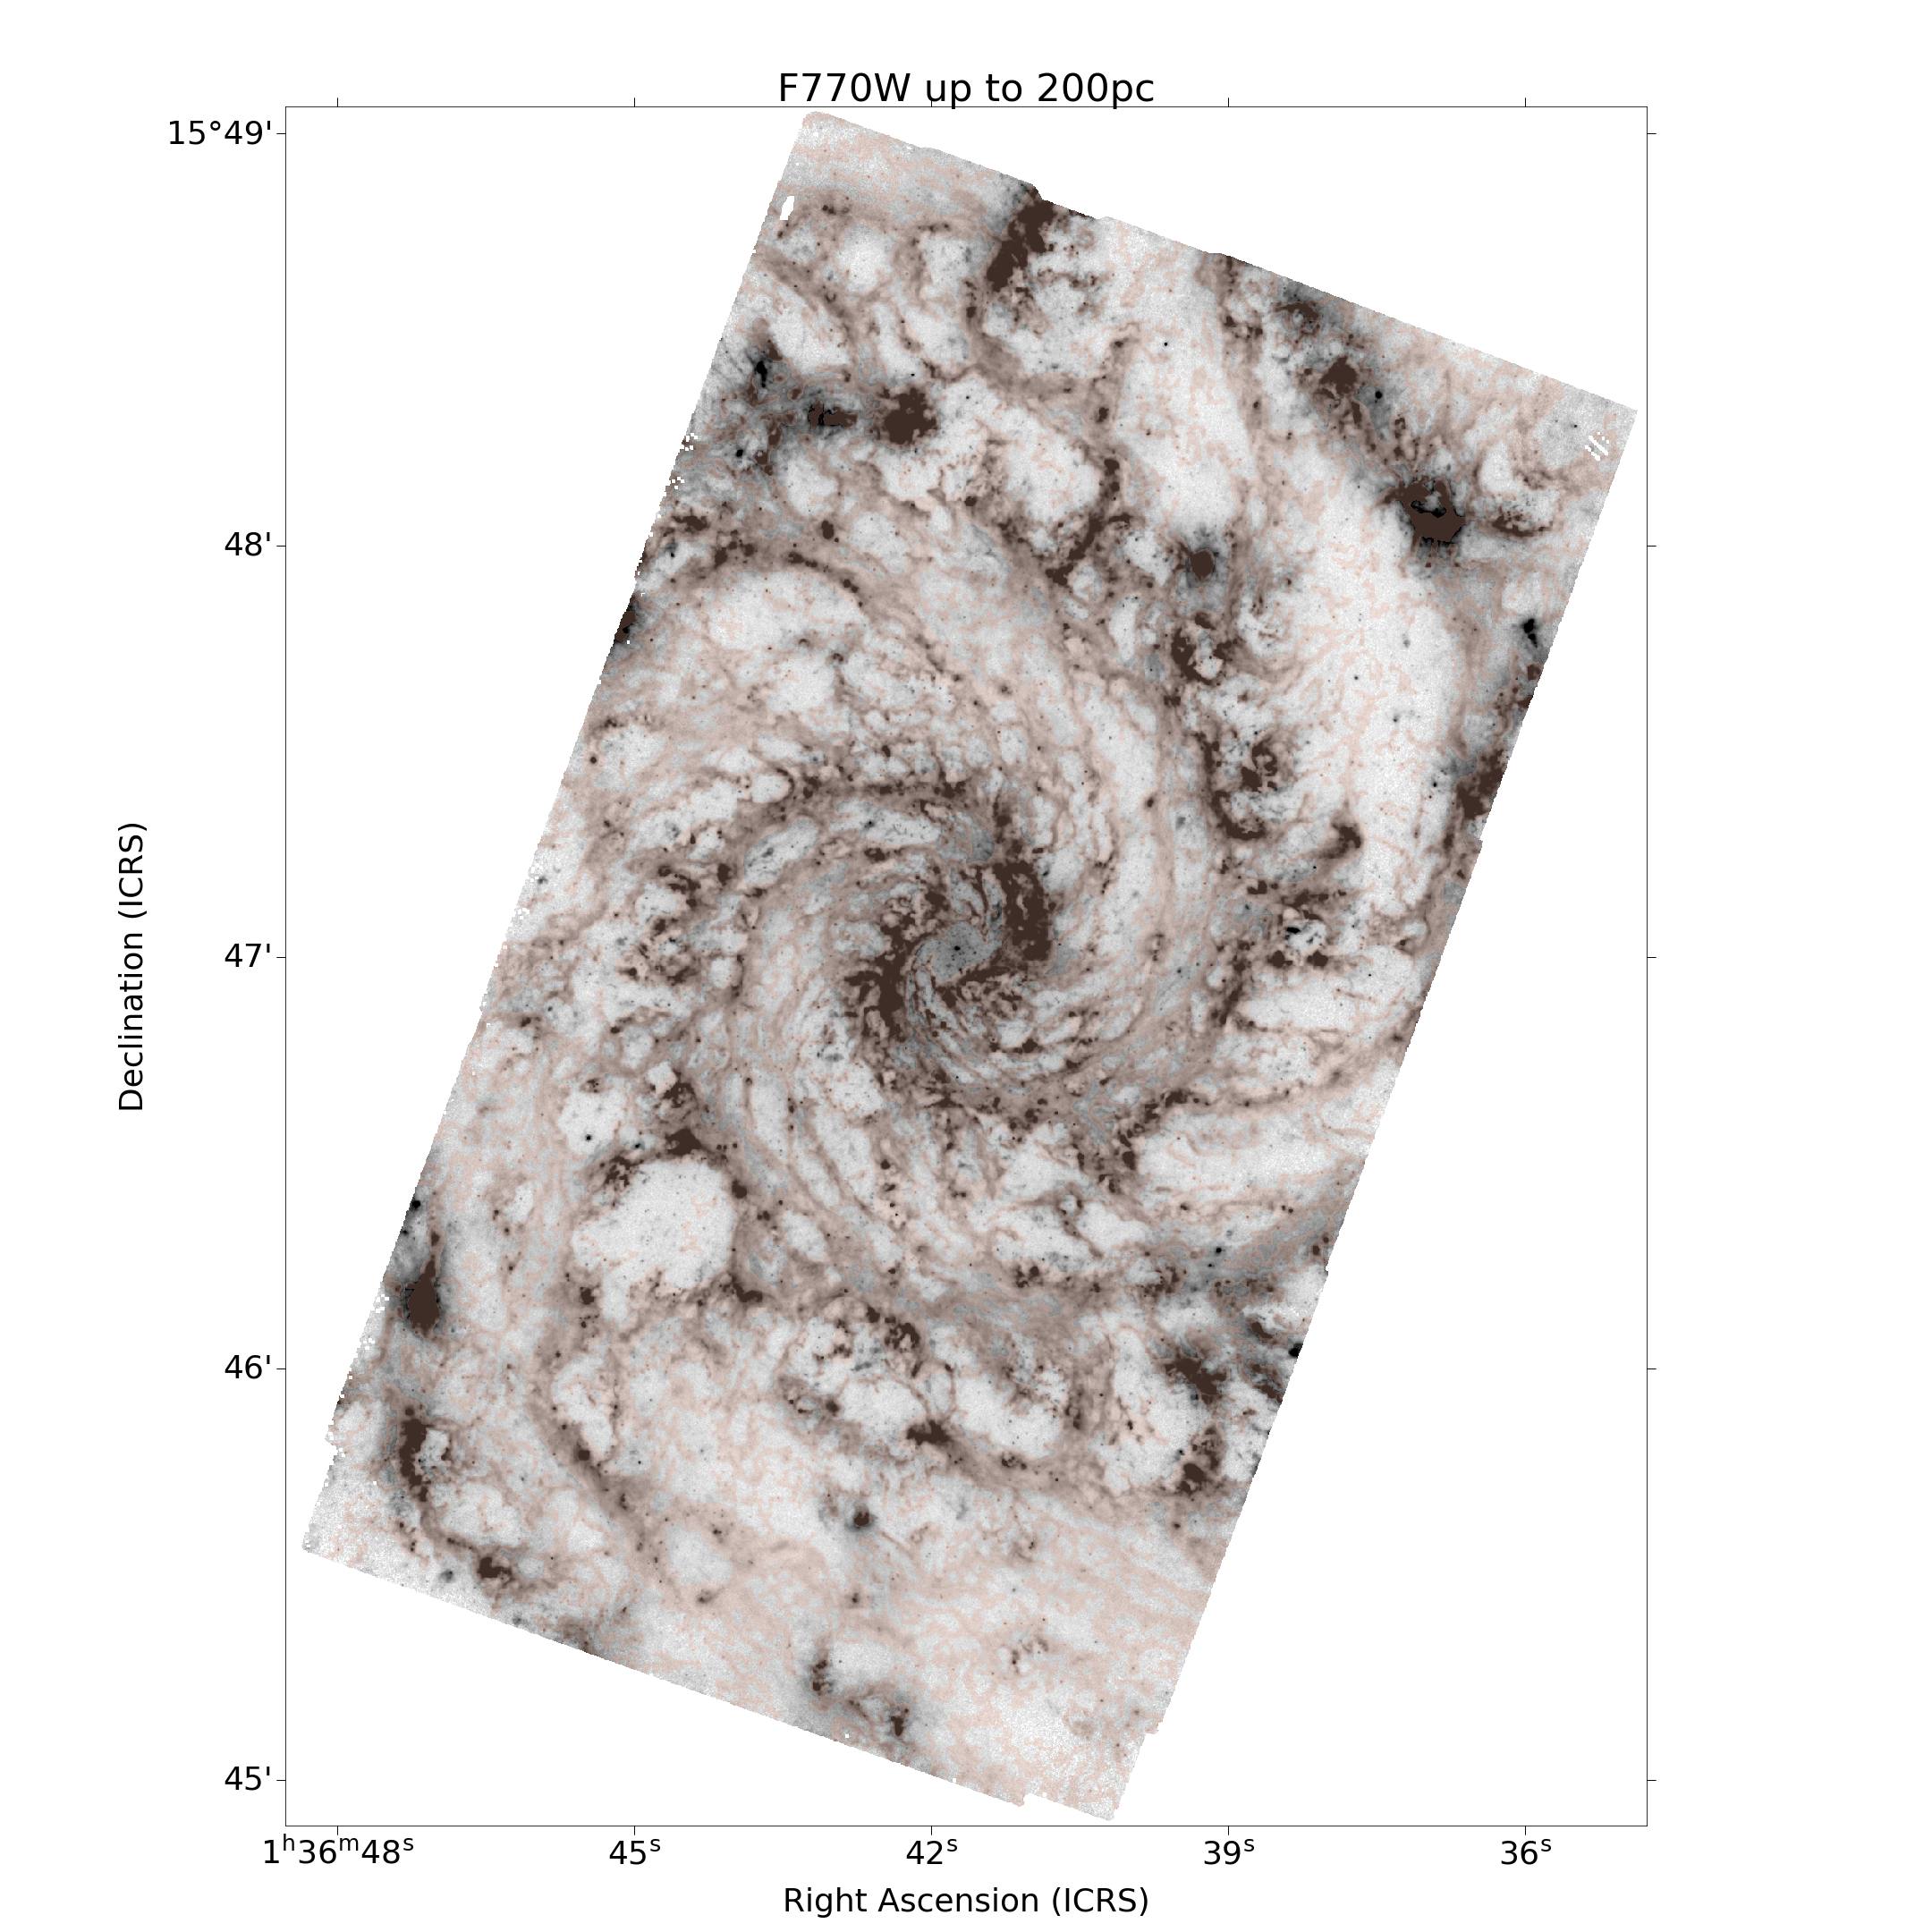
Figure 1 illustrates the dust lanes seen as deficits of visible light (left) and dust emission filaments detected in MIR emission (right). Plotted for a single extraction scale (25 pc), the central panel emphasizes the detailed coincidence between these two tracers of dust (blue = attenuation, red = emission) in the interstellar medium, with magenta indicating overlap. It is clear that the dust filament network (DFN) occupies a large fraction of sight lines and contributes a significant fraction of the MIR luminosity . Knots of emission from star-forming regions are generally distributed throughout the filaments. In this section, we quantify each of these statements.
Here we show results only for F770W and F2100W, as the filament masks and measured quantities based on F1000W and F1130W are consistent with F770W. Any notable differences are discussed.
4.1 Contrasting views of the dust filament network
We start by highlighting the consistency between filamentary attenuation (dust lane) features and web-like MIR dust emission to illustrate the potential of using HST -detected features as a high resolution proxy for the dense dusty ISM morphology (and perhaps even molecular gas555The association between the DFN structures and 12CO(2-1)-traced molecular gas will be investigated in a future study.).
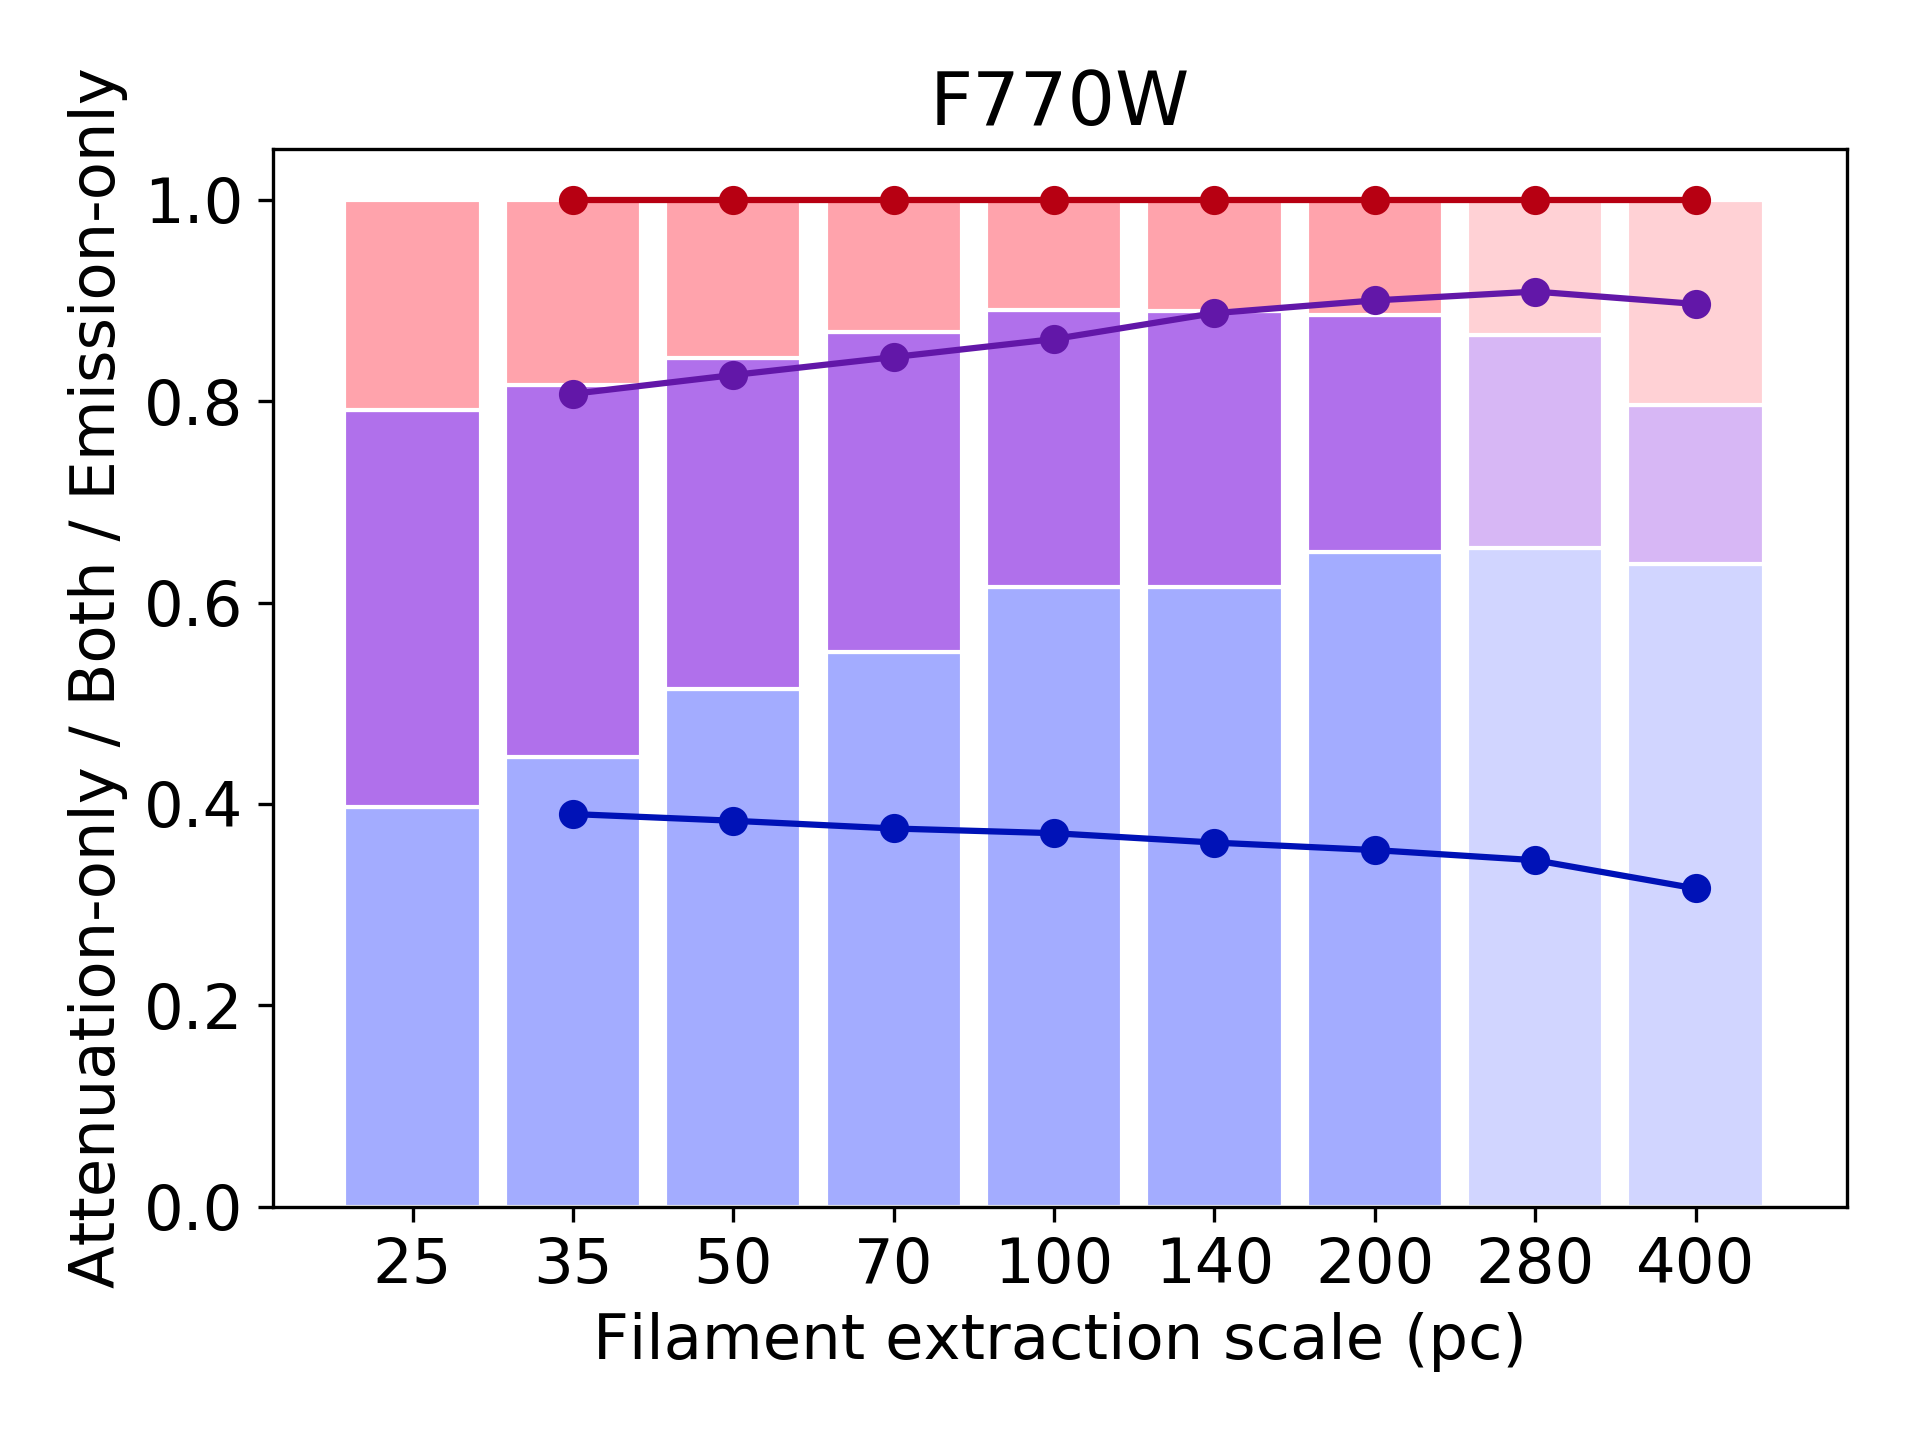
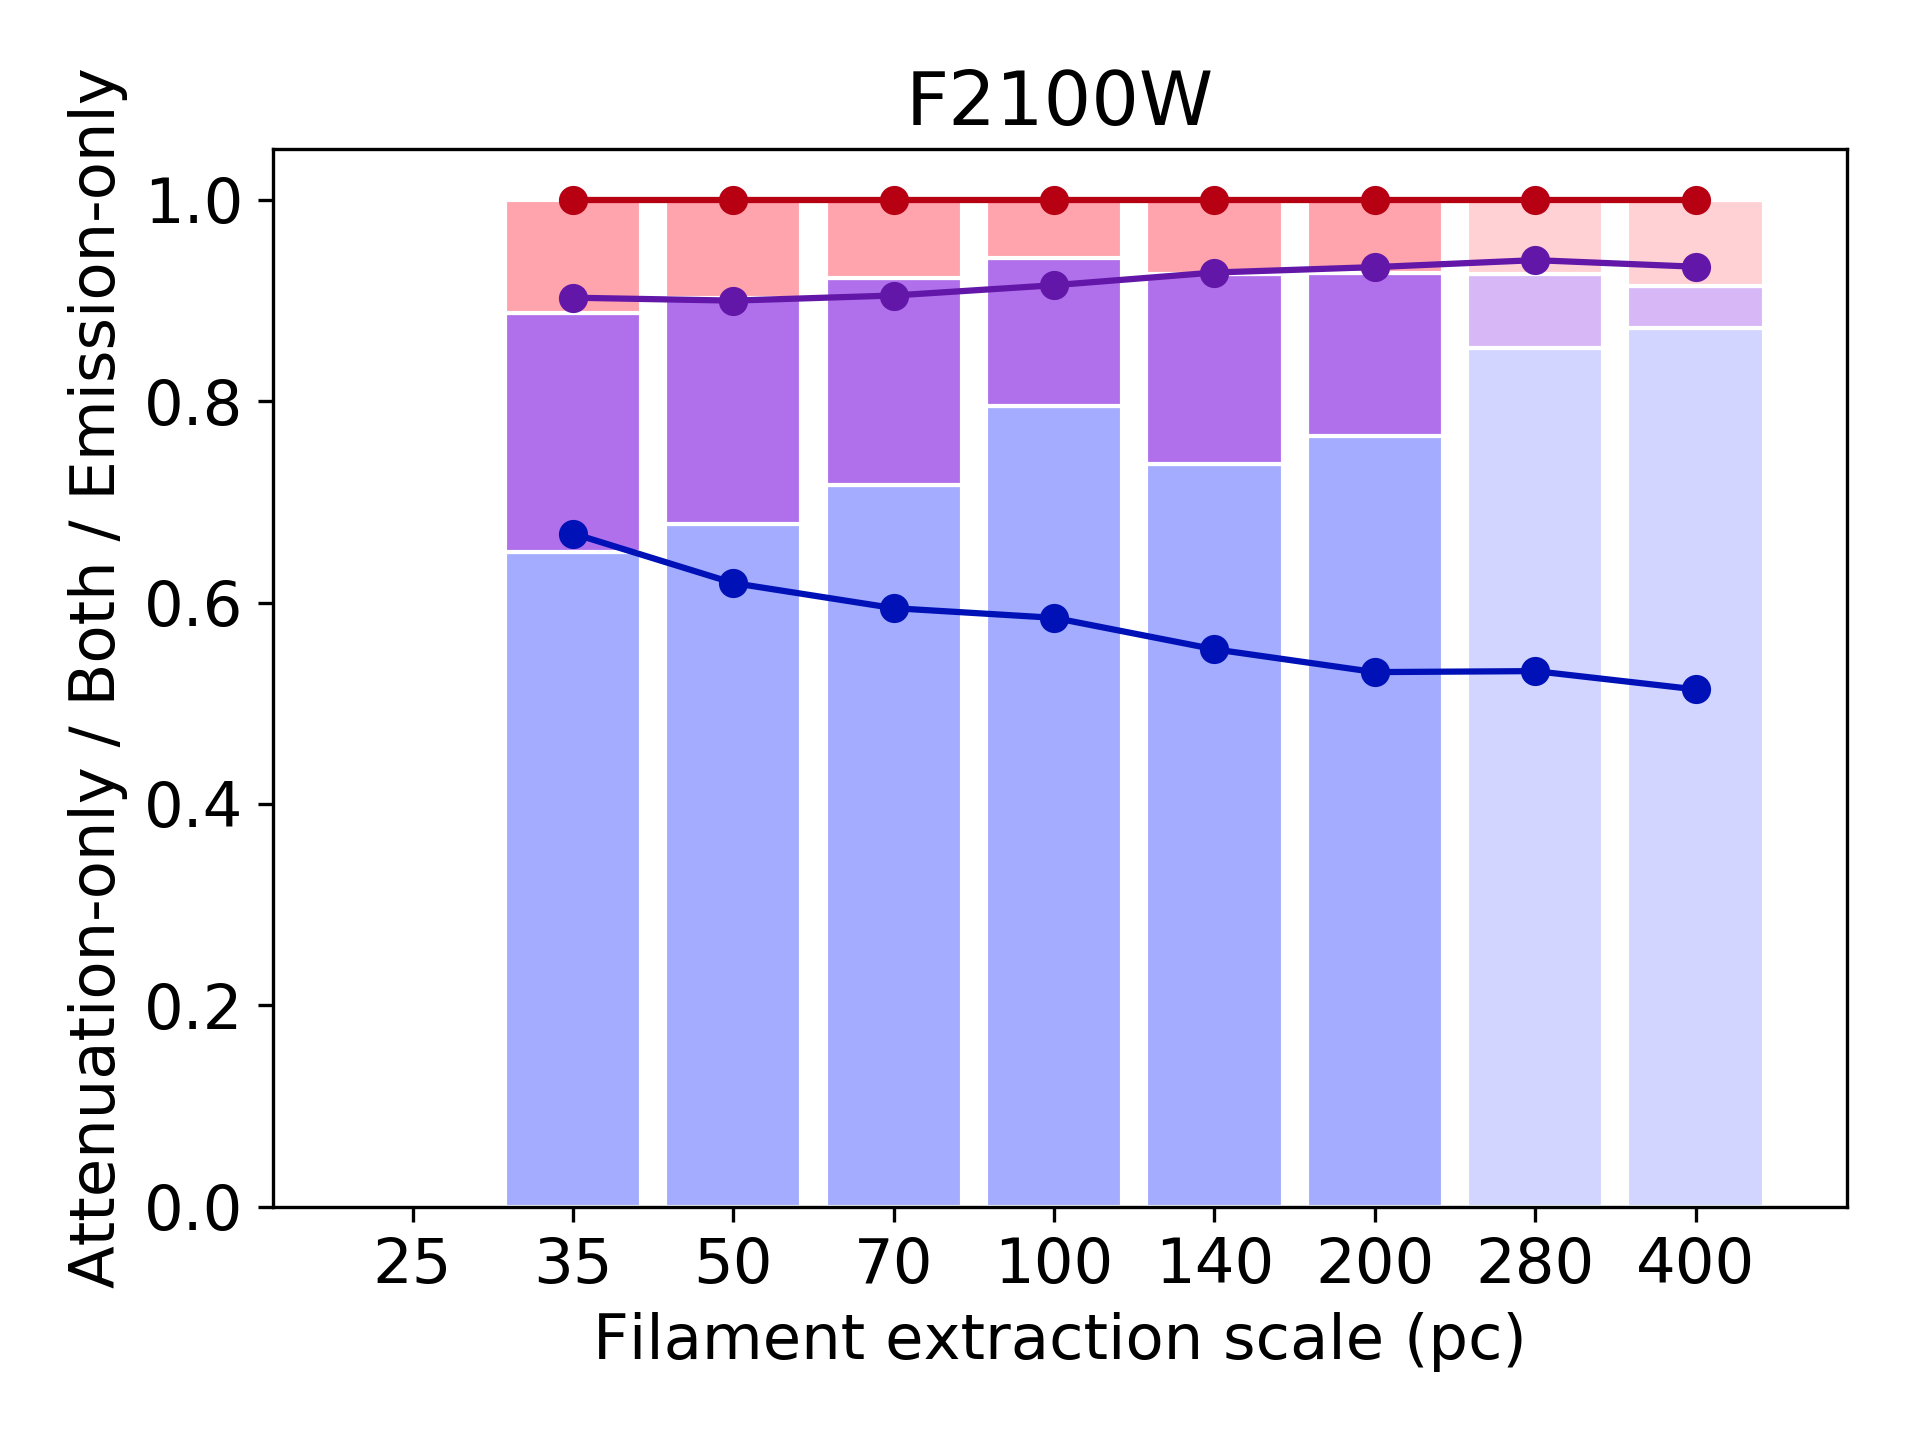
Fig. 2 shows the results of filament overlap analysis. For the PAH-dominated bands (F770W, F1130W) and 10 thermal emission traced by F1000W, in the top panel of Fig. 2, we find that the percentage of sight lines in common between visible attenuation and MIR emission filaments is nearly 40%, at 25 pc and declines smoothly with increasing scale (filament width). This decline is due to more area becoming traced by attenuation only for larger individual filament extraction scales. The percentage of emission-only filament sight lines declines a small amount from 25 pc to 200 pc. Overlap statistics generated on the basis of cumulative multi-scale masks show a different picture, in which the percentage of attenuation plus emission sight lines grows with scale from just over 40% at 35 pc to 55% up to 200 pc. This is a consequence of different extraction scale masks picking up varied portions of the overall web-like DFN. We return to this point further in the current subsection (see Fig. 4 and Fig. 5).
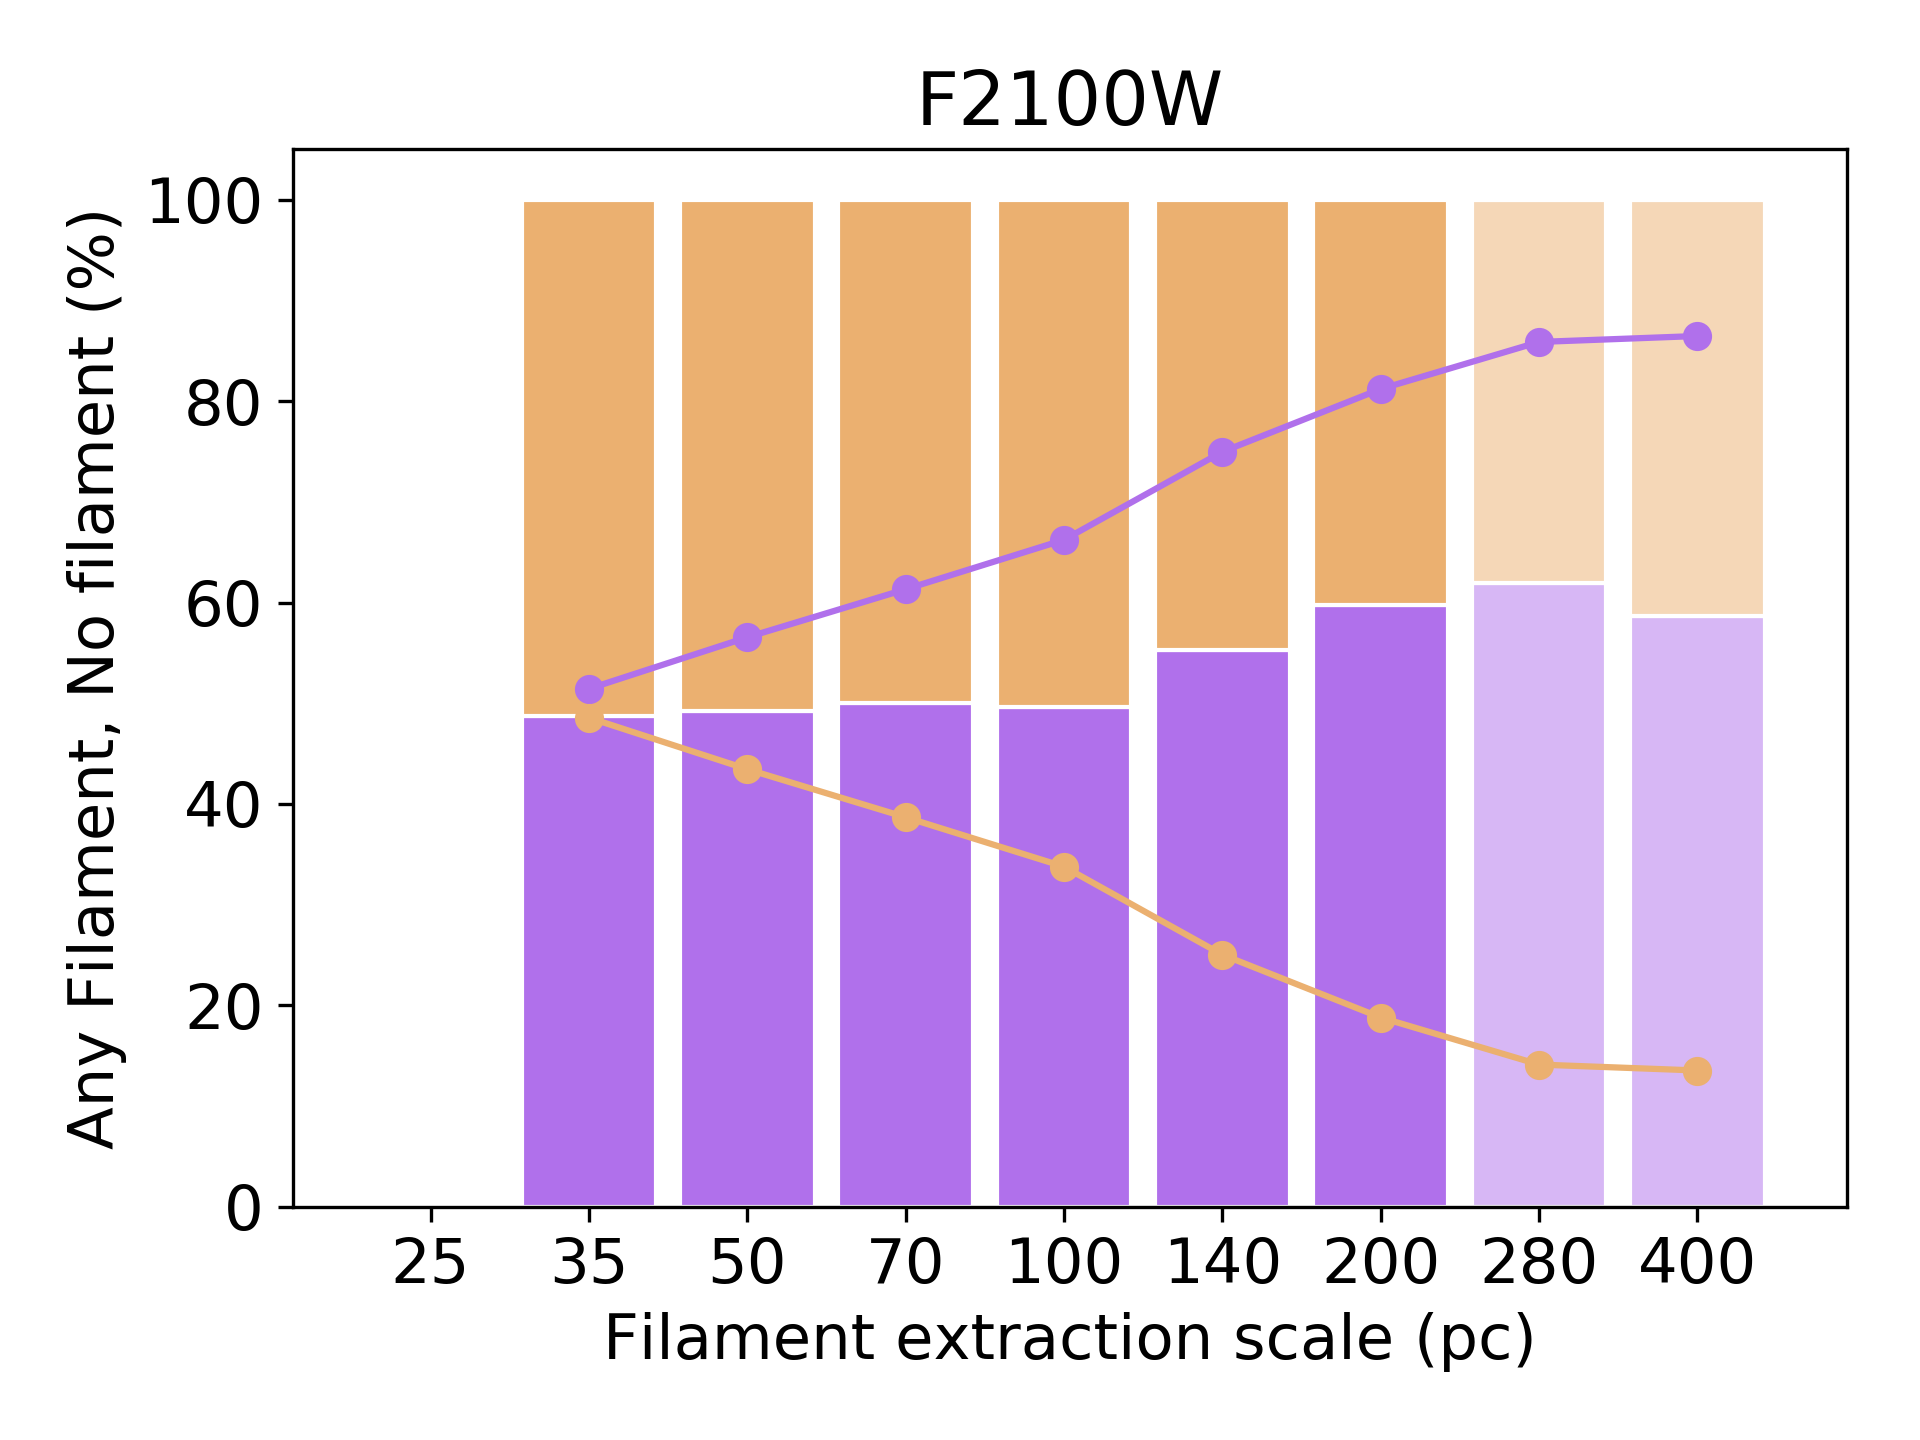
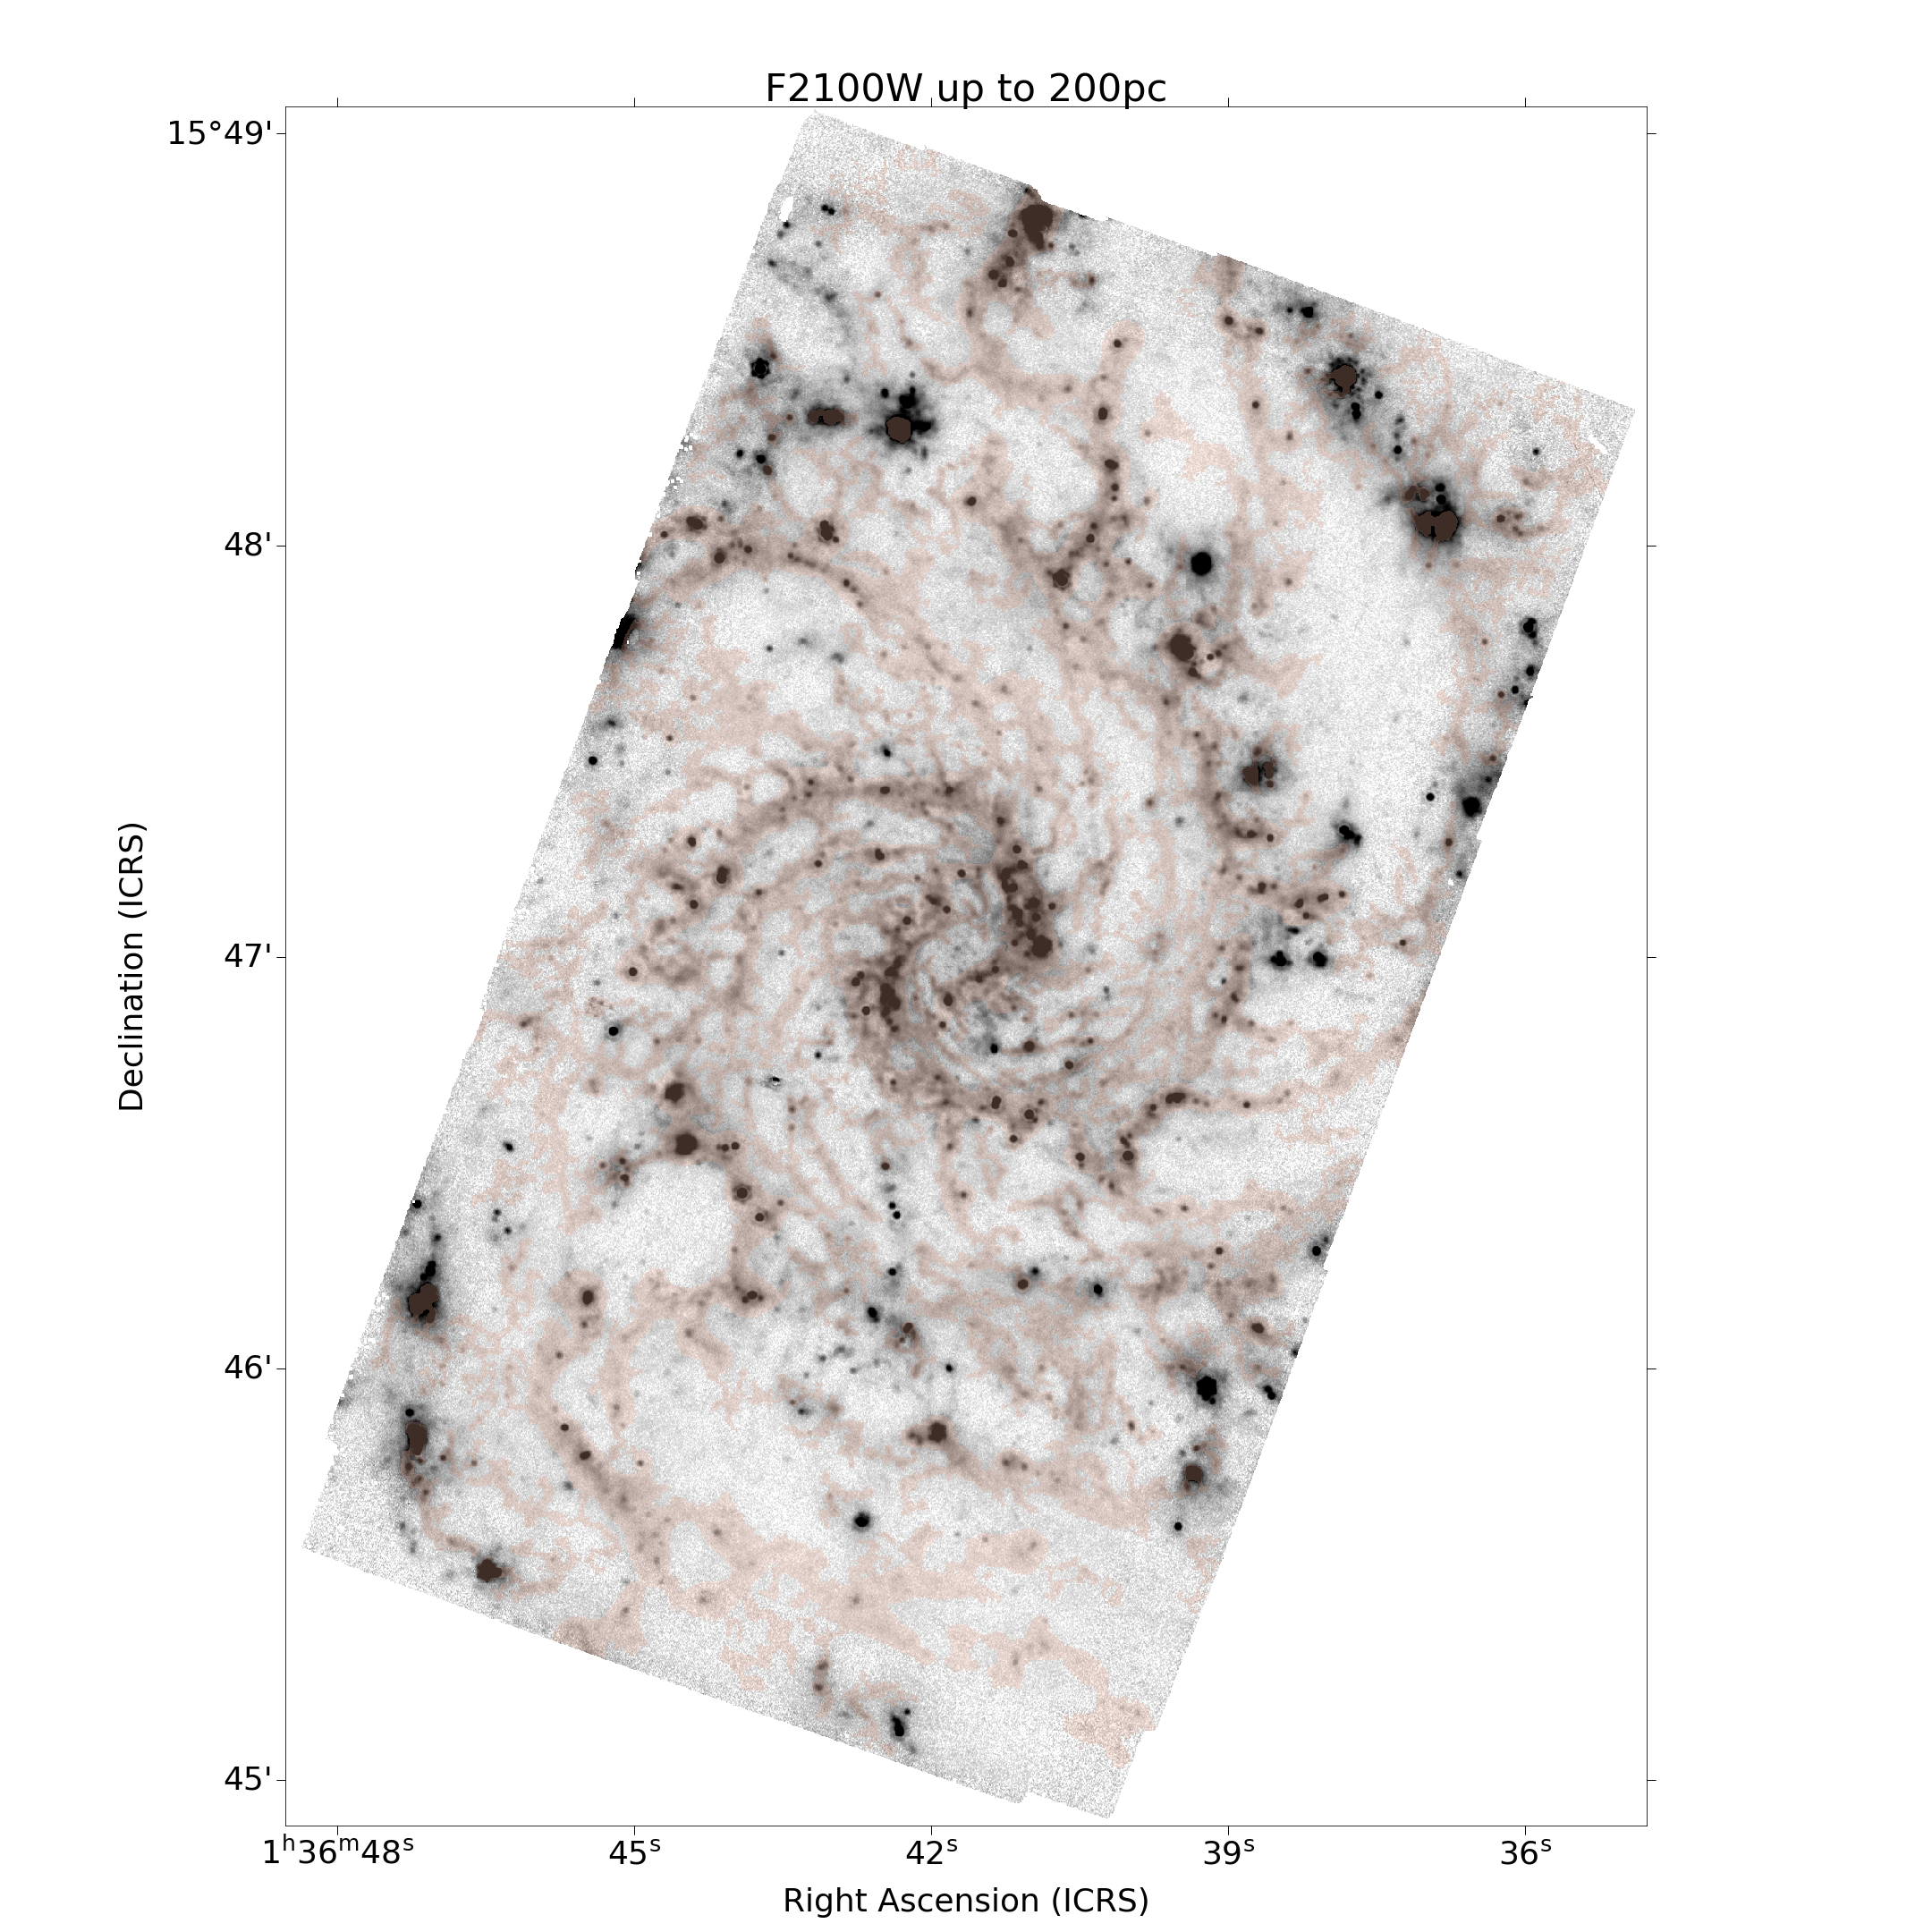
In the bottom panel of Fig. 2, we show the overlap for F2100W emission filaments with the dust lanes from HST . At 21 the percentage is 24% for 35 pc individual extraction scale, substantially less than for the three other bands, declining to 16% for 200 pc. For all separate scales, attenuation-only sight lines amount to more than 65% and emission-only 10%. Given that the attenuation filament mask remains constant F770W and F2100W, this could suggest that either we are sensitivity limited for F2100W or the filamentary emission detected in 21 imaging is less consistently recovered into coherent structures. The latter interpretation is supported by mask inspection in the figures of Appendix A, and by the fact that the morphology of the F2100W image is more dominated by compact sources (e.g. IR-bright star-forming regions, see Hassani et al. in prep.) than F770W, F1000W, and F1130W. This serves as a reminder that we are tracing warm (140 K) dust at 21, whereas the dust attenuation provides a more complete inventory with respect to dust over a wide range of [cooler] temperatures. Nevertheless, the overlap with the 200 pc cumulative multi-scale mask is 40% (only 1/3 less than for F770W).
In summary, the 40% level of pixel-by-pixel agreement of the attenuation and emission filament masks at 25 pc and the trend for the greatest agreement on the smallest scales that the correspondence may be even tighter if smaller physical scales are probed, such as in Local Group galaxies. We stress that, although 40% overlap may sound low, inspection of Fig. 1 shows that the detailed morphology (e.g. extent, shape) of filaments that are detected in attenuation and dust emission is frequently rather well-matched. We also note that regions of the filament network only found as dust emission are expected due to line-of-sight effects: some filaments will be positioned on the ‘back’ side of the face-on galaxy disk, and could account for the majority of ‘emission-only’ areas. Some attenuation-only regions also lie in false-negatives for MIR dust emission on the scale of interest, or lie in relatively MIR-faint, intermediate surface brightness regions of the visible galaxy disk. False negatives occur when a MIRI filament structure has a width that is somewhat different than the visible attenuation feature, or when scale-matched emission in the region is biased against detection at the scale of interest (e.g. a filament centered between brighter neighboring emission features spaced by about the width of the FilFinder adaptive thresholding box).
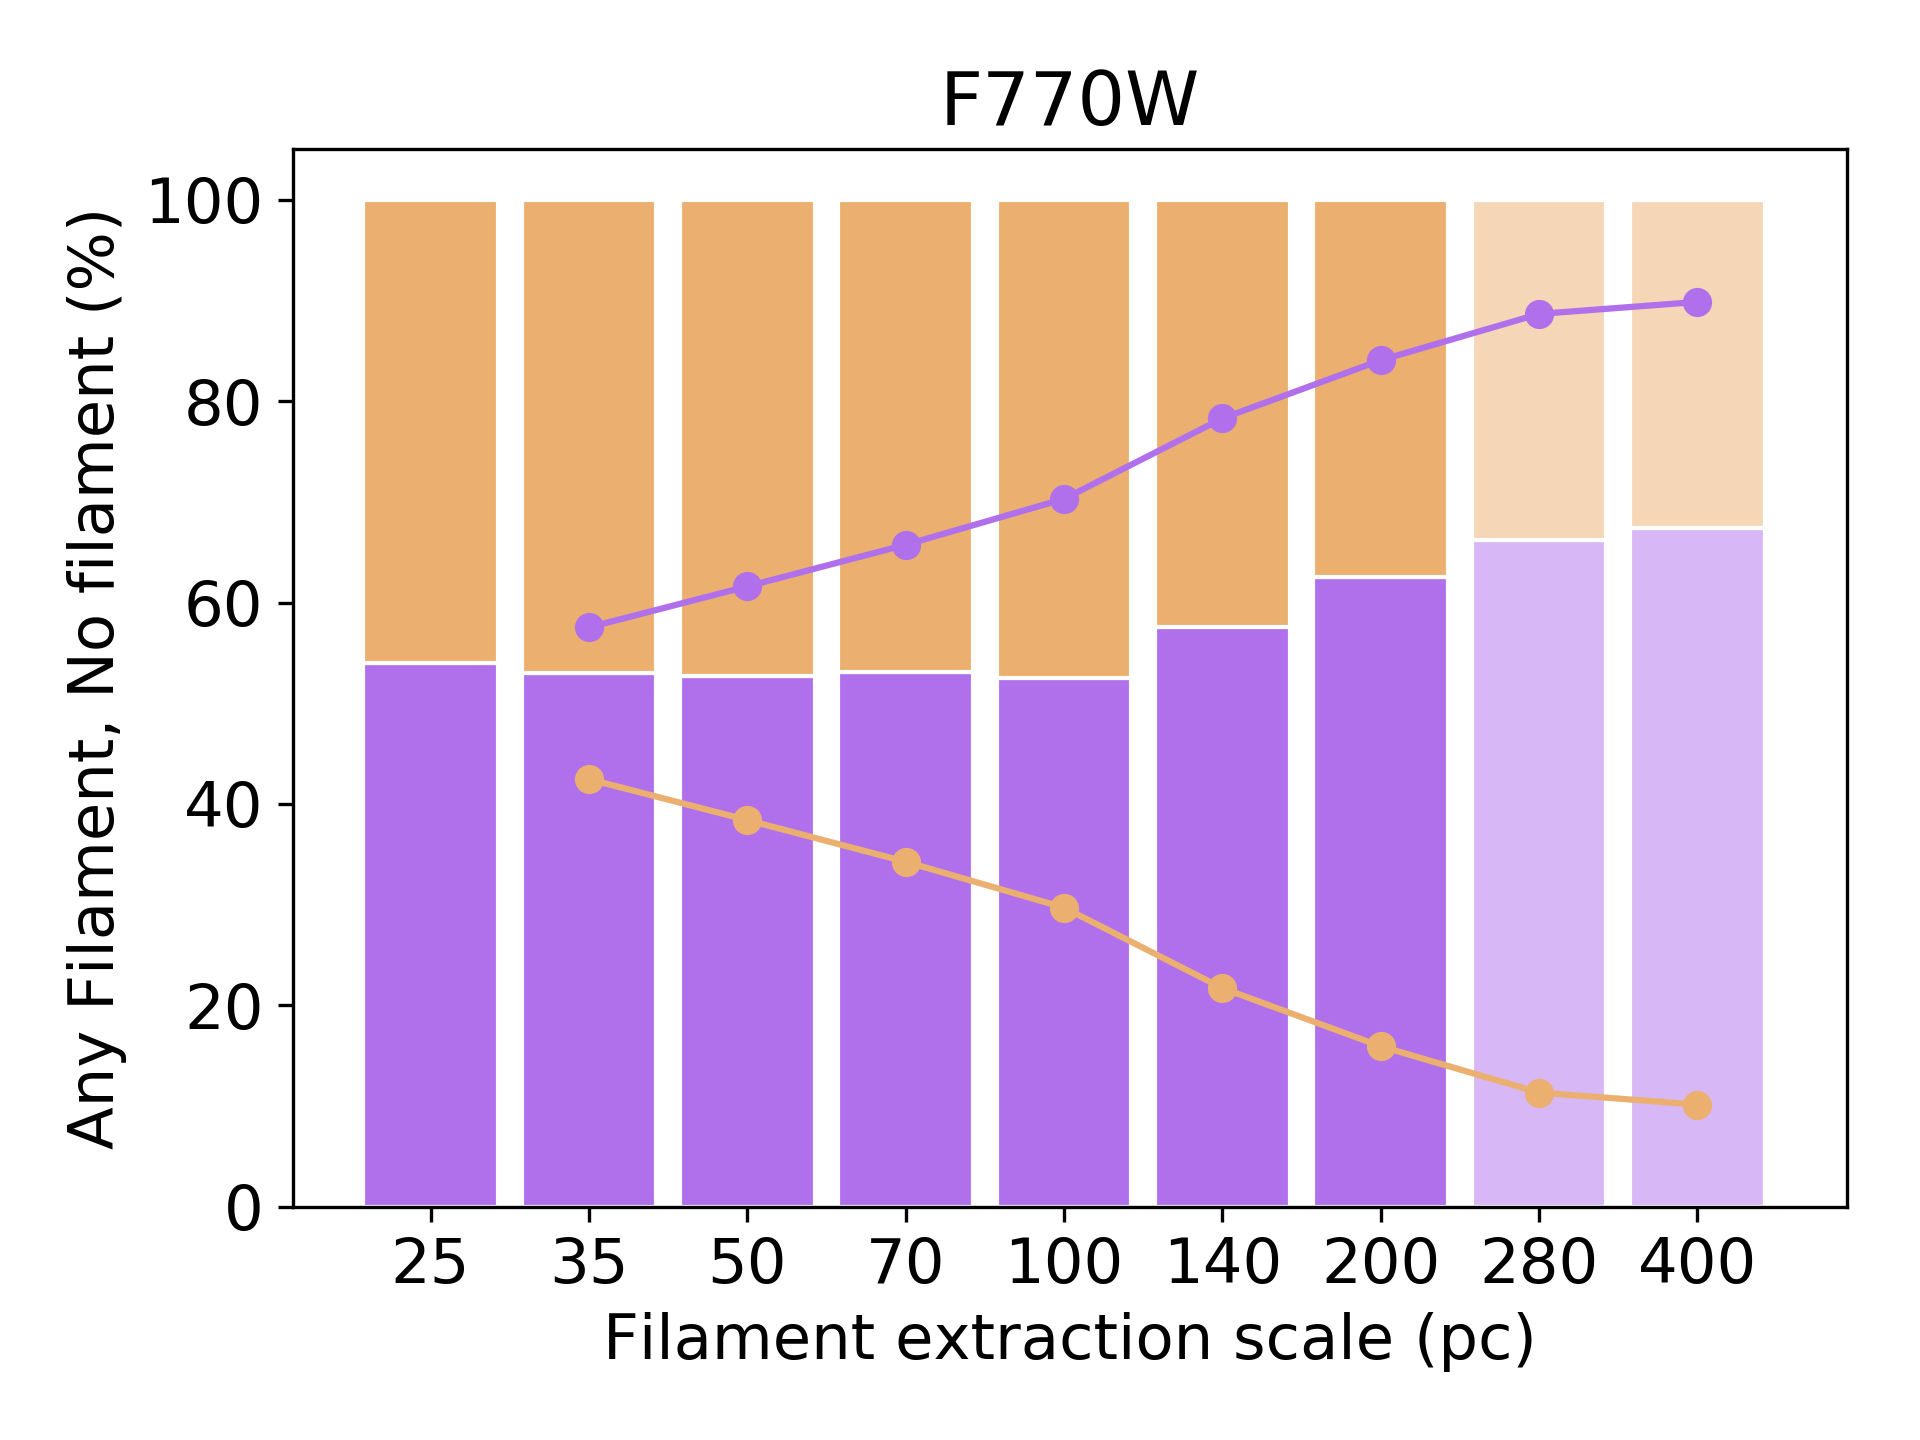
Figure 3 shows the division of sight lines between those associated to a dust filament (here, either attenuation or emission) and those that do not lie in a filament for the particular extraction scale. The plots show very little change between bands. We find that approximately 50–55% of sight lines are attributed to dust filaments for scales 25–100 pc with no variation due to extraction scale, then a mild increase at larger scales (to 60–65% for 200 pc). Cumulative multi-scale mask measurements of the dust filament sight line fraction (dots and lines in Fig. 3) steadily rise across the 25–200 pc range, despite the constancy for individual extraction scales smaller than 140 pc. Our filament masks are detecting a morphologically diverse dusty ISM, Though beyond the scope of this paper, it will be important to investigate if the component is increasingly atomic-dominated compared to narrower filaments.
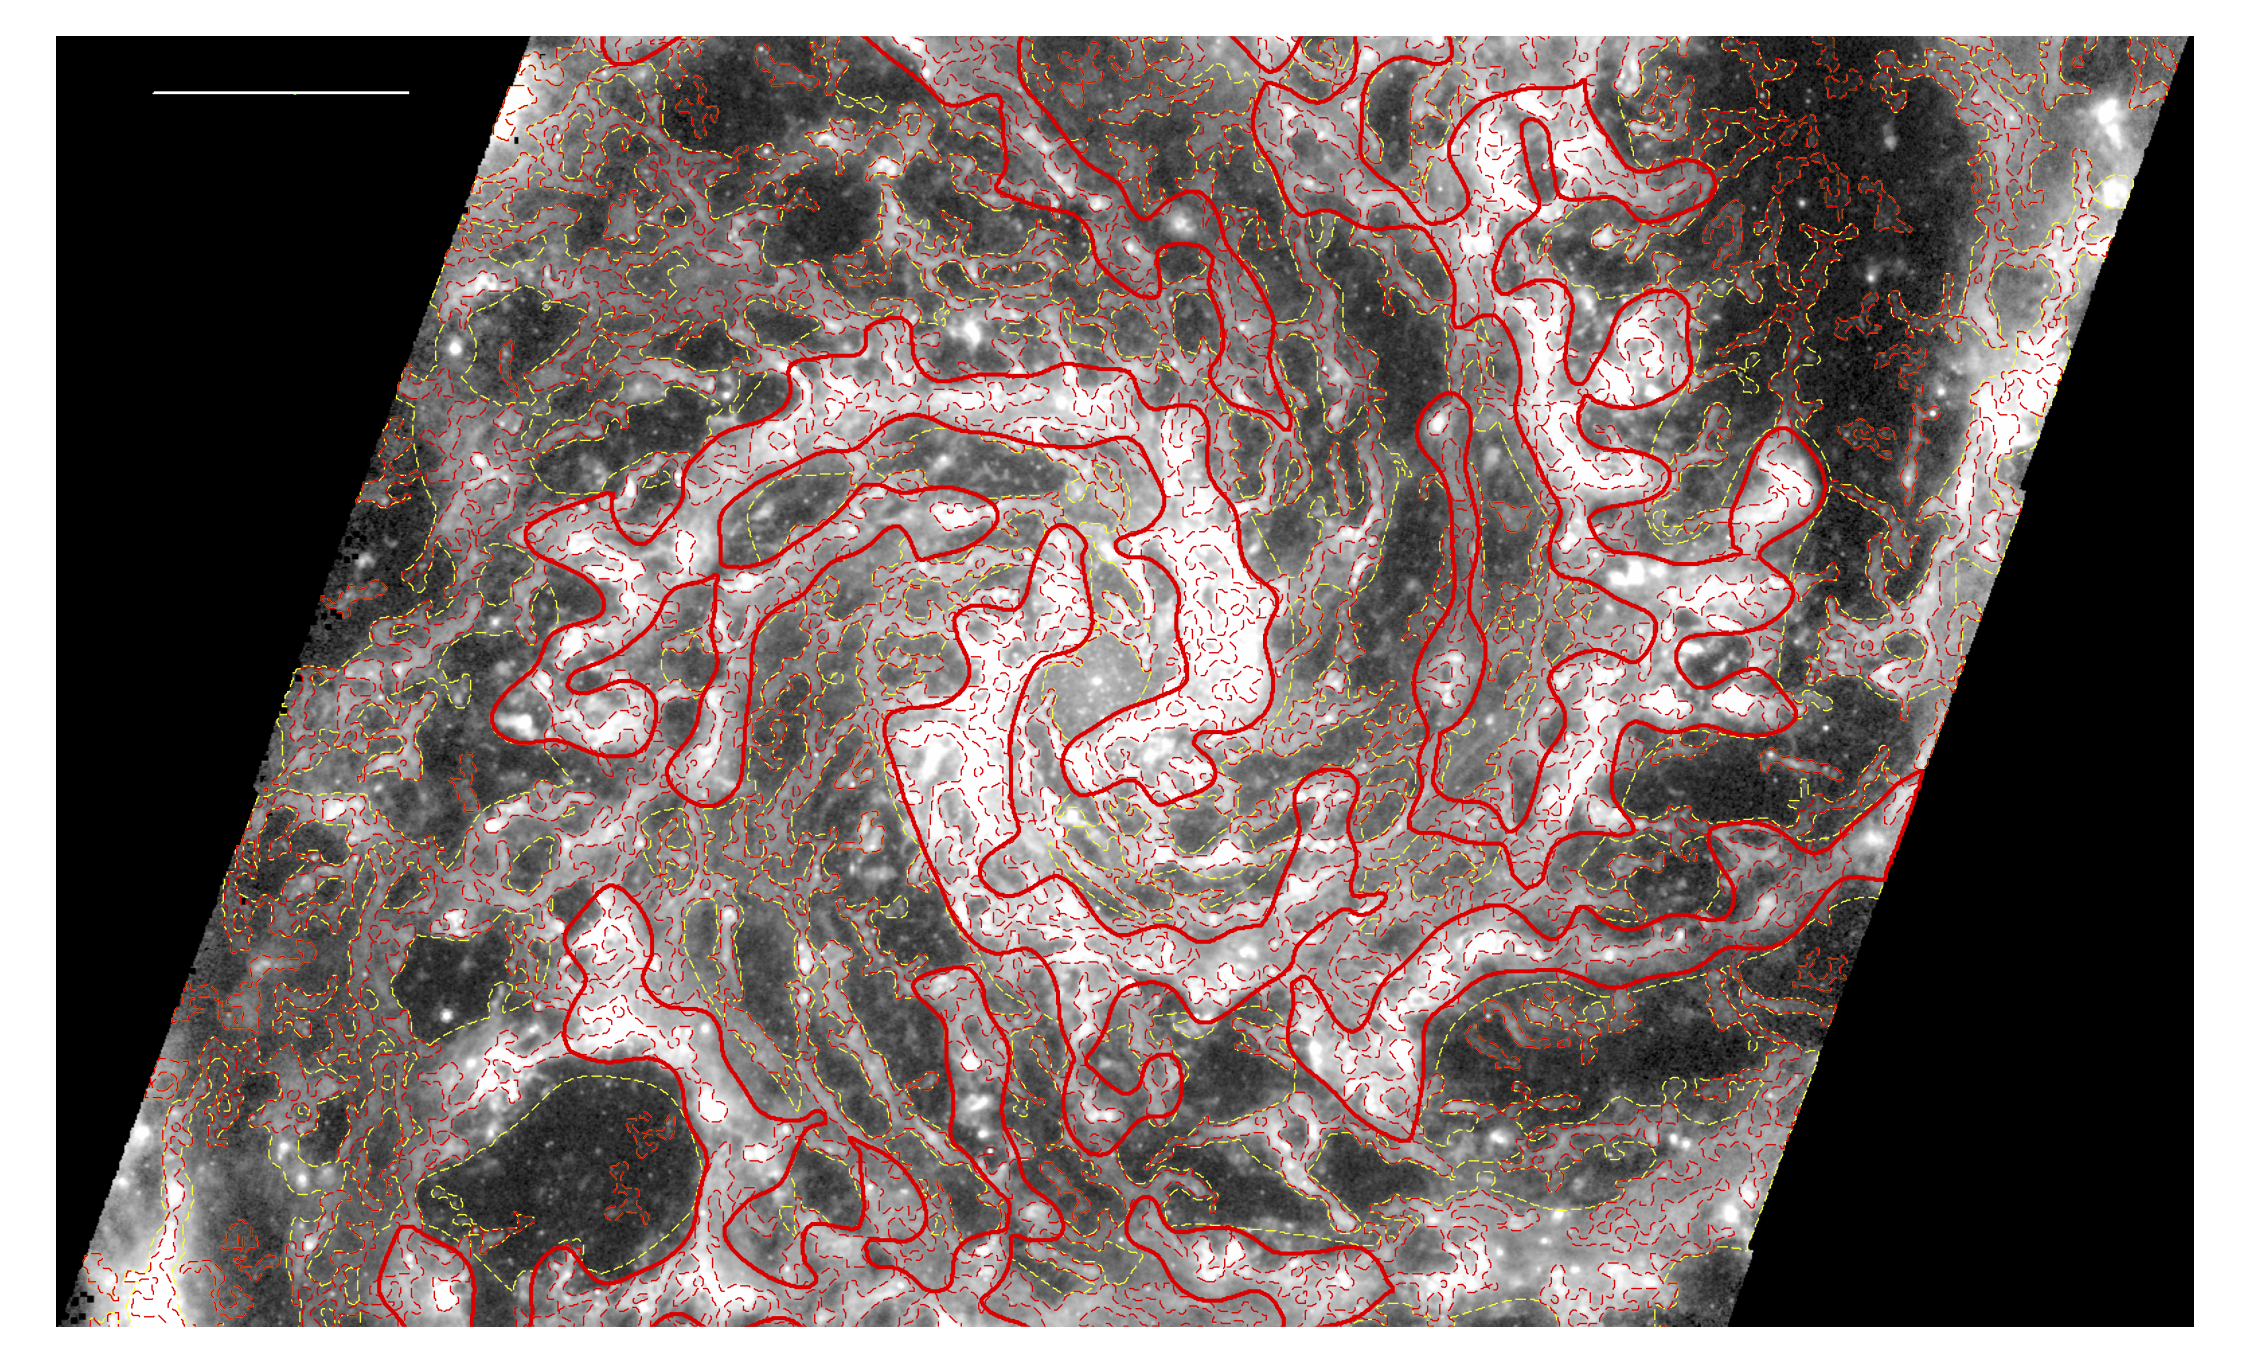
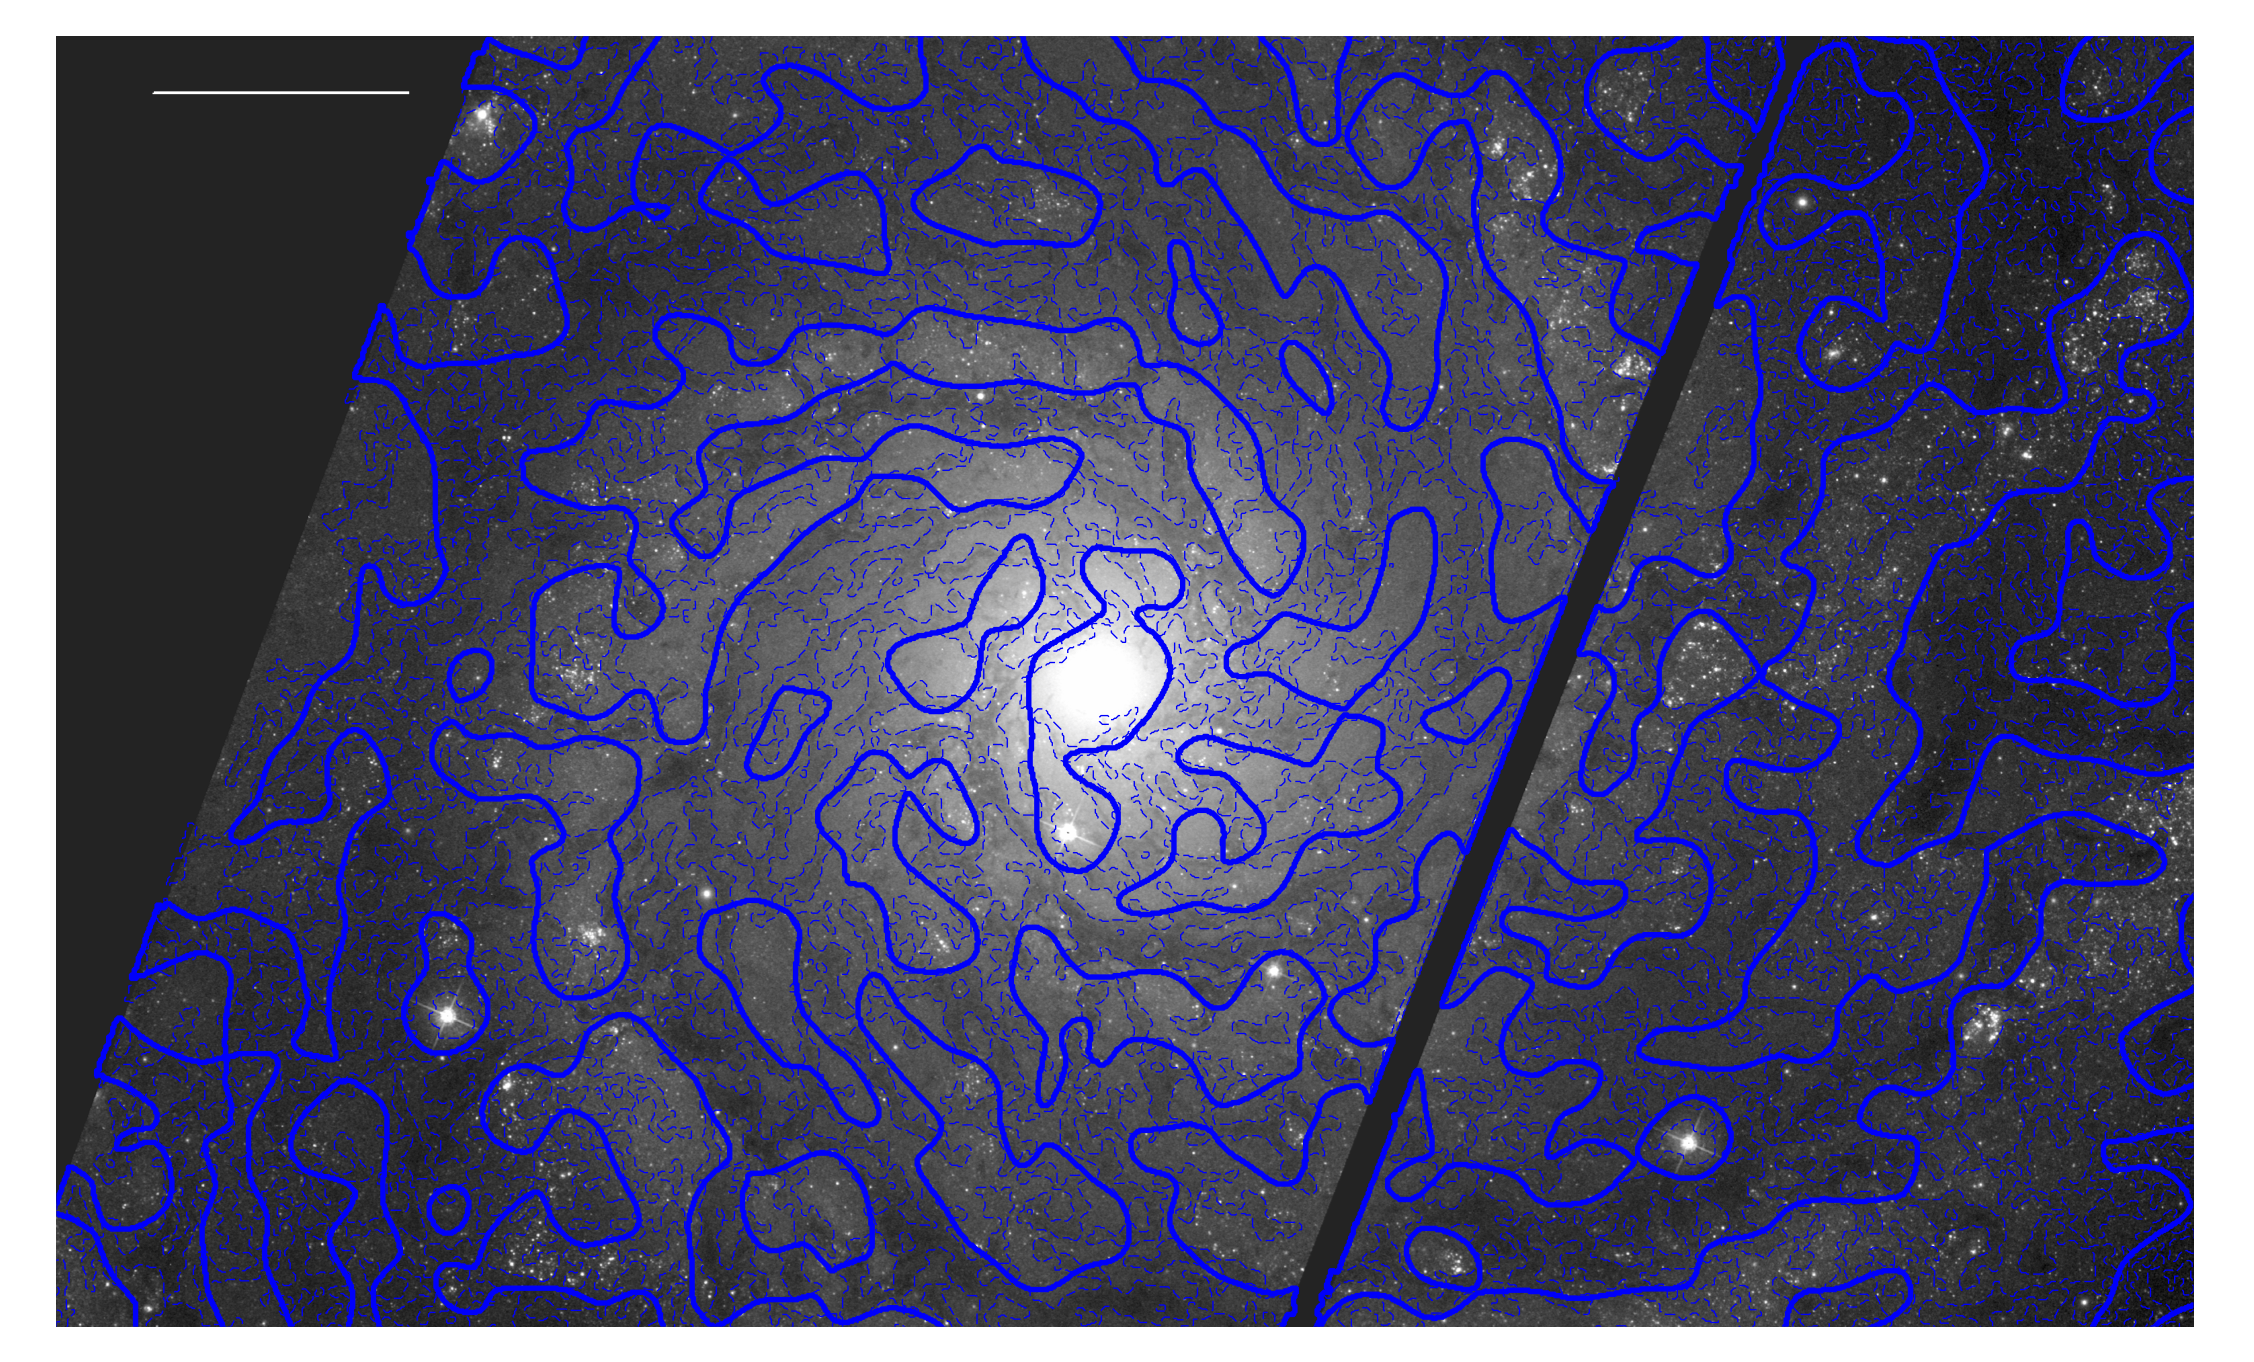
Figure 4 illustrates the tendency for dust filament masks to capture different morphological features when extracted using varied scales. In particular, we show the JWST F770W image in the top panel and HST B-band in the bottom panel. Using red and blue lines, overplotted on each of the images is a contour boundary of the 25 pc mask (dashed thin line) and 200 pc mask (solid thick line), with the variety of mask corresponding to the dust detection property of each image (emission on top, attenuation on bottom). Many of the single extraction scale 25 pc dust filaments are very long, with 1 kpc and have rather high aspect ratio. However, there are also frequent cases of the 25 pc masks (dashed thin lines) only including localized substructure within larger coherent filaments left unjoined by small scale extraction. This selective property of the filament identification outcome can be seen in spiral arms (markedly less so in interarm regions) and in both emission and attenuation. Conversely, the 200 pc filament masks (solid thick lines) often entirely exclude areas with a significant population of narrow GMC-scale width filaments. We note that the 200 pc attenuation filament mask recovers continuous spiral structure more effectively than the F770W emission mask of the same scale. Additionally, Fig. 4 demonstrates that the recovered dust attenuation features can be quite modest in terms of apparent . Inspection in the peripheral areas of the HST panel nevertheless suggests the majority of such filaments are real. On the JWST image, we also plot a contour representing the cumulative (up to 400 pc) emission filament mask (dashed thin yellow). The 25 pc and 200 pc filament structures alone do not include all portions of the DFN, especially in dust emission. The yellow contour shows how using a cumulative mask addresses this issue, linking many smaller scale components. Using cumulative masks with large upper scales can excessively broaden the extent of filaments, and hence we urge caution in the choice of the upper limit on multi-scale integration.
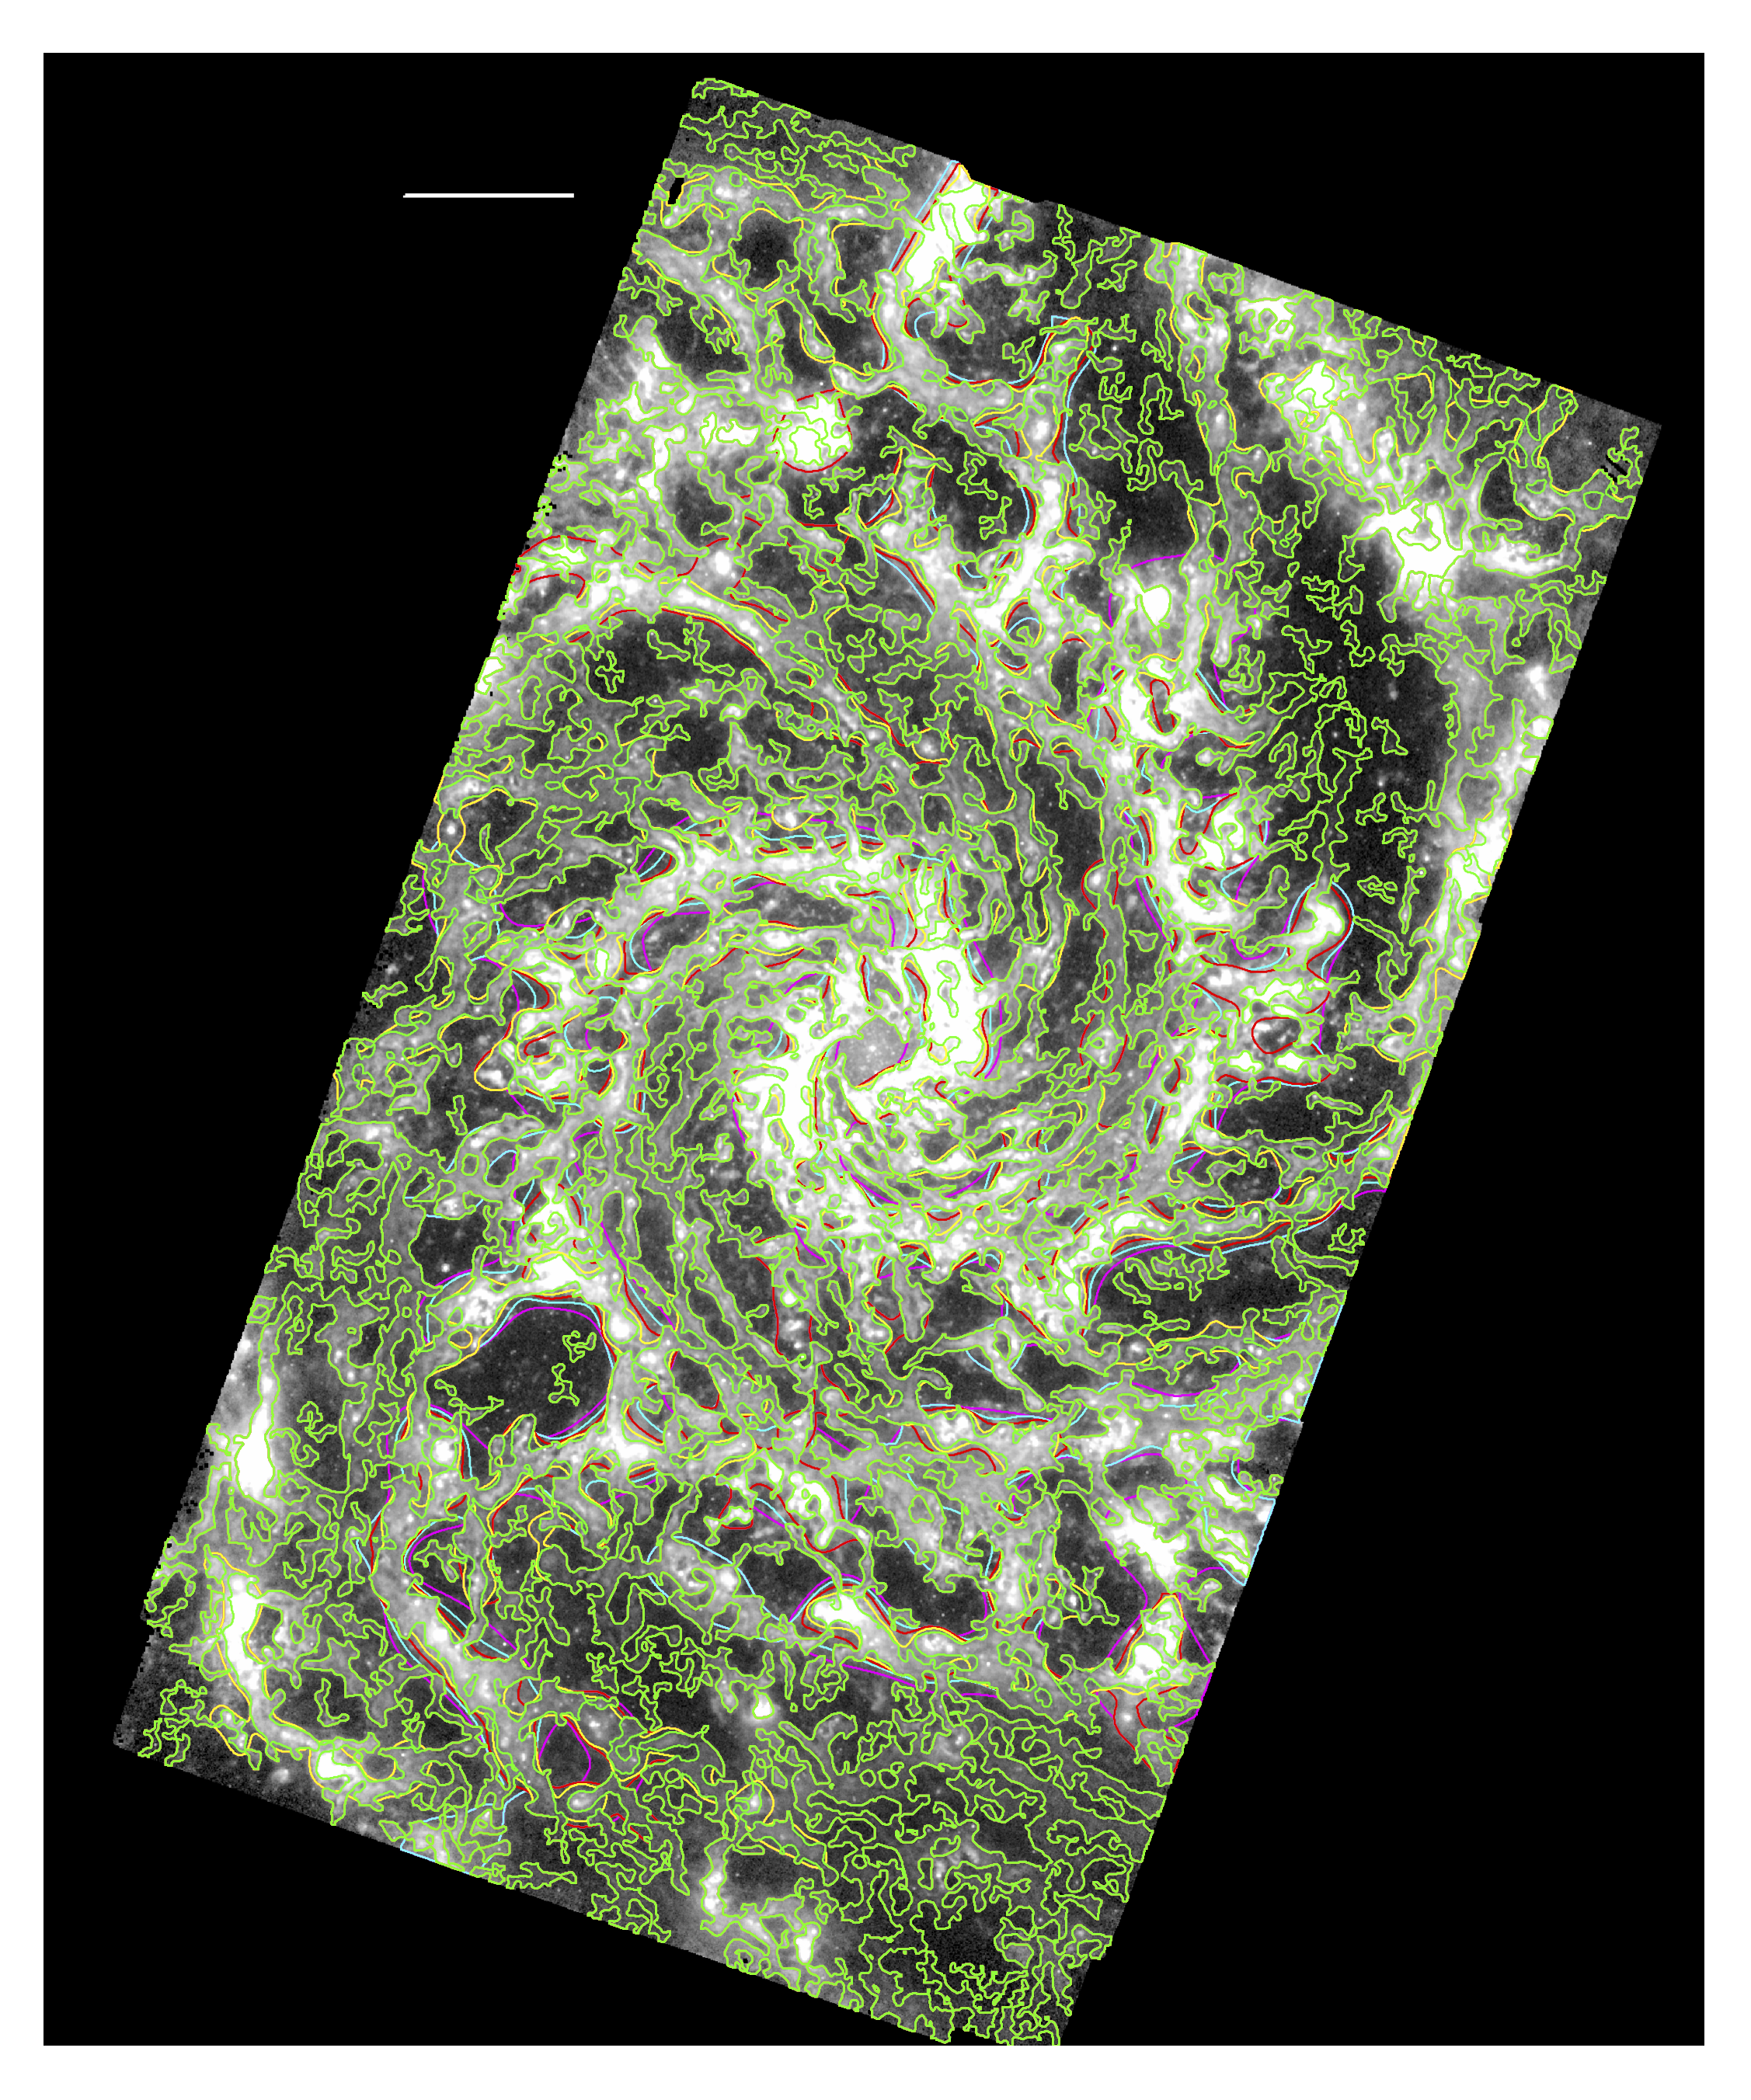
Fig. 5 provides empirical justification for maximum scale on the basis of emission. The figure plots cumulative F770W mask boundaries for different maximum scales, starting at 100 pc (green), running through 140, 200, 280 pc (yellow, red, cyan), up to 400 pc (magenta). The top layer contour (100 pc, green) already structure of the DFN, but several regions of seemingly contiguous filamentary emission remain disconnected either internally or to the network. By looking at other colored contours emerging from under the green boundary, one can infer how adding progressively larger scales changes the network. The 200 pc cumulative mask (red) appears to provide reliable recovery of all filamentary emission structures without undue peripheral excess, although 140 pc and 280 pc are probably also acceptable. HST B-band filament extraction at 280 and 400 pc occasionally confuses interarm gaps as attenuation. Such large ( pc) scales also push the limit of what can be considered a filament in the sense of forming via turbulent Jeans scale gravitational instabilities (see Meidt et al. in prep.).
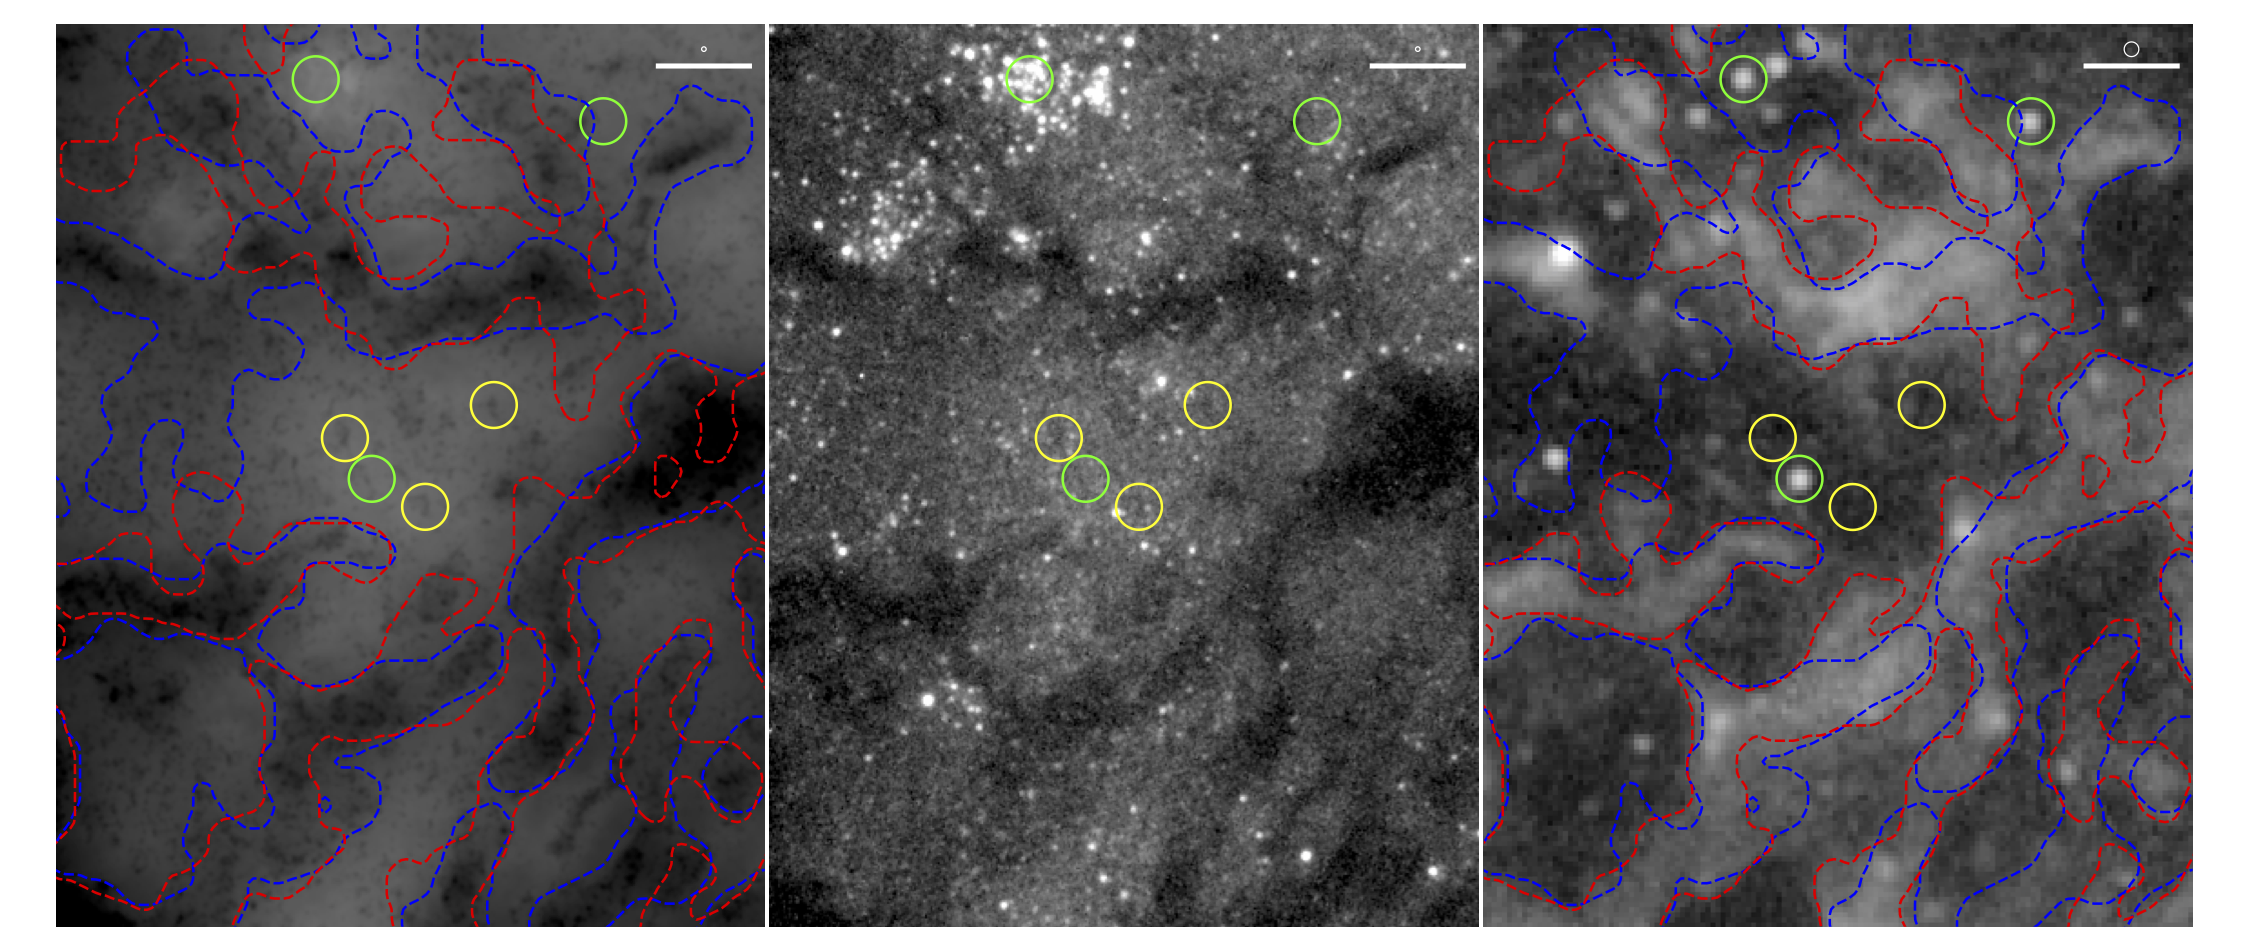
Fig. 6 presents a zoomed in view of a region east-southeast of the galaxy center, showing the filtered B-band data in comparison to an unprocessed version of the same image and to F1000W data from JWST . Contours of the 25 pc B-band and F1000W filaments are overplotted. This figure visually emphasizes the 40% sight line overlap and morphological agreement at this scale. Fig. 6 also demonstrates feasibility to probe even smaller scales in visible dust lanes across the entire PHANGS-HST sample. Significant substructuring (down to the pc WFC3/UVIS resolution limit in NGC 628) in attenuation of the features detected as dust emission filaments at 25 pc scales is apparent. We further expect HST to detect additional small scale filaments beyond the limit of MIRI – several super narrow attenuation filaments without corresponding larger scale intensity depression are apparent in other regions of NGC 628. Finally, Fig. 6 demonstrates that with HST we will be able to reveal candidate features we nickname ‘dust motes’ (examples marked with yellow circles), essentially compact ( pc), dark clouds we cannot cleanly identify solely with JWST due to confusion with point-like dusty extreme AGB stars (Thilker et al., in prep.) lying outside the emission filament network (examples marked with green circles) in the short wavelength MIRI images. These dust motes could be individual molecular clouds in relative isolation. Their size is comparable to the Taurus Molecular Cloud, although Taurus is star-forming whereas the motes may often be quiescent. A better Milky Way might be the smallest scale clouds found in the 3D extinction maps of e.g. Leike et al. (2020). Dust mote clouds are challenging to confirm with MIRI, but appear in the HST B-band images before any pre-processing (Fig. 6 center). PHANGS-JWST F335M 3.3 PAH imaging (Sandstrom et al., in prep.; Rodriguez et al., in prep.) and forthcoming PHANGS-HST H imaging (GO 17126, PI R. Chandar) may prove useful to further vet dust candidates as a class.
4.2 Fraction of flux in MIR filament network
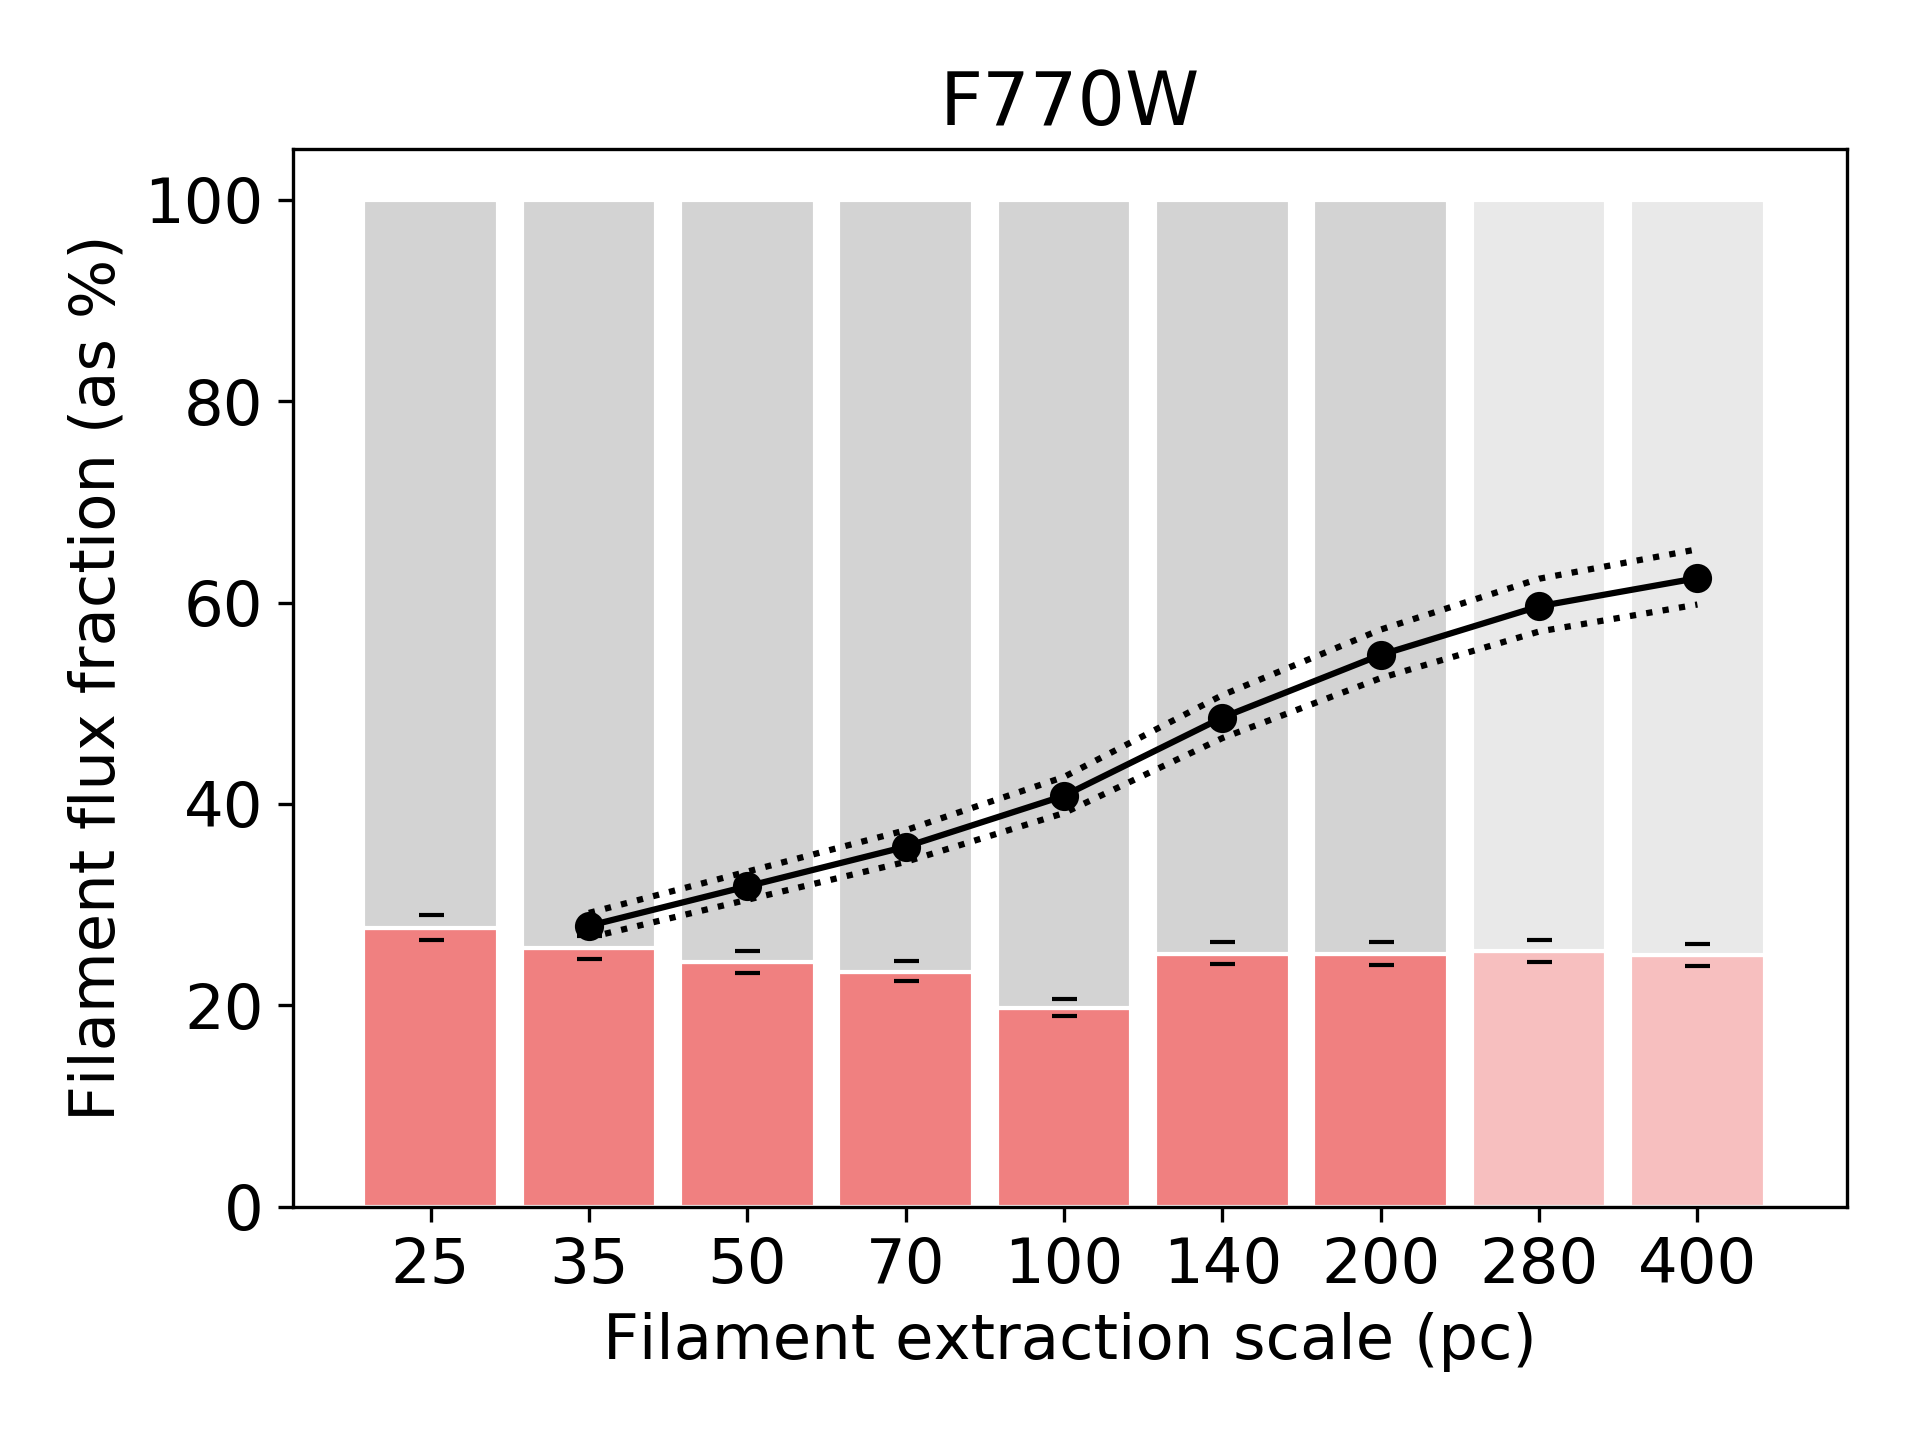
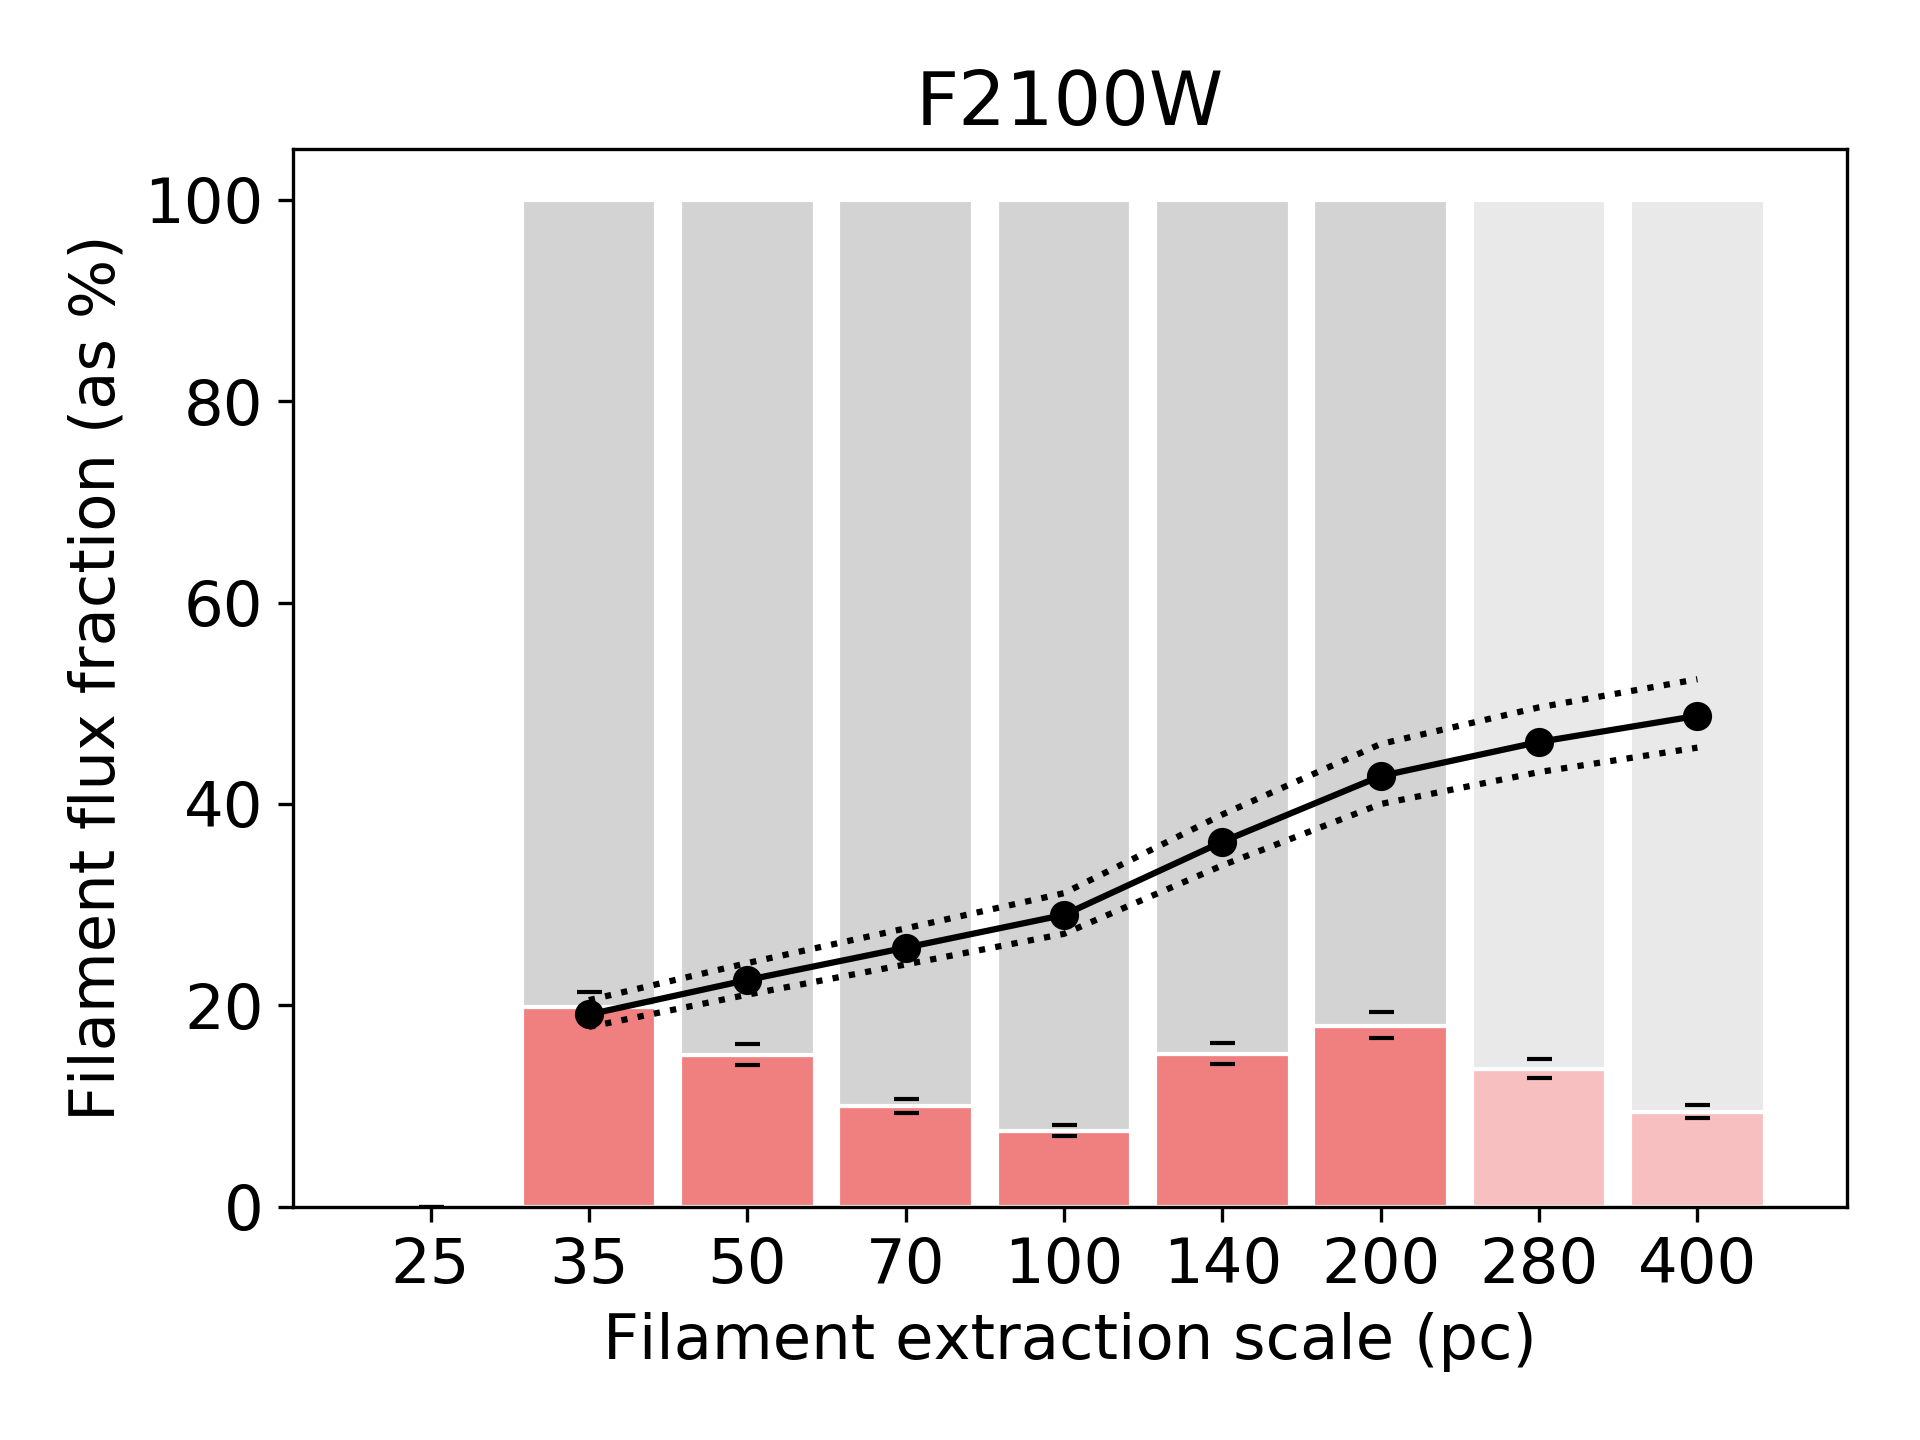
The relative amount of structured and unstructured (diffuse) dust in a galaxy is fundamental metric of ISM morphology and offers a basis for comparison with simulations that aim to understand the impact of factors such as stellar feedback and dynamical influences (e.g. Smith et al., 2020). As noted in Sec. 4.3, this observable is also relevant to star formation rate (SFR) estimation. We measure the fraction of flux contained within the extracted filaments compared to the total flux in the image. As the filaments are brighter than their surroundings, this requires that we establish a local background estimate at all locations in the image, which we do using the procedure given in Sec. 3. Figure 7 presents our results concerning flux fraction as a function of filament extraction scale.
We find that at the smallest independent extraction scales considered (25 pc for F770W, F1000W, F1130W; 35 pc for F2100W), the background-subtracted filament flux fractions are nearly except for F2100W at . The flux fraction is essentially constant versus extraction scale for F770W, F1000, and F1130W, but peaks at 35 pc and 200 pc for F2100W. The F2100W flux fractions are always significantly less than all three shorter wavelength MIRI bands. Given the present residual 0.1 MJy sr-1 uncertainty in the background level of our MIRI images (see Sec. 2.1 and Leroy et al. in prep.), we assess the impact this has on filament flux fractions, by offsetting the image intensities by the uncertainty in a positive and negative sense. Dashes overplotted on the bars of Fig. 7 indicate the resulting perturbed fractions.
Cumulative multi-scale mask filament flux fraction results are also shown in Fig. 7, indicated by the solid lines and dots. As expected, the fraction increases as progressively more individual masks are combined and the maximum allowed extraction scale is increased. For our choice of maximum scale (200 pc) the background-subtracted filament flux is in the range % to % of the total F770W, F1000W, and F1130W flux in the field. At the same cumulative scale, the F2100W measurement is 43%. Scatter due to uncertainty in background level is also checked for cumulative values, and shown with dotted lines on Fig. 7. The impact is notably larger than for individual scales, but is generally less than systematic uncertainty due to our choice of maximum scale included in the DFN cumulative mask.
We note that if diffuse emission is neglected, rather than subtracted away as in our analysis, the integrated flux from the filament network becomes 40-100% higher boosting the cumulative filament flux fractions to 80% for F770W, F1000W, and F1130W and 60% for F2100W.
4.3 Linking the dust filament network to star formation activity
The results of Sec. 4.2 confirm that more than half of the MIR flux from NGC 628 originates in the intricately structured filament network, with the only exception being for F2100W (43%). This outcome is what we anticipated based on previous work for nearby galaxies (Liu et al., 2011; Leroy et al., 2012; Crocker et al., 2013; Calzetti, 2013; Boquien et al., 2016; Kumari et al., 2020; Belfiore et al., in prep.). It reinforces the necessity of correcting the integrated MIR luminosity of a galaxy for the presence of inherently diffuse emission heated by older stellar populations, when using MIR to measure current SFR (Lonsdale Persson & Helou, 1987; Boquien et al., 2016). One of the goals of PHANGS-JWST is to clarify systematics of this correction. We can positionally test the linkage of the DFN to age-dated markers of star formation events, checking whether all regions of the filament network can be attributed to heating by current star formation or if some filamentary structure is effectively quiescent and should be removed alongside diffuse emission when estimating SFR. Put differently, perhaps only filamentary structure up to a certain maximum scale, or down to a limiting dust surface density, is directly linked to the youngest stellar populations.
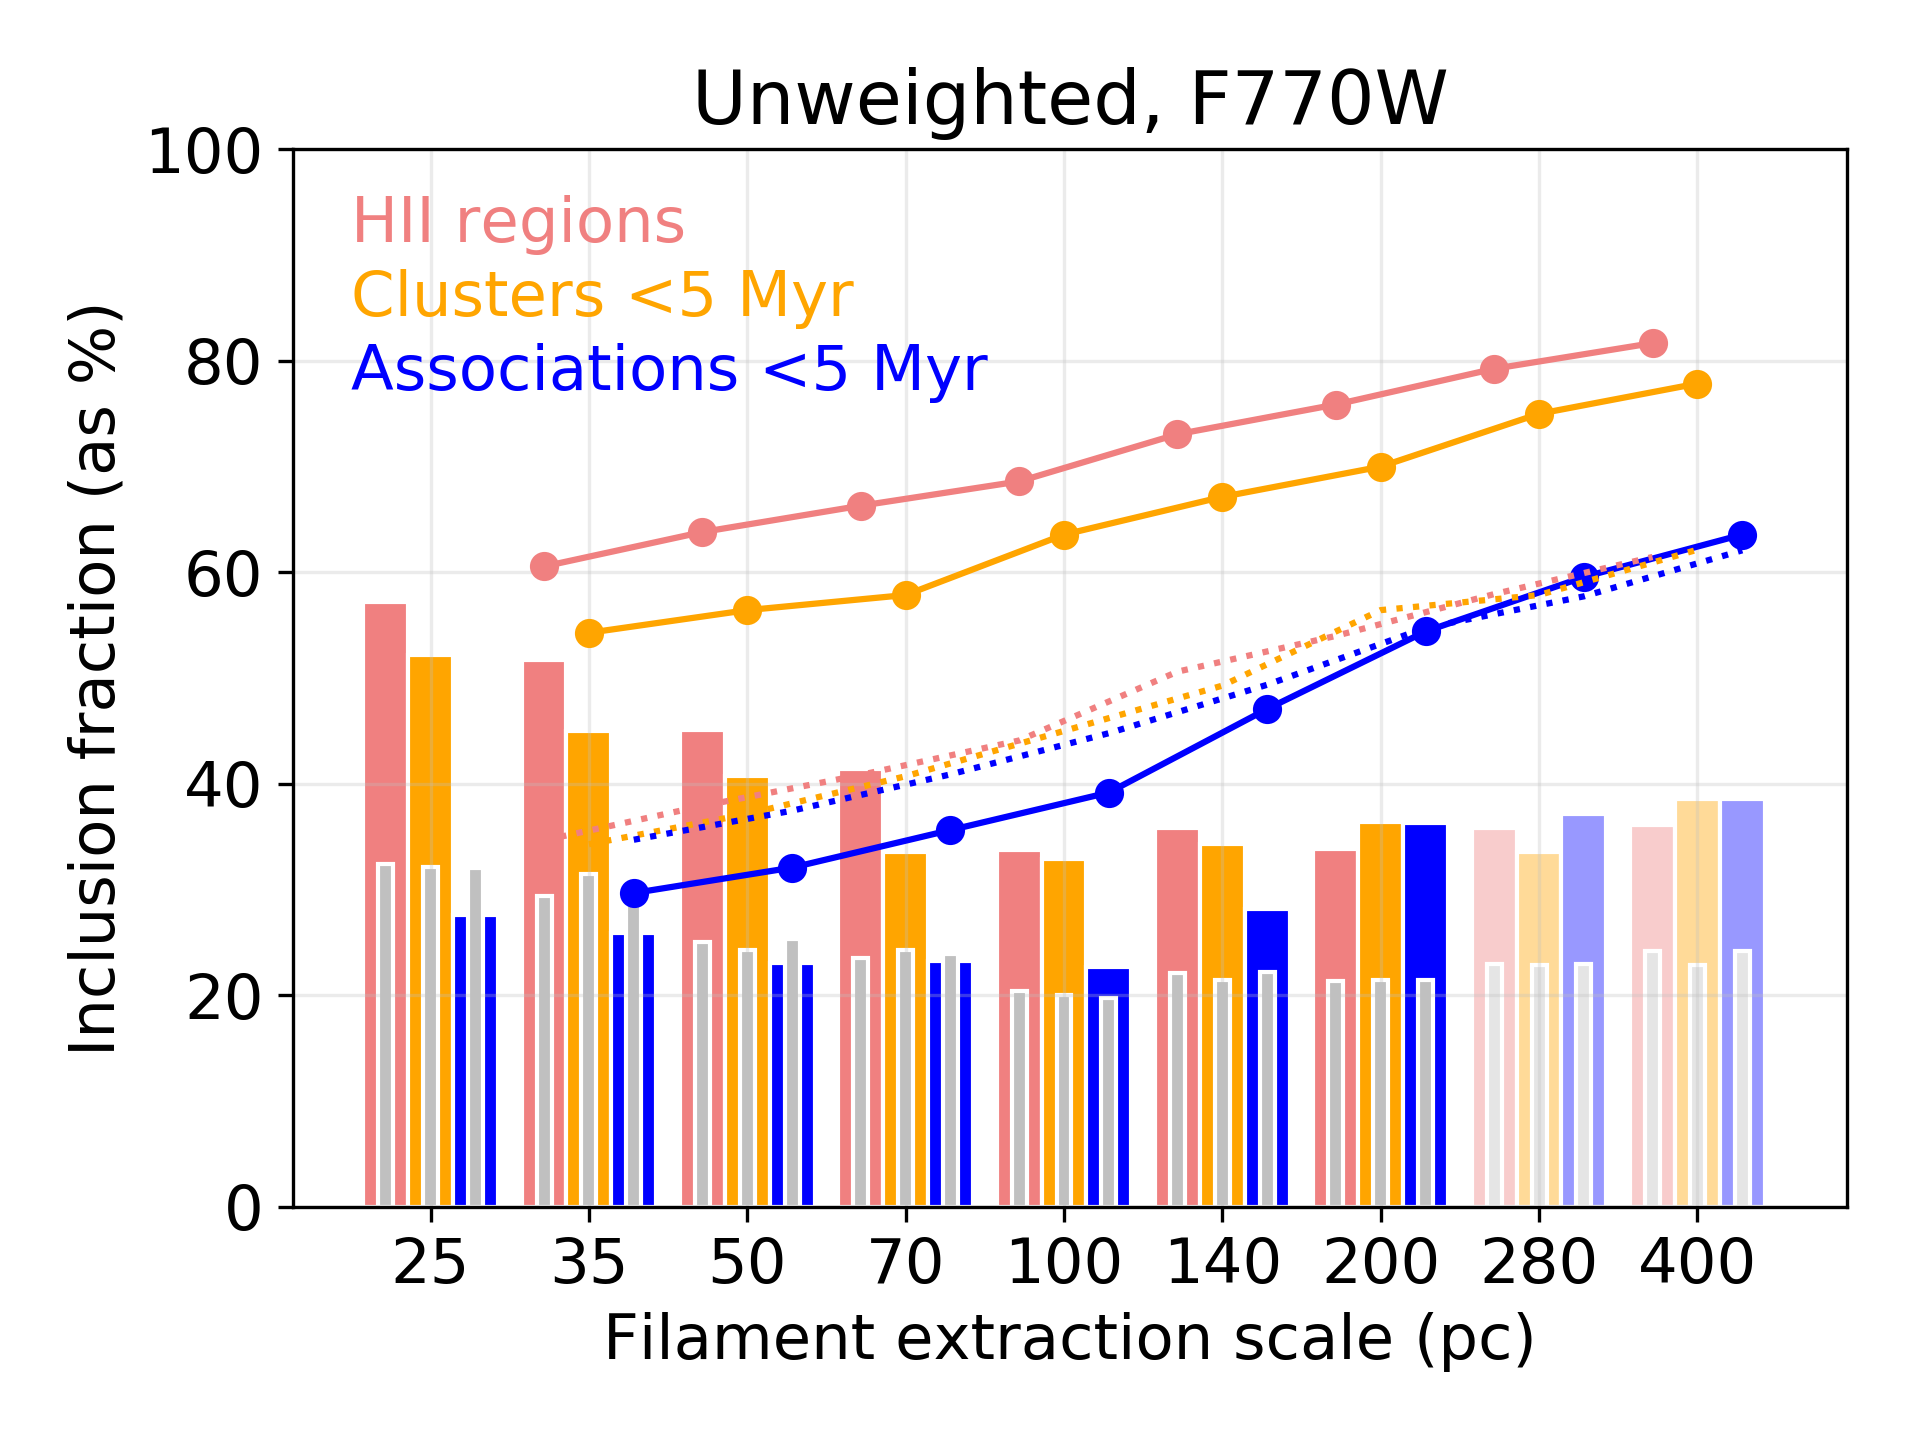
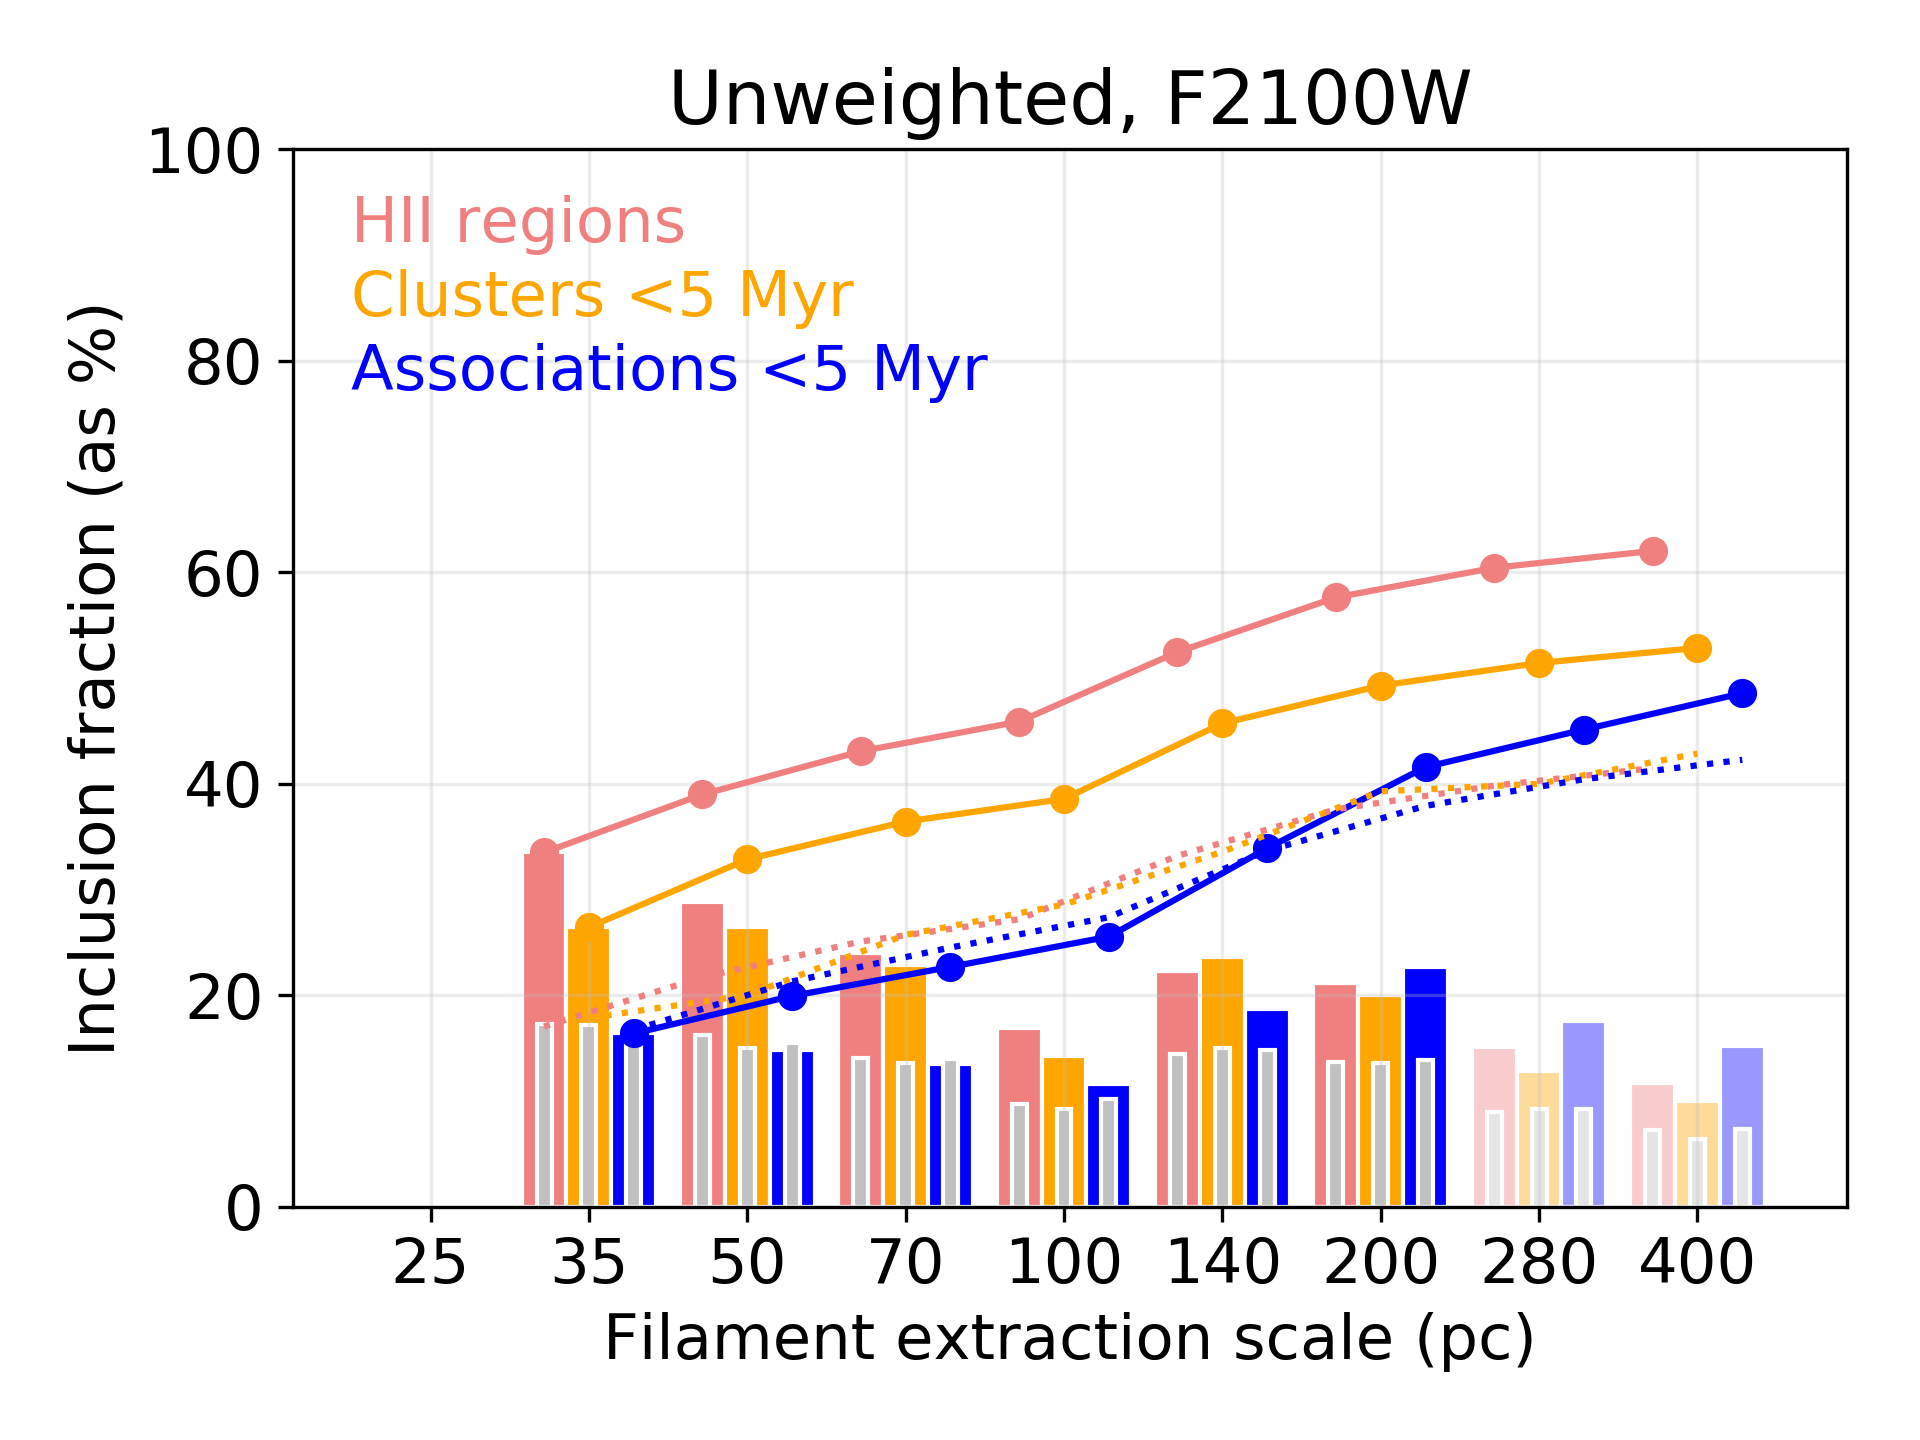
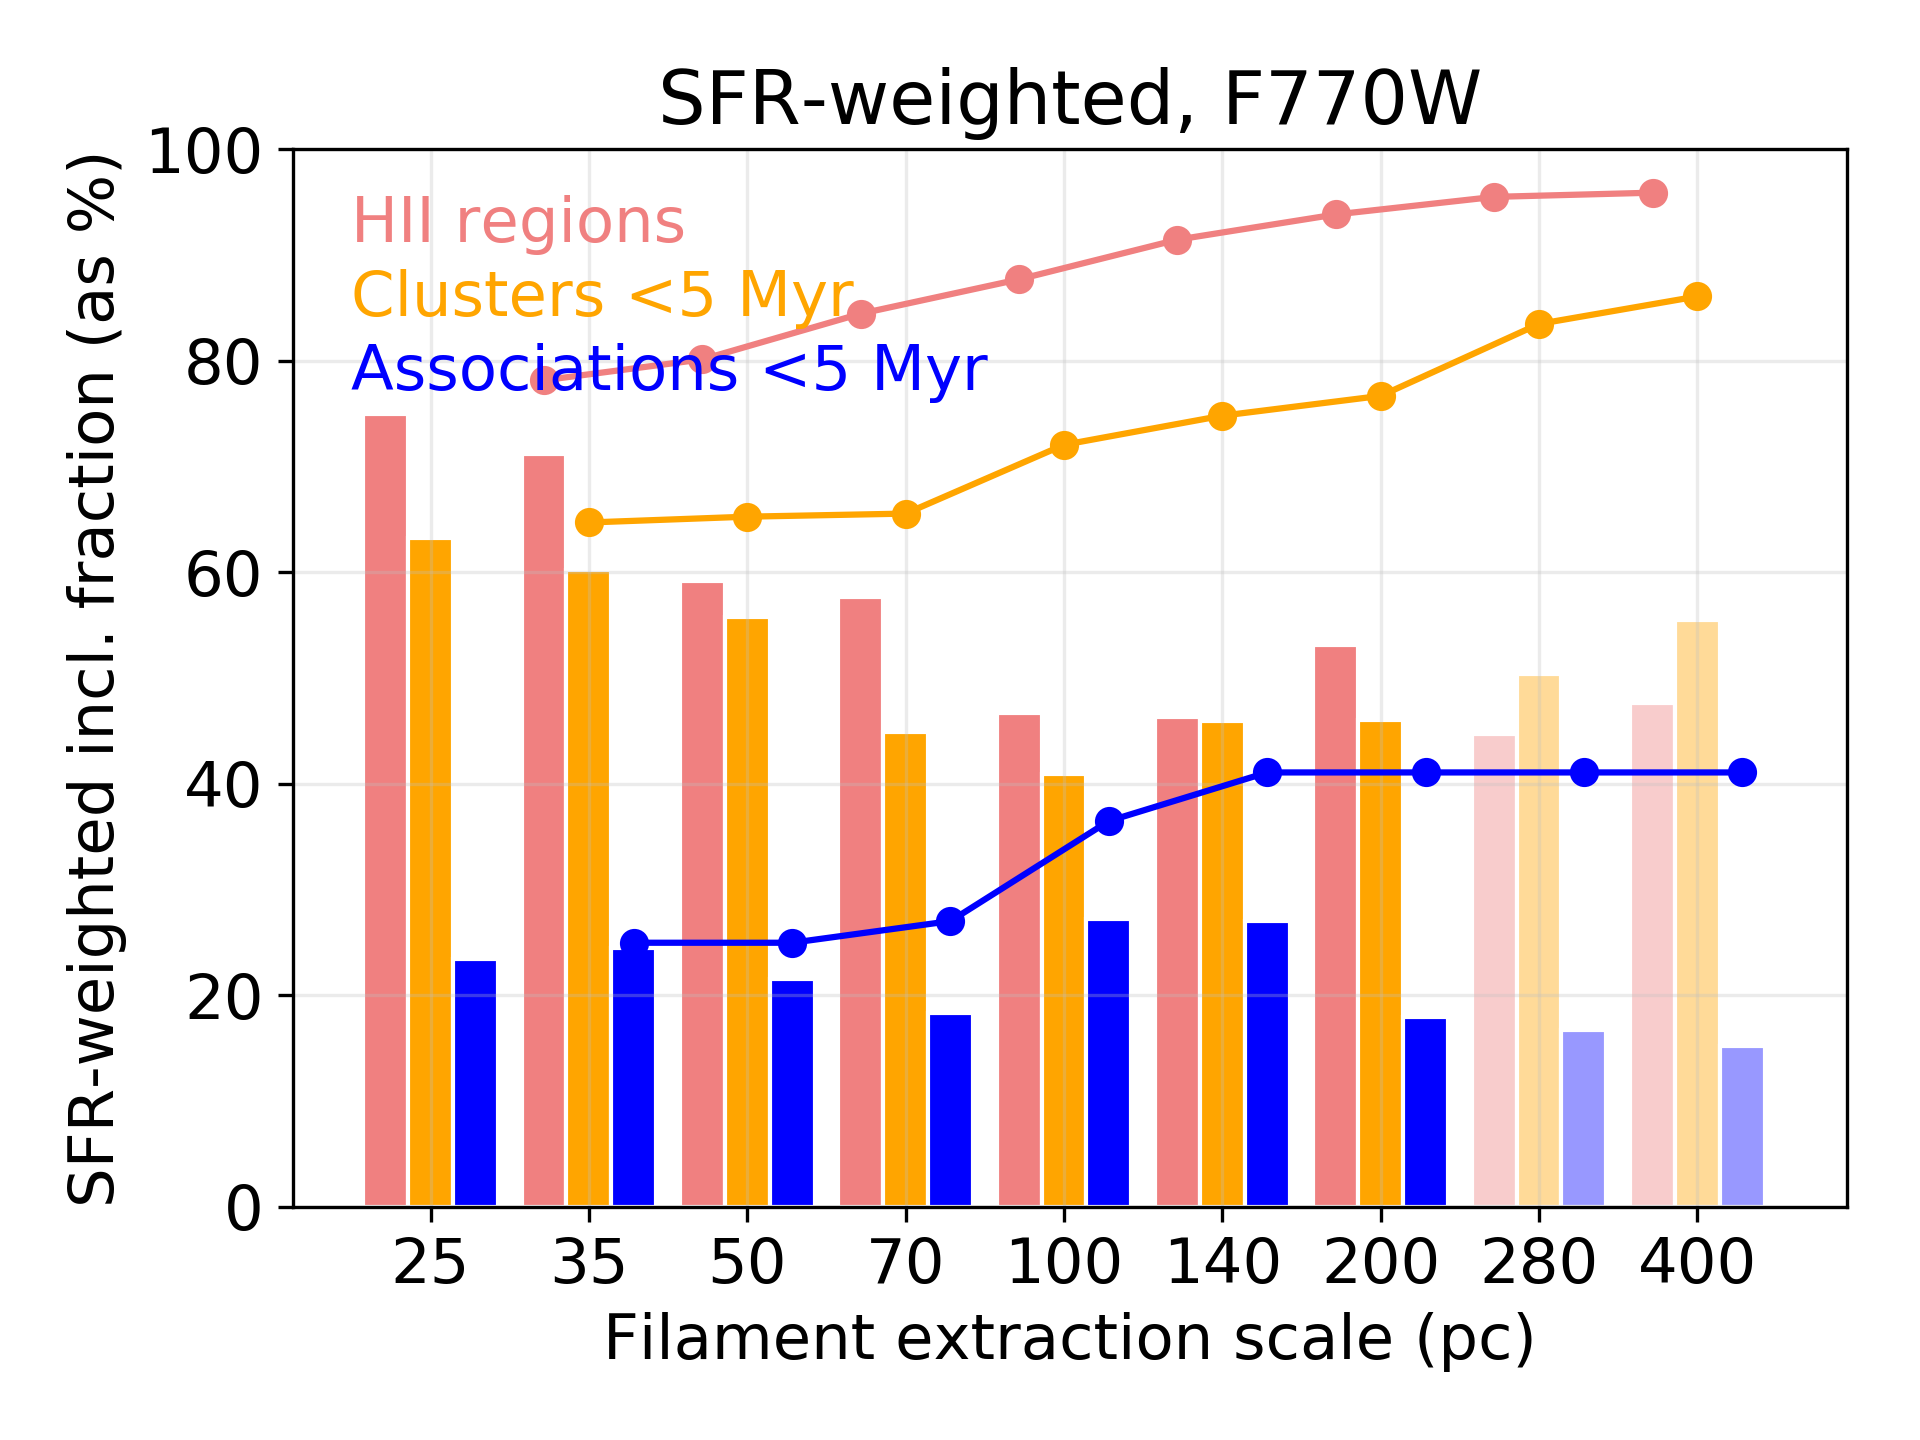
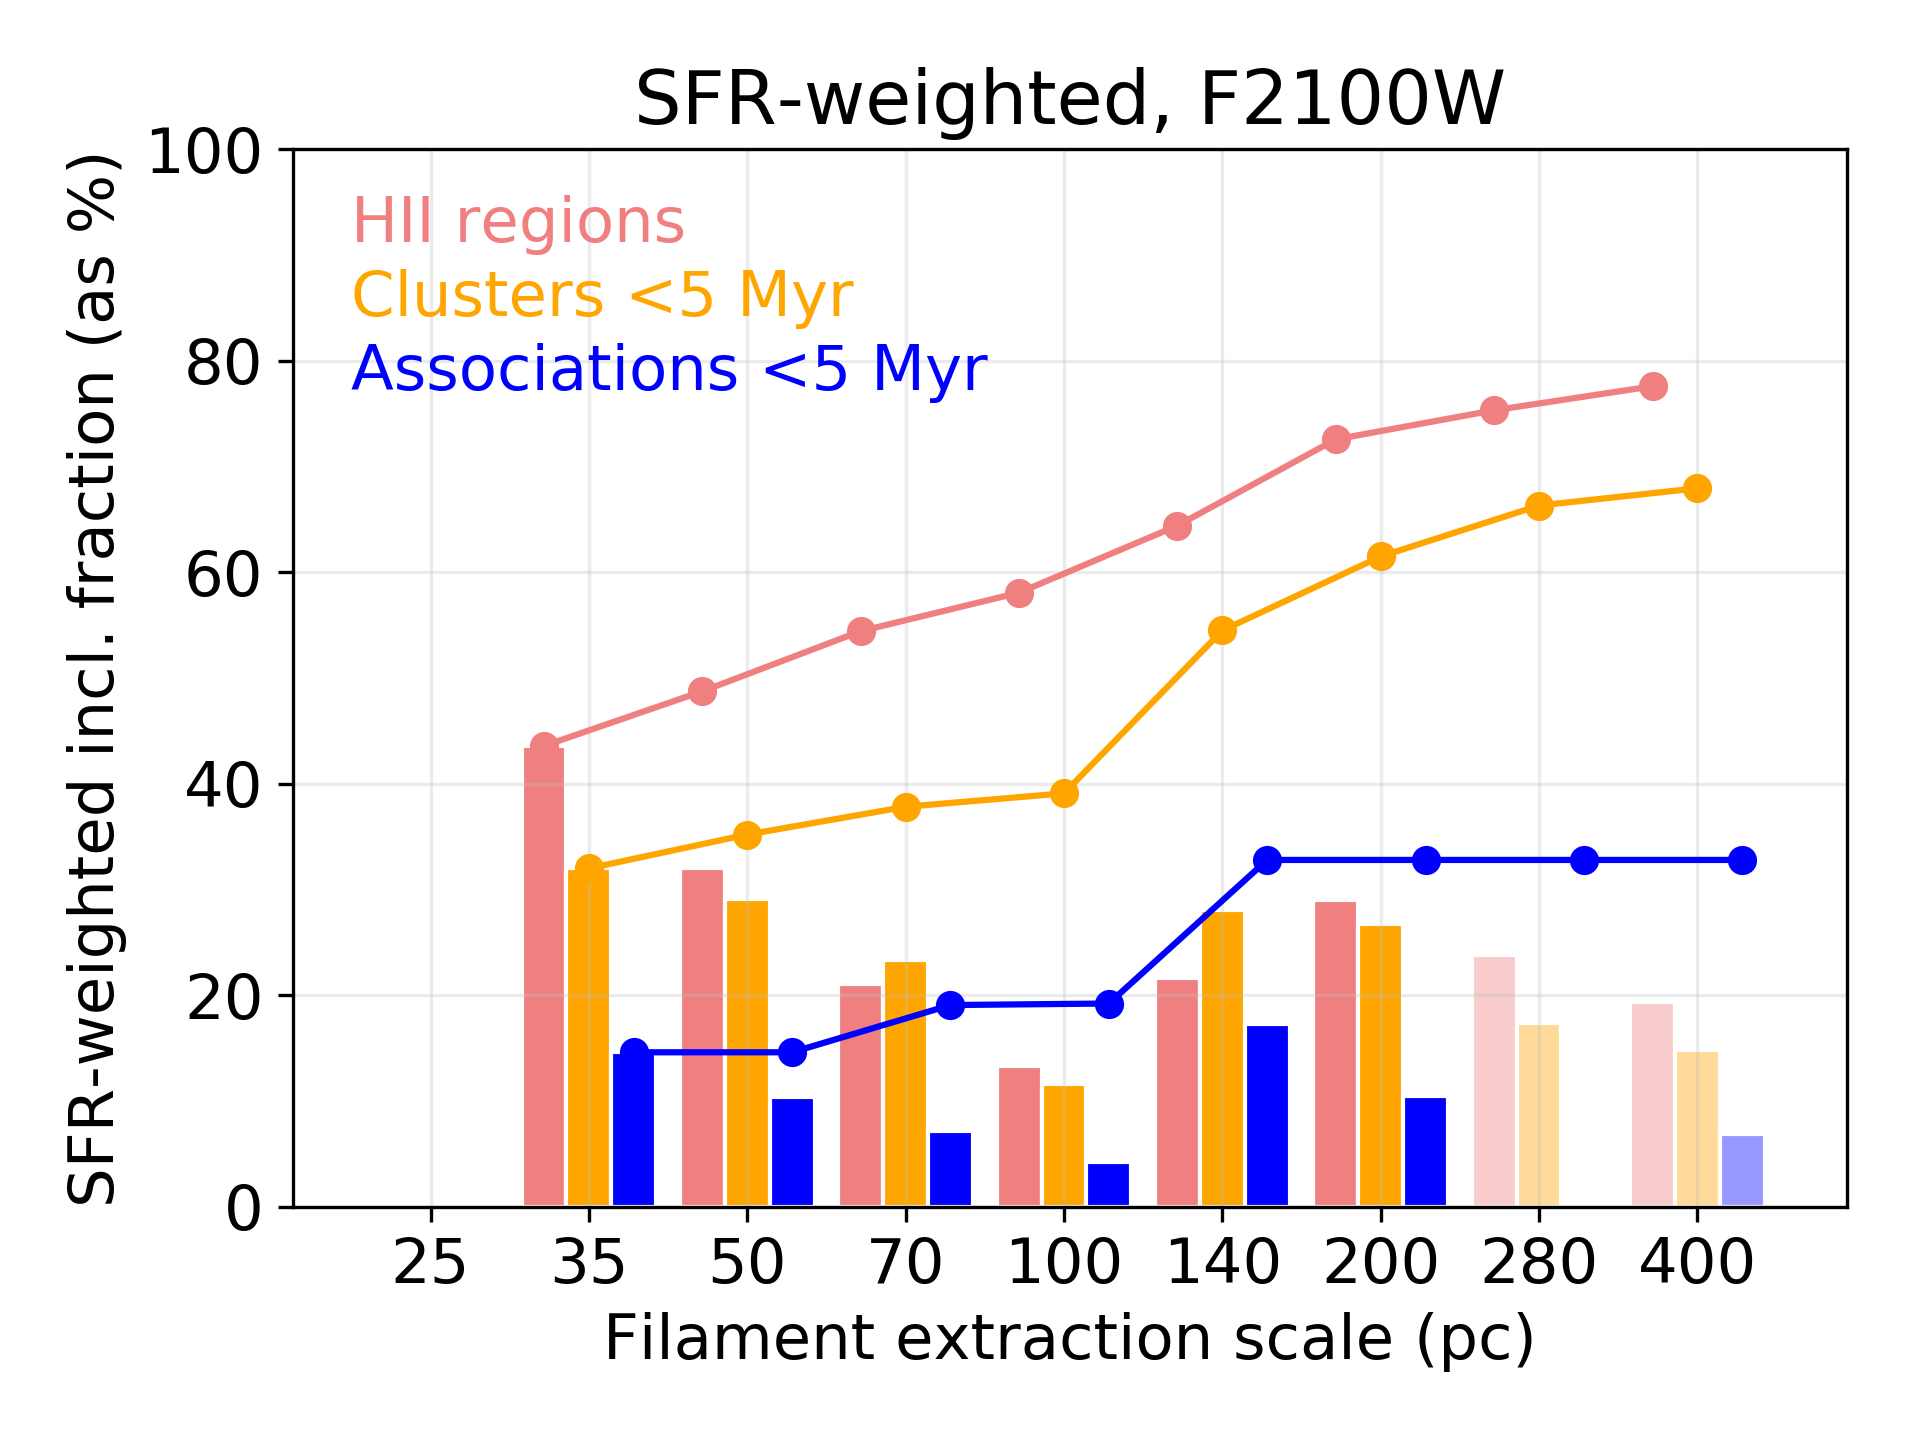
We take a first step toward the goal above by cross-correlating the filament masks with the PHANGS-MUSE H ii regions, plus PHANGS-HST young ( Myr) clusters and associations, described in Sec. 2. With these populations, we measure unweighted inclusion fractions (number of objects contained within the filament mask divided by the total count in the image footprint) and also tracer-weighted inclusion fractions (summing weights corresponding to SFR rather than object counts). For weighting we use extinction corrected L(H), effectively unobscured SFR, for H ii region populations; and M∗ / age effective SFR(5 Myr) for young clusters and associations.
Fig. 8 plots the measured inclusion fractions for each of the test populations. We begin by making general comments about Fig. 8 which are applicable to all panels. We find that the inclusion fractions (at individual scales or cumulatively) are consistently maximized for H ii regions but decline slightly when using young clusters and dramatically using young associations, regardless of scale or band. The inclusion fraction measured at individual filament extraction scales for H ii regions and young clusters ( Myr), decline from a maximum at 25 pc until reaching 70–100 pc. For associations, there is far weaker, if any, dependence on scale over the same range, but an apparent enhancement at 140–200 pc scales. The random inclusion fractions for unweighted measurements (top panels) provide further insight. They indicate strong correlation between dust emission filaments and H ii regions / young clusters, moderate anti-correlation of associations with filaments at scales 100 pc, and increasingly strong correlation of associations with the DFN for extraction scales of 100, 140, and 200 pc. For measurements made with cumulative masks, the inclusion fractions (unweighted and weighted) increase with scale as would be expected. The slope of the cumulative curves in Fig. 8 (top) is consistent with the scale dependence of the randomized control, showing the influence of significant multi-scale mask covering fraction, but normalization is significantly higher (excess over random for H ii regions, 3–6 for young clusters) except for associations. For associations, the small scale signal of anti-correlation dominates until our cumulative measurement finally reaches random equivalence by 200 pc.
The SFR-weighted inclusion fractions Fig. 8 (bottom) are perhaps more physically relevant to the questions raised at the start of this Section. Remarkably, our measurements show about 75% of the SF traced by H ii regions is occurring within the 25 pc scale of the F770W filament network (bottom left), whereas the peak SFR-weighted inclusion fraction for F2100W is 45% (at 35 pc, bottom right). We find the single scale SFR-weighted inclusion fractions are highest overall for F1130W and F1000W at nearly 80% for 25 pc filament extraction (not shown). Perhaps the most striking measurement linking the dust emission filaments to current star formation is the attainment of % SFR-weighted inclusion by our uppermost cumulative scale, 200 pc, for each of F770W, F1000W and F1130W when using the multi-scale masks, and 72% for F2100W.
We anticipated seeing a reduction in inclusion fraction for stellar associations, since, although the associations are young, they are star formation events that have evolved from clusters via disruption/dissolution or were initially formed unbound, and either way seem more likely to have already cleared their environment of dust. However, the anti-correlation observed at small scales is an unexpected demonstration that such feedback actively helps to sculpt the dust into bubble/shell structures (e.g. Watkins et al., in prep.; Barnes et al., subm.).
Work is currently underway to obtain a catalog of PHANGS-ALMA GMCs associated with embedded ( 0 Myr) star formation, indicated by compact F2100W sources coincident with a GMC (Lessing et al., in prep.). When ready, we will compare our dust emission filaments to that population. We emphasize that the F2100W source population does not drive the identification of filaments at due to FilFinder’s transformation of the image intensity scale.
5 SUMMARY AND FUTURE WORK
This paper presents initial exploratory analysis of PHANGS-JWST+HST imaging for NGC 628 revealing its extensive dust filament network (DFN) as seen in both MIR emission and visible attenuation. Our pilot investigation offers insight into extragalactic ISM structure at small scales rarely probed by other tracers, including atomic and molecular gas, with an emphasis on quantifying filaments and associated star formation activity.
Conclusions from our study are as follows:
-
1.
At the smallest extraction scale currently considered (25 pc filament width), the agreement of independently constructed attenuation and emission filament masks is 40%. More so, the detailed morphology of filaments that are detected in both ways is frequently rather well-matched with only minor deviations in shape or extent. We find evidence for emission-only filaments (and portions of filaments) likely on the ‘back side’ of the galaxy disk, but also a less well-understood set of attenuation-only filaments that requires further characterization.
-
2.
No single extraction scale (filament width) provides a complete inventory of all filamentary dust emission structures. Our masks are detecting a morphologically diverse dusty ISM, spanning from very compact filaments to ultimately constituting spiral arm features. We anticipate that the molecular fraction probably declines with increasing scale in this hierarchy, but require higher resolution observations of atomic gas in order to check this.
-
3.
HST reveals candidate features we nickname ‘dust motes’ which are comparatively isolated (lying outside the DFN) and appear as compact ( pc), dark clouds essentially unrecoverable with JWST /MIRI alone due to confusion with dusty stellar point sources. They could trace largely quiescent individual molecular clouds. Regardless of whether candidate ‘dust motes’ are ultimately verified as a bona fide population, HST is capable of probing substructure in dust filaments at smaller scales than MIRI.
-
4.
Approximately one-third of the total MIR flux in F770W, F1000W, F1130W bands is contained in the 25 pc scale mask of the emission filament network, using diffuse background subtracted measurements. The flux fraction determined for the 200 pc limited cumulative multi-scale filament mask is 55–60% in the same bands. The F2100W filament flux fractions are significantly less than the others, with a cumulative measurement of %. This is in-line with Leroy et al. (in prep.) who showed that F2100W correlates less well with CO than the other MIRI bands and that it is not as clean of a tracer of column density.
-
5.
Our filament inclusion fraction analysis shows that 75–80% of the current star formation traced by H ii regions is occurring within the 25 pc scale of the filament network. The analogous measurement for young (5 Myr) clusters is slightly more than 60%. Integrated over cumulative scales up to 200 pc, the H ii region fraction exceeds 95%. Similar analysis demonstrates moderate anti-correlation of associations younger than 5 Myr with dust filaments at scales 100 pc then a reversal to increasingly strong association-filament correlation for extraction scales of 100, 140, and 200 pc.
Expansion and further development of our work to the remaining PHANGS-JWST galaxies will: (a) provide the clarity of an external and diversified perspective which is absent from Galactic studies, and which can allow quantification of trends , (b) enable comparison to increasingly detailed simulations, which can isolate the effects of different ISM structuring mechanisms, (c) constrain the dependence of opacity on dust grain properties, and eventually (d) firmly quantify the division of MIR emission between currently star-forming and evolved stellar populations (related to the work of Belfiore et al., in prep.), with complete accounting of unobscured and embedded star formation (Rodriguez et al., in prep.; Hassani et al., in prep.). The union of JWST and HST dust tracing also motivates targeting for focused high-resolution ALMA follow-up mapping of dense gas. We further emphasize that ngVLA and/or SKA is required to obtain sensitive H i imaging at the substantially better than resolution that is needed to constrain ISM phase changes within the filamentary structures we study.
We plan the following practical improvements to our work in the near term. Attenuation (dust lane) features will be identified on the basis of the complete multi-wavelength PHANGS-HST dataset and at sub-MIRI-resolution scales. We will study the integrated SED of the filament network versus scale, and use FilFinder capabilities to generate catalogs of filament substructures with measured properties (such as length, aspect ratio, curvature, flux, mass per unit length) plus molecular-cloud-linked quantities (velocity gradient, CO velocity dispersion, virial parameter) when a GMC is found to be co-spatial. Such cataloged properties will be ripe for comparison to equivalent quantities measured from simulations. We will assess whether or not embedded star-forming regions tend to be located at the intersection of filament spines, as they do in simulations. of dust emission and attenuation filament network substructures versus physical condition metrics (e.g. Sun et al., 2022) of the local (kpc-scale) environment.
Acknowledgements
This work was carried out as part of the PHANGS collaboration. Based on observations made with the NASA/ESA/CSA JWST and Hubble Space Telescopes. The data were obtained from the Mikulski Archive for Space Telescopes at the Space Telescope Science Institute, which is operated by the Association of Universities for Research in Astronomy, Inc., under NASA contract NAS 5-03127 for JWST and NASA contract NAS 5-26555 for HST. The JWST observations are associated with program 2107, and those from HST with program 15454 Based on observations collected at the European Southern Observatory under ESO programmes 094.C-0623 (PI: Kreckel), 095.C-0473, 098.C-0484 (PI: Blanc), 1100.B-0651 (PHANGS-MUSE; PI: Schinnerer), as well as 094.B-0321 (MAGNUM; PI: Marconi), 099.B-0242, 0100.B-0116, 098.B-0551 (MAD; PI: Carollo) and 097.B-0640 (TIMER; PI: Gadotti). We acknowledge the usage of the SAO/NASA Astrophysics Data System666http://www.adsabs.harvard.edu. D.A.T. acknowledges funding support from STScI via JWST-GO-02107.002-A. E.W.K. acknowledges support from the Smithsonian Institution as a Submillimeter Array (SMA) Fellow and the Natural Sciences and Engineering Research Council of Canada. J.M.D.K. gratefully acknowledges funding from the European Research Council (ERC) under the European Union’s Horizon 2020 research and innovation programme via the ERC Starting Grant MUSTANG (grant agreement number 714907). COOL Research DAO is a Decentralized Autonomous Organization supporting research in astrophysics aimed at uncovering our cosmic origins. E.J.W. acknowledges the funding provided by the Deutsche Forschungsgemeinschaft (DFG, German Research Foundation) – Project-ID 138713538 – SFB 881 (“The Milky Way System”, subproject P1). M.C. gratefully acknowledges funding from the DFG through an Emmy Noether Research Group (grant number CH2137/1-1). M.B. acknowledges support from FONDECYT regular grant 1211000 and by the ANID BASAL project FB210003. T.G.W. and E.S. acknowledge funding from the European Research Council (ERC) under the European Union’s Horizon 2020 research and innovation programme (grant agreement No. 694343). E.R. acknowledges the support of the Natural Sciences and Engineering Research Council of Canada (NSERC), funding reference number RGPIN-2022-03499. F.B. would like to acknowledge funding from the European Research Council (ERC) under the European Union’s Horizon 2020 research and innovation programme (grant agreement No.726384/Empire) K.G. is supported by the Australian Research Council through the Discovery Early Career Researcher Award (DECRA) Fellowship DE220100766 funded by the Australian Government. K.G. is supported by the Australian Research Council Centre of Excellence for All Sky Astrophysics in 3 Dimensions (ASTRO 3D), through project number CE170100013. R.S.K. acknowledges financial support from the European Research Council via the ERC Synergy Grant “ECOGAL” (project ID 855130), from the Deutsche Forschungsgemeinschaft (DFG) via the Collaborative Research Center “The Milky Way System” (SFB 881 – funding ID 138713538 – subprojects A1, B1, B2 and B8) and from the Heidelberg Cluster of Excellence (EXC 2181 - 390900948) “STRUCTURES”, funded by the German Excellence Strategy. R.S.K. also thanks the German Ministry for Economic Affairs and Climate Action for funding in the project “MAINN” (funding ID 50OO2206). G.A.B. acknowledges the support from ANID Basal project FB210003. M.Q. acknowledges support from the Spanish grant PID2019-106027GA-C44, funded by MCIN/AEI/10.13039/501100011033. E.C. acknowledges support from ANID Basal projects ACE210002 and FB210003. S.D. is supported by funding from the European Research Council (ERC) under the European Union’s Horizon 2020 research and innovation programme (grant agreement no. 101018897 CosmicExplorer). K.K. and O.E. gratefully acknowledge funding from DFG in the form of an Emmy Noether Research Group (grant number KR4598/2-1, PI Kreckel).
Appendix A Dust filament masks versus band and extraction scale
In to permit examination of the extracted dust filaments with respect to the JWST and HST data, we present the filament masks as a Figure Set. They are displayed first for F770W, then F2100W, and lastly HST B-band. We show the filaments as transparent colored areas on the associated JWST or HST image. For each band, we present all of the individual scale filament masks in order of increasing extraction scale, followed by the cumulative multi-scale masks.
Fig. Set1. Dust filament masks
References
- Anand et al. (2021a) Anand, G. S., Rizzi, L., Tully, R. B., et al. 2021a, AJ, 162, 80, doi: 10.3847/1538-3881/ac0440
- Anand et al. (2021b) Anand, G. S., Lee, J. C., Van Dyk, S. D., et al. 2021b, MNRAS, 501, 3621, doi: 10.1093/mnras/staa3668
- André et al. (2014) André, P., Di Francesco, J., Ward-Thompson, D., et al. 2014, in Protostars and Planets VI, ed. H. Beuther, R. S. Klessen, C. P. Dullemond, & T. Henning, 27, doi: 10.2458/azu_uapress_9780816531240-ch002
- André et al. (2010) André, P., Men’shchikov, A., Bontemps, S., et al. 2010, A&A, 518, L102, doi: 10.1051/0004-6361/201014666
- Astropy Collaboration et al. (2013) Astropy Collaboration, Robitaille, T. P., Tollerud, E. J., et al. 2013, A&A, 558, A33, doi: 10.1051/0004-6361/201322068
- Astropy Collaboration et al. (2018) Astropy Collaboration, Price-Whelan, A. M., Sipőcz, B. M., et al. 2018, AJ, 156, 123, doi: 10.3847/1538-3881/aabc4f
- Baldwin et al. (1981) Baldwin, J. A., Phillips, M. M., & Terlevich, R. 1981, PASP, 93, 5, doi: 10.1086/130766
- Barmby et al. (2006) Barmby, P., Ashby, M. L. N., Bianchi, L., et al. 2006, ApJ, 650, L45, doi: 10.1086/508626
- Barnes et al. (subm.) Barnes, A., Watkins, E., et al. subm., ApJ
- Belfiore et al. (in prep.) Belfiore, F., et al. in prep., A&A
- Boquien et al. (2019) Boquien, M., Burgarella, D., Roehlly, Y., et al. 2019, A&A, 622, A103, doi: 10.1051/0004-6361/201834156
- Boquien et al. (2016) Boquien, M., Kennicutt, R., Calzetti, D., et al. 2016, A&A, 591, A6, doi: 10.1051/0004-6361/201527759
- Bradley et al. (2022) Bradley, L., Sipőcz, B., Robitaille, T., et al. 2022, astropy/photutils: 1.5.0, 1.5.0, Zenodo, Zenodo, doi: 10.5281/zenodo.6825092
- Buta et al. (2015) Buta, R. J., Sheth, K., Athanassoula, E., et al. 2015, ApJS, 217, 32, doi: 10.1088/0067-0049/217/2/32
- Calzetti (2013) Calzetti, D. 2013, in Secular Evolution of Galaxies, ed. J. Falcón-Barroso & J. H. Knapen, 419
- Calzetti et al. (2015) Calzetti, D., Lee, J. C., Sabbi, E., et al. 2015, AJ, 149, 51, doi: 10.1088/0004-6256/149/2/51
- Crocker et al. (2013) Crocker, A. F., Calzetti, D., Thilker, D. A., et al. 2013, ApJ, 762, 79, doi: 10.1088/0004-637X/762/2/79
- Dong et al. (2016) Dong, H., Li, Z., Wang, Q. D., et al. 2016, MNRAS, 459, 2262, doi: 10.1093/mnras/stw778
- Duarte-Cabral et al. (2015) Duarte-Cabral, A., Acreman, D. M., Dobbs, C. L., et al. 2015, MNRAS, 447, 2144, doi: 10.1093/mnras/stu2586
- Duarte-Cabral & Dobbs (2017) Duarte-Cabral, A., & Dobbs, C. L. 2017, MNRAS, 470, 4261, doi: 10.1093/mnras/stx1524
- Emsellem et al. (2022) Emsellem, E., Schinnerer, E., Santoro, F., et al. 2022, A&A, 659, A191, doi: 10.1051/0004-6361/202141727
- Goodman et al. (2014) Goodman, A. A., Alves, J., Beaumont, C. N., et al. 2014, ApJ, 797, 53, doi: 10.1088/0004-637X/797/1/53
- Groves et al. (subm.) Groves, B., et al. subm., MNRAS
- Hacar et al. (2022) Hacar, A., Clark, S., Heitsch, F., et al. 2022, arXiv e-prints, arXiv:2203.09562. https://arxiv.org/abs/2203.09562
- Harris et al. (2020) Harris, C. R., Millman, K. J., van der Walt, S. J., et al. 2020, Nature, 585, 357, doi: 10.1038/s41586-020-2649-2
- Hassani et al. (in prep.) Hassani, H., et al. in prep., ApJ
- Hinz et al. (2004) Hinz, J. L., Rieke, G. H., Gordon, K. D., et al. 2004, ApJS, 154, 259, doi: 10.1086/422558
- Hoversten et al. (2011) Hoversten, E. A., Gronwall, C., Vanden Berk, D. E., et al. 2011, AJ, 141, 205, doi: 10.1088/0004-6256/141/6/205
- Hunter (2007) Hunter, J. D. 2007, Computing in Science & Engineering, 9, 90, doi: 10.1109/MCSE.2007.55
- Jackson et al. (2010) Jackson, J. M., Finn, S. C., Chambers, E. T., Rathborne, J. M., & Simon, R. 2010, ApJ, 719, L185, doi: 10.1088/2041-8205/719/2/L185
- Jeffreson et al. (2020) Jeffreson, S. M. R., Kruijssen, J. M. D., Keller, B. W., Chevance, M., & Glover, S. C. O. 2020, MNRAS, 498, 385, doi: 10.1093/mnras/staa2127
- Koch & Rosolowsky (2015) Koch, E. W., & Rosolowsky, E. W. 2015, MNRAS, 452, 3435, doi: 10.1093/mnras/stv1521
- Kumari et al. (2020) Kumari, N., Irwin, M. J., & James, B. L. 2020, A&A, 634, A24, doi: 10.1051/0004-6361/201732467
- La Vigne et al. (2006) La Vigne, M. A., Vogel, S. N., & Ostriker, E. C. 2006, ApJ, 650, 818, doi: 10.1086/506589
- Lang et al. (2020) Lang, P., Meidt, S. E., Rosolowsky, E., et al. 2020, ApJ, 897, 122, doi: 10.3847/1538-4357/ab9953
- Larson et al. (subm.) Larson, K., et al. subm., MNRAS
- Lee et al. (in prep.) Lee, J., et al. in prep., ApJ
- Lee et al. (2022) Lee, J. C., Whitmore, B. C., Thilker, D. A., et al. 2022, ApJS, 258, 10, doi: 10.3847/1538-4365/ac1fe5
- Leike et al. (2020) Leike, R. H., Glatzle, M., & Enßlin, T. A. 2020, A&A, 639, A138, doi: 10.1051/0004-6361/202038169
- Leroy et al. (in prep.) Leroy, A., et al. in prep., ApJ
- Leroy et al. (2012) Leroy, A. K., Bigiel, F., de Blok, W. J. G., et al. 2012, AJ, 144, 3, doi: 10.1088/0004-6256/144/1/3
- Leroy et al. (2021) Leroy, A. K., Hughes, A., Liu, D., et al. 2021, ApJS, 255, 19, doi: 10.3847/1538-4365/abec80
- Lessing et al. (in prep.) Lessing, R., Thilker, D. A., et al. in prep., MNRAS
- Liu et al. (2011) Liu, G., Koda, J., Calzetti, D., Fukuhara, M., & Momose, R. 2011, ApJ, 735, 63, doi: 10.1088/0004-637X/735/1/63
- Lonsdale Persson & Helou (1987) Lonsdale Persson, C. J., & Helou, G. 1987, ApJ, 314, 513, doi: 10.1086/165082
- Meidt et al. (in prep.) Meidt, S., et al. in prep., ApJ
- Pineda et al. (2022) Pineda, J. E., Arzoumanian, D., André, P., et al. 2022, arXiv e-prints, arXiv:2205.03935. https://arxiv.org/abs/2205.03935
- Ragan et al. (2014) Ragan, S. E., Henning, T., Tackenberg, J., et al. 2014, A&A, 568, A73, doi: 10.1051/0004-6361/201423401
- Rodriguez et al. (in prep.) Rodriguez, J., et al. in prep., ApJ
- Sandstrom et al. (in prep.) Sandstrom, K., et al. in prep., ApJ
- Santoro et al. (2022) Santoro, F., Kreckel, K., Belfiore, F., et al. 2022, A&A, 658, A188, doi: 10.1051/0004-6361/202141907
- Smith et al. (2014) Smith, R. J., Glover, S. C. O., Clark, P. C., Klessen, R. S., & Springel, V. 2014, MNRAS, 441, 1628, doi: 10.1093/mnras/stu616
- Smith et al. (2020) Smith, R. J., Treß, R. G., Sormani, M. C., et al. 2020, MNRAS, 492, 1594, doi: 10.1093/mnras/stz3328
- Soler et al. (2020) Soler, J. D., Beuther, H., Syed, J., et al. 2020, A&A, 642, A163, doi: 10.1051/0004-6361/202038882
- Sun et al. (2022) Sun, J., Leroy, A. K., Rosolowsky, E., et al. 2022, AJ, 164, 43, doi: 10.3847/1538-3881/ac74bd
- Syed et al. (2022) Syed, J., Soler, J. D., Beuther, H., et al. 2022, A&A, 657, A1, doi: 10.1051/0004-6361/202141265
- Thilker et al. (2022) Thilker, D. A., Whitmore, B. C., Lee, J. C., et al. 2022, MNRAS, 509, 4094, doi: 10.1093/mnras/stab3183
- Thilker et al. (in prep.) Thilker, D. A., et al. in prep., MNRAS
- Tress et al. (2020) Tress, R. G., Sormani, M. C., Glover, S. C. O., et al. 2020, MNRAS, 499, 4455, doi: 10.1093/mnras/staa3120
- Treß et al. (2021) Treß, R. G., Sormani, M. C., Smith, R. J., et al. 2021, MNRAS, 505, 5438, doi: 10.1093/mnras/stab1683
- Turner et al. (2021) Turner, J. A., Dale, D. A., Lee, J. C., et al. 2021, MNRAS, 502, 1366, doi: 10.1093/mnras/stab055
- Verley et al. (2009) Verley, S., Corbelli, E., Giovanardi, C., & Hunt, L. K. 2009, A&A, 493, 453, doi: 10.1051/0004-6361:200810566
- Verley et al. (2007) Verley, S., Hunt, L. K., Corbelli, E., & Giovanardi, C. 2007, A&A, 476, 1161, doi: 10.1051/0004-6361:20078179
- Watkins et al. (in prep.) Watkins, E., et al. in prep., ApJ
- Zucker et al. (2015) Zucker, C., Battersby, C., & Goodman, A. 2015, ApJ, 815, 23, doi: 10.1088/0004-637X/815/1/23
- Zucker et al. (2018) —. 2018, ApJ, 864, 153, doi: 10.3847/1538-4357/aacc66