Photochemical origin of SiC2 in the circumstellar envelope of carbon-rich AGB stars revealed by ALMA
Abstract
1
Whether SiC2 is a parent species, that is formed in the photosphere or as a by-product of high-temperature dust formation, or a daughter species, formed in a chemistry driven by the photodestruction of parent species in the outer envelope, has been debated for a long time. Here, we analyze the ALMA observations of four SiC2 transitions in the CSEs of three C-rich AGB stars (AI Vol, II Lup, and RAFGL 4211), and found that SiC2 exhibits an annular, shell-like distribution in these targets, suggesting that SiC2 can be a daughter species in the CSEs of carbon-rich AGB stars. The results can provide important references for future chemical models.
2 Keywords:
AGB stars, circumstellar envelope(CSEs), daughter species, mass loss, column density
3 Introduction
Late evolutionary stars with masses between 0.8 and 8 (Höfner and Olofsson, 2018) experience dramatic mass losses. The stellar wind continues to eject material outward, eventually forming a circumstellar envelope (CSE), often referred to as the molecular space factory. According to different C/O ratios, asymptotic giant branch (AGB) stars are divided into three classes: O-rich AGB stars (oxygen-rich, C/O 1), S-type AGB stars (C/O 1), and C-rich AGB stars (carbon-rich, C/O 1). Over 105 molecular species have been detected in the circumstellar envelope of the evolved stars (Decin, 2021). These species, distributed in different areas of the CSEs, can help us to trace shell properties, such as local temperature and gas composition, and help us to understand the chemical synthesis within the objects. A large number of carbon-bearing species are observed to be abundant surrounding the carbon stars, for instance, CO, CS, HC3N, and C2H, some of which come from the inner layers of the CSEs, and some are formed in the outer regions (Decin et al., 2008; Li et al., 2016).
The silacyclopropynylidene (SiC2) was first detected and confirmed in IRC+10216 by Thaddeus et al. (1984) who derived a fairly large column density, 1.5 1014 cm-2. Glassgold et al. (1986) suggested that SiC2 was formed by the reaction of Si+ with C2H2 or C2H followed by dissociative recombination with electrons. Glassgold et al. (1991) suggested alternative pathways, initiated by reactions of SiS with C2H or C2H. All these routes need the presence of UV photons to form cations and radicals, and thus treat SiC2 as a daughter species.
The spatial distribution of SiC2 in IRC+10216 was discussed by Takano et al. (1992) and Guelin et al. (1993) who showed that it showed a spherical shell-like structure indicative of a daughter species. Lucas et al. (1995) and Gensheimer et al. (1995) used the Plateau de Bure and Berkeley Illinois Maryland Array (BIMA), respectively, to map SiC2 emission, showing that it had a shell structure. The first confirmation that SiC2 was present close to the star came from Cernicharo et al. (2010) who used the Herschel Space Observatory to detect some 55 transitions from energy levels 500-900 K above ground state, implying that SiC2 was present in the dust-forming zone. Subsequently Fonfría et al. (2014), using the CARMA interferometer, and Prieto et al. (2015) using Atacama Large Millimeter Array (ALMA) detected emission from both the central region and the outer shell.
In a work devoted to single-dish observations of 25 C-rich AGB stars (Massalkhi et al., 2018), SiC2 and SiC were detected in about half of the sources. They found that the abundance of SiC2 decreased with increasing envelope density increasing envelope density, indicating that SiC2 is a parent species in these CSEs. This finding confirms SiC2 to be a parent species in CSE. De Beck and Olofsson (2020) detected SiC2 in S-type AGB star W Aql, and they showed that the emission occurs in a ring of radius 1-2′′.
Most evidence shows that SiC2 is formed in LTE conditions close to the star, although IRC+10216 has an increase in abundance of SiC2 at around 10′′ indicating an additional formation in the outer regions of CSE. To date, no millimeter-wave interferometric array observation of SiC2 have been published in CSE of C-rich AGB stars other than IRC+10216. In this work, we provide evidence that SiC2 seems to be a daughter molecule through high-resolution observations of three C-rich AGB stars. We describe the observations in Sect.4. The results are discussed in Sect.5. The conclusions are presented in Sect.6. The spatial distribution and the fractional abundance of SiC2 in AI Vol together with transition in RAFGL 4211 are discussed in the main paper, while the rest of the results are presented in the Supplementary Material.
4 Observations
Observations were made using an ALMA 12 m array. The spectral line observations in Band 3 of AI Vol, RAFGL 4211, and II Lup covering four Windows with a bandwidth of 2 GHz were performed on 2015 August 16 (2013.1.00070.S, PI: Nyman, Lars-ke). The data was extracted from ALMA Archive111https://almascience.nao.ac.jp/aq. For AI Vol, the configuration used for observation is a 12 m main array, baselines: 21 - 783 m. The image cube per spw averages every 2 488 kHz channels. The rms requirement is 3 mJy per 1 arcsec beam, per 0.9 MHz ( 2.7 km s-1). The synthesized rms is 1.3 mJy/beam, and the synthesized beam is 1.4′′ 0.9′′. The parameters of the observed transitions are collected in Table 2. The frequency resolution during observation is 1128.9984 kHz, corresponding to the velocity resolution of 2.526 3.122 km s-1. The wide frequency range covers four lines of SiC2 (, , , and ).
AI Vol, RAFGL 4211, and II Lup are all carbon-rich AGB stars with mass loss. A survey conducted by Smith et al. (2015) at the 3 mm band revealed that the three carbon-rich stars possess abundant molecules, and the sensitive detection of molecular spatial distributions relies on more advanced telescopes such as ALMA. In this study, we present the physical parameters taken from the literature and the synthesized beam for the observed sources, which are listed in Table 1.
The imaging process of the calibrated data was performed using CASA 4.3.1222https://casa.nrao.edu/ software manually. The “clean” task was employed, and to achieve a balance between spatial resolution and noise gain in the resulting image, the Briggs weighting function was applied along with adjustments to the “robust” parameter of 0.5. The rms was calculated near the center of the field, excluding all emissions within the region. The rms values for all channel maps were obtained using the task “imstat” in CASA software. Each pixel on the image plane corresponded to a size of 0.2 arcseconds. Then we used Python software to map and analyze ALMA product data. To calculate the molecular column density, we employed the shell fitting in the GILDAS software333http://www.iram.fr/IRAMFR/GILDAS, along with the splatalogue 444https://splatalogue.online//advanced.php and the CDMS databases555http://www.astro.uni-koeln.de/cdms/catalog (Müller et al., 2005).
5 Result
5.1 Spatial distribution of SiC2
We obtained four transitions of SiC2 in each source, except for the transition, which was not observed in II Lup. Based on the from Table 4, the transition of SiC2 in the 3 mm wavelength range ranked third in terms of signal intensity. However, we did not detect any signal. Our data were obtained from the ALMA Archive, and from the data information, we found that the other three transitions of SiC2 and the data from the two additional sources had map sizes of 800 800 or 640 640 pixels. In contrast, the data without signal detection only covered a map size of 300 300 pixels. We speculate that there may have been some unknown special circumstances during the observations that led to the absence of signal.
AI Vol does not have the strongest spectral line signal, but the signal-to-noise ratio of spatial brightness distribution is higher than that of the other two stars. Cernicharo et al. (2015) have reported the observations and model results of a C-rich AGB star, IRC+10216. They suggest that a companion star may explain the spiral structure of its CSE. Lykou et al. (2018) reported spiral structures of several parent molecules in II Lup, suggesting that the companion star is the main forming mechanism of mass loss. The results show that the spectral line signal of AI Vol is stronger than RAFGL 4211 (in Figures 6 and A9). In order to get reliable results, we concentrate on analyzing the distribution around the center star of AI Vol (in Sect. 5.1.1). The rotational diagrams method was used to calculate fractional abundance, and the detailed analysis is presented in Sect. 5.2.
5.1.1 AI Vol
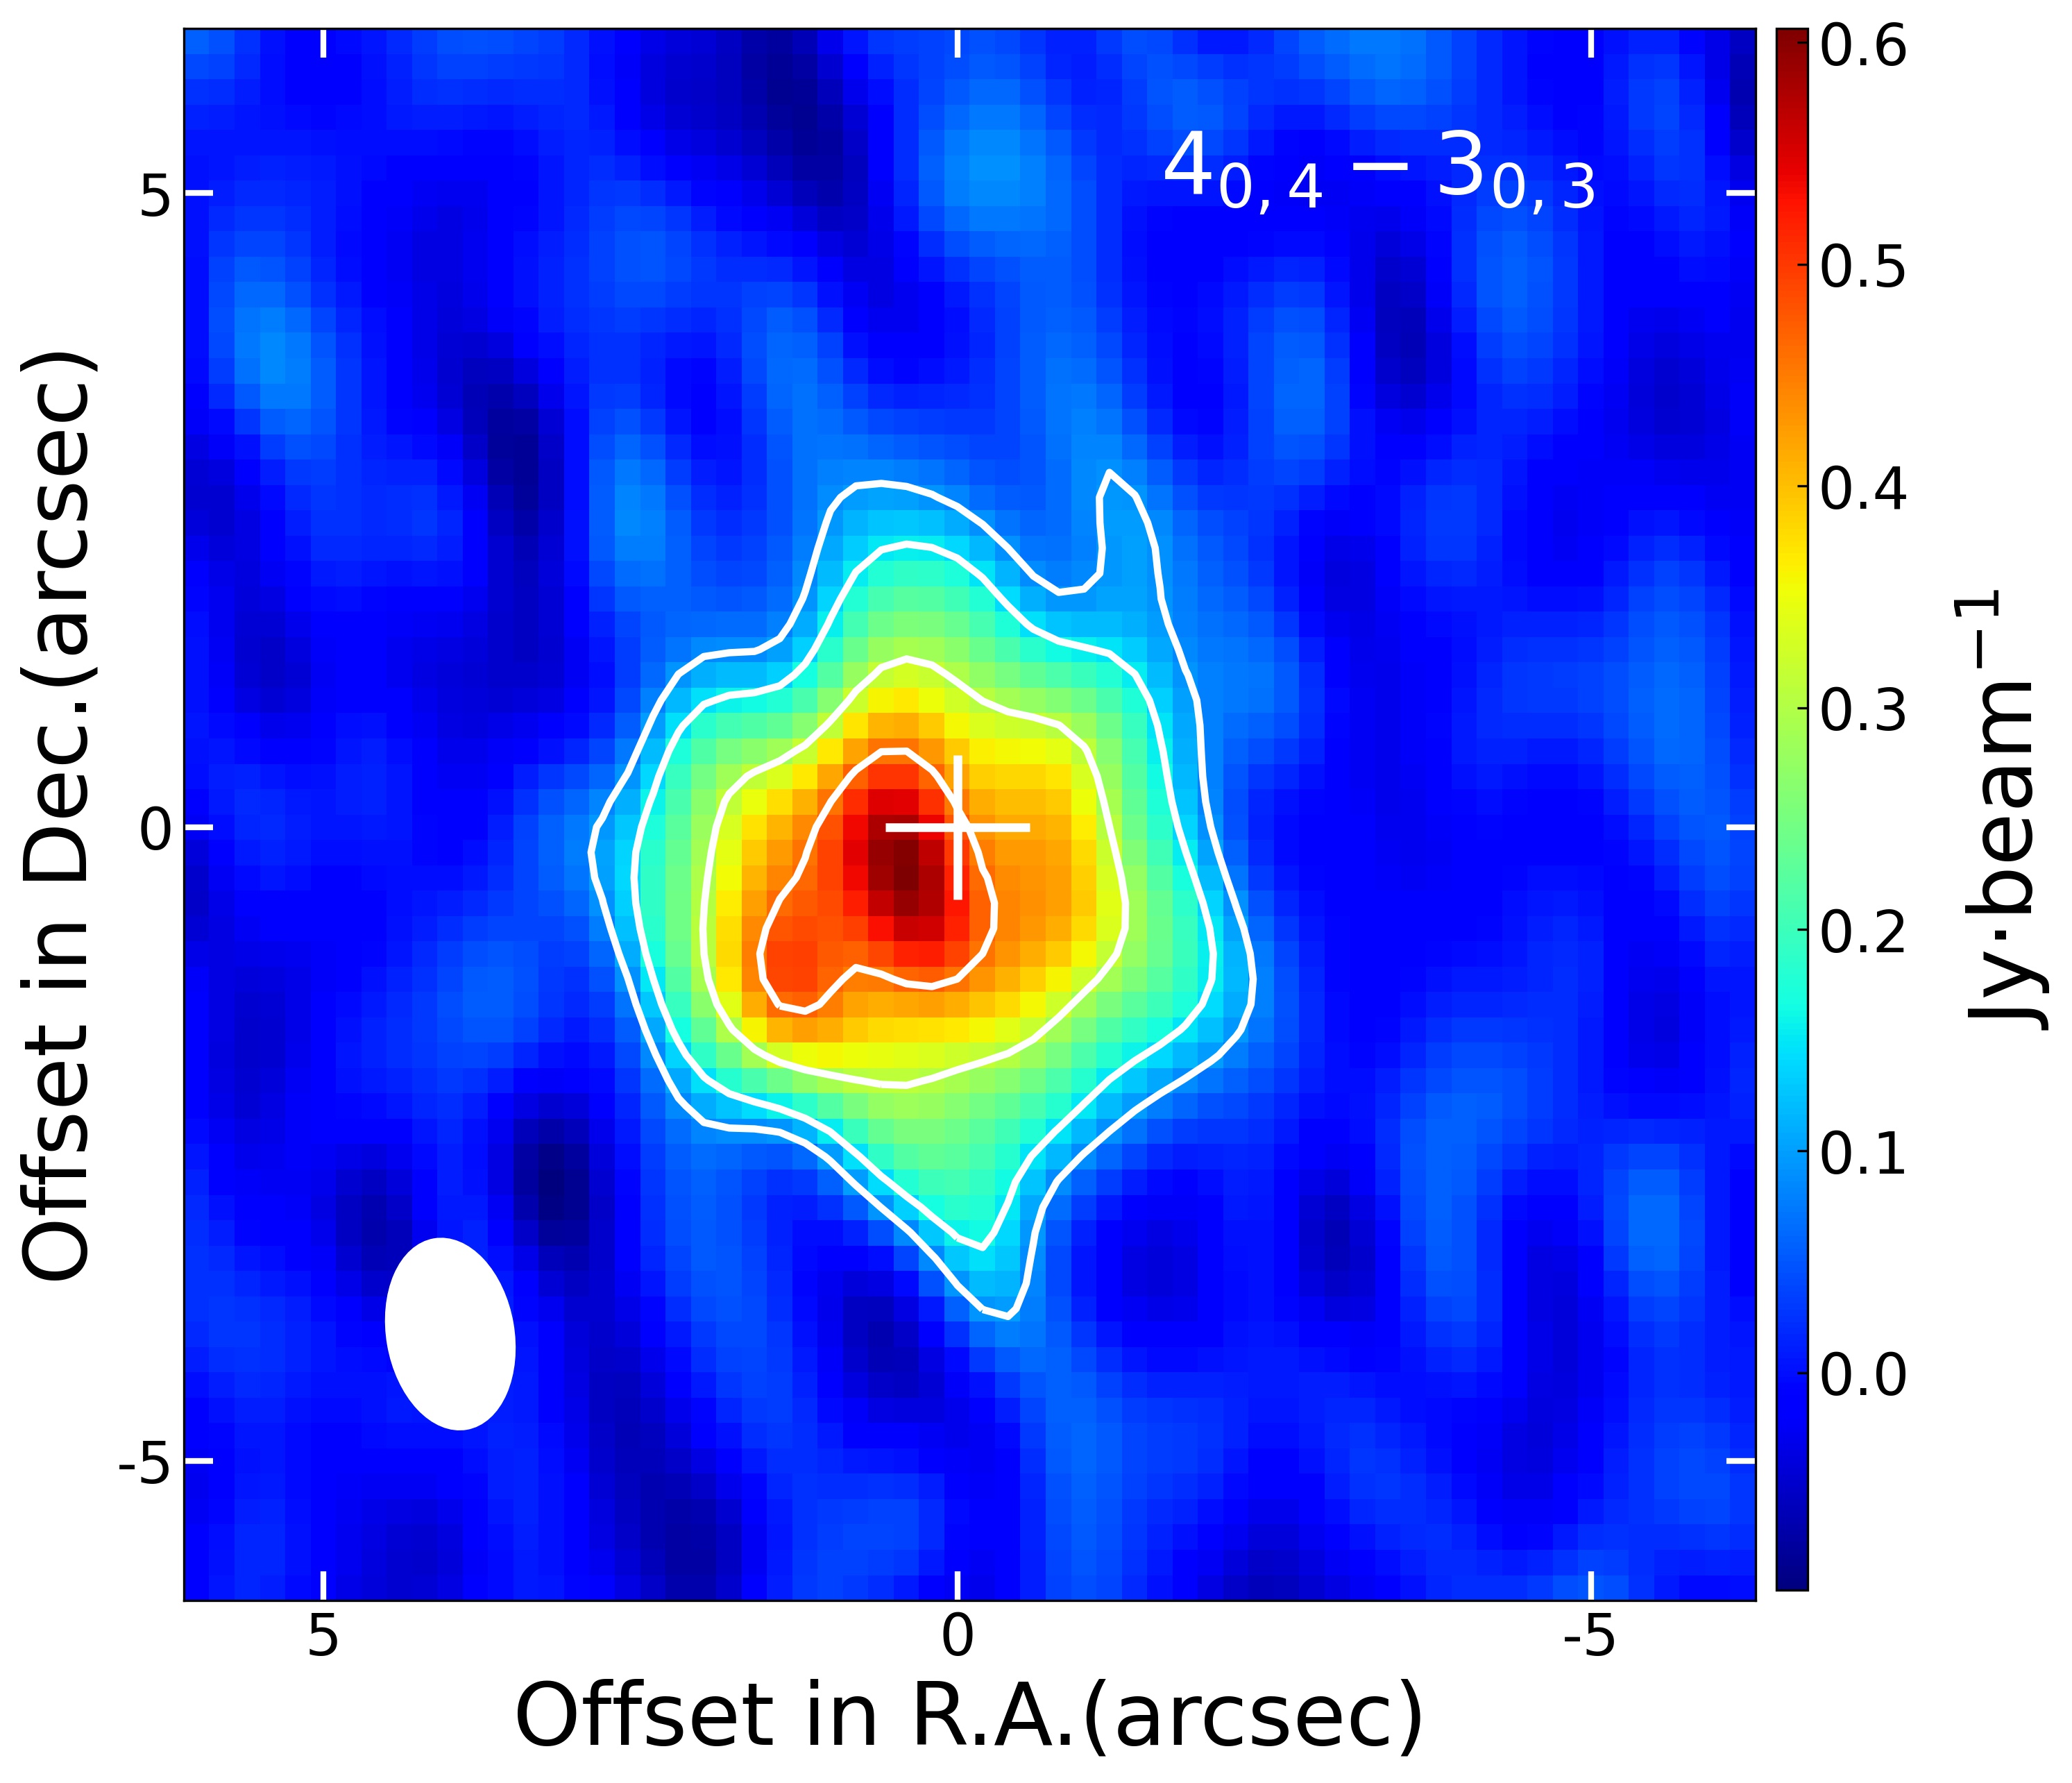
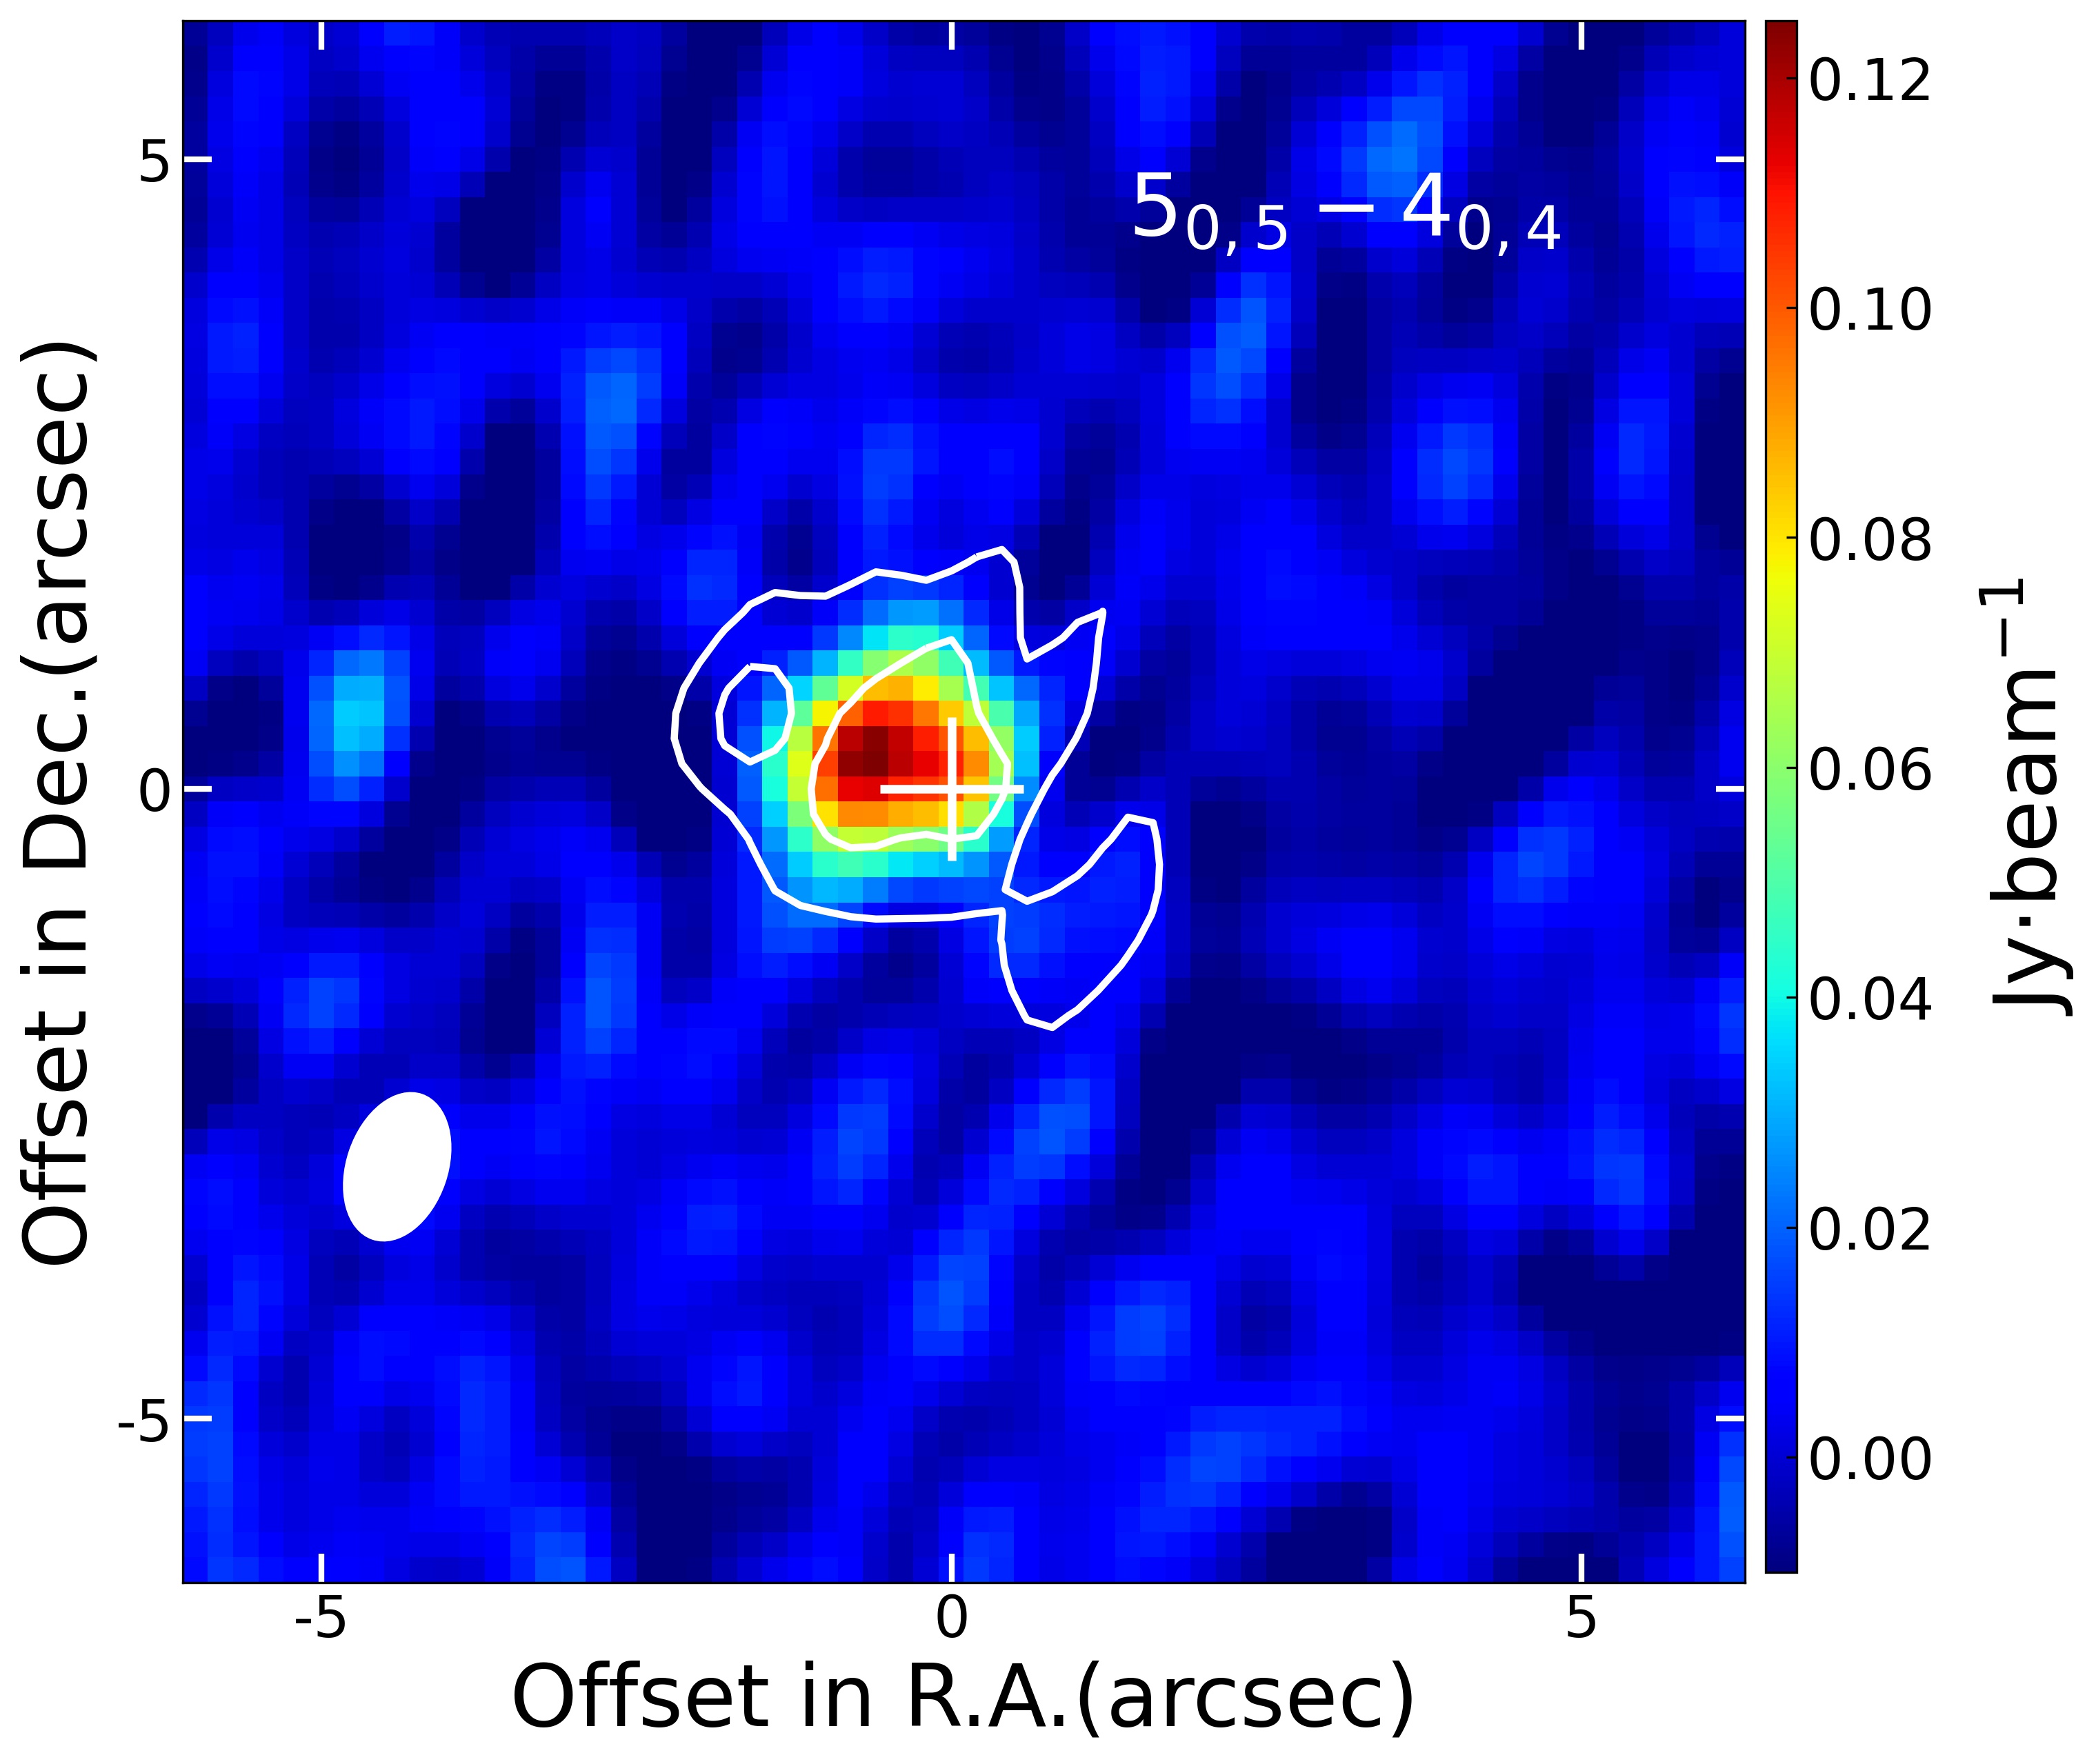
Figures 1 and 2 shows SiC2 ( and ) radial velocity channel map toward C-rich AGB star AI Vol (The other transitions are shown in Figures (A1 and A2)). Around the local standard of rest velocity of AI Vol (-39 km s-1), SiC2 shows a ring distribution around the center star with a diameter of 4-6′′ ( 2840.95 4258.08 au), and the signal strength reaches 20.4 and 13.7 for and transitions. Based on the images presented by Decin et al. (2015), it is evident that the parent molecules, such as SiO, exhibit a concentrated distribution within a compact structure surrounding the central star. In contrast, our observation reveals a characteristic pattern specific to the daughter molecules, distributed in hollow rings around the star (Agúndez et al., 2015, 2017). The brightness distributions of Figures 1 and 2 under different velocity components are all coming from the transitions ( and ), without spatial extension caused by the fine structure.
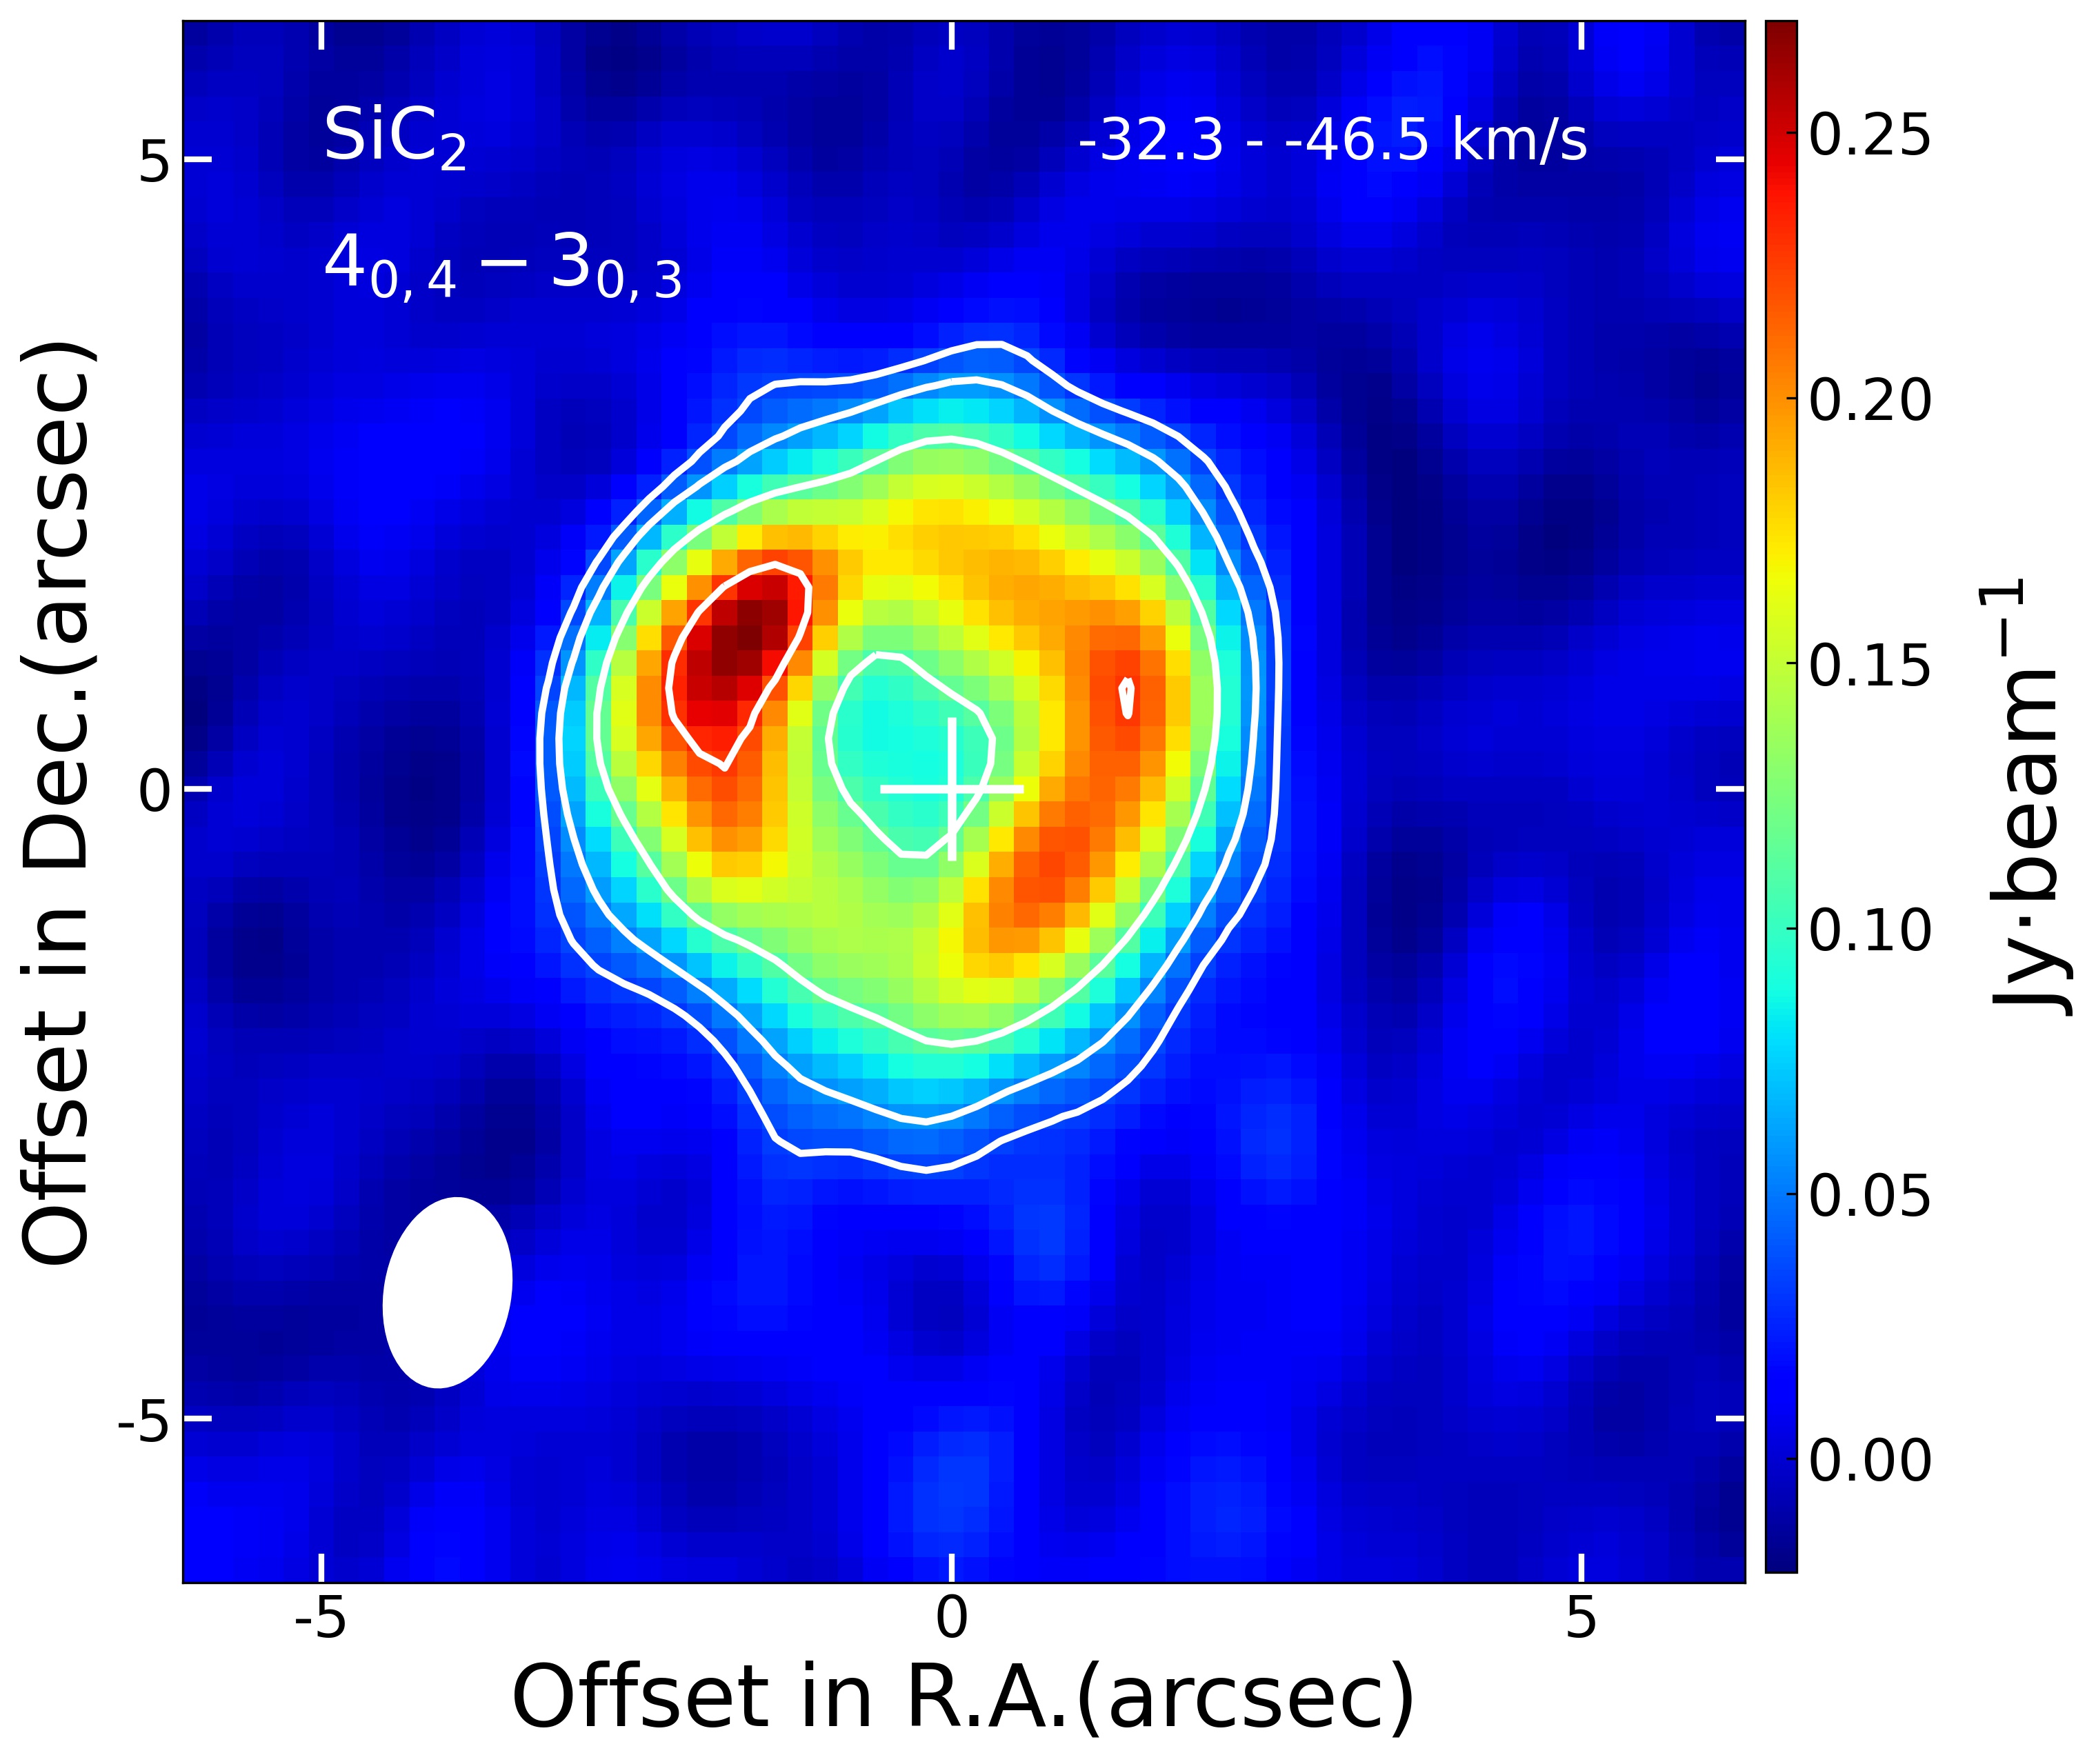
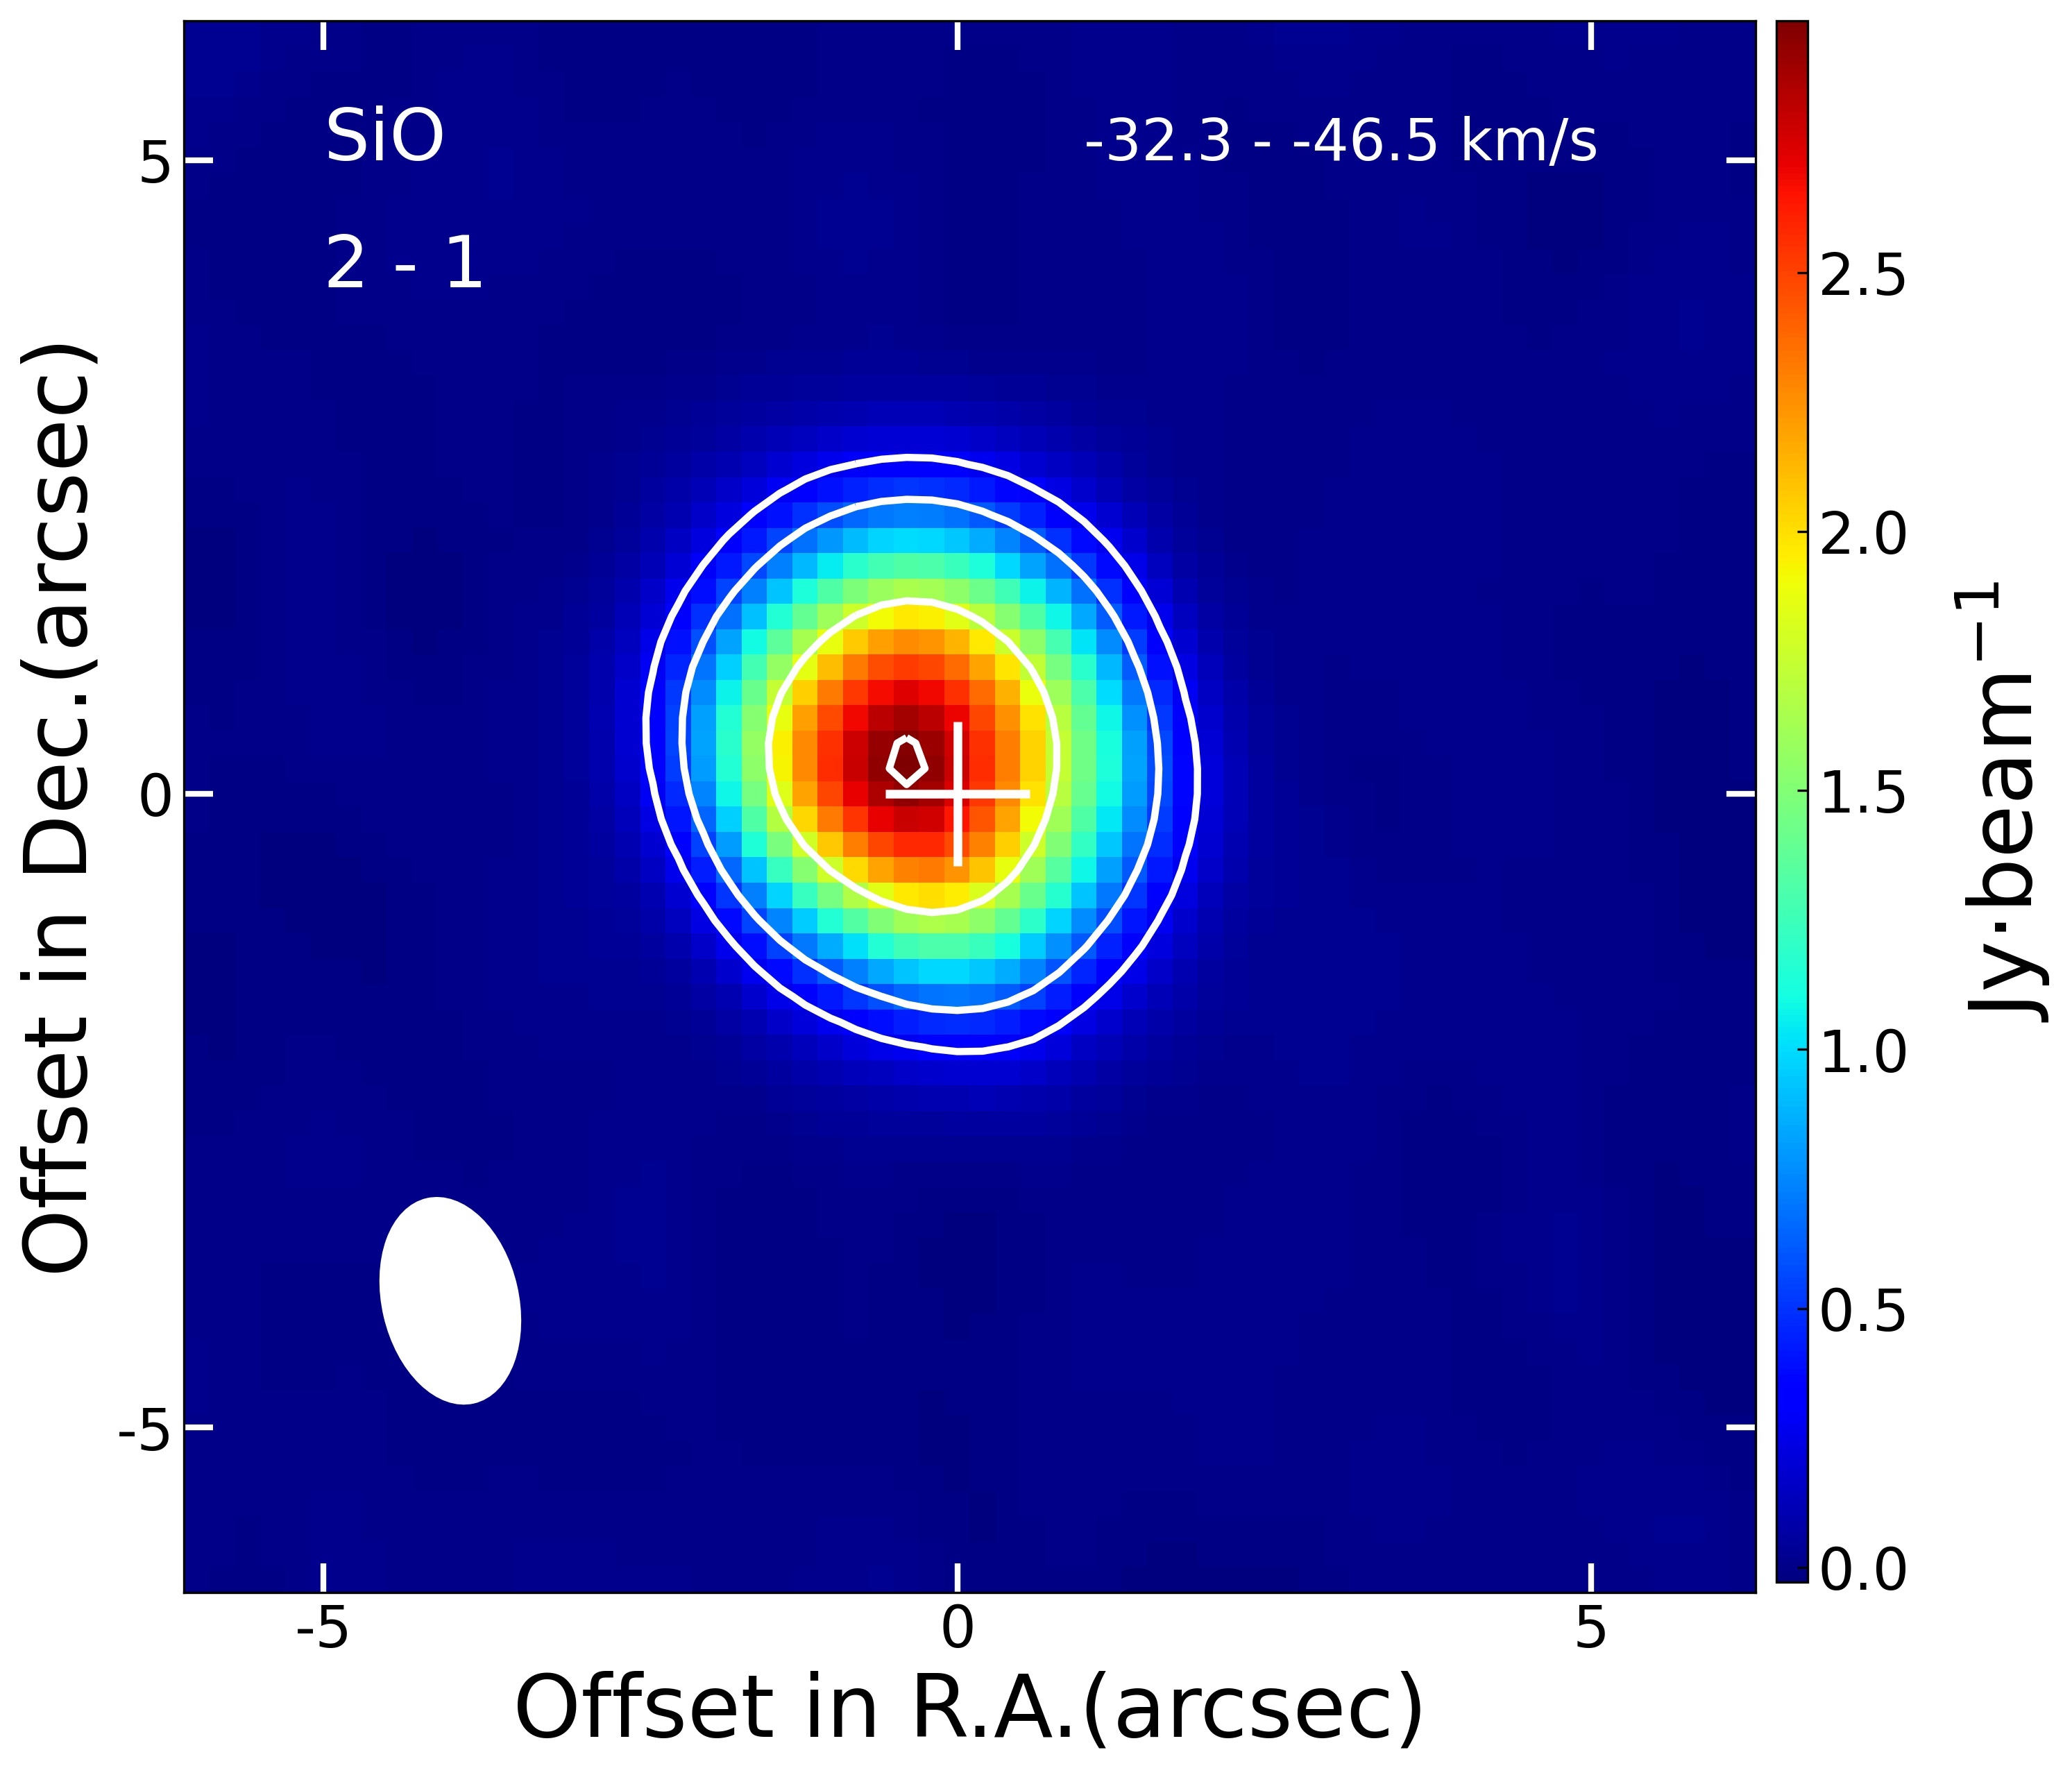
Brightness distribution of the transition of SiC2 and the 2 - 1 transition of SiO around channels (from - 32.3 to - 46.5 km s-1) is shown in Figure 3. We can see that the maximum emission of SiC2 occurs at the radius 3′′, with a hole in the distance from the star 2′′. The studies conducted by Takano et al. (1992) and (Agúndez et al., 2015) showcase the spatial distribution of the daughter species centered around . SiO is present as the parent species in three types of AGB stars (Cherchneff, 2006; Ramstedt et al., 2009). The SiC2 and SiO shown in Figure 3 represent the spatial distribution characteristics of the daughter species and parent species, respectively, exhibiting distinct hollow and compact structures.
The northeast part of the shell emission has relatively stronger spectral signals. The SiC2 () transition for AI Vol is stronger than the other transitions, and the hollow shell structure can be seen more clearly. The SiC2 at different velocity components showed an elongated cavity extending from the inner region to a location with a southern radius of 2′′. This structure may be caused by the companion star, but the AI Vol has no spiral structure typical of the companion star (Cernicharo et al., 2015). The gas expands at a lower velocity near the star, and lower-excited state transitions farther from the star are more spatially distributed than higher-excited state transitions in the same source. This is seen in Figure 4 where the zeroth-order moment map of the of the transition has a smaller extent than that of the transition.
The difference between Figure 3 and Figure 4 lies in their representation of the data. In Figure 3, we present channel maps which provide images of vertical slices through the expanding envelope while Figure 4 shows the line intensity integrated over all velocities. From Figure 3, we can see the clear feature of SiC2 as a daughter molecule. Figure 4 offers a broader perspective by showcasing the distribution of all signals. More over, it reveals that the gas intensity spatial distribution of AI Vol for different transitions varies in size. Compared to transitions with low rotational quantum numbers, transitions with high rotational quantum numbers are distributed closer to the star.
5.1.2 RAFGL 4211 and II Lup
Figure 5 and Figures (A3, A4, A5) show the channel maps of the four transitions of SiC2 for RAFGL 4211. The synthesized beam of observation is 1.00 1.00 ′′, with position angles (PA) 0∘. The signal strengths range from 5 to 8. Brightness distribution radius is 5′′ around = - 3.0 km s-1 velocity (distance from star center to peak intensity). A hollow shell structure exists within the radius 3′′ of the star. The SiC2 spatial distribution range of RAFGL 4211 is found to be 6.36 1016 - 8.90 1016 cm. In addition to focusing on the brightest component, we see some clump distributions in the outer regions.
Figures (A6, A7, A8) show the channel map of the three transitions of II Lup. The emission has no obvious signal and linewidth (the third panel at the bottom of Figure A9). The synthesized beam of observation is 0.75 0.45 ′′. The signal strengths range from 6 to 11. Figure A8 shows that emission has the form of a ring around the central position. The brightness distribution radius of the II Lup near = 15.5 km s-1 velocity is 10′′. The SiC2 spatial distribution range of II Lup is found to be 3.74 1016 - 7.48 1016 cm. As with RAFGL 4211, some clumps can be seen at 16′′. This clump may be part of a spiral structure caused by a companion star.
5.1.3 Summary of morphology
The SiC2 channel map (Figure 2 and 5) of AI Vol and RAFGL 4211 shows distinct daughter species characteristics. The SiC2 radius greater than 20 distribution in the three C-rich AGB stars is consistent with the distribution of daughter species in O-rich AGB stars (Li et al., 2014). The distribution in hollow rings of the three sources indicates that SiC2 is formed in the star’s outer layer through chemical reactions. This is the same as the ring distribution of SiC2 in IRC+10216 (Takano et al., 1992). Gensheimer et al. (1995) reported that the inner and outer radii of SiC2 of IRC+10216 are mainly distributed in the range of 2 1016 - 6 1016 cm. In the analyzed observations of three sources, the SiC2 spatial distribution range is about 2.12 1016 - 8.90 1016 cm. To sum up, combining the ring brightness distribution of SiC2 obtained in this work, we confirm that SiC2 is the daughter molecule in the CSEs of C-rich AGB stars.
5.2 Abundance
We use the rotational diagrams method to estimate the abundance of SiC2 and the spectral line profiles of the four transitions are shown in Figure 6. Using the parameters in Table 2, the molecular excitation temperature and column density are calculated under the assumption of LTE, and the equation is as follows (Zhang et al., 2009; Wang et al., 2014, e.g.),
| (1) |
Here, is the total column density of the molecule, partition function, upper-level energy, is the excitation temperature, the Boltzmann constant, the rest frequency, () spectral line integral intensity, the product of the line strength and the square of the electric dipole moment. The values of and are taken from the splatalogue databases666https://splatalogue.online//advanced.php. As the upper energy levels are close in temperature, the errors on the derived quantities are rather large.
In order to determine the relative abundance of SiC2 to H2, it is necessary to evaluate the average H2 column density within the radius occupied by SiC2. This can be achieved by employing the following equation (Gong et al., 2015),
| (2) |
For AI Vol, = 4.9 (Danilovich et al., 2018), R is the radius of the peak of the highest brightness point in Figure 4, which is 3′′; the expansion velocity of 12 km s-1 (Nyman and Olofsson, 1995), the mass of hydrogen, the mean molecular weight of 2.8 of Gong et al. (2015). The derived column density of is 5.52 . In the rotational analysis using Equation 1, we added error propagating and obtained the error of excitation temperature () and column density (), with the integral intensity of 1-error. The formulas for and are as follows,
| (3) |
and
| (4) |
The slope, , and intercept, R. is the uncertainty contribution from the rotation partition function and the intercept of the rotational diagram.
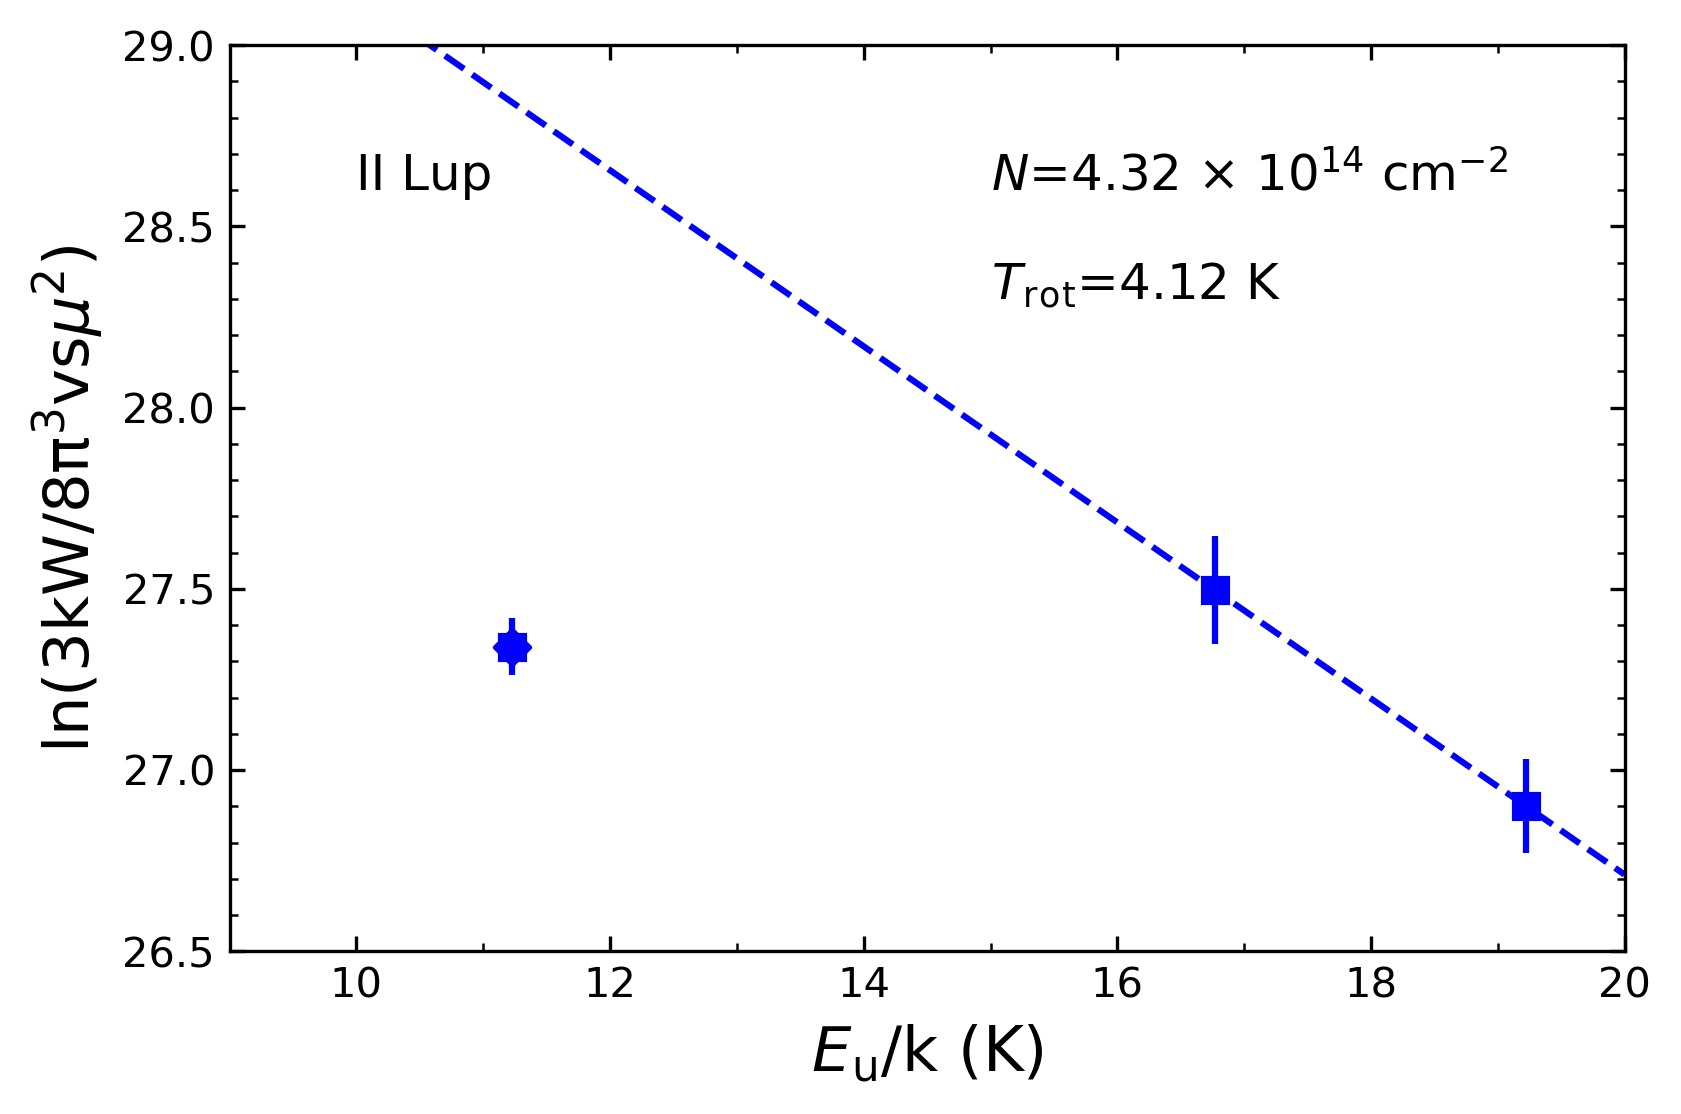
In the practical calculations, firstly, the excited temperature and column density of SiC2 are fitted by using the rotation diagram method that described in equation 1, and plotted in Figure 7; secondly, the fractional abundance of SiC2 is calculated by = . In AI Vol, we obtained (SiC2) = 1.55 , which is an order of magnitude lower than the SiC2 abundance in IRC+10216, which is around (Agúndez et al., 2012; Velilla-Prieto et al., 2018; Cernicharo et al., 2010; Fonfría et al., 2014). Table 3 presents the fractional abundances, column densities, and excitation temperatures of SiC2 for all three stars. We found that the fractional abundance of SiC2 increases with the increasing wind density in the three observed C-rich AGB stars.
In the previous astrochemical models of C-rich CSEs of AGB stars, SiC2 is always treated as a parent species with an initial abundance of (Li et al., 2014; Massalkhi et al., 2018; Van de Sande and Millar, 2022). However, this study clearly shows that this species is a daughter species and therefore the chemistry of SiC2 in the chemical models needs to be reinvestigated.
5.3 SiC2 chemistry
Previous studies of the silicon chemistry in the CSEs of AGB stars mainly arise from those models constructed for the carbon-rich AGB star IRC+10216. The detailed discussion on the chemistry of the triangular molecule SiC2 in the inner CSE can be found in Willacy and Cherchneff (1998), in the outer CSE in Takano et al. (1992), Gensheimer et al. (1995), and MacKay and Charnley (1999), where SiC2 is found to be mainly formed via ion-neutral reactions and destructed to SiC due to photodissociation induced by the photons from the interstellar medium. Cernicharo et al. (2010) introduced three key reactions to the formation of SiC2 (i.e., Si reacts with C2H2, Si reacts with C2H, and Si+ reacts with C2H), and then can successfully explain the enhanced abundance of SiC2 from observations. The chemistry of those cyclic molecules is complex. The study of c-SiC3 by Yang et al. (2019) suggested that the carbon-silicon molecules in the CSE may not only come from complex ion-molecule reactions or photodissociation of high-molecular-weight carbon-silicon molecules but also from bimolecular neutral-neutral reactions, and leading to the formation of naked carbon-silicon molecules via photochemical dehydrogenation. Since SiC2 is likely the gas-phase precursor in forming SiC dust in carbon stars (Massalkhi et al., 2018), the interaction between gas and dust, in addition to the non-spherical and clumpy structures of the envelopes of the stars, will need to be considered in the future chemical models.
6 Conclusion
To explore whether SiC2 is a parent or a daughter species, we have analyzed the ALMA observations of SiC2 (, , , and ) for the three carbon stars, and compared them with the SiC2 results in the C-rich AGB star IRC +10216. The abundance of SiC2 in the three selected stars is calculated by the rotational diagrams method. Our analysis revealed that the SiC2 molecules in the CSEs of the carbon stars exhibited a hollow shell structure, with a distinct brightness distribution at different velocities, therefore we conclude that SiC2 exists as a daughter molecule in the CSEs of these sources. Our results are in contrast to some previous reports which concluded that SiC2 is a parent molecule in the envelopes of carbon stars. More sensitive observations may, of course, detect SiC2 emission at low levels in the inner CSE. Our findings provide new insights into the chemical processes occurring in the CSEs of evolved stars and contribute to our understanding of the chemical evolution of ISM. Further detailed understanding of SiC2 formation requires studying and comparing more C-rich AGB stars by combining the results of the single-dish and high-resolution interferometric observations.
Conflict of Interest Statement
The authors declare that the research was conducted in the absence of any commercial or financial relationships that could be construed as a potential conflict of interest.
Author Contributions
YF conducted the project, processed the ALMA archive data, and wrote the draft. XL initiated the project, guided the work, and revised the manuscript. TM was involved in interpreting the results and reviewing and revising the manuscripts. RS provided continuous manuscript revision. KW provided insights and feedback during the analysis process of the results. FX helped with the data analysis. DQ, SQ, XF, BJ, QC, GH, FL, and YZ provided comments and suggestions on the manuscript. JT, ZM, RM, JS, and JY were involved in analyzing the results and provided suggestions for the manuscript. All authors discussed and contributed to the final version of the manuscript.
Funding
X. Li acknowledges support from the Xinjiang Tianchi project (2019). TJM is grateful to the Leverhulme Trust for the award of an Emeritus Fellowshiop. This work was also funded by the National Science Foundation of China (12173023), the China Manned Space Project (CMS-CSST-2021-A09), the National Science Foundation of China (11973013), and the National Key Research and Development Program of China (22022YFA1603102). National Natural Science Foundation of China (92261101) and the Innovation Capability Support Program of Shaanxi Province (2023-CX-TD-49). National Natural Science Foundation of China (11973075). X. Fang, S. Qin, and Y. Zhang thank the Xinjiang Uygur Autonomous Region of China for support from the Tianchi Talent Program.
Acknowledgments
We appreciate the invaluable suggestions of the two anonymous reviewers on this work, which has been significantly improved the quality of this paper. This paper makes use of the following ALMA data: ADS/JAO.ALMA 2013.1.00070.S. ALMA is a partnership of ESO (representing its member states), NSF (USA), and NINS (Japan), together with NRC (Canada), MOST and ASIAA (Taiwan), and KASI (Republic of Korea), in cooperation with the Republic of Chile. The Joint ALMA Observatory is operated by ESO, AUI/NRAO, and NAOJ. We are very grateful to Professor Lars-ke Nyman (the PI of the ALMA project that provided the data for this work) for his valuable comments and suggestions. This research has made use of astropy777www.astropy.org, a community-developed core Python package for astronomy, astropy, and matplotlib.
Data Availability Statement
The datasets analyzed for this study can be found in the ALMA Science Archive 888https://almascience.nrao.edu.
References
- Agúndez et al. (2017) Agúndez, M., Cernicharo, J., Quintana-Lacaci, G., Castro-Carrizo, A., Velilla Prieto, L., Marcelino, N., et al. (2017). Growth of carbon chains in IRC +10216 mapped with ALMA. A&A 601, A4. 10.1051/0004-6361/201630274
- Agúndez et al. (2015) Agúndez, M., Cernicharo, J., Quintana-Lacaci, G., Velilla Prieto, L., Castro-Carrizo, A., Marcelino, N., et al. (2015). The Peculiar Distribution of CH3CN in IRC +10216 Seen by ALMA. ApJ 814, 143. 10.1088/0004-637X/814/2/143
- Agúndez et al. (2012) Agúndez, M., Fonfría, J., Cernicharo, J., Kahane, C., Daniel, F., and Guélin, M. (2012). Molecular abundances in the inner layers of irc+ 10216. Astronomy & Astrophysics 543, A48
- Cernicharo et al. (2015) Cernicharo, J., Marcelino, N., Agúndez, M., and Guélin, M. (2015). Molecular shells in IRC+10216: tracing the mass loss history. A&A 575, A91. 10.1051/0004-6361/201424565
- Cernicharo et al. (2010) Cernicharo, J., Waters, L., Decin, L., Encrenaz, P., Tielens, A., Agúndez, M., et al. (2010). A high-resolution line survey of irc+ 10216 with herschel/hifi-first results: Detection of warm silicon dicarbide (sic). Astronomy & Astrophysics 521, L8
- Cherchneff (2006) Cherchneff, I. (2006). A chemical study of the inner winds of asymptotic giant branch stars. A&A 456, 1001–1012. 10.1051/0004-6361:20064827
- Danilovich et al. (2018) Danilovich, T., Ramstedt, S., Gobrecht, D., Decin, L., De Beck, E., and Olofsson, H. (2018). Sulphur-bearing molecules in agb stars-ii. abundances and distributions of cs and sis. Astronomy & Astrophysics 617, A132. https://doi.org/10.1051/0004-6361/201833317
- De Beck and Olofsson (2020) De Beck, E. and Olofsson, H. (2020). The surprisingly carbon-rich environment of the S-type star W Aql. A&A 642, A20. 10.1051/0004-6361/202038335
- Decin (2021) Decin, L. (2021). Evolution and mass loss of cool aging stars: A daedalean story. Annual Review of Astronomy and Astrophysics 59, 337–389
- Decin et al. (2008) Decin, L., Cherchneff, I., Hony, S., Dehaes, S., De Breuck, C., and Menten, K. M. (2008). Detection of “parent” molecules from the inner wind of AGB stars as tracers of non-equilibrium chemistry. A&A 480, 431–438. 10.1051/0004-6361:20078892
- Decin et al. (2015) Decin, L., Richards, A. M. S., Neufeld, D., Steffen, W., Melnick, G., and Lombaert, R. (2015). ALMA data suggest the presence of spiral structure in the inner wind of CW Leonis. A&A 574, A5. 10.1051/0004-6361/201424593
- Fonfría et al. (2014) Fonfría, J. P., Fernández-López, M., Agúndez, M., Sánchez-Contreras, C., Curiel, S., and Cernicharo, J. (2014). The complex dust formation zone of the AGB star IRC+10216 probed with CARMA 0.25 arcsec angular resolution molecular observations. MNRAS 445, 3289–3308. 10.1093/mnras/stu1968
- Gensheimer et al. (1995) Gensheimer, P. D., Likkel, L., and Snyder, L. E. (1995). Full Synthesis Maps of Circumstellar SiC 2 in IRC +10216. ApJ 439, 445. 10.1086/175186
- Glassgold et al. (1991) Glassgold, Mamon, G., and Huggins, P. (1991). The formation of molecules in protostellar winds. The Astrophysical Journal 373, 254–265
- Glassgold et al. (1986) Glassgold, A. E., Lucas, R., and Omont, A. (1986). Molecular ions in the circumstellar envelope of IRC +10216. A&A 157, 35–48
- Gong et al. (2015) Gong, Y., Henkel, C., Spezzano, S., Thorwirth, S., Menten, K., Wyrowski, F., et al. (2015). A 1.3 cm line survey toward irc+ 10216. Astronomy & Astrophysics 574, A56. https://doi.org/10.1051/0004-6361/201424819
- Groenewegen et al. (2002) Groenewegen, M., Sevenster, M., Spoon, H., and Pérez, I. (2002). Millimetre observations of infrared carbon stars-ii. mass loss rates and expansion velocities. Astronomy & Astrophysics 390, 511–522
- Guelin et al. (1993) Guelin, M., Lucas, R., and Cernicharo, J. (1993). MgNC and the carbon-chain radicals in IRC +10216. A&A 280, L19–L22
- Höfner and Olofsson (2018) Höfner, S. and Olofsson, H. (2018). Mass loss of stars on the asymptotic giant branch. The Astronomy and Astrophysics Review 26, 1–92
- Li et al. (2016) Li, X., Millar, T. J., Heays, A. N., Walsh, C., van Dishoeck, E. F., and Cherchneff, I. (2016). Chemistry and distribution of daughter species in the circumstellar envelopes of O-rich AGB stars. A&A 588, A4. 10.1051/0004-6361/201525739
- Li et al. (2014) Li, X., Millar, T. J., Walsh, C., Heays, A. N., and Van Dishoeck, E. F. (2014). Photodissociation and chemistry of n2 in the circumstellar envelope of carbon-rich agb stars. Astronomy & Astrophysics 568, A111
- Lucas et al. (1995) Lucas, R., Guélin, M., Kahane, C., Audinos, P., and Cernicharo, J. (1995). Plateau de bure observations of IRC+10216: high sensitivity maps of SiC2, SiS, and CS. Ap&SS 224, 293–296. 10.1007/BF00667860
- Lykou et al. (2018) Lykou, F., Zijlstra, A. A., Kluska, J., Lagadec, E., Tuthill, P. G., Avison, A., et al. (2018). The curious case of II Lup: a complex morphology revealed with SAM/NACO and ALMA. MNRAS 480, 1006–1021. 10.1093/mnras/sty1903
- MacKay and Charnley (1999) MacKay, D. D. S. and Charnley, S. B. (1999). The silicon chemistry of IRC+10°216. MNRAS 302, 793–800. 10.1046/j.1365-8711.1999.02175.x
- Massalkhi et al. (2018) Massalkhi, S., Agúndez, M., Cernicharo, J., Velilla Prieto, L., Goicoechea, J. R., Quintana-Lacaci, G., et al. (2018). Abundance of SiC2 in carbon star envelopes. A&A 611, A29. 10.1051/0004-6361/201732038
- Müller et al. (2005) Müller, H. S. P., Schlöder, F., Stutzki, J., and Winnewisser, G. (2005). The Cologne Database for Molecular Spectroscopy, CDMS: a useful tool for astronomers and spectroscopists. Journal of Molecular Structure 742, 215–227. 10.1016/j.molstruc.2005.01.027
- Nyman and Olofsson (1995) Nyman, L.-Å. and Olofsson, H. (1995). Molecular abundances in carbon-rich circumstellar envelopes. Astrophysics and Space Science 224, 527–528
- Prieto et al. (2015) Prieto, L. V., Cernicharo, J., Quintana-Lacaci, G., Agúndez, M., Castro-Carrizo, A., Fonfría, J. P., et al. (2015). Si-bearing molecules toward irc+ 10216: Alma unveils the molecular envelope of cwleo. The Astrophysical journal letters 805, L13
- Ramstedt et al. (2009) Ramstedt, S., Schöier, F. L., and Olofsson, H. (2009). Circumstellar molecular line emission from S-type AGB stars: mass-loss rates and SiO abundances. A&A 499, 515–527. 10.1051/0004-6361/200911730
- Smith et al. (2015) Smith, C. L., Zijlstra, A. A., and Fuller, G. A. (2015). A molecular line survey of a sample of agb stars and planetary nebulae. Monthly Notices of the Royal Astronomical Society 454, 177–192
- Takano et al. (1992) Takano, S., Saito, S., and Tsuji, T. (1992). Silicon Chemistry in the Outer Envelope of IRC +10216: The Detailed Distribution of SiC_2. PASJ 44, 469–480
- Thaddeus et al. (1984) Thaddeus, P., Cummins, S. E., and Linke, R. A. (1984). Identification of the SiCC radical toward IRC +10216 : the first molecular ring in an astronomical source. ApJ 283, L45–L48. 10.1086/184330
- Van de Sande and Millar (2022) Van de Sande, M. and Millar, T. J. (2022). The impact of stellar companion UV photons on the chemistry of the circumstellar environments of AGB stars. MNRAS 510, 1204–1222. 10.1093/mnras/stab3282
- Velilla-Prieto et al. (2018) Velilla-Prieto, L., Cernicharo, J., Agúndez, M., Fonfría, J. P., Castro-Carrizo, A., Quintana-Lacaci, G., et al. (2018). Circumstellar chemistry of si-c bearing molecules in the c-rich agb star irc+ 10216. Proceedings of the International Astronomical Union 14, 535–537
- Wang et al. (2014) Wang, K., Zhang, Q., Testi, L., van der Tak, F., Wu, Y., Zhang, H., et al. (2014). Hierarchical fragmentation and differential star formation in the Galactic ‘Snake’: infrared dark cloud G11.11-0.12. MNRAS 439, 3275–3293. 10.1093/mnras/stu127
- Willacy and Cherchneff (1998) Willacy, K. and Cherchneff, I. (1998). Silicon and sulphur chemistry in the inner wind of IRC+10216. A&A 330, 676–684
- Woods et al. (2003) Woods, P., Schöier, F. a., Nyman, L.-Å., and Olofsson, H. (2003). Molecular abundances in carbon-rich circumstellar envelopes. Astronomy & Astrophysics 402, 617–634
- Yang et al. (2019) Yang, T., Bertels, L., Dangi, B. B., Li, X., Head-Gordon, M., and Kaiser, R. I. (2019). Gas phase formation of c-SiC3 molecules in the circumstellar envelope of carbon stars. Proceedings of the National Academy of Science 116, 14471–14478. 10.1073/pnas.1810370116
- Zhang et al. (2009) Zhang, Y., Kwok, S., et al. (2009). A molecular line survey of the highly evolved carbon star cit 6. The Astrophysical Journal 691, 1660. https://iopscience.iop.org/article/10.1088/0004-637X/691/2/1660/pdf
Figure captions
| Name | IRAS | Mass loss rate | Distance | |||
|---|---|---|---|---|---|---|
| ( ) | (pc) | (km s-1) | (km s-1) | (′′) | ||
| AI Vol | IRAS 07454-7112 | 1.51 0.99(1) | ||||
| RAFGL 4211 | IRAS 15082-4808 | 1.00 1.00(1) | ||||
| II Lup | IRAS 15194-5115 | 0.75 0.45(1) |
| AI Vol | RAFGL 4211 | II Lup | |||||||||||||
| Transition | Frequency | rms | rms | rms | |||||||||||
| (GHz) | (mK) | (K km s-1) | (K) | (mK) | (K km s-1) | (K) | (mK) | (K km s-1) | (K) | ||||||
| = | 93.06363900 | 6.70 | 1.26 ( 0.21) | 0.14 | 20.45 | 16.40 | 1.48 ( 0.52) | 0.14 | 8.60 | 21.49 | 9.51 ( 0.75) | 0.54 | 25.11 | ||
| = | 94.24539300 | 2.73 | 0.29 ( 0.09) | 0.03 | 10.99 | 10.70 | 0.53 ( 0.34) | 0.06 | 5.51 | 25.13 | 6.82 ( 0.88) | 0.37 | 14.82 | ||
| = | 95.57938100 | 2.55 | 0.32 ( 0.08) | 0.04 | 13.73 | 16.30 | 0.91 ( 0.52) | 0.10 | 6.13 | 47.30 | |||||
| = | 115.38238880 | 6.64 | 0.48 ( 0.21) | 0.04 | 5.27 | 40.60 | 4.45 ( 1.30) | 0.33 | 8.08 | 72.80 | 17.20 ( 2.55) | 0.80 | 11.03 | ||
Note. The uncertainties are indicated in parentheses. The S/N is calculated by /rms.
| This work | Other observations | |||||||
| Source | 1013 | 10-8 | 1013 | 10-7 | exp 10-7 | |||
| (K) | (cm-2) | (K) | (cm-2) | ( km-1 s) | ||||
| AI Vol | 6.66 ( 1.33) | 0.90 ( 0.49) | 1.64 | 14.00 ( 16.00)(b) | 0.40 ( 0.50)(b) | 2.30(a) | 4.08(c) | |
| RAFGL 4211 | 17.25 ( 13.07) | 1.60 ( 2.10) | 4.62 | 35.00 ( 51.00)(b) | 4.00 ( 3.00)(b) | 4.90(a) | 5.13(c) | |
| II Lup | 4.12 | 43.22 | 47.46 | 19.00 ( 11.00)(b) | 4.00 ( 2.00)(b) | 12.00(a) | 7.91 | |
Note. : the CSEs wind density. The uncertainties are listed in parentheses, which are obtained by considering the 1 signal via the error propagation. The fitting of II Lup was performed using only two data points, which resulted in a lower precision and the absence of error estimation. References: (a) Woods et al. (2003);(b) Smith et al. (2015);(c) Danilovich et al. (2018).
| Transition | u | |
|---|---|---|
| (K) | (Debye2) | |
| = | 11.23 | 22.82 |
| = | 19.12 | 17.18 |
| = | 19.22 | 17.18 |
| = | 16.77 | 28.46 |
Appendix A Supplementary Figures