PKS 2332017 and PMN J19161519: Candidate Blazar Counterparts to Two High-energy Neutrino Events
Abstract
We report our counterpart identification study for two high-energy neutrino events IC-130127A and IC-131204A listed in the IceCube Event Catalog of Alert Tracks. These two events belong to Gold alerts, which have a significant probability of being of astrophysical origin. Within the events’ 90% positional uncertainty regions, we respectively find PKS 2332017 and PMN J19161519. The first source is a flat-spectrum radio quasar at redshift and the second a blazar of an uncertain type with photometric . As they correspondingly had a -ray flare temporally coincident with the arrival times of IC-130127A and IC-131204A, we identify them as the respective neutrino emitters. Detailed analysis of the -ray data for the two blazars, obtained with the Large Area Telescope (LAT) onboard the Fermi Gamma-ray Space Telescope (Fermi), is conducted. The two flares respectively from PKS 2332017 and PMN J19161519 lasted 4 yr and 4 month, and showed possible emission hardening by containing high-energy 2–10 GeV photons in the emissions. Accompanying the flare of PKS 2332017, optical and MIR brightening variations were also observed. We discuss the properties of the two sources and compare the properties with those of the previously reported (candidate) neutrino-emitting blazars.
1 Introduction
Neutrino astronomy has great potential of providing us with more and different information for various celestial objects in the Universe, and the IceCube (Aartsen et al., 2017), a neutrino observatory built at the South Pole, is one of the large facilities leading the field in exploring the neutrino sky. Since 2013, IceCube has been detecting high-energy neutrino events that more likely have an astrophysical origin (Aartsen et al., 2013), and it was in 2017 that the first convincing association was established. The case was between a 0.3 PeV neutrino event, named IC-170922A, and a flaring blazar TXS 0506+056, resulting from the multimessenger campaign (IceCube Collaboration et al., 2018a, b). Following this first association case, the neutrino emission from the nearby Seyfert galaxy NGC 1068 at a significance of 4.2 and that from the Galactic plane at a 4.5 significance level have also been reportedly revealed (IceCube Collaboration et al., 2022; Icecube Collaboration et al., 2023).
Blazars are a sub-type of Active Galactic Nuclei (AGNs) having their jets pointing close to our line of sight. They have been considered as possible sources of high-energy neutrinos (e.g., Mannheim 1995; Mücke et al. 2003; Murase et al. 2018). They are generally categorized as two types, Flat Spectrum Radio Quasars (FSRQs) and BL Lac objects (BL Lacs), based on the observed strengths of their optical emission lines (Urry & Padovani, 1995; Scarpa & Falomo, 1997). Electrons accelerated in the blazars’ jets emit strongly via the synchrotron process in the radio to X-ray bands. Thus there are also three sub-classes used to describe their synchrotron emissions and spectral energy distributions (SEDs) based on the frequency values of the synchrotron peak (Abdo et al., 2010): low synchrotron peaked (LSP), intermediate synchrotron peaked (ISP), and high synchrotron peaked (HSP). Protons should also be accelerated in the jets, and the high-energy neutrino emission may originate from the photopion processes, as the result of the interaction between relativistic protons and low-energy photons; charged and neutral pions are produced in the interaction, which subsequently decay and produce neutrinos and high-energy photons.
Given the neutrino detection from TXS 0506+056, efforts have been made to find more cases. A few blazars have been reported as the possible neutrino sources. For instance, there are two LSP BL Lacs, GB6 J1040+0617 (Garrappa et al., 2019) and PKS 2254+074 (Ji & Wang, 2024), two ISP BL Lacs, MG3 J225517+2409 (Franckowiak et al., 2020) and PKS 0735+178 (Sahakyan et al., 2023), an HSP BL Lac, 3HSP J095507.9+355101 (Giommi et al., 2020), and three LSP FSRQs, PKS B1424418 (Kadler et al., 2016), GB6 J2113+1121 (Liao et al., 2022), and NVSS J171822+423948 (Jiang et al., 2024). The criteria for the identifications of these blazar sources follow the case of TXS 0506+056: each of them was positionally coincident with a high-energy neutrino event and at the arrival time of the neutrino, the blazar was having a -ray flare (or an X-ray flare in the case of 3HSP J095507.9+355101).
Recently, the updated IceCube Event Catalog of Alert Tracks (IceCat-1) has been released, which contains more than 100 neutrino track-like events likely of astrophysical origin (with energy 100 TeV) detected from 2011 to 2023 (Abbasi et al., 2023). In IceCat-1, based on a quantity called “signalness”, the neutrino events having a significant probability of being an astrophysical neutrino are classified as Gold alerts, and they have an average signalness above 50% (Abbasi et al., 2023). We went through the events in IceCat-1 and found two possible association cases. The high-energy neutrino events are IC-130127A and IC-131204A, both belonging to the Gold alerts. Based on the general criteria currently considered in the association studies, the neutrinos possibly came respectively from two blazars, PKS 2332017 and PMN J19161519. We report the association studies here. Throughout this work, we used the following cosmological parameters, = 67.7 km s-1 Mpc-1, = 0.32, and = 0.68 (Planck Collaboration et al., 2020).
2 Multiband and -ray Data
2.1 Multiband Data
Optical light-curve data were obtained from the Zwicky Transient Facility (ZTF; Bellm et al. 2019) and Catalina Real-Time Transient Survey (CRTS; Drake et al. 2009). The bands of the data are ZTF and , and CRTS . To ensure the good-quality of the ZTF data, we required catflags = 0 and for the downloaded magnitude data points.
Mid-infrared (MIR) light-curve data were obtained from the NEOWISE Single-exposure Source Database (Mainzer et al. 2014), where the bands are Wide-field Infrared Survey Explorer (WISE) W1 (3.4 m) and W2 (4.6 m).
We also searched the X-ray data for the sources. Unfortunately, there were no observations from the X-ray Telescope (XRT; Burrows et al. 2005) onboard the Neil Gehrels Swift Observatory. For eROSITA (Predehl et al., 2021), both sources are not in the sky region of its recently released X-ray data.
2.2 Fermi -ray Data and Source Model
High-energy -ray data from the Large Area Telescope (LAT) onboard the Fermi Gamma-ray Space Telescope (Fermi) were used by us for studying the two blazar targets. Photon events in the energy range of 0.1–500 GeV (evclass=128 and evtype=3) from the updated Fermi Pass 8 database in a time range of from 2008-08-04 15:43:36 (UTC) to 2024-04-18 00:05:53 (UTC) were obtained. For a target, the region of interest (RoI) was set to be 20° 20° with the center at the position of this target. We excluded the events with zenith angles 90° to avoid the contamination from the Earth limb, and the expression DATA_QUAL 0 && LAT_CONFIG = 1 was used for selecting good time-interval events. In our analysis, the package Fermitools-2.2.0 and the instrumental response function P8R3_SOURCE_V3 were used.
For each target, a source model was constructed based on the latest (Data Release 4, DR4) Fermi Gamma-ray LAT (FGL) 14-year source catalog, 4FGL-DR4 (Ballet et al., 2023). All sources in the catalog within 25° of a target were included. The spectral models in 4FGL-DR4 for the sources, including our targets, were adopted. We set the spectral indices and normalizations of the sources within 5° of each target as free parameters and fixed the other parameters at the catalog values. We also included the extragalactic diffuse emission and the Galactic diffuse emission components, which were the spectral files iso_P8R3_SOURCE_V3_v1.txt and gll_iem_v07.fits respectively. We always set the normalizations of these two components as free parameters in our analysis.
3 Data Analysis and Results
3.1 IC-130127A
3.1.1 Positional analysis
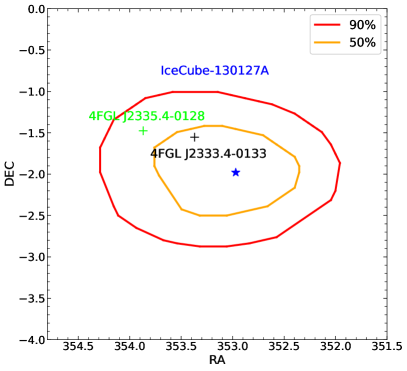
IC-130127A was a GFU Gold type event (Abbasi et al., 2023) with an energy of 235 TeV and a signalness of 61% (the probability of astrophysical origin). It was detected on 2013 January 27 06:43:11.01 UT (MJD 56319.28), with a position of R.A. = 35297, Decl. = 198 (equinox J2000.0, 90% uncertainty) in IceCat-1. In 4FGL-DR4, there are two -ray sources within the positional uncertainty region (see left panel of Figure 1), which are 4FGL J2335.40128 (or PKS 2332017) and 4FGL J2333.40133 (or PKS B2330017). Both are FSRQs. We checked their 1-yr binned -ray light-curves provided by 4FGL-DR4111https://fermi.gsfc.nasa.gov/ssc/data/access/lat/14yr_catalog/, and found that PKS 2332017 had a significant flare at the arrival time of IC-130127A while PKS B2330017 did not have significant flux variations at the time.
3.1.2 Light-curve analysis for PKS 2332017
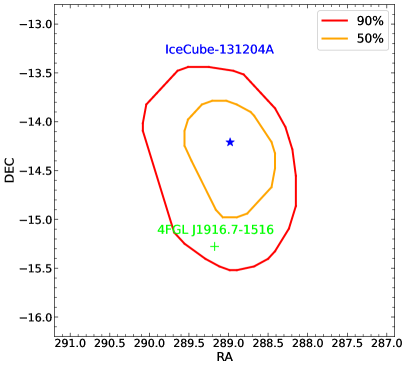
can PKS 2332017 was modeled as a point source with a Log-Parabola (LP) spectrum, in 4FGL-DR4. Setting this spectral model, we performed the standard binned likelihood analysis to the whole data in 0.1–500 GeV for PKS 2332017. We obtained = 2.360.13, = 0.270.10, and photon flux Fγ = (6.402.38)10-9 ph cm-2 s-1, with a test statistic (TS) value of 351 (detection significance ). These parameter values are consistent with those given in 4FGL-DR4, but the TS value is higher than that in the catalog (TS = 124). The reason for the difference is that the source recently had a flare (see left panel of Figure 2).
We extracted the 0.1–500 GeV -ray light curve of PKS 2332017 by
setting a 180-day time bin and performing the maximum likelihood analysis
to the data of each time bin. In the extraction, only the normalization
parameters of
the sources within 5° of the target were set free and the other parameters
were fixed at the best-fit values obtained in the analysis of the whole data.
For the obtained light-curve data points with TS 4, we calculated
the 95% confidence level (C.L.) upper limits and used the upper limits
instead.
As shown in the left panel of Figure 2, the source had
two flares and
the arrival time of the neutrino IC-130127A was temporally coincident with
the first one.
Using the Bayesian block (BB) algorithm (Scargle et al., 2013), implemented
through Python package
Astropy222https://docs.astropy.org/en/stable/api/
astropy.stats.bayesian_blocks.html,
we determined the time durations of the two flares,
the first being 4 yr (MJD 55582.66–57022.66, gray region in
Figure 2) and the second being 3.5 yr
(MJD 59542.66–60442.66). For the time ranges excluding the two flares, we
defined them as the quiescent state of the source.
We also obtained the optical light curves of the source from ZTF and CRTS and MIR ones from WISE. Focusing on the first flare (right panel of Figure 2), it can be seen that the optical and MIR variations accompanied the -ray flare, and the brightening variations were more than 1 mag.
3.1.3 Spectral analysis for PKS 2332017
We performed the likelihood analysis to the data of the first flare and quiescent state. For the flare, we obtained = 2.470.11, = 0.150.07, and Fγ = (1.680.43)10-8 ph cm-2 s-1 (TS = 230 or detection significance 15.2). For the quiescent state, we obtained = 2.970.54, = 0.930.53, and Fγ = (1.230.89)10-9 ph cm-2 s-1 (TS = 20 or detection significance 4.5). Given the low detection significance and the resulting large parameter uncertainties in the quiescent state, we could not determine any spectral changes between the flare and the quiescent state.
Because of the detection of VHE emission in the neutrino-emitting flare of TXS 0506+056 and other evidence of hardening of emission during the the flares of the candidate neutrino blazars (see Ji & Wang 2024 and references therein), we checked high-energy 2 GeV photons from PKS 2332017. By running gtsrcprob on the data during the first flare in an 1° RoI, we found 10 photons of 90% probabilities coming from the source, with the highest energy being 13.7 GeV (on MJD 56127). As the calculations rely on the model considered, when we changed to use the model results from the whole data instead, we found four such photons in the flare (including that 13.7 GeV one) and one in quiescence. Therefore, more high-energy photons were observed during the flare.
To obtain the -ray spectra of PKS 2332017 in the first flare and the quiescent state, we performed the binned likelihood analysis to the respective data in 8 energy bins evenly divided in logarithm from 0.1 to 500 GeV. In the analysis, the spectral normalizations of the sources in the source model within 5° of PKS 2332017 were set free and all other spectral parameters of the sources were fixed at the values obtained in the above likelihood analysis to the respective data of the flare and the quiescent state. For the spectra, the data points with TS 4 were kept.
3.2 IC-131204A
3.2.1 Positional analysis
IC-131204A, an EHE Gold type event with an energy of 259 TeV and a signalness of 20%, was detected on 2013 December 4 11:16:54.26 UT (MJD 56630.47). Its position was given to be R.A. = 28898, Decl. = 1421 (equinox J2000.0, 90% uncertainty) in IceCat-1. There was only 4FGL J1916.71516 (or PMN J19161519) within the uncertainty region (see right panel of Figure 1). PMN J19161519 was classified as a blazar of uncertain type (BCU) in 4FGL-DR4.
3.2.2 Light-curve analysis for PMN J19161519
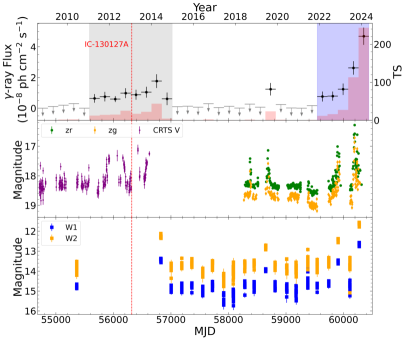
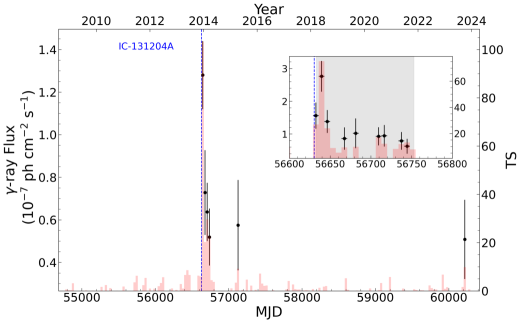
PMN J19161519 is being monitored by the Fermi LAT Light Curve Repository (LCR) program (Abdollahi et al., 2023). We obtained its 30-day binned -ray light curve from LCR, which is shown in Figure 3. Only data points with TS 9 are kept in the light curve. As can be seen, there was only a short flare, peaking at MJD 56648 and lasting 4 month in MJD 56633–56753, during the 16 year of the Fermi LAT data. The flare’s time duration, simply the four-month bins that have TS20, is indicated by the gray region shown in the sub-graph of Figure 3. The arrival time of IC-131204A approximately matches the flare, only 2.5 day before the first time bin (i.e., the peak) of the flare. We also show the 7-day binned light curve from LCR in Figure 3. The neutrino’s arrival time is 9 day before the peak of this finer light curve, and within the first time bin (MJD 56629–56636) whose TS 27. We checked the optical and MIR light curves of PMN J19161519 in the CRTS, ZTF, and NEOWISE database (and also in the other databases). Unfortunately, there were no optical and MIR measurements during the flare.
For PMN J19161519, we defined the time ranges excluding the flare as its quiescent state, during which it was nearly not detectable.
3.2.3 Spectral analysis for PMN J19161519
PMN J19161519 was modeled as a point source with a LP spectrum in 4FGL-DR4. We performed the standard binned likelihood analysis to the whole data in 0.1–500 GeV for PMN J19161519. We obtained = 2.770.16, = 0.360.14, and Fγ = (7.452.28)10-9 ph cm-2 s-1, with a TS value of 102 (detection significance 10.1). The values are consistent with those given in 4FGL-DR4. We then performed the likelihood analysis to the data of the flare and quiescent state. For the first, we obtained = 2.580.10, = 0.160.08, and Fγ = (3.760.63)10-8 ph cm-2 s-1 (TS = 213 or detection significance 14.6). For the latter, we obtained = 2.990.61, = 1.250.40 and Fγ = (1.720.70)10-9 ph cm-2 s-1 (TS = 30 or detection significance 5.5). The results suggest that the emission during the flare is harder than that during the quiescent state, but still the uncertainties in the latter are large, not allowing us to draw a certain conclusion. Running gtsrcprob, we found four 2 GeV photons of 90% probabilities coming from the source, with the highest energy being 9.8 GeV (on MJD 56742), during the flare, where the model of the flare was used. When we changed to use the model from the whole data, no such photons were found.
We obtained the -ray spectra of PMN J19161519 in the flare and in the quiescent state by performing the binned likelihood analysis to the respective data in 8 energy bins evenly divided in logarithm from 0.1 to 500 GeV. In this analysis, we set the spectral normalizations of the sources in the source model within 5° of the target as free parameters and fixed the other spectral parameters at the values obtained in the above likelihood analysis to the respective data of the flare and the quiescent state. Only data points with TS 4 in the spectra were kept.
4 Discussion
We went through the Gold events in IceCat-1, and found two blazars, PKS 2332017 and PMN J19161519, as the possible neutrino sources, in addition to the previously reported neutrino blazars. The two sources are in positional coincidence respectively with IC-130127A and IC-131204A and had a flare temporally coincident with the respective arrival times of the two neutrinos. For PKS 2332017, significant flux variations at optical and MIR bands accompanying the flare were observed, which were also seen in nearly all previously reported neutrino blazars. For PMN J19161519, due to the lack of multiband flux measurements over the 4-month flare, we do not have the information. Although it is not possible to determine the emission hardening during the flares for the two sources because of their weak emission during the quiescent state, we have found high-energy photons, with energy as high as 10 GeV, during the flares, which may be considered as evidence for emission hardening (Ji & Wang, 2024).
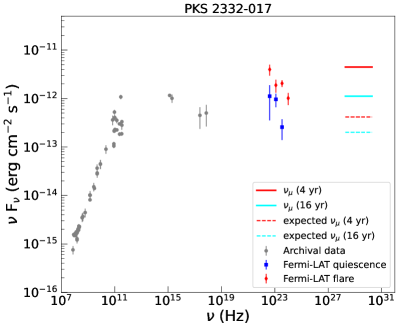
PKS 2332017 is an FSRQ at redshift = 1.18 (Wills & Lynds, 1978). It is classified as an LSP in the Data Release 3 (DR3) of the Fourth Catalog of Active Galactic Nuclei detected by the Fermi LAT (4LAC-DR3; Ajello et al. 2022), with the peak frequency Hz (in 4LAC-DR3) or Hz given by Firmamento333https://firmamento.hosting.nyu.edu/data_access (Tripathi et al., 2024). It is thus similar to several other reported neutrino blazars, PKS B1424418, GB6 J2113+1121, and NVSS J171822+423948, which are all LSP FSRQs. Its long-term -ray luminosity and spectral index were erg s-1 and 2.36, and during the neutrino-arriving flare (MJD 55582.66–57022.66), the values were erg s-1 and 2.47, respectively. These values are typical for an FSRQ. Its SED is shown in the left panel of Figure 4.
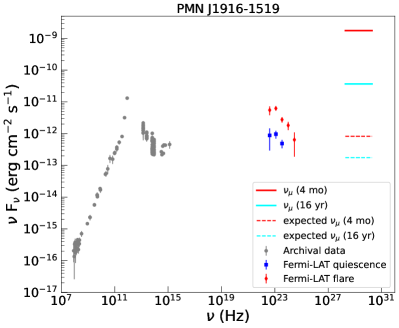
PMN J19161519 only has a photometric redshift =0.968 (Foschini et al., 2022). It is also an LSP blazar, as its Hz (in 4LAC-DR3) or Hz given by Firmamento. Assuming the redshift, the -ray luminosities are estimated to be erg s-1 in its long-term 16 year of Fermi LAT data and erg s-1 in its 4-month flare. BL Lacs and FSRQs can be relatively well separated in the plot of -ray luminosity versus photon index (e.g., Chen 2018). Following the criterion line to separate BL Lacs and FSRQs from Chen 2018, PMN J19161519 may be classified as an FSRQ. Its SED is shown in the right panel of Figure 4.
The -ray flare of PMN J19161519 in temporal coincidence with IC-131204A was short, only 4 month. Such short-flare cases were seen before in other neutrino blazars. PKS 0735+178 had a 3-week -ray flare temporally coincident with the arrival time of IC-211208A (Sahakyan et al., 2023), GB6 J1040+0617 had a 3-month -ray flare (IC-141209A; Garrappa et al. 2019), MG3 J225517+2409 showed a 5 month one (IC-100608A; Franckowiak et al. 2020), and TXS 0506+056 had a 6-month one (IC-170922A; IceCube Collaboration et al. 2018a). PMN J19161519 would be unique as it only had such a short flare over 16 year of the Fermi LAT observation time. According to the simulation results presented in Capel et al. 2022, the chance coincidence probabilities between -ray flares of blazars and neutrino alerts are high, maybe 3.8%–12.7%, but when certain source flux and flare variation amplitude are considered, the probability could be lowered to 0.1% (i.e., 3 significance for the source association). PMN J19161519 could be such an example as its flare variation amplitude reached 5.0.
The redshift and -ray luminosity of PKS 2332017 are comparable with the values of previously identified neutrino blazars. For example, their redshift range is 0.19–2.68 and luminosity range is 1044–1048 erg s-1 (Ji & Wang, 2024). The neutrino flux may be estimated from the observed -ray flux (see Giommi et al. 2020 and Jiang et al. 2024), using the relationship between them given by (Murase et al., 2018),
| (1) |
Here, represents the Compton-Y parameter, expected typically (Murase et al., 2018), and the -ray luminosity term erg s-1 (for 4 yr) and erg s-1 (for 16 yr; see Giommi et al. 2020 for details); γ is the observed -ray luminosity for the source. Then the average muon neutrino luminosities (i.e., ) would be erg s-1 (4 yr) and erg s-1 (16 yr). On the other hand, the number of muon (and antimuon) neutrinos, , detected by IceCube during time interval at declination may be estimated from
| (2) |
where and are the minimum and maximum neutrino energy, respectively, and is the differential energy flux of muon neutrinos. Using the muon neutrino flux estimated from Eq. 1 above and assuming a power-law neutrino energy spectrum with an index of 2 from 80 TeV to 8 PeV (Oikonomou et al., 2021), we find from Eq. 2 the expected numbers of neutrinos to be 0.09 ( 4 yr) and 0.18 ( 16 yr) for the effective area m2 (GFU_Gold, see Abbasi et al. 2023). In other words, the Poisson probabilities to detect one neutrino are 0.08 and 0.15, respectively. Alternatively, we may estimate the neutrino flux from Eq. 2 by setting (given the neutrino event), and the resulting energy fluxes for two values are shown in Figure 4.
Similarly for PMN J19161519, where we used the photometric redshift, we estimated its -ray luminosity term erg s-1 (for 4 month) and erg s-1 (for 16 yr), the average muon neutrino luminosities erg s-1 (4 month) and erg s-1 (16 yr). The expected numbers of neutrinos would be (for 4 month) and (for 16 yr), suggesting low neutrino detection probabilities of 1% for PMN J19161519. The low detection probabilities, including those estimated in 3HSP J095507.9+355101 (Giommi et al., 2020), NVSS J171822+423948 (Jiang et al., 2024), and PKS 2254+074 (Ji & Wang, 2024), are actually consistent with the results from studies of SEDs with one-zone lepto-hadronic models (e.g., Keivani et al. 2018; Petropoulou et al. 2020b). The extremely low probability in the flare case of PMN J19161519 was also seen in the SED modeling of 3HSP J095507.9+355101, as Petropoulou et al. (2020a) found a neutrino-detection probability of 0.06% for the X-ray flare of the blazar.
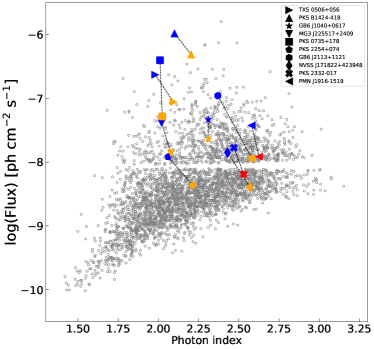
Finally, the plot of 0.1–100 GeV flux versus photon index of -ray blazars (Figure 5), which was previously shown in Liao et al. (2022), is updated by us. Five more sources, PKS 0735+178 (Sahakyan et al., 2023), NVSS J171822+423948 (Jiang et al., 2024), and PKS 2254+074 (Ji & Wang, 2024), plus two sources in this work, are added in the plot (but we do not include 3HSP J095507.9+355101 since its temporal coincidence was between an X-ray flare and a neutrino). Now there are 10 flaring blazar candidates in total. Their average fluxes, given by the long-term Fermi LAT data, are in a wide range of from to ph s-1 cm-2. However, as seen in the two sources of this work, one/two flares can dominate the fluxes. In other words, the emission activity of such blazars, with PMN J19161519 as an extreme case, is mainly contributed by flaring events. Thus as already shown by the case of TXS 0506+056, it is very likely that the neutrino emission in blazars is closely related to the flares. This is also supported, for example, by the blazar population studies (Capel et al., 2022).
References
- Aartsen et al. (2013) Aartsen, M. G., Abbasi, R., Abdou, Y., et al. 2013, Phys. Rev. Lett., 111, 021103, doi: 10.1103/PhysRevLett.111.021103
- Aartsen et al. (2017) Aartsen, M. G., Ackermann, M., Adams, J., et al. 2017, Journal of Instrumentation, 12, P03012, doi: 10.1088/1748-0221/12/03/P03012
- Abbasi et al. (2023) Abbasi, R., Ackermann, M., Adams, J., et al. 2023, ApJS, 269, 25, doi: 10.3847/1538-4365/acfa95
- Abdo et al. (2010) Abdo, A. A., Ackermann, M., Agudo, I., et al. 2010, ApJ, 716, 30, doi: 10.1088/0004-637X/716/1/30
- Abdollahi et al. (2023) Abdollahi, S., Ajello, M., Baldini, L., et al. 2023, ApJS, 265, 31, doi: 10.3847/1538-4365/acbb6a
- Ajello et al. (2022) Ajello, M., Baldini, L., Ballet, J., et al. 2022, ApJS, 263, 24, doi: 10.3847/1538-4365/ac9523
- Ballet et al. (2023) Ballet, J., Bruel, P., Burnett, T. H., Lott, B., & The Fermi-LAT collaboration. 2023, arXiv e-prints, arXiv:2307.12546, doi: 10.48550/arXiv.2307.12546
- Bellm et al. (2019) Bellm, E. C., Kulkarni, S. R., Graham, M. J., et al. 2019, PASP, 131, 018002, doi: 10.1088/1538-3873/aaecbe
- Burrows et al. (2005) Burrows, D. N., Hill, J. E., Nousek, J. A., et al. 2005, Space Sci. Rev., 120, 165, doi: 10.1007/s11214-005-5097-2
- Capel et al. (2022) Capel, F., Burgess, J. M., Mortlock, D. J., & Padovani, P. 2022, A&A, 668, A190, doi: 10.1051/0004-6361/202243116
- Chen (2018) Chen, L. 2018, ApJS, 235, 39, doi: 10.3847/1538-4365/aab8fb
- Drake et al. (2009) Drake, A. J., Djorgovski, S. G., Mahabal, A., et al. 2009, ApJ, 696, 870, doi: 10.1088/0004-637X/696/1/870
- Foschini et al. (2022) Foschini, L., Lister, M. L., Andernach, H., et al. 2022, Universe, 8, 587, doi: 10.3390/universe8110587
- Franckowiak et al. (2020) Franckowiak, A., Garrappa, S., Paliya, V., et al. 2020, ApJ, 893, 162, doi: 10.3847/1538-4357/ab8307
- Garrappa et al. (2019) Garrappa, S., Buson, S., Franckowiak, A., et al. 2019, ApJ, 880, 103, doi: 10.3847/1538-4357/ab2ada
- Giommi et al. (2020) Giommi, P., Padovani, P., Oikonomou, F., et al. 2020, A&A, 640, L4, doi: 10.1051/0004-6361/202038423
- IceCube Collaboration et al. (2018a) IceCube Collaboration, Aartsen, M. G., Ackermann, M., et al. 2018a, Science, 361, eaat1378, doi: 10.1126/science.aat1378
- IceCube Collaboration et al. (2018b) —. 2018b, Science, 361, 147, doi: 10.1126/science.aat2890
- IceCube Collaboration et al. (2022) IceCube Collaboration, Abbasi, R., Ackermann, M., et al. 2022, Science, 378, 538, doi: 10.1126/science.abg3395
- Icecube Collaboration et al. (2023) Icecube Collaboration, Abbasi, R., Ackermann, M., et al. 2023, Science, 380, 1338, doi: 10.1126/science.adc9818
- Ji & Wang (2024) Ji, S., & Wang, Z. 2024, ApJ, 975, L30, doi: 10.3847/2041-8213/ad87ea
- Jiang et al. (2024) Jiang, X., Liao, N.-H., Wang, Y.-B., et al. 2024, ApJ, 965, L2, doi: 10.3847/2041-8213/ad36b9
- Kadler et al. (2016) Kadler, M., Krauß, F., Mannheim, K., et al. 2016, Nature Physics, 12, 807, doi: 10.1038/nphys3715
- Keivani et al. (2018) Keivani, A., Murase, K., Petropoulou, M., et al. 2018, ApJ, 864, 84, doi: 10.3847/1538-4357/aad59a
- Liao et al. (2022) Liao, N.-H., Sheng, Z.-F., Jiang, N., et al. 2022, ApJ, 932, L25, doi: 10.3847/2041-8213/ac756f
- Mainzer et al. (2014) Mainzer, A., Bauer, J., Cutri, R. M., et al. 2014, ApJ, 792, 30, doi: 10.1088/0004-637X/792/1/30
- Mannheim (1995) Mannheim, K. 1995, Astroparticle Physics, 3, 295, doi: 10.1016/0927-6505(94)00044-4
- Mücke et al. (2003) Mücke, A., Protheroe, R. J., Engel, R., Rachen, J. P., & Stanev, T. 2003, Astroparticle Physics, 18, 593, doi: 10.1016/S0927-6505(02)00185-8
- Murase et al. (2018) Murase, K., Oikonomou, F., & Petropoulou, M. 2018, ApJ, 865, 124, doi: 10.3847/1538-4357/aada00
- Oikonomou et al. (2021) Oikonomou, F., Petropoulou, M., Murase, K., et al. 2021, J. Cosmology Astropart. Phys, 2021, 082, doi: 10.1088/1475-7516/2021/10/082
- Petropoulou et al. (2020a) Petropoulou, M., Oikonomou, F., Mastichiadis, A., et al. 2020a, ApJ, 899, 113, doi: 10.3847/1538-4357/aba8a0
- Petropoulou et al. (2020b) Petropoulou, M., Murase, K., Santander, M., et al. 2020b, ApJ, 891, 115, doi: 10.3847/1538-4357/ab76d0
- Planck Collaboration et al. (2020) Planck Collaboration, Aghanim, N., Akrami, Y., et al. 2020, A&A, 641, A6, doi: 10.1051/0004-6361/201833910
- Predehl et al. (2021) Predehl, P., Andritschke, R., Arefiev, V., et al. 2021, A&A, 647, A1, doi: 10.1051/0004-6361/202039313
- Sahakyan et al. (2023) Sahakyan, N., Giommi, P., Padovani, P., et al. 2023, MNRAS, 519, 1396, doi: 10.1093/mnras/stac3607
- Scargle et al. (2013) Scargle, J. D., Norris, J. P., Jackson, B., & Chiang, J. 2013, ApJ, 764, 167, doi: 10.1088/0004-637X/764/2/167
- Scarpa & Falomo (1997) Scarpa, R., & Falomo, R. 1997, A&A, 325, 109
- Tripathi et al. (2024) Tripathi, D., Giommi, P., Di Giovanni, A., et al. 2024, AJ, 167, 116, doi: 10.3847/1538-3881/ad216a
- Urry & Padovani (1995) Urry, C. M., & Padovani, P. 1995, PASP, 107, 803, doi: 10.1086/133630
- Wills & Lynds (1978) Wills, D., & Lynds, R. 1978, ApJS, 36, 317, doi: 10.1086/190503