Population synthesis of accreting white dwarfs: II. X-ray and UV emission
Abstract
Accreting white dwarfs (WDs) with non-degenerate companions are expected to emit in soft X-rays and the UV, if accreted H-rich material burns stably. They are an important component of the unresolved emission of elliptical galaxies, and their combined ionizing luminosity may significantly influence the optical line emission from warm ISM. In an earlier paper we modeled populations of accreting WDs, first generating WD with main-sequence, Hertzsprung gap and red giant companions with the population synthesis code BSE, and then following their evolution with a grid of evolutionary tracks computed with MESA. Now we use these results to estimate the soft X-ray (0.3-0.7keV), H- and He II-ionizing luminosities of nuclear burning WDs and the number of super-soft X-ray sources for galaxies with different star formation histories. For the starburst case, these quantities peak at Gyr and decline by orders of magnitude by the age of 10 Gyr. For stellar ages of 10 Gyr, predictions of our model are consistent with soft X-ray luminosities observed by Chandra in nearby elliptical galaxies and He II 4686 line ratio measured in stacked SDSS spectra of retired galaxies, the latter characterising the strength and hardness of the UV radiation field. However, the soft X-ray luminosity and He II 4686 ratio are significantly overpredicted for stellar ages of Gyr. We discuss various possibilities to resolve this discrepancy and tentatively conclude that it may be resolved by a modification of the typically used criteria of dynamically unstable mass loss for giant stars.
keywords:
binaries: close — supernovae: general — white dwarfs — X-rays: binaries1 Introduction
Accreting white dwarfs (WDs) are important for the study of binary evolution and accretion physics (see Postnov & Yungelson 2014; Maoz, Mannucci & Nelemans 2014 for a recent review). Depending on the accretion rates, they are deemed to be components of cataclysmic binaries (see Warner, 2003, for a comprehensive review) and supersoft X-ray sources (van den Heuvel et al., 1992). Under differing initial conditions, they are the progenitors of components of future double white dwarfs, type Ia supernovae and binary millisecond pulsars (e.g. Whelan & Iben, 1973; Tutukov & Yungelson, 1981; Webbink, 1984; Iben & Tutukov, 1984; Taam & van den Heuvel, 1986). Although they are widely studied, there remain many uncertainties concerning their formation and evolution. One avenue to constrain this problem is to invoke binary population synthesis. This allows one to compare the observed numbers and characteristics of these objects with that which are expected given our present understanding of binary evolution and accretion physics.
Hydrogen-rich material accreted by a WD from its companion may burn at its surface either stably or unstably. The result is strongly dependent on the mass transfer rate and mass of the WD (Paczynski & Zytkow, 1978; Sion, Acierno & Tomczyk, 1979). If the accretion rate corresponds to the stable nuclear burning regime, accreting white dwarfs (henceforth, SNBWD) have typical effective temperatures of K, emitting prominently in the soft X-ray and EUV. In this regime, not all accreting WDs can be observed as SSSs, as this depends on their intrinsic luminosity, effective temperature and the column density of the gas along the line of sight. In the present paper, we refer to SNBWDs with observed soft X-ray (0.30-0.70 keV) luminosity erg/s as SSSs. For accretion rates below the stability limit, hydrogen burning occurs only in unstable flashes, observable as novae. There will be little X-ray emission in this regime, except in the post-novae SSS phase (Truran & Glasner (1995); Wolf et al. (2013), Soraisam et al. (in prep.)). If the accretion rate is larger than the maximum rate for stable nuclear-burning, the result is still unclear (Cassisi, Iben & Tornambe, 1998; Hachisu, Kato & Nomoto, 1996). In the scenario of Cassisi, Iben & Tornambe (1998), the WD will become a red giant after accreting a small amount of mass (Paczyński, 1971). On the other hand, Hachisu, Kato & Nomoto (1996) proposed that in this regime the excess mass is lost as an optically thick wind. Following Lepo & van Kerkwijk (2013), the WDs in this regime are dubbed rapidly accreting white dwarfs (RAWDs). In this scenario, an accreting WD’s photosphere will expand modestly, lowering their effective temperatures such that they radiate predominantly in the EUV.
In addition to the emission from X-ray binaries dominating the X-ray radiation in most galaxies, extended emission in soft X-ray band is widely observed in galaxies of different morphologies. However, the origin of the extended emission is still unclear. Bogdán & Gilfanov (2008) demonstrated that the emission from accreting WDs should be an important component of the unresolved emission.
A population of accreting WDs with effective temperatures K should be capable of ionizing the interstellar medium. Rappaport et al. (1994) were the first to model ionization nebulae around SSSs, for the simple case of spherical symmetry and blackbody spectra. They found that these nebulae should have strong He II 4686, [O III] , and [O I] emission lines. Woods & Gilfanov (2013) demonstrated that accreting WDs may provide a significant, or even dominant, contribution to the ionizing background, particularly in early-type galaxies with passively-evolving stellar populations (those with negligible ongoing star formation). Depending on their numbers, this could significantly impact the ionization state of the warm ISM in gas-rich early-type galaxies. Serra et al. (2012) found that many early type galaxies (at least 40% outside the Virgo cluster) host a detectable mass of HI, i.e. . Morphologically, this gas is found in regular HI discs, rings and irregularly distributed clouds. Most common are HI discs and rings, which may extend to tens of kpc, suggesting a covering factor of 1/2 for the ionizing radiation from the stellar population.
Although emission from populations of accreting WDs is important, it has been seldom studied. In Paper I (Chen et al., 2014), we conducted a population synthesis study of accreting white dwarfs. We found that it is important to have a realistic prescription for mass transfer and investigated the number of RAWDs, SNBWDs and the SNe Ia rate in the single degenerate (SD) scenario. In this paper, based on the results of our binary population synthesis of Paper I, we study the soft X-ray and UV emission of the population of accreting WDs and their contribution to the radiation of elliptical galaxies in the He II 4686 and H emission lines. These results are then compared with observations.
The paper is structured as follows. In section 2, we describe how we calculate the emission spectra of accreting WDs. In section 3, we briefly outline the typical assumptions underlying our population synthesis. In section 4, we present the soft X-ray (0.3-0.7keV) luminosity, H ionizing luminosity, and He II ionizing luminosity from the population of accreting WDs as a whole. We also compute the expected ratio He II4686/H as a function of age for a starburst stellar population and compare with observations of early type galaxies in the Sloan Digital Sky Survey (SDSS; Johansson et al., 2014). In section 5, we discuss the uncertainties in our standard model and present a potential solution to resolve the discrepancy between the results found in our standard model and observations. In addition, we show the evolution of SSS number as a function of stellar age. Finally, we summarize our results and conclude in section 6.
2 Emission spectra of accreting white dwarfs
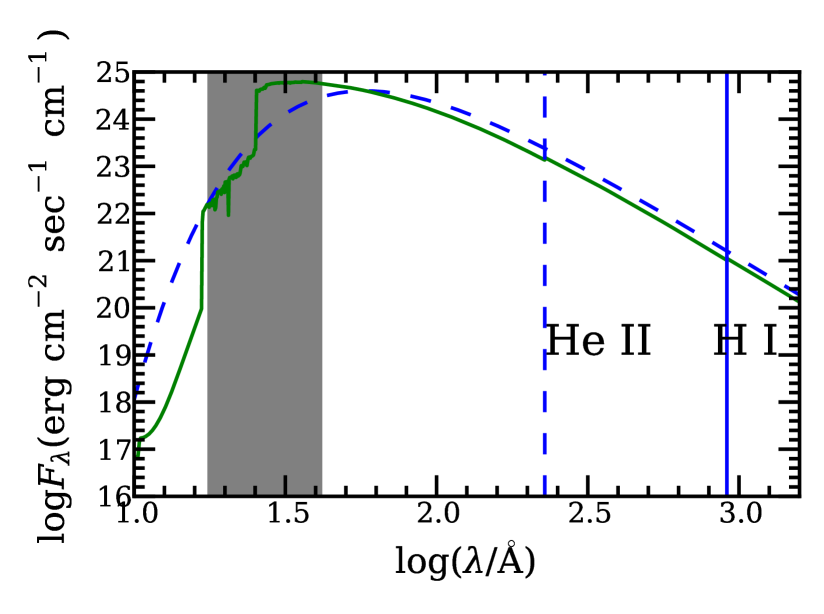
Detailed synthetic spectral models for accreting WDs can be produced using a non-local thermodynamic equilibrium (NLTE) stellar atmosphere model (e.g. Werner, 1986, 1989; Rauch, 2003), which is known to approximately reproduce SSSs spectra (e.g. Rauch et al., 2010). In Fig. 1, we compare the emission spectra of a SNBWD computed by means of a NLTE model111http://dc.g-vo.org/theossa with the blackbody approximation. Except for some absorption lines, the difference is not dramatic, particularly near the H and He II absorption edges. The difference in soft X-ray (0.3-0.7) keV luminosity between the blackbody approximation and NLTE models is smaller for accreting WDs with high temperatures and greater for low temperatures. With this discrepancy in mind, we adopt the blackbody approximation for SNBWD spectra in this paper.
For a SNBWD, the nuclear burning luminosity is
| (1) |
where erg/g is the nuclear energy release per unit mass of hydrogen, is the mass fraction of hydrogen and is the accretion rate. We ignore the accretion luminosity in the stable-burning regime, since it is much lower (less than 10% for and 20% for ) compared with the nuclear burning luminosity.
Detailed models of SNBWDs show that their photospheric radii are about times as large as the radius of a cool WD (depending on the accretion rates, Iben, 1982; Wolf et al., 2013). Wolf et al. (2013) simulated the evolution of accreting WDs with different accretion rates using the MESA code (Paxton et al., 2011, 2013). From their results, we know the dependence of the photospheric radius on the accretion rates in the stable-burning regime. For any given WD mass and accretion rate, we find the radius by linear interpolation of the results of Wolf et al. (2013) between WD mass and accretion rate. Then the effective temperature of SNBWDs is found from the Stefan-Boltzmann law.
RAWDs with accretion rates larger than the maximum stable burning rate, expand as the WD loses mass and the effective temperature decreases. Hachisu, Kato & Nomoto (1999) investigated the optically-thick wind solution for different white dwarfs with different accretion rates. They showed the dependence of photospheric radius and effective temperature on the accretion rate (see their Figs. 3, 4). By linear fitting of their results and linear interpolation among different WD masses, we can find the radius and the effective temperature for any combination of white dwarf mass and accretion rate. It has been shown that RAWDs with typical mass accretion rates (less than ) and effective temperatures (T 1–2K) can fully ionize hydrogen and helium beyond the wind photosphere (Woods & Gilfanov, 2013). For high accretion rates, the spectra of RAWDs are not well approximated by blackbody spectra because of absorption. However, high accretion rates can only be sustained for a short time and will contribute little to the total luminosity. Therefore, it is reasonable to use blackbody spectra as an approximation for RAWDs.
3 Binary Population Synthesis
In Paper I, we have introduced our approach to studying populations of accreting WDs, and have shown the importance of a careful treatment of the second mass transfer phase. Following the method outlined in Paper I, we carry out two sets of calculations with our BSE+MESA model. Here we briefly summarize the procedure and main assumptions of the calculation.
First, we evolve a set of binaries with different initial parameters using the BSE code (Hurley, Pols & Tout, 2000; Hurley, Tout & Pols, 2002), and obtain the binary parameters at the beginning of mass transfer for a population of WD binaries with main-sequence, Hertzsprung gap and red giant companions. Second, we compute a WD binary evolution library by means of the detailed stellar evolution code MESA (Paxton et al., 2011, 2013), which describes the evolution of WD binaries with different parameters at the beginning of mass transfer. For each WD binary with a given WD mass, donor mass and orbital period from the set of systems obtained in the first step of computations, we select the nearest track in the WD binary evolution library in order to follow its subsequent evolution. We take 1.2 as the upper limit of the nascent CO WD, which was implemented in the BSE code, although modern estimates give for single stars with Z = 0.02 (e.g. Doherty et al., 2015). For the distribution of initial binary parameters, we use the Kroupa IMF for the primary mass (Kroupa, 2001), a flat mass ratio distribution (Kraicheva et al., 1979) and a flat distribution in logarithmic space for binary separation (Abt, 1983). To describe common envelope evolution, we employ the -formalism (Webbink, 1984; de Kool, 1990). We use the fitting formula for the value of the binding energy parameter from Loveridge, van der Sluys & Kalogera (2011).
The efficiency of the common envelope phase in ejecting the donor star’s envelope remains uncertain (see Ivanova et al., 2013, for a comprehensive review). The latest studies of post-common envelope binaries (e.g. Davis, Kolb & Knigge, 2012) restrict to a canonical value with a tendency to decrease with increasing secondary mass and WD mass. Some studies (e.g. Davis, Kolb & Willems (2010); Zorotovic et al. (2010); Ricker & Taam (2012)) show that, likely, . Here we adopt two values: (model a025) and (model a050), performing calculations for each. In Paper I, we verified that the population of hydrogen-accreting WDs depends relatively weakly on the assumed value of .
Combining our binary population synthesis results for accreting white dwarfs with their predicted emission spectra, we study their X-ray and UV emission. As in Paper I, we investigate two simple but representative cases. (I) Starburst: all stars are formed at , after which the star formation rate is zero. (II) Constant star formation rate for 10 Gyr. These two cases provide us with simple models which are representative of elliptical-like and spiral-like galaxies, respectively.
4 Results
4.1 X-ray emission of accreting white dwarfs
| Name | age | observed | predicted | SSSs Num | |||
|---|---|---|---|---|---|---|---|
| (Gyr) | () | () | (erg/s) | (erg/s) | |||
| (1) | (2) | (3) | (4) | (5) | (6) | (7) | (8) |
| NGC3585 | 3 | 5.6 | 330-570 | ||||
| M32 | 4-10 | 6.3 | 0 | ||||
| NGC3377 | 4 | 2.9 | 30-60 | ||||
| M31 bulge | 6-10 | 6.7 | 10 | ||||
| M105 | 7-9 | 2.8 | 10-40 | ||||
| NGC4278 | 11 | 1.8 | 10-40 |
-
•
Notes. (1)-Galaxy name. (2)-Approximate stellar age of the galaxies. References-Terlevich & Forbes (2002); Coelho, Mendes de Oliveira & Cid Fernandes (2009); Olsen et al. (2006); Sánchez-Blázquez et al. (2006) (3) K-band luminosity of galaxies. (4)-Galactic absorption column density. (5)-Observed soft X-ray luminosity. (6)-Predicted soft X-ray luminosity. (7)-Predicted soft X-ray luminosity over observed soft X-ray luminosity. (8)-Predicted SSS number.
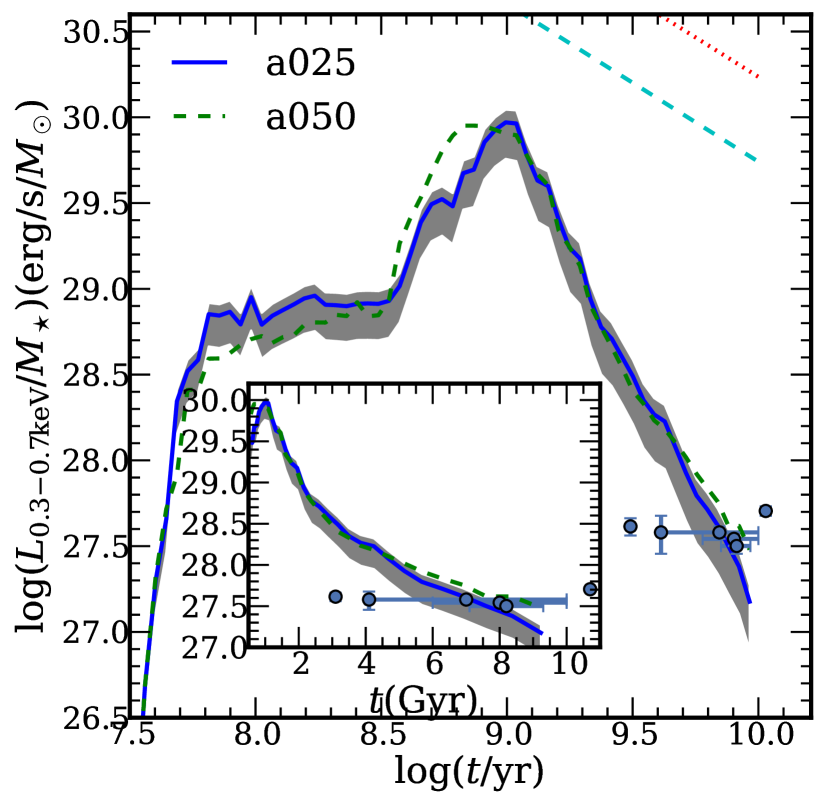
Figure 2 shows the evolution of the mass-normalized X-ray luminosity of the population of accreting WDs in the starburst and constant SFR cases. For our predicted observable X-ray luminosity, we apply absorption with a column density , which is a typical value for the extinction within the Galaxy at high Galactic latitudes (Dickey & Lockman, 1990). In addition, for early-type galaxies we also show the observed X-ray luminosity per unit mass with column density (the shaded region in the plot). This range of corresponds to that observed for the six elliptical galaxies in Table 1. In the calculation, we only considered Galactic absorption, since the intrinsic absorption of these elliptical galaxies is small.
Our calculations predict that in the starburst case, the X-ray luminosity sharply decreases after 1 Gyr (Fig. 2). At early times (stellar age Gyr), the X-ray luminosity in the starburst case is comparable with that in the constant SFR case for galaxies with the same mass. However, it is smaller for Gyr. In order to compare our results with observations we use X-ray data from Bogdán & Gilfanov (2010) and Zhang, Gilfanov & Bogdán (2012) for nearby elliptical galaxies. The data and our predictions are summarised in Table 1 where we list the observed X-ray luminosities along with the predicted X-ray luminosities and SSS numbers for six elliptical galaxies (Bogdán & Gilfanov, 2010; Zhang, Gilfanov & Bogdán, 2012). Note that observed luminosities are total soft X-ray luminosities of unresolved emission and soft compact sources and therefore should be regarded as upper limits on the soft X-ray luminosity of nuclear burning white dwarfs (see Bogdán & Gilfanov (2010) for details). In the calculation of the predicted X-ray luminosities and SSS numbers, we have taken absorption into consideration for different galaxies with different column density values.
One can see in Fig. 2 that, at the ages exceeding 6 Gyr, our predicted X-ray luminosities are comparable to that which are observed in nearby ellipticals, and is roughly two orders of magnitude below the soft X-ray flux expected if all SNe Ia are produced via the SD scenario (see Gilfanov & Bogdán (2010)). This is consistent with our prediction that the SD channel does not significantly contribute to the SN Ia rate at late delay times (see Fig. 8 in Paper I). However, for the two youngest galaxies in the Bogdán & Gilfanov (2010) sample, NGC3585 and NGC3377, our standard calculations predict up to an order of magnitude larger soft X-ray luminosities than observed. The strong dependence of the X-ray luminosity on the age of the stellar population predicted by our calculation seems to contradict observations. In interpreting this result one should keep in mind that there is some controversy regarding the ages of the two youngest galaxies. Idiart, Silk & de Freitas Pacheco (2007) found that the age of NGC3377 is around 7.8 Gyr and Georgiev, Goudfrooij & Puzia (2012) listed literature values of the age of NGC3377, varying from 3.5 Gyr to 8.9 Gyr. In the case of NGC3585, Michard (2006) found a single stellar population age of 1.7 Gyr, while Hempel et al. (2007) suggested that its age should be larger than 3 Gyr. On the other hand, metallicity may be important to explain the discrepancy between model predictions and observations. O’Sullivan & Ponman (2004) and Georgiev, Goudfrooij & Puzia (2012) found that the metallicities of the two youngest galaxies, NGC3585 and NGC3377, are likely to be lower than solar metallicity. However, solar abundance is adopted in our calculation. The metallicity plays a complicated role in the evolution of accreting WDs. The metallicity influences the initial-final mass relation for stars, the stable burning limits of accreting WDs, and the evolution of mass transfer rates (Umeda et al., 1999; Meng, Chen & Han, 2008; de Mink, Pols & Yoon, 2008; Kistler et al., 2013). Therefore, any strong conclusion based on the example of these two galaxies may be premature. On the other hand, a similar discrepancy was also found in comparing predicted populations of low mass X-ray binaries with observations, based on a larger and different sample of galaxies and age determinations (Zhang, Gilfanov & Bogdán, 2012; Fragos et al., 2013).
4.2 UV emission of accreting white dwarfs
Since nuclear-burning white dwarfs are characteristically high temperature sources, the emission from this population will ionize the ISM and will have an important influence on the structure of the ionized gas and emission lines of a galaxy. In particular, compared with the single stellar population, accreting WDs are likely to emit predominantly beyond the He II photoionizing limit (see Fig.1 in Woods & Gilfanov 2013). So in this section, we will investigate the H ionizing and He II ionizing luminosity of accreting, nuclear-burning WDs as a binary population. In addition, we will compute the predicted ratio of two recombination lines produced in the ISM, He II 4686Å/H, and compare this with observations.
In our calculation, we assumed the binary fraction to be 50%. It has been suggested that the binary fraction may depend on the binary parameters (Kouwenhoven et al., 2009; Kraus & Hillenbrand, 2009; Sana et al., 2012). We neglect this effect, and therefore may slightly underestimate the binary fraction in our calculations. According to its standard definition, the binary fraction includes all binary stars, irrespective of their separation and evolutionary state. Our population synthesis calculations keep track of only those binaries in which one of the components is a mass accreting white dwarf. Such mass-transferring binaries are in fact a very small minority in the population (in terms of the number of systems and total mass). In accounting stars in wide binaries we assume that their emission is similar to the emission of single stars of the same spectral type. To compute emission of single stars and stars in wide binaries we use the stellar population synthesis code of Bruzual & Charlot (2003), as described below. In computing the normalisation of the stellar emission we use the total mass of stars, ignoring the small fraction ( by mass ) of stars in mass transferring close binaries. Hereafter, we refer to the stars in wide binaries and single stars as single population (SP) and accreting, nuclear burning WDs as binary population (BP). The total emission of the entire population is computed as a sum of emission of the SP and BP. The SP-only model represents the hypothetical case of absence of mass-accreting white dwarfs in the stellar population.
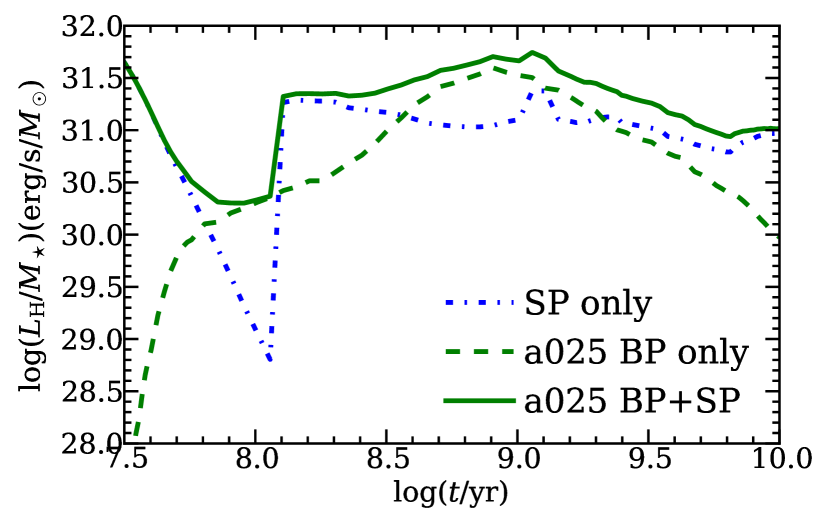
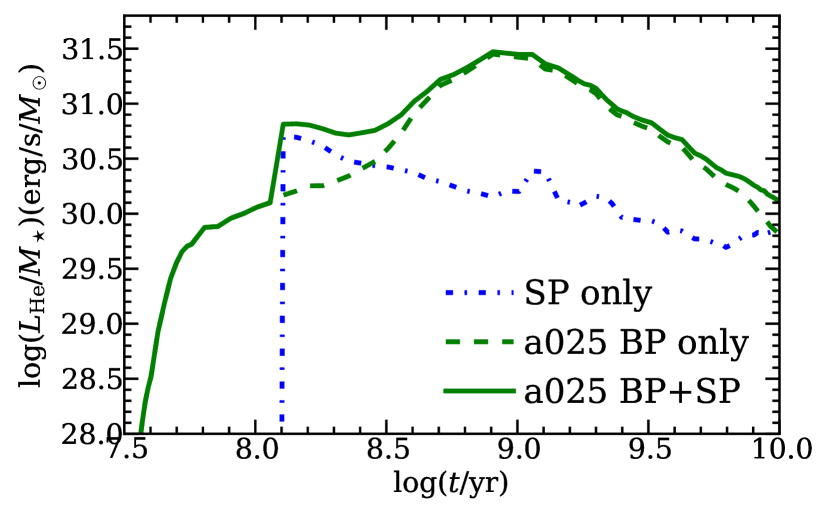
In Fig. 3, we show the evolution of the H-ionizing and He-ionizing luminosities as a function of stellar age in the starburst case. For the binary population, we only show the results for model a025, since we do not find a significant difference between models a025 and a050. To compute emission from the SP, we use the Bruzual & Charlot (2003) stellar population synthesis model. In running their model, we assumed solar metallicity and Chabrier (2003) IMF, as this model is not available for Kroupa IMF. This introduces only small inconsistency with our BP calculations (conducted for the Kroupa IMF). The Chabrier IMF has the same exponent as the Kroupa IMF for stellar masses above 1.0 and a more complicated shape at smaller masses. If the two IMFs are normalised to the same total mass, their high mass () parts have the same shape and only small () difference in normalisation. This will result in a similarly small difference () in the predicted ionizing luminosity between the two IMFs, since stars with initial mass below 1.0 do not contribute to the ionising UV radiation. Such a small difference is insignificant given the large dynamical range of the ionising luminosities plotted in Fig. 3. In Fig. 3, we do not show the case of a constant SFR, as in this case the H-ionizing and He-ionizing emission from accreting white dwarfs are significantly smaller than emission from the SP. This is due to the fact that in the constant SFR case there are many luminous young stars with high effective temperatures, which dominate the ionizing emission.
In the starburst case, the H-ionizing emission from the population of accreting WDs is comparable to that from the SP in the Gyr age range; it is unimportant for much earlier ages and for old galaxies. The He-ionizing emission on the contrary is predicted to dominate the ionizing UV background at ages greater than Gyr. In the SP model, massive stars dominate the ionizing UV radiation at early times. As the galaxy age increases, the main sequence turn-off mass decreases and the effective temperatures of the hottest stars in the population drops. This leads to the decrease of the ionizing luminosity seen in the Fig.3 at Myr. Around Myr, the first post-AGB stars appear, resulting in the sharp increase in the ionizing luminosity at Myr, thereafter they dominate the UV emission. Note that in the SP, the He-ionizing luminosity provided by the massive stars drops very steeply and is outside the plotting range in the lower panel of Fig. 3. In the considered time range ( Myrs), the He-ionizing luminosity of the SP becomes significant only after the first post-AGB stars appear at Myr. Note also, that the little “bump” around Gyr, which can be seen on the curves in Fig. 3, is due to the fact that stars undergo a helium flash and their effective temperatures increase.
Woods & Gilfanov (2013, 2014) proposed that the UV emission from accreting WDs is capable of ionizing the ISM. They investigated the contribution of accreting, nuclear-burning WDs in the SD scenario (as SNe Ia progenitors) and pAGB stars to the ionizing background and their influence on the emission lines of warm ISM in early-type galaxies. They predicted that, if the SD scenario for SNe Ia is the dominant channel, SNe Ia progenitors should strongly ionize He, producing strong He recombination lines in the extended emission-line regions of early-type galaxies. Such lines are predicted to be much weaker if only single pAGB stars are considered. Using a similar line of reasoning, one implication of the large population of accreting WDs found in our results across a large range of delay-times is that there should be strong He II recombination lines (e.g. He II 4686) detectable in stellar populations with ages larger than 0.3 Gyr but less than Gyr.
Among the recombination lines of He II, He II 4686 is the strongest line in the optical band, and is not heavily absorbed by the ISM. In order to avoid the uncertainties in the covering factor, we directly compare the predicted ratio of He II with observations. In order to predict the emission line fluxes, we make use of the photoionization code MAPPINGS III (e.g. Kewley et al., 2001; Groves, Dopita & Sutherland, 2004). The procedure is similar to that in Woods & Gilfanov (2013). Here we briefly summarize the main points and assumptions in the calculation.
Serra et al. (2012) found that the common morphology of HI gas in elliptical galaxies is a regular HI disc or ring. The HI discs may extend to several kpc well beyond the nucleus, and may or may not be confined within the stellar body of the galaxy. Given that this gas will be ionized by the combined diffuse emission of many distant sources, we assume plane-parallel geometry in our calculation. We adopt a constant hydrogen density , which agrees with the observed ratio of [SII] 6716Å/6731Å in passively-evolving galaxies (Yan & Blanton, 2012). Regarding the metallicities of the gas, which can be estimated from the oxygen abundance, Athey & Bregman (2009) found an average value of . So we use solar abundances in our calculation. Although the hydrogen density may be varied as the galaxy evolves or the metallicity may be different, the line ratio calculated in this work is relatively insensitive to the density and the metallicity. Following Johansson et al. (2014), we assume that the ionization parameter , where
This is consistent with the [O III] /H ratio found in their stacks of early-type galaxies.
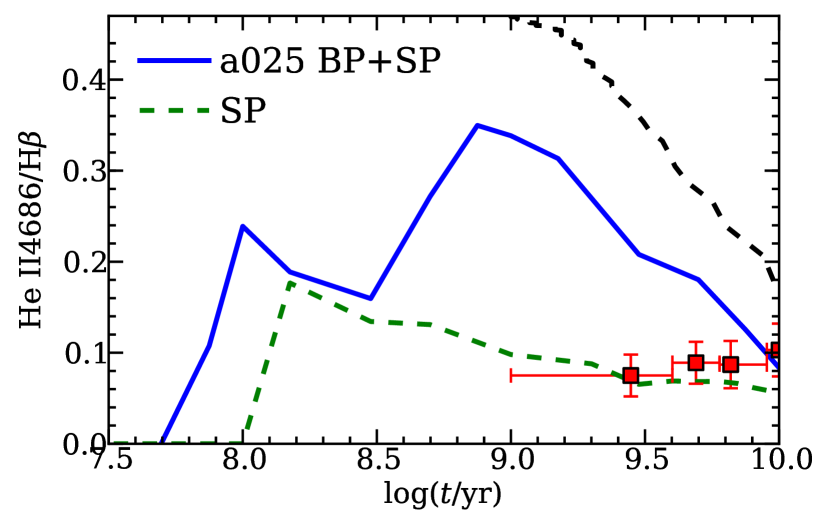
In Fig. 4, we present the computed He II 4686Å/H ratio powered by the emission from the SP together with the accreting WD population, and powered by the emission of the SP alone. At early times, the ratio begins to increase with the decrease in H-ionizing luminosity and increase of the He-ionizing luminosity. The ratio reaches its first maximum when the H-ionizing luminosity reaches its minimum. Around 0.15 Gyr, the H-ionizing luminosity from the SP increases and exceeds the emission from the accreting WDs by an order of magnitude, leading to the beginning of a decrease in this ratio. After that, the H-ionizing luminosity does not change significantly. Thereafter, the evolution of this ratio simply reflects the evolution of the He ionizing luminosity. The luminosity ratio at 10 Gyr is consistent with observations, but the computed ratio is larger than the observed one by a factor up to in the age range Gyr. This comes about due to the predominance of accreting WDs in producing our predicted ionizing background at these delay times. Although the total luminosities of accreting WDs and post-AGB stars in this age range are comparable, the lack of a sharp cutoff at 54.4eV in the spectra of accreting WDs leads to a dramatically greater production of He II-ionizing photons. In particular, the He II-ionizing luminosity predicted in our a025 model exceeds that in the SP case by up to an order of magnitude at t 1Gyr (see Fig. 3).
4.3 Emission from subsets of accreting WDs
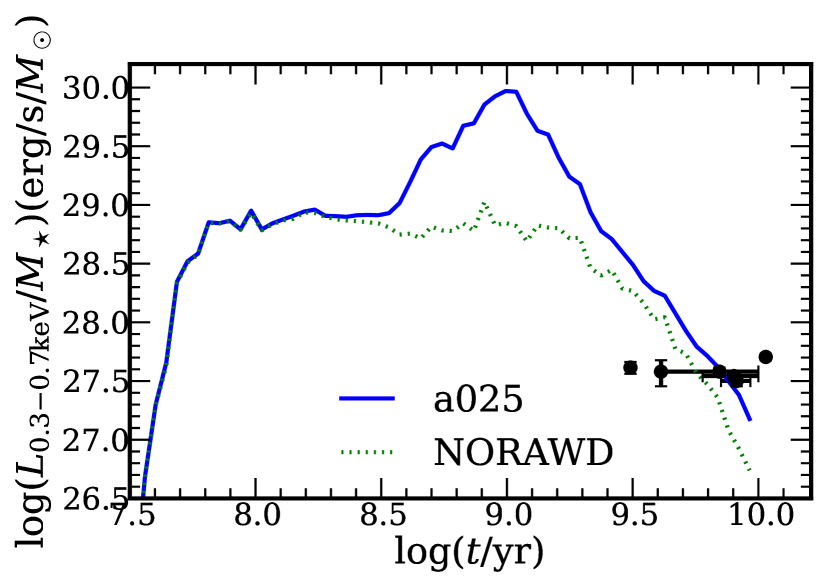
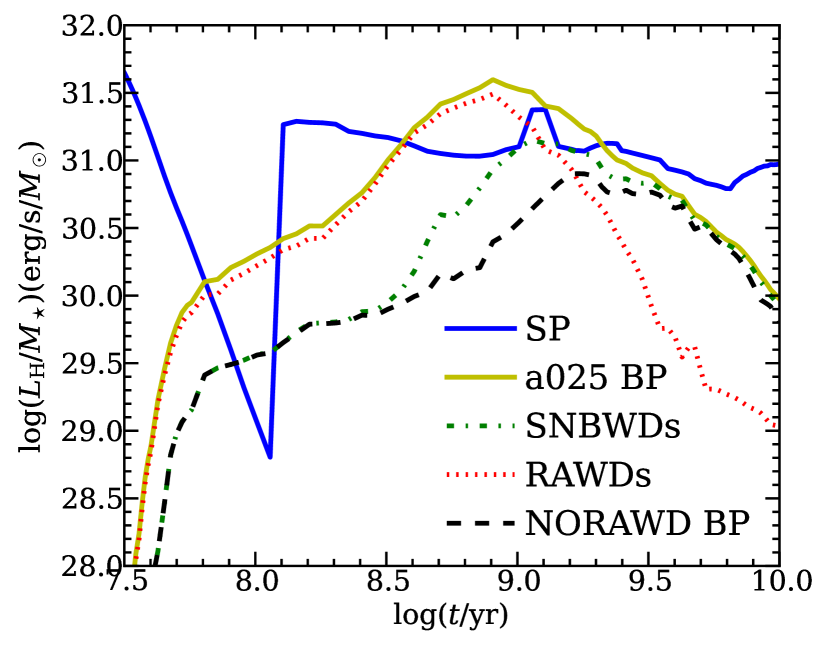
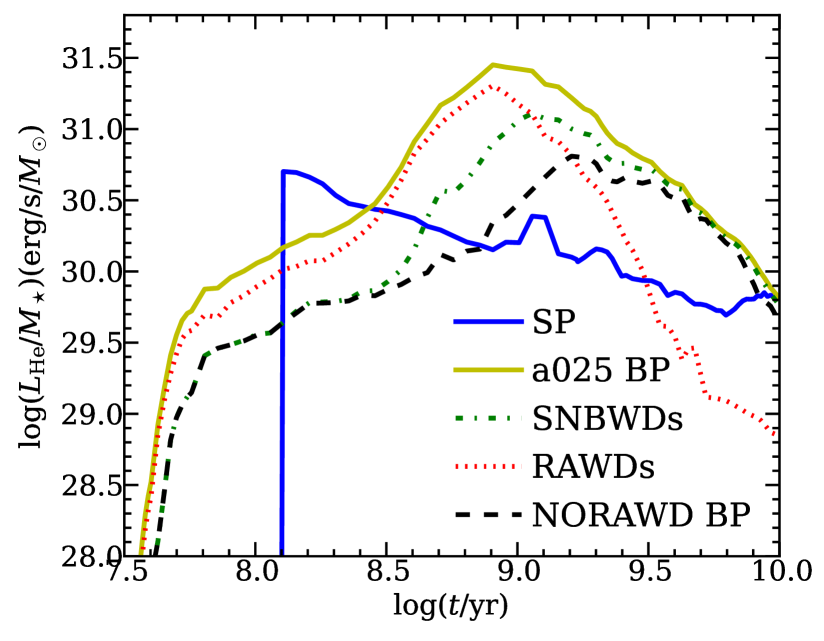
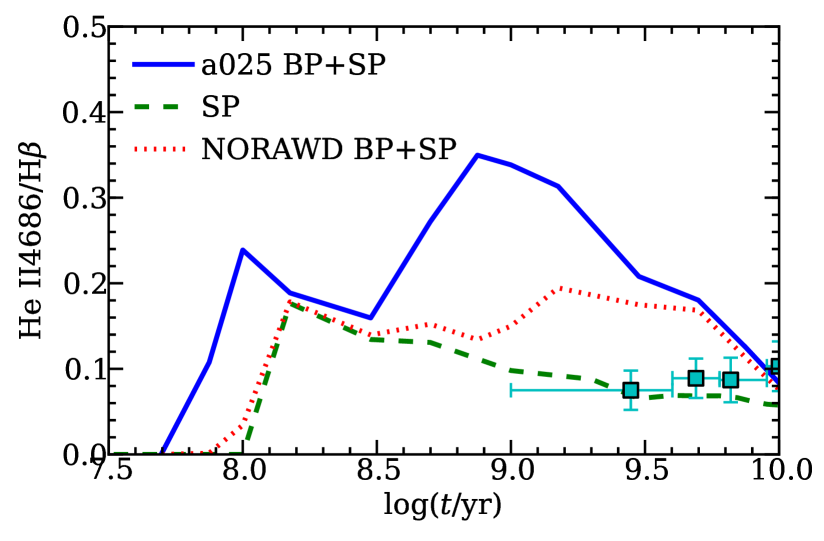
In Fig. 5, we show the soft X-ray emission from SNBWDs in model a025 and in an additional model in which we assume that upon exceeding the maximum accretion rate for stable burning, accreting WDs enter a CE phase instead of becoming RAWDs (model NORAWD) and WDs cease to contribute to X-ray and UV output of the population. Similar to Fig. 5, we show the H-ionizing luminosity and He-ionizing luminosity in Fig. 6. For the young stellar populations with age Gyr, the RAWDs dominate the H and He II ionizing emission. For old stellar populations ( Gyr), the H and He ionizing luminosity is dominated by emission from the SNBWDs. This is due to the fact that, at early times, the binaries have massive donor stars and higher thermal timescale mass transfer rates. In contrast, at later times, the donors are less massive and the thermal mass transfer rate is lower, leading to more emission from the SNBWDs. In the model NORAWD, the soft X-ray luminosity, H-ionizing luminosity and He-ionizing luminosity are very different from that in model a025. In Paper I (see Fig. 2), we found that there are two stable burning phases for some accreting WD binaries. In model NORAWD, replacing the RAWD phase with a CE, only the first stably burning phase will contribute to the emission. So the H and He-ionizing luminosity in model NORAWD are comparable to the emission from SNBWDs at early and late times, when massive systems do not make a contribution. In Fig. 7, we show the computed HeII 4686Å/ ratio in the model NORAWD and in model a025. The ratio reduces significantly, but it is still larger than the observed ones by a factor of 2. This corresponds to a remaining discrepancy of up to factors of 2 to 5 between our prediction for the He II-ionizing luminosity and that expected from the single stellar population alone (see Fig. 3).
5 Discussion
5.1 Model uncertainties
In the section above, we found that there is a strong dependence of soft X-ray luminosity and the ratio He II on stellar age for non-star-forming early-type galaxies in our calculation, in contrast with observations (Fig. 2 and Fig. 4). In producing a population synthesis model, there exist several uncertainties in both the initial conditions and the treatment of stellar evolution which may influence the results. In the following, we discuss a (partial) list of several aspects which may significantly impact our model, and their viability in providing a solution. Some of the model parameters not considered here were either tested and found to be of minimal importance (e.g. IMF, mass ratio), or are simply unlikely to be of significant impact (e.g. treatment of convective overshooting, as this only matters for massive stars).
1) One important uncertainty is the retention efficiency of accreted matter, (see Bours, Toonen & Nelemans (2013) 222Note, in Yungelson (2010) He-retention efficiency is calculated differently from that quoted by Bours, Toonen & Nelemans (2013).. In our calculation, we assumed that the He burning retention efficiency is 100%, which is clearly an overestimate and results in an excess of massive WDs 333 The WD mass may also be overestimated because of the initial-final mass function used in BSE code (see Claeys et al., 2014)., which may be partially responsible for the high H and He ionizing emission of accreting WDs. On the other hand, Piersanti, Tornambé & Yungelson (2014) have shown that the conventional assumption that the retention efficiency of matter at the surface of a WD may be computed as a product of independently calculated retentions of H and He (i.e. ), results in an underestimate of . The reason is that H-burning heats the underlying He layer and the outbursts of He-burning are milder than that in the case of accretion of pure He.
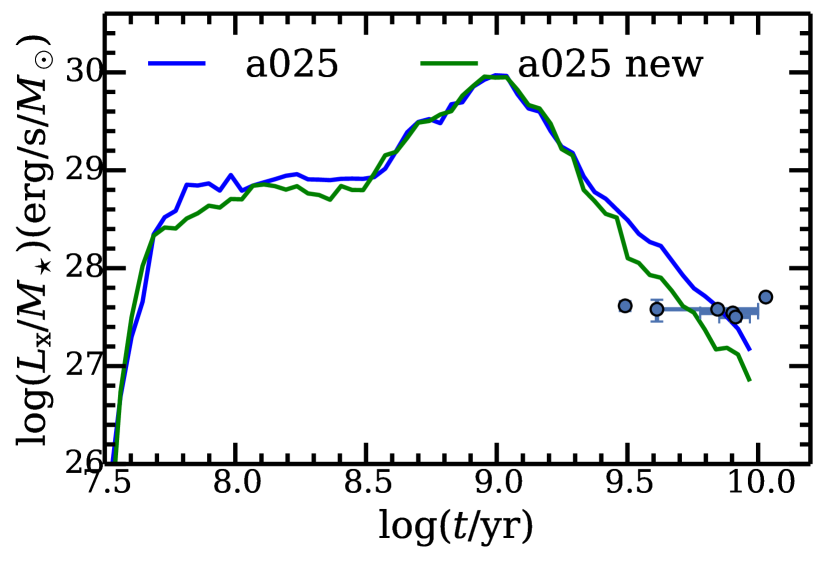
In order to check if He retention efficiency has a strong influence on our result, we recomputed our results with the He burning retention efficiency given in Hachisu, Kato & Nomoto (1999), and with the range in mass transfer rates corresponding to the stable burning regime as given in Wolf et al. (2013). In Fig. 8, we compare the soft X-ray luminosity from this new model with that from our standard model, and find the difference is not significant. In spite of this, we should emphasize that the retention efficiency suffers significant uncertainty, requiring further investigation. Therefore, without more precisely understood retention efficiency, we can not completely exclude the influence of this parameter.
2) In our calculations, solar abundance is adopted. As we discussed in Section 4.1, some galaxies in our X-ray comparison are likely to have low metallicities, which plays a complicated and still uncertain role in the evolution of accreting WDs. On the one hand, at very low metallicities the stable-burning regime may be extended to much lower mass transfer rates (Shen & Bildsten, 2007). However, at the same time low-Z WD binaries are expected to have much higher accretion rates (Langer et al., 2000), likely pushing many more binaries into dynamically unstable mass transfer. Either of these mechanisms require very low metallicities ( 0.01), unlikely to be typical of many of the relatively nearby early-type galaxies used in our study. Therefore, we leave consideration of the evolution of WD binaries at low-Z to a future study.
3) The X-ray comparison is based on a sample of six nearby galaxies (the only currently available set of measurements suitable for such a comparison). In addition, there is some controversy between different age estimates for the two youngest galaxies. However, while the incorrect age determination could in principle resolve the discrepancy in the X-ray band, it is unlikely to explain the He II 4686 line ratio, as demonstrated in Johansson et al. (2014).
4) It may be that our modeling of the emission spectra of nuclear burning white dwarfs is incorrect. This must involve a failure of the 1D theory, rather than any simple deviations from the black body spectral template used throughout the paper (see section 2). One obvious possibility is that the photospheric radii may be much larger than predicted by 1D models of the nuclear burning on the WD surface. This would shift the peak of their emission to the UV or optical bands where they would be remarkably unusual objects. However, Lepo & van Kerkwijk (2013) searched for such objects in the Small Magellanic Cloud and found no plausible candidates. Therefore this possibility seems to be unlikely.
5) One of the most important uncertainties in our calculations is the treatment of the CE phase. There are still many aspects of CE evolution which remain unclear, such as the available energy sources and the definition of the core-envelope boundary (see Ivanova et al. (2013) for a review,Hall & Tout (2014)). In addition, the criteria for the onset of a CE phase also suffer from great uncertainty. In the following subsection, we will discuss this possibility in depth and provide a possible solution to resolve the discrepancy between our computed results and observations.
5.2 A potential solution
In our calculations, for binaries harbouring giant donors, we adopted after Hjellming & Webbink (1987) and Webbink (1988) as the criterion for stable mass loss a critical value of mass ratio (hereafter, HW criterion):
| (2) |
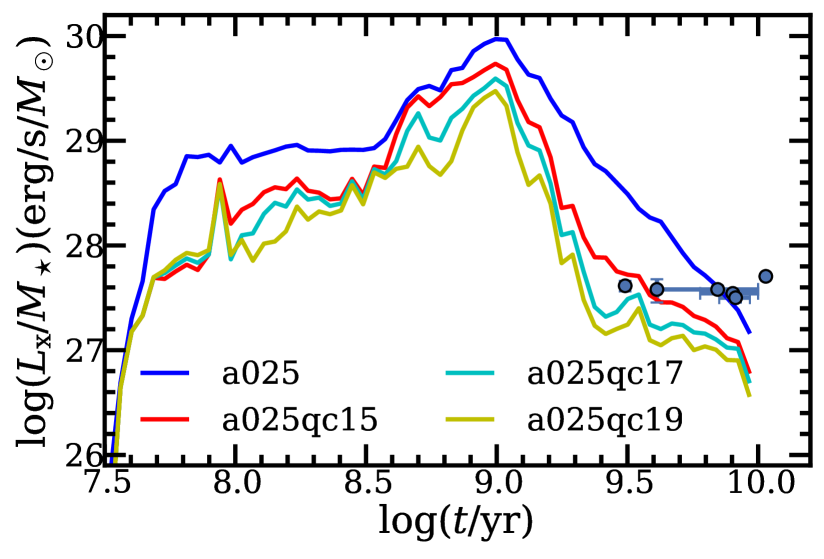
where is the core mass fraction. For conservative mass transfer, this predicts dynamical instability for stars with a core mass fraction , i.e. . Chen & Han (2008) (see also Han et al. (2002)), using detailed binary evolution calculations, found that the critical mass ratio can be up to , depending on the evolutionary phase of the donor star, mass and angular momentum loss from the system. Woods & Ivanova (2011) (see also Passy, Herwig & Paxton (2012)) found that this difference is due to the existence of a superadiabatic outer surface layer, which plays a critical role during the mass transfer. Following on the work of Woods & Ivanova (2011), Pavlovskii & Ivanova (2015) found that the critical mass ratio varies from 1.5 to 2.2 for conservative mass transfer. Given these recent results, we turn now to considering alternatives to the HW prescription, in particular a more stringent condition for the onset of a CE, as a possible solution to the overproduction of accreting WDs found in our standard model above. We attempt to replace the HW criteria with (model a025qc15), (model a025qc17), and (model a025qc19), for binaries consisting of MS and giant stars. Although the mass ratio needed for the onset of a CE is understood to vary significantly for differing combinations of accretor mass, donor mass, and evolutionary state of the donor, these values are more consistent with the results of detailed numerical simulations (e.g. Pavlovskii & Ivanova, 2015), and much higher than what is typically found when implementing the HW criterion. In this section, using these new criteria, we calculated the soft X-ray, H-ionizing and He-ionizing luminosity as a function of stellar age.
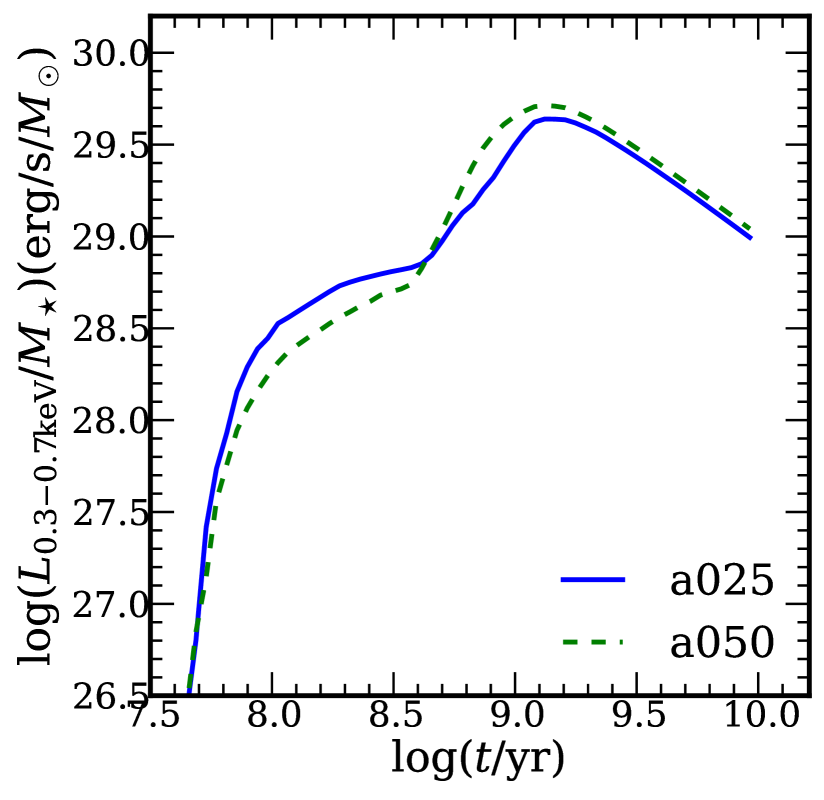
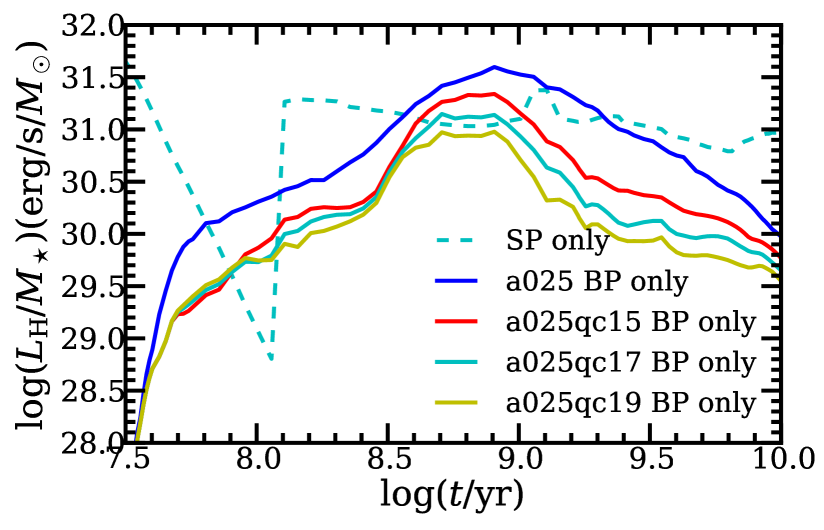
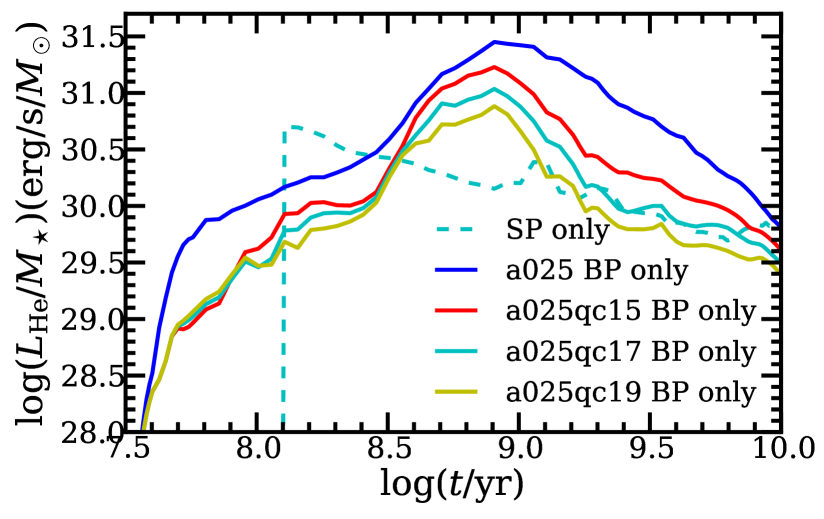
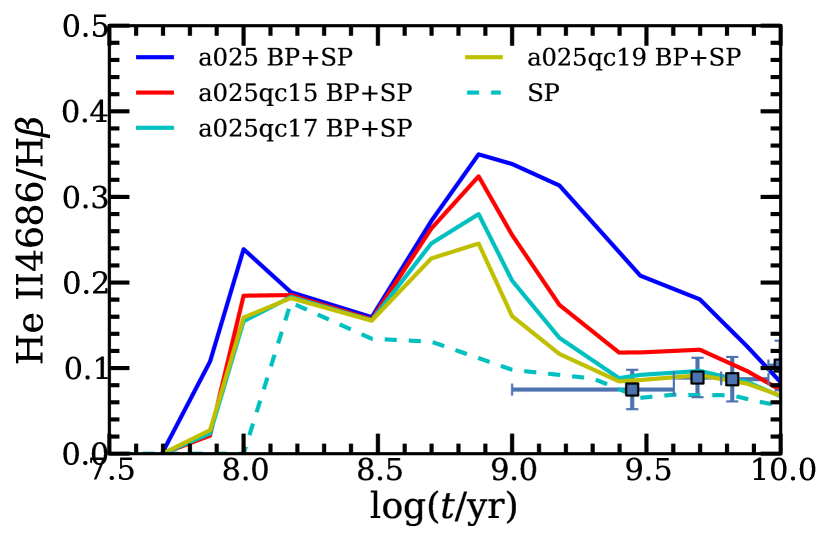
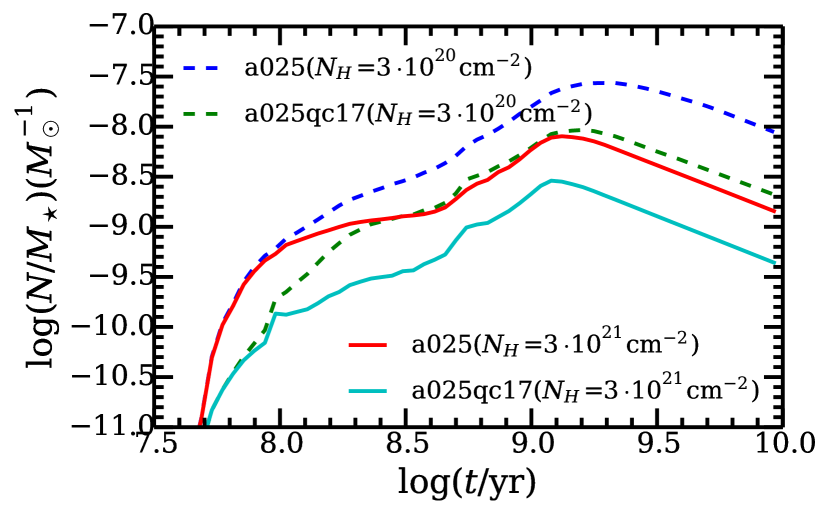
In Fig. 9, we show the evolution of soft X-ray luminosity as a function of stellar age. Compared with our model using the HW criterion, the new criteria have larger critical mass ratios. With larger critical mass ratios, the predicted soft X-ray luminosity becomes lower. This is due to the fact that, with the requirement of a larger critical mass ratio, it will be relatively difficult for binaries to enter dynamically unstable mass transfer. Therefore, fewer binaries will enter a CE phase, and fewer accreting WDs will form. For old stellar populations, the predicted soft X-ray luminosities in model a025qc17 and model a025qc19 are lower than the observed values. Given that the observational soft X-ray luminosity is the upper limit for the emission of accreting WDs, our results are consistent with observations. Fig. 10 shows the evolution of the H-ionizing and He-ionizing luminosity for different models, respectively. These results are similar to model a025, but the H-ionizing and He-ionizing luminosity is lower, for the same reason as above. In Fig. 11, we present the dependence of line ratio HeII on stellar age for the new models. For old stellar populations in model a025qc17 and model a025qc19, the line ratio is much smaller than that in model a025 and consistent with observations.
The use of fixed unique critical mass ratios for the onset of rapid, unstable mass transfer is not realistic (Nelemans et al., 2000; Woods & Ivanova, 2011). Numerical experiments above show that stability criteria of mass loss for giant stars play a crucial role in defining the number of SNBWD. However, stability also depends on mass of the donor, specific momentum of matter lost from the system etc. Fine-tuning of all these parameters may bring even better agreement of model and observations, but it is computer-time prohibitive.
5.3 Number of SSSs
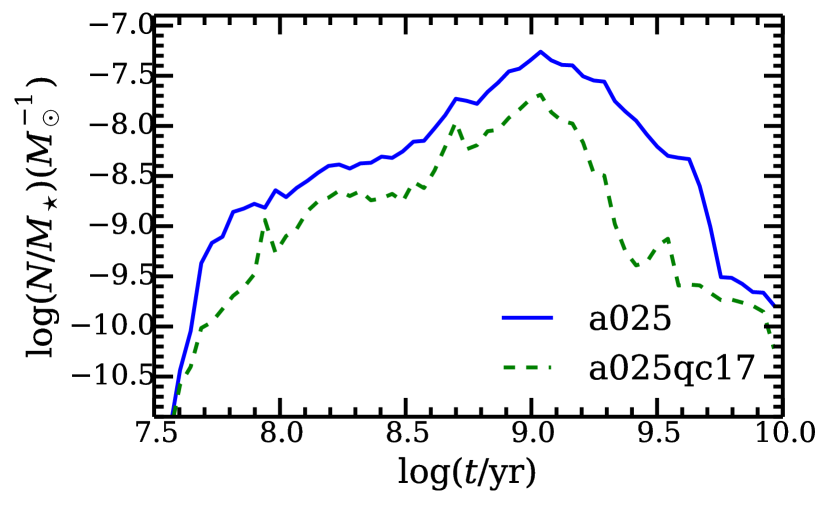
As discussed in Paper I, not all SNBWDs can be detected as SSSs, since this is dependent on the luminosity and effective temperature of the source, and the column density of the gas along the line of sight. In this paper, we define SSSs as SNBWDs with soft X-ray (0.30-0.70keV) luminosity erg/s. With this definition, we computed the evolution of the number of SSSs, which is shown in Fig. 12. In the starburst case, the SSS population peaks around Gyr and then declines by orders of magnitude by the age of 10 Gyr. We note that the ionizing radiation from SNBWDs has a peak at the same age range (see the figures above). A similar peak was found in earlier studies of SNe Ia rates in the single degenerate scenario (e.g. Canal, Ruiz-Lapuente & Burkert, 1996; Han & Podsiadlowski, 2004; Ruiter, Belczynski & Fryer, 2009; Yungelson, 2010). The reason for this is that main-sequence stars with mass close to have lifetimes Gyr and radii and luminosities that enable a relatively long stage of thermal time-scale mass loss with the rate /yr, corresponding to the stable hydrogen burning regime (see Figs. 2 and 10 in Paper I)444If mass loss is artificially fine-tuned, e.g., by the highly uncertain effect of mass-stripping effect of donors by an accretor wind (Hachisu, Kato & Nomoto, 1999), the peak may be shifted to younger ages, e.g., Mennekens et al. (2010). The peak is smeared by the scatter in the actual parameters of WD+MS pairs - masses, mass ratios of components, and initial separations.. The number of SSSs for a galaxy at 10 Gyr is in the starburst case and in the constant SFR case assuming . Given the high intrinsic absorption of spiral galaxies, we also made a set of calculations assuming . In this case, the SSS number is for a spiral-like galaxy. Note, however, that the observable number of SSSs depends on the absorption column density, which in turn depends on the relative distribution of gas and SSSs in any given galaxy.
5.4 Gaseous nebulae around SSSs
Given the hard emission of SSSs, it is suggested that they should be accompanied by ionized nebulae. Rappaport et al. (1994) modeled the ionization and temperature structure of such nebulae and predicted strong [OIII] 5007 and He II 4686 emission lines. Remillard, Rappaport & Macri (1995) searched for gaseous nebulae surrounding SSSs in the Large and Small Magellanic Clouds. They found only one SSS, Cal 83 (first identified as a high-excitation nebula by Pakull & Motch, 1989), with a detected nebula, with null detections among the 9 other known Magellanic SSSs. This means that either the time-averaged luminosity and/or temperature of these sources must be much lower than presently observed, or that the local ISM density around SSSs are typically too low. In fact, given that typical ISM densities are 1 – 2 orders of magnitude below that observed for the Cal 83 nebula, the latter appears more likely (see Woods & Gilfanov (submitted), who found a 70% probability that SSS in the LMC would have a detectable nebula). The situation is complicated further in the accretion-wind scenario – for SSSs in star-forming galaxies, a wind-blown bubble will excavate a cavity in the ISM surrounding the source which is 10 – 40 pc in radius (Badenes et al., 2007). Consequently, the ionization parameter and morphology of these nebulae will be much different.
Since the common morphology of HI gas in elliptical galaxies is a regular HI disk or ring, individual sources are not embedded in the ISM they ionize. With the above explanation and HI gas morphology in mind, we would expect that the individual emission line luminosity in elliptical galaxies should not be influenced by any complications introduced by the impact of the accreting WD on any surrounding ISM, as is the case in star-forming galaxies.
6 Summary and Conclusions
Based on the results of population synthesis of accreting WDs from Paper I and using simple assumptions regarding the emission of accreting WDs, we study the number of observed SSSs, the soft X-ray luminosity of accreting WDs, and their H and He II ionizing luminosity. The main conclusions are as follows.
-
1.
We compare predictions of our model with observations of nearby elliptical galaxies in optical and X-ray bands. To this end we use the He II 4686 line ratio to characterise the hardness and strength of the ionizing UV continuum. In our standard model, using commonly (although not universally) adopted assumptions, our predictions for the soft X-ray luminosity of old stellar populations are consistent with Chandra observations of several nearby elliptical galaxies. Likewise, for stellar ages of Gyr, the He II 4686 line ratio from warm ISM predicted by our model is consistent with that measured in the stacked SDSS spectra of retired galaxies. However, for stellar ages of Gyrs our model significantly over-predicts the soft X-ray luminosity and the He II 4686 line ratio.
-
2.
We discuss various possibilities to explain this controversy and tentatively conclude that the most likely reason is that the classical Hjellming & Webbink (1987) criterion typically used for evaluating the onset of dynamically unstable mass transfer for giant stars predicts too low critical mass ratio. Replacement of this criterion by fixed critical mass ratios ( or 1.9), brings the soft X-ray luminosity and line ratio He II in the new models to consistency with the observations. However, we stress that the critical mass ratio needed for the onset of a common envelope is actually not a fixed value, and varies in an as yet unspecified way as a function of other stellar parameters. Further effort is needed in this regard, in order to better reconcile the predictions of binary population synthesis with observations.
-
3.
In the starburst case, the population of SNBWDs, their combined soft X-ray and UV output and the number of SSSs (SNBWDs with erg/s) peak at Gyr and then strongly decline with age, by orders of magnitude. Assuming cm-2, the number of SSSs present at 10 Gyr in the starburst case is for a galaxy with mass . In the constant SFR case, assuming cm-2, the SSSs number at 10 Gyr is around for the same mass galaxy.
Acknowledgments
We would like to thank Bill Wolf for kindly providing us model data for stable-burning WDs. We are grateful to the MESA council for the MESA instrument papers and website. The TheoSSA service (http://dc.g-vo.org/theossa) used to retrieve theoretical spectra for this paper was constructed as a part of the activities of the German Astrophysical Virtual Observatory. HLC gratefully acknowledges support and hospitality from the MPG-CAS Joint Doctoral Promotion Program (DPP) and the Max Planck Institute for Astrophysics (MPA). This work was partially supported by the National Natural Science Foundation of China (Grant No.11390374), Science and Technology Innovation Talent Programme of Yunnan Province (Grant No. 2013HA005). The work is also partially supported by the Presidium of the Russian Academy of Sciences program P-41 and RFBR grants No. 14-02-00604 and 15-02-04053. LRY gratefully acknowledges warm hospitality and support from MPA-Garching. MG acknowledges hospitality of the Kazan Federal University (KFU) and support by the Rus- sian Government Program of Competitive Growth of KFU. ZWH thanks the support by the strategic Priority Research Program ”The Emergence of Cosmological Structures” of the Chinese Academy of Science, Grant No. XDB09010202. HLC acknowledges the computing time granted by the Yunnan Observatories and provided on the facilities at the Yunnan Observatories Supercomputing Platform.
References
- Abt (1983) Abt H. A., 1983, ARA&A, 21, 343
- Athey & Bregman (2009) Athey A. E., Bregman J. N., 2009, ApJ, 696, 681
- Badenes et al. (2007) Badenes C., Hughes J. P., Bravo E., Langer N., 2007, ApJ, 662, 472
- Bogdán & Gilfanov (2008) Bogdán Á., Gilfanov M., 2008, MNRAS, 388, 56
- Bogdán & Gilfanov (2010) Bogdán Á., Gilfanov M., 2010, A&A, 512, A16
- Bours, Toonen & Nelemans (2013) Bours M. C. P., Toonen S., Nelemans G., 2013, A&A, 552, A24
- Bruzual & Charlot (2003) Bruzual G., Charlot S., 2003, MNRAS, 344, 1000
- Canal, Ruiz-Lapuente & Burkert (1996) Canal R., Ruiz-Lapuente P., Burkert A., 1996, ApJ, 456, L101
- Cassisi, Iben & Tornambe (1998) Cassisi S., Iben, Jr. I., Tornambe A., 1998, ApJ, 496, 376
- Chabrier (2003) Chabrier G., 2003, PASP, 115, 763
- Chen et al. (2014) Chen H.-L., Woods T. E., Yungelson L. R., Gilfanov M., Han Z., 2014, MNRAS, 445, 1912 (Paper I)
- Chen & Han (2008) Chen X., Han Z., 2008, MNRAS, 387, 1416
- Claeys et al. (2014) Claeys J. S. W., Pols O. R., Izzard R. G., Vink J., Verbunt F. W. M., 2014, A&A, 563, A83
- Coelho, Mendes de Oliveira & Cid Fernandes (2009) Coelho P., Mendes de Oliveira C., Cid Fernandes R., 2009, MNRAS, 396, 624
- Davis, Kolb & Knigge (2012) Davis P. J., Kolb U., Knigge C., 2012, MNRAS, 419, 287
- Davis, Kolb & Willems (2010) Davis P. J., Kolb U., Willems B., 2010, MNRAS, 403, 179
- de Kool (1990) de Kool M., 1990, ApJ, 358, 189
- de Mink, Pols & Yoon (2008) de Mink S. E., Pols O. R., Yoon S.-C., 2008, in American Institute of Physics Conference Series, Vol. 990, First Stars III, O’Shea B. W., Heger A., eds., pp. 230–232
- Dickey & Lockman (1990) Dickey J. M., Lockman F. J., 1990, ARA&A, 28, 215
- Doherty et al. (2015) Doherty C. L., Gil-Pons P., Siess L., Lattanzio J. C., Lau H. H. B., 2015, MNRAS, 446, 2599
- Fragos et al. (2013) Fragos T. et al., 2013, ApJ, 764, 41
- Georgiev, Goudfrooij & Puzia (2012) Georgiev I. Y., Goudfrooij P., Puzia T. H., 2012, MNRAS, 420, 1317
- Gilfanov & Bogdán (2010) Gilfanov M., Bogdán Á., 2010, Nature, 463, 924
- Groves, Dopita & Sutherland (2004) Groves B. A., Dopita M. A., Sutherland R. S., 2004, ApJS, 153, 9
- Hachisu, Kato & Nomoto (1996) Hachisu I., Kato M., Nomoto K., 1996, ApJ, 470, L97
- Hachisu, Kato & Nomoto (1999) Hachisu I., Kato M., Nomoto K., 1999, ApJ, 522, 487
- Han & Podsiadlowski (2004) Han Z., Podsiadlowski P., 2004, MNRAS, 350, 1301
- Han et al. (2002) Han Z., Podsiadlowski P., Maxted P. F. L., Marsh T. R., Ivanova N., 2002, MNRAS, 336, 449
- Hempel et al. (2007) Hempel M., Zepf S., Kundu A., Geisler D., Maccarone T. J., 2007, ApJ, 661, 768
- Hjellming & Webbink (1987) Hjellming M. S., Webbink R. F., 1987, ApJ, 318, 794
- Hurley, Pols & Tout (2000) Hurley J. R., Pols O. R., Tout C. A., 2000, MNRAS, 315, 543
- Hall & Tout (2014) Hall, P. D., & Tout, C. A. 2014, MNRAS, 444, 3209
- Hurley, Tout & Pols (2002) Hurley J. R., Tout C. A., Pols O. R., 2002, MNRAS, 329, 897
- Iben (1982) Iben, Jr. I., 1982, ApJ, 259, 244
- Iben & Tutukov (1984) Iben, Jr. I., Tutukov A. V., 1984, ApJS, 54, 335
- Idiart, Silk & de Freitas Pacheco (2007) Idiart T. P., Silk J., de Freitas Pacheco J. A., 2007, MNRAS, 381, 1711
- Ivanova et al. (2013) Ivanova N. et al., 2013, A&A Rev., 21, 59
- Johansson et al. (2014) Johansson J., Woods T. E., Gilfanov M., Sarzi M., Chen Y.-M., Oh K., 2014, MNRAS, 442, 1079
- Kewley et al. (2001) Kewley L. J., Dopita M. A., Sutherland R. S., Heisler C. A., Trevena J., 2001, ApJ, 556, 121
- Kistler et al. (2013) Kistler M. D., Stanek K. Z., Kochanek C. S., Prieto J. L., Thompson T. A., 2013, ApJ, 770, 88
- Kouwenhoven et al. (2009) Kouwenhoven M. B. N., Brown A. G. A., Goodwin S. P., Portegies Zwart S. F., Kaper L., 2009, A&A, 493, 979
- Kraicheva et al. (1979) Kraicheva Z. T., Popova E. I., Tutukov A. V., Yungelson L. R., 1979, Soviet Ast., 23, 290
- Kraus & Hillenbrand (2009) Kraus A. L., Hillenbrand L. A., 2009, ApJ, 703, 1511
- Kroupa (2001) Kroupa P., 2001, MNRAS, 322, 231
- Langer et al. (2000) Langer N., Deutschmann A., Wellstein S., Höflich P., 2000, A&A, 362, 1046
- Lepo & van Kerkwijk (2013) Lepo K., van Kerkwijk M., 2013, ApJ, 771, 13
- Loveridge, van der Sluys & Kalogera (2011) Loveridge A. J., van der Sluys M. V., Kalogera V., 2011, ApJ, 743, 49
- Maoz, Mannucci & Nelemans (2014) Maoz D., Mannucci F., Nelemans G., 2014, ARA&A, 52, 107
- Meng, Chen & Han (2008) Meng X., Chen X., Han Z., 2008, A&A, 487, 625
- Mennekens et al. (2010) Mennekens N., Vanbeveren D., De Greve J. P., De Donder E., 2010, A&A, 515, A89
- Michard (2006) Michard R., 2006, A&A, 449, 519
- Nelemans et al. (2000) Nelemans G., Verbunt F., Yungelson L. R., Portegies Zwart S. F., 2000, A&A, 360, 1011
- Olsen et al. (2006) Olsen K. A. G., Blum R. D., Stephens A. W., Davidge T. J., Massey P., Strom S. E., Rigaut F., 2006, AJ, 132, 271
- O’Sullivan & Ponman (2004) O’Sullivan E., Ponman T. J., 2004, MNRAS, 349, 535
- Paczyński (1971) Paczyński B., 1971, Acta. Astron., 21, 417
- Paczynski & Zytkow (1978) Paczynski B., Zytkow A. N., 1978, ApJ, 222, 604
- Pakull & Motch (1989) Pakull M. W., Motch C., 1989, in European Southern Observatory Conference and Workshop Proceedings, Vol. 32, European Southern Observatory Conference and Workshop Proceedings, Meurs E. J. A., Fosbury R. A. E., eds., p. 285
- Passy, Herwig & Paxton (2012) Passy J.-C., Herwig F., Paxton B., 2012, ApJ, 760, 90
- Pavlovskii & Ivanova (2015) Pavlovskii K., Ivanova N., 2015, MNRAS, 449, 4415
- Paxton et al. (2011) Paxton B., Bildsten L., Dotter A., Herwig F., Lesaffre P., Timmes F., 2011, ApJS, 192, 3
- Paxton et al. (2013) Paxton B. et al., 2013, ApJS, 208, 4
- Piersanti, Tornambé & Yungelson (2014) Piersanti L., Tornambé A., Yungelson L. R., 2014, ArXiv e-prints
- Postnov & Yungelson (2014) Postnov K. A., Yungelson L. R., 2014, Living Reviews in Relativity, 17, 3
- Rappaport et al. (1994) Rappaport S., Chiang E., Kallman T., Malina R., 1994, ApJ, 431, 237
- Rauch (2003) Rauch T., 2003, A&A, 403, 709
- Rauch et al. (2010) Rauch T., Orio M., Gonzales-Riestra R., Nelson T., Still M., Werner K., Wilms J., 2010, ApJ, 717, 363
- Remillard, Rappaport & Macri (1995) Remillard R. A., Rappaport S., Macri L. M., 1995, ApJ, 439, 646
- Ricker & Taam (2012) Ricker P. M., Taam R. E., 2012, ApJ, 746, 74
- Ruiter, Belczynski & Fryer (2009) Ruiter A. J., Belczynski K., Fryer C., 2009, ApJ, 699, 2026
- Sana et al. (2012) Sana H. et al., 2012, Science, 337, 444
- Sánchez-Blázquez et al. (2006) Sánchez-Blázquez P., Gorgas J., Cardiel N., González J. J., 2006, A&A, 457, 809
- Serra et al. (2012) Serra P. et al., 2012, MNRAS, 422, 1835
- Shen & Bildsten (2007) Shen K. J., Bildsten L., 2007, ApJ, 660, 1444
- Sion, Acierno & Tomczyk (1979) Sion E. M., Acierno M. J., Tomczyk S., 1979, ApJ, 230, 832
- Taam & van den Heuvel (1986) Taam R. E., van den Heuvel E. P. J., 1986, ApJ, 305, 235
- Terlevich & Forbes (2002) Terlevich A. I., Forbes D. A., 2002, MNRAS, 330, 547
- Totani et al. (2008) Totani T., Morokuma T., Oda T., Doi M., Yasuda N., 2008, PASJ, 60, 1327
- Truran & Glasner (1995) Truran J. W., Glasner S. A., 1995, in Astrophysics and Space Science Library, Vol. 205, Cataclysmic Variables, Bianchini A., della Valle M., Orio M., eds., p. 453
- Tutukov & Yungelson (1981) Tutukov A. V., Yungelson L. R., 1981, Nauchnye Informatsii, 49, 3
- Umeda et al. (1999) Umeda H., Nomoto K., Yamaoka H., Wanajo S., 1999, ApJ, 513, 861
- van den Heuvel et al. (1992) van den Heuvel E. P. J., Bhattacharya D., Nomoto K., Rappaport S. A., 1992, A&A, 262, 97
- van Haaften et al. (2013) van Haaften L. M., Nelemans G., Voss R., Toonen S., Portegies Zwart S. F., Yungelson L. R., van der Sluys M. V., 2013, A&A, 552, A69
- Warner (2003) Warner B., 2003, Cataclysmic Variable Stars
- Webbink (1984) Webbink R. F., 1984, ApJ, 277, 355
- Webbink (1988) Webbink R. F., 1988, The Formation and Evolution of Symbiotic Stars, Mikolajewska J., Friedjung M., Kenyon S. J., Viotti R., eds., p. 311
- Werner (1986) Werner K., 1986, A&A, 161, 177
- Werner (1989) Werner K., 1989, A&A, 226, 265
- Whelan & Iben (1973) Whelan J., Iben, Jr. I., 1973, ApJ, 186, 1007
- Wolf et al. (2013) Wolf W. M., Bildsten L., Brooks J., Paxton B., 2013, ApJ, 777, 136
- Woods & Gilfanov (2013) Woods T. E., Gilfanov M., 2013, MNRAS, 432, 1640
- Woods & Gilfanov (2014) Woods T. E., Gilfanov M., 2014, MNRAS, 439, 2351
- Woods & Ivanova (2011) Woods T. E., Ivanova N., 2011, ApJ, 739, L48
- Yan & Blanton (2012) Yan R., Blanton M. R., 2012, ApJ, 747, 61
- Yungelson (2010) Yungelson L. R., 2010, Astronomy Letters, 36, 780
- Zhang, Gilfanov & Bogdán (2012) Zhang Z., Gilfanov M., Bogdán Á., 2012, A&A, 546, A36
- Zorotovic et al. (2010) Zorotovic M., Schreiber M. R., Gänsicke B. T., Nebot Gómez-Morán A., 2010, A&A, 520, A86