Predictive Mutation Analysis via Natural Language Channel in Source Code
Abstract
Mutation analysis can provide valuable insights into both System Under Test (SUT) and its test suite. However, it is not scalable due to the cost of building and testing a large number of mutants. Predictive Mutation Testing (PMT) has been proposed to reduce the cost of mutation testing, but it can only provide statistical inference about whether a mutant will be killed or not by the entire test suite. We propose Seshat, a Predictive Mutation Analysis (PMA) technique that can accurately predict the entire kill matrix, not just the mutation score of the given test suite. Seshat exploits the natural language channel in code, and learns the relationship between the syntactic and semantic concepts of each test case and the mutants it can kill, from a given kill matrix. The learnt model can later be used to predict the kill matrices for subsequent versions of the program, even after both the source and test code have changed significantly. Empirical evaluation using the programs in the Defects4J shows that Seshat can predict kill matrices with the average F-score of 0.83 for versions that are up to years apart. This is an improvement of F-score by 0.14 and 0.45 point over the state-of-the-art predictive mutation testing technique, and a simple coverage based heuristic, respectively. Seshat also performs as well as PMT for the prediction of the mutation score only. When applied to a Mutation Based Fault Localisation (MBFL) technique, the predicted kill matrix by Seshat is successfully used to locate faults within the top ten position, showing its usefulness beyond prediction of mutation scores. Once Seshat trains its model using a concrete mutation analysis, the subsequent predictions made by Seshat are on average 39 times faster than actual test-based analysis. We also show that Seshat can be successfully applied to automatically generated test cases with an experiment using EvoSuite.
Keywords Mutation Analysis, Deep Learning
1 Introduction
A long standing issue in a mutation analysis is its limited scalability [37]. As the size of the System Under Test (SUT) grows, the number of generated mutants also increases significantly. Each mutant then has to be compiled, and executed, to check whether it is killed (i.e., detected as behaving differently) by any of the existing test cases, resulting in a significant, sometimes infeasible, amount of cost. Many different approaches have been proposed to improve the scalability of mutation testing, but they either require more complicated program instrumentation to detect internal state deviation instead of propagated external behaviour (weak mutation [22, 35]), need more sophisticated code mutation that combines multiple mutants into a single compilation (meta-mutation [44]), or simply discard some mutants (mutant sampling [36, 13]). In many of these approaches, the improvement in scalability is linearly bound to the number of mutants (not) analysed.
Recently, Predictive Mutation Testing (PMT) has been proposed to attack the scalability issue in mutation testing from a very different angle [51, 32]. Instead of reducing the number of mutants to analyse, PMT collects test suite level dynamic features that are highly relevant to whether a mutant can be killed or not (such as the number of tests that cover the mutated statement, or the number of times the mutated statement is executed by the test suite), and performs statistical inference about the probability of the mutant being killed by the given test suite. Given sufficient preceding mutation testing results, PMT trains a model that can predict whether a mutant will be killed by a test suite. While PMT can achieve cost saving that is not linearly bound to the number of mutants considered, its limitation is the fact that it can only make a test suite level prediction, which is sufficient to predict the mutation score (i.e., the ratio of killed mutants to the generated mutants) but not the relationship between a mutant and a single test case.
This paper proposes Seshat 111Seshat is an Egyptian deity responsible for writing and record keeping., a predictive model for the relationship between mutants and individual test cases. Compared to PMT, Seshat can predict the entire kill matrix222Given mutants and test cases, a kill matrix is an -by- matrix, where is 1 if the mutant is killed by the test , and 0 otherwise. that results from mutation analysis. We refer to this new type of predictive modelling as Predictive Mutation Analysis (PMA), to emphasise the finer granularity of the prediction, as opposed to PMT, whose outcome is the test suite level mutation analysis.
Seshat exploits the Natural Language (NL) channel in software [2]. Natural Language channel refers to the communication channel that explains the conceptual contexts of the actual executions via natural language elements in source code, such as identifier names. In comparison, the traditional mutation analysis depends on the Algorithmic (AL) channel, via which the semantics of the program (and, naturally, its mutant) is actually computed. The existence of NL channel as a human to human communication medium has been known for a long time [30], but recent advances in the application of language models to source code have revealed that the NL channel can be a rich source of information for various automated tasks, such as code completion [19] or fault localisation [40].
Consider a test case whose name contains domain specific terms, such as testAccountBalance. We posit that this test case has a much higher chance of killing any mutants that are generated within the scope of a method named getAccountBalance() than another method named updateEmailAddress(int userID, String emailAddress). Given a kill matrix that has been obtained from actual mutation analysis, Seshat can learn the relationship through the similarity between the names of each test case and the mutants it can kill. Since the relationship is learnt in the NL channel, it can later be used to predict the relationship between unseen test cases and mutants, without any execution.
In addition to names, we extract the syntactic and semantic concepts in source code and test cases, using Deep Neural Network (DNN) with the word embedding layers and the bidirectional GRUs [5]. We include the change caused by the mutation, and the type of mutation, as features of our model. Under the cross-version scenario, we evaluate Seshat using different versions of subject programs in the Defects4J benchmark and two mutation tools PIT [6] and Major [25]. Although Seshat solely depends on the static features, the results show that Seshat can predict kill matrices with up to F-score of 0.94 and outperforms PMT and a coverage based baseline model. Notably, Seshat does more than simply memorising the relationship between test cases and mutant locations, as it shows an average prediction F-score of 0.78 for newly added test cases. Compared to generating full kill matrix by executing all individual tests against mutants, the prediction by Seshat is orders of magnitude faster: encouragingly, the bigger the target program is, the higher the speed-up becomes. The contributions of this paper are as follows:
-
•
We introduce Seshat, a Predictive Mutation Analysis (PMA) technique that can predict full kill matrices for unseen mutants and test cases.
-
•
We formulate predictive modelling of mutation analysis as a machine learning problem in the Natural Language (NL) channel in source code. To our knowledge, this is the first attempt to analyse mutation results using the NL channel.
-
•
We conduct a large scale evaluation of Seshat using multiple versions of real world Java projects in the Defects4J benchmark, and two widely-used mutation tools. Seshat achieves F-score of 0.83 on average, between versions that are years apart. Moreover, Seshat outperforms an existing Predictive Mutation Testing (PMT) technique with finer granularity of the prediction and shows comparable results with PMT when it is used to predict the mutation scores.
-
•
Beyond predicting the mutation score, we apply Seshat to Mutation Based Fault Localisation (MBFL) technique and evaluate its localisation effectiveness on 220 buggy programs in Defects4J. It successfully locates faults within the top ten position, which is competitive results with original MBFL technique that uses an intact kill matrix.
-
•
We evaluate whether Seshat can be applied to automatically generated test cases. Our experimentation with EvoSuite suggests that, as long as a meaningful naming convention is upheld during the generation of the test cases, Seshat can exploit the information in the same way and predict kill matrices of EvoSuite generated test suites with F-score of up to 0.86.
The rest of the paper is organised as follows. Section 2 describes how Seshat formulates predictive mutation analysis using the Natural Language channel. Section 3 describes the details about the experimental setup, and introduces the research questions. Section 4 presents and discusses the results of empirical evaluation. Section 5 presents discussions about changes of test quality, data imbalance, and ablation study. Section 6 considers threats to validity, and Section 7 describes the related work. Finally, Section 8 concludes.
2 Seshat: Predictive Mutation Analysis using NL Channel
This section describes how we formulate prediction of the relationship between mutants and test cases via Natural Language (NL) channel. It also presents our model architecture for prediction of kill matrices.
2.1 Looking at Mutation through Natural Language Channel
The essential steps of mutation analysis are as follows. First, we mutate the target program using syntactic transformations, i.e., mutation operators. Second, we execute the available test cases against the mutated program. Finally, we check whether the mutant is killed, i.e., whether the program behaves differently when mutated and executed by the given test cases. The details of these steps are captured by the PIE theory [45]: for a test case to kill a mutant, it should first Execute the mutant; the execution should result in an Infected internal state, which should be Propagated to the observable output.
All three stages of PIE take place in what Casalnuovo et al. call Algorithm (AL) channel, as opposed to Natural Language (NL) channel [2]; in the source code, the AL channel represents the computational semantics and executions, whereas the NL channel represents the identifiers and comments that assist human comprehension. Most of the existing analyses operate within the AL channel that dictates whether PIE conditions are satisfied or not, while the NL channel has not been considered as an important factor.
An interesting recent advance, Predictive Mutation Testing (PMT), aims to build a predictive model using the features based on the PIE theory [51, 32]. The two dynamic features, which are known to be the most important features in PMT, are related to the test execution: numTestCovered (the number of tests in the whole test suite covering the mutated statement) and numExecuteCovered (the number of times the mutated statement is executed by the whole test suite). The higher these dynamic feature values are, the more likely it is that the PIE conditions are met. We note that these dynamic features are essentially statistical aggregation within the AL channel, and also that the static features in PMT all concern structural properties of the code that exist in the AL channel.
We propose to reconstruct the results of mutation analysis in the NL channel. Intuitively, the prediction made by PMT using the AL channel is that “if a mutant is executed frequently by many different test cases, it is more likely to be killed”. Here, the code coverage is used as a surrogate measure of proximity by computational semantics, as is often the case in regression testing optimisation [50]. Our parallel intuition is as follows: “if the properties of a mutant are syntactically/semantically similar, or closely related to, those of a given test case, it is more likely to be killed by the test case.”
2.2 Predictive Mutation Analysis
A clear benefit of using the NL channel is that we can make predictions about a single mutant and a single test case. On the contrary, PMT depends on the aggregation of the features over the entire test cases and the satisfaction of the PIE conditions. We hypothesize that this will hinder making accurate predictions for a single test case. However, the prediction within the NL channel can be made by learning one-to-one relationship between the mutants and the test cases. The one-to-one relationship allows us to predictively build the entire kill matrix, which is required by many applications of mutation analysis such as fault localisation [38, 33, 21, 27], test data generation [29, 36, 16], and automated program repair [8, 9, 48, 11]. To distinguish the difference in prediction granularity, we call the one-to-one predictive modelling of mutation results as a Predictive Mutation Analysis (PMA).
2.3 Input Features of Seshat
Seshat uses the following features to perform PMA via the NL channel in the source code.
2.3.1 Test and Source Method Name
Test cases are written to target specific parts of the source code: any mutants generated in the corresponding part are, by default, more likely to be killed by those test cases. We exploit the fact that developers often put meaningful names to both source and test code [43]. By exploiting the linguistic links between them, we define two input features for the name of the test and the source method, respectively.
Figure 1 shows a test method of joda-time. From
its method name,
testFactory_daysBetween_RPartial_MonthDay, we can
deduce that it is likely to test a source method named
daysBetween.
In addition, the name of the class that this test method belongs to is
TestDays, which indicates that the tests in this class are related
to the
Days class in the source code. Based on this observation, we
build new input features for the test method, and their target source method, by
concatenating their method and class names, respectively. To handle these
features, we use a Deep Neural Network (DNN) model consisting of the word embedding
layers and GRUs [5]. See Section 2.5
for more details of our model architecture.
Note that such a linguistic link may not always exist. For example, consider one
of the test methods in commons-lang named
testLang865, which is
specifically designed to handle the bug report whose unique identification number is 865.333https://issues.apache.org/jira/projects/LANG/issues/LANG-865
The test actually checks whether
LocaleUtils.toLocale can parse
strings starting with an underscore, but there is no clue of this goal in the
name of the test method.
2.3.2 Code Tokens of Mutated Statement
Given a source and a test method, their names as features remain identical for all the mutants that are generated within the source method. However, they do not survive, or get killed by, the same test method collectively. We need additional features that allow us to distinguish individual mutants. To capture the characteristic of each mutant, we take the code snippet of the line in which the mutant is generated, as well as the actual token(s) before and after the mutation. Note that this triplet of information is often provided by the mutation tool themselves.444Since PIT does not provide before and after tokens in the report, we exclude them when training models for PIT.
For example, consider the source method in Figure 2. Major mutation tool mutates Line 2 by changing array.length == 0 to array.length >= 0. We use the entire if-statement as well as before/after code fragments:
-
•
Mutated Statement: if (array == null || array.length == 0)
-
•
Before: array.length == 0
-
•
After: array.length >= 0
Similar to the method name features, code tokens of mutated statements are processed by the DNN model. In particular, the before and after code tokens are compared to each other using comparison layers (see Section 2.5 for more details).
2.3.3 Mutation Operator
Lastly, we use mutation operator as a categorical input feature to explicitly represent how destructive the operator is. We posit that it may be easier to kill the mutants generated using Return Values mutator than Binary Arithmetic Operation mutator. We use one-hot encoding to represent the type of mutation operator. Note that the dimension of the one-hot encoding depends on the number of mutation operators supported by the mutation tool. PIT provides 11 operators in its default configuration and Major provides nine operators in our setting.
2.4 Preprocessing
All textual inputs go through the following preprocessing.
-
•
Word Filtering: The numeric or string literals may exhibit local features that would be difficult to generalise. To avoid overfitting to the local features, we filter numeric and string literals by replacing them with special tokens. Also, we use two more special tokens for unknown word and for removed words due to the mutation.
-
•
Subword Splitting: Compound words tend to convey several concepts. For instance,
ConvertToAUTF8String can be seen as a compound of ‘Convert’, ‘To’, ‘A’, ‘UTF8’, and ‘String’. The compound words not only increase the vocabulary size of the corpus, but also present challenges for effective learning of the word embedding due to their rareness [26]. To address this issue, we employ the state-of-the-art subword splitter Spiral [23] and segment the compound words into subwords.
Finally, all preprocessed tokens for all input features are aggregated to build a dataset and vocabulary. Each element in the dataset represents an one-to-one mapping between a mutant and a test, labelled 0 if the mutant survives the test, and 1 if killed. The dataset is made up of only tests that cover the mutant: label 0 means that the mutant is covered but not killed by the test. This will reduce training and prediction time, as collecting coverage is relatively inexpensive compared to the actual mutation analysis. In the study, we only consider cross-version scenarios, and not cross-project scenarios. This means that we will be less affected by the Out-of-Vocabulary (OOV) problem [18].
2.5 Model Architecture
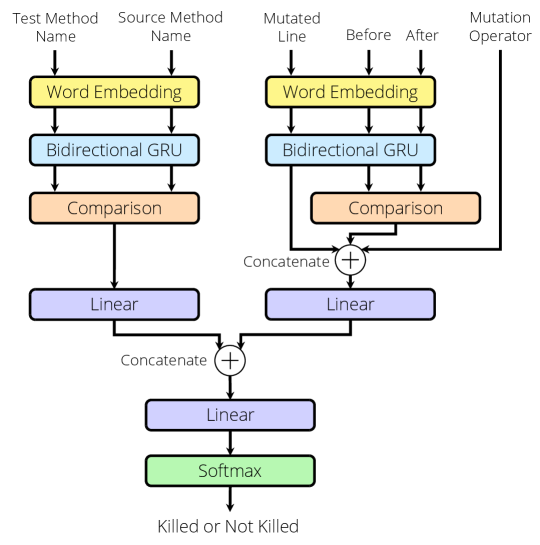
Figure 3 illustrates a model architecture of Seshat. It consists of the word embedding layers to convert words to vector representations, the bidirectional GRU layers to extract sequential context in names and code tokens, the comparison layers to quantify differences between two vector representations, and the linear layer and softmax for the final classification. We detail each component in the following subsections.
2.5.1 Input Layer
The input layer consists of a name-based and a mutation-specific part. We argue that the name-based input features mostly reflect the NL channel in the code, whereas the mutation-specific input features reflect more of the AL channel in the code, as the code tokens contain some parts of program logic. Consequently, we use independent word embedding layer, as well as the bidirectional GRU, for each part.
2.5.2 Word Embedding and Encoding Layer
The word embedding layer maps each word to a numerical representation that captures the relative relationship between words. We use for the name-based features, and for the mutant-specific features: and denote vocabularies of the names and code tokens respectively, and denotes a dimension of the word embedding. We train the embedding layer from scratch as part of the model training, instead of using pre-trained weights.
The words in the test method name and the source method name are passed to the word embedding layer and converted to , and , . Subsequently, the bidirectional GRU is used to extract hidden context between words in two directions. For the test method name:
| (1) |
| (2) |
| (3) |
The hidden representations of a forward GRU and a backward GRU are concatenated, composing one representations . Next, we adopt an attention mechanism to reward those words that are deemed to be important.
| (4) |
| (5) |
| (6) |
denotes a learnable weight matrix and is a corresponding bias. The attention vector is normalised by softmax (Equation 5) and makes resulting embedding vector through the weighted sum with (Equation 6). The same bidirectional GRU and attention mechanism are applied to , computing . As a result, the and are embedding vectors of test and source method name, respectively, after the bidirectional GRU layer.
The mutation-specific part of the input uses an independent embedding layer and a bidirectional GRU layer. Except the mutation operator feature that is categorical data and thus one-hot encoded, mutation-specific features are fed into , the bidirectional GRU, and attention mechanism in the same way as the name-based features. At the end of this process, we get three embedding vectors: (mutated line), (before), and (after).
2.5.3 Comparison Layer
Seshat is based on the intuition that the semantic similarity between the names of the source and test method will reflect, and eventually allow us to learn, the mutant-test relationship. To capture the semantic similarity between names, we use a comparison layer [47, 20] to measure similarity between two embedding vectors, and . The comparison layer includes various comparison functions: Neural Tensor Network (Bilinear layer), Neural Network (Linear layer), Cosine and Euclidean similarity, element-wise subtraction and multiplication. For example, Neural Network is a simple network with one linear layer and Neural Tensor Network is similar but with bilinear layer, each of which has learnable parameters , , , :
| (7) |
| (8) |
Other comparison functions do not have learnable parameters, and simply compute distances between two input vectors: (cosine similarity), (Euclidean distance), (element-wise subtraction), and (element-wise multiplication). The comparison vectors are concatenated and form an embedding vector :
| (9) |
With the mutant-specific inputs, before and after represent the changes of the same part of the code. Therefore, we apply the comparison functions to the embedding vector of the before () and after (): . Note that some comparison functions such as Neural Tensor Network contain learnable parameters, we use separate comparison functions for before and after. To group and reduce the dimensionality of each embedding vector, and , we use two linear layers and concatenate them:
| (10) |
The embedding vector is passed to the final linear layer and the softmax function to produce the probability of the input belonging to each class (i.e., killed or not killed).
| (11) |
During training, all learnable weights such as the word embeddings, the weight matrices, or the biases are learnt by minimizing the cross entropy loss.
3 Experimental Setup
We design an empirical study that evaluates Seshat on seven different Java projects consisting of 37 program versions in Defects4J.
3.1 Research Question
We ask the following six research questions to evaluate Seshat:
3.1.1 RQ1. Effectiveness
Can Seshat learn and predict a kill matrix using the NL channel in the source code and tests? How does Seshat perform against PMT and a coverage based heuristic? RQ1 concerns the effectiveness of Seshat under a cross-version scenario with the comparisons to other models. We answer RQ1 by training Seshat using the actual kill matrices of earlier versions of a subject system, and using it to predict the kill matrices of subsequent versions. We also train a test case level PMT and a coverage based baseline to compare the F-score for each subject.
3.1.2 RQ2. Efficiency
How efficient is Seshat compared to actually performing mutation analysis to obtain an entire kill matrix? RQ2 concerns how much execution time can be saved by Seshat, compared to the execution time of the traditional mutation analysis. We report the time required for preprocessing and predicting the full kill matrix.
3.1.3 RQ3. Generalisation
How well does Seshat generalise to test cases that are newly added to a subject system? If Seshat truly learns through the NL channel, it should retain its predictive power for the new and unseen test cases, as well as the unseen mutants. If Seshat simply memorises the features, on the other hand, its prediction accuracy for newly introduced test cases will be dramatically lower than that for existing test cases. We answer RQ3 by evaluating Seshat separately, for the old and new test cases.
3.1.4 RQ4. Mutation Score
How well does Seshat predict whether a mutant is killed or survives by a given test suite (i.e., mutation score) compared to PMT? RQ4 concerns whether the full kill matrix predicted by Seshat actually produces an accurate aggregated result over the test suite as well. If it does, the results would support that Seshat incorporates the coarser grained PMT. We answer RQ4 by computing the mutation score and F-score using predicted kill matrix by Seshat, and comparing them to the actual mutation score and F-score of PMT.
3.1.5 RQ5. Application Study
Can predicted kill matrix by Seshat be used for mutation based fault localisation? Beyond the mutation score, RQ5 concerns whether Seshat can be applied for Mutation Based Fault Localisation (MBFL) techniques that use the kill matrix to locate faults. To this end, we apply Seshat to SIMFL [27], a state-of-the-art MBFL technique that relies on statistical inference over the kill matrix (See Section 3.5 for the details of SIMFL). Using the predicted kill matrix by Seshat, we attempt to localise faults using the predicted kill matrices, without paying the cost of mutation analysis after the bug has been detected. Since we use the predicted kill matrices instead of real ones, we expect the localisation results to be less accurate. Thus, we report the changes of localisation accuracy, and also compare their effectiveness to two widely studied MBFL techniques, MUSE [33] and Metallaxis [38].
3.1.6 RQ6. Naming Convention and Automated Test Generation
How sensitive is Seshat when applied to automatically generated test cases and their naming convention? With RQ6, we evaluate Seshat using a test data automatically generated by EvoSuite [10]. We begin by training Seshat with a kill matrix of EvoSuite generated test suite, and predicting the kill matrix of another, independently generated EvoSuite test suite for a subsequent version. In addition, we also cross-evaluate the performance of Seshat between the developer written test suites and the EvoSuite generated test suites. The use of the machine generated test cases has multiple implications. First, unlike the developer written test suites that gradually evolve with the SUT, EvoSuite test suites are generated for each version in our experimental protocol, getting rid of the continuity in the test suite contents. Second, the machine generated test cases follow different naming conventions from those used by developers. We adopt the descriptive naming strategy implemented in EvoSuite [7] and see how much information can be obtained from the NL channel. Finally, we expect the test adequacy of the machine generated test suites to be different from those written by developers in terms of the mutation testing. In the evaluation, we investigate how much the predictive power of Seshat is affected by these factors when we replace the developer written tests with the automatically generated tests using EvoSuite.
3.2 Subject Program
We select 37 subject program versions on seven different projects in Defects4J v2.0.0, which has been widely used in the software testing research, and provides an infrastructure that makes tests run, coverage analysis, and mutation analysis to be easily performed and reproduced. Table 1 lists the latest and the oldest subject program versions for each project. Column 1 shows project name, and the number of program versions in each project we use in the study. We denote the version number by the identifier number used in Defects4J, and denote the two adjacent versions, or a version and immediately preceding version by the two versions whose version numbers are right next or before to each other.
To facilitate cross-version scenario, we select programs whose version number is a multiple of five or ten. Note that smaller version number does not always represent more recent codebase; Gson, Cli, JC, and Csv assign smaller version number to older codebase. Chart is the largest subject with 96k LoC and Time has 4k tests which is the most and 74 times larger than tests of Csv which contains only 54 tests. We exclude subjects of Time under the Major mutation tool because their mutation analyses for entire kill matrix have not been completed within 48 hours.
| Project | Identifier | Version | LoC | # Tests | Date | Major | PIT | ||
| # Mut. Gen. | Killed % | # Mut. Gen. | Killed % | ||||||
| commons-lang | Lang | 1 | 21,788 | 2,291 | 2013-07-26 | 22,793 | 74.2% | 10,546 | 85.4% |
| Lang | 10 | 20,433 | 2,198 | 2012-09-27 | 19,767 | 74.7% | 9,477 | 85.6% | |
| Lang | 20 | 18,967 | 1,876 | 2011-07-03 | 19,073 | 74.5% | 8,994 | 84.3% | |
| Lang | 30 | 17,660 | 1,733 | 2010-03-16 | 18,144 | 74.7% | 8,234 | 85.5% | |
| Lang | 40 | 17,435 | 1,643 | 2009-10-22 | 17,972 | 74.1% | 8,138 | 73.8% | |
| Lang | 50 | 17,760 | 1,720 | 2007-10-31 | 18,151 | 73.0% | 8,744 | 81.3% | |
| Lang | 60 | 16,920 | 1,590 | 2006-10-31 | 17,819 | 72.6% | 8,506 | 81.5% | |
| joda-time | Time | 1 | 27,801 | 4,041 | 2013-12-02 | 20,257 | 65.1% | 9,706 | 78.4% |
| Time | 5 | 27,664 | 4,013 | 2013-11-01 | 20,144 | 65.1% | 9,658 | 78.6% | |
| Time | 10 | 27,341 | 3,954 | 2013-06-16 | 19,991 | 65.2% | 9,634 | 78.0% | |
| Time | 15 | 27,215 | 3,894 | 2012-04-30 | 19,756 | 65.3% | 9,604 | 77.9% | |
| Time | 20 | 27,156 | 3,868 | 2011-10-23 | 19,618 | 65.1% | 9,556 | 77.9% | |
| Time | 25 | 26,805 | 3,810 | 2010-12-05 | 19,488 | 65.5% | 9,416 | 77.7% | |
| jfreechart | Chart | 1 | 96,382 | 2,193 | 2010-02-09 | 81,006 | 23.6% | 35,690 | 33.9% |
| Chart | 5 | 89,347 | 2,033 | 2008-11-24 | 75,024 | 23.6% | 33,157 | 33.7% | |
| Chart | 10 | 84,482 | 1,805 | 2008-06-10 | 71,052 | 22.8% | 31,183 | 33.1% | |
| Chart | 15 | 84,134 | 1,782 | 2008-03-19 | 70,647 | 22.6% | 30,977 | 32.8% | |
| Chart | 20 | 80,508 | 1,651 | 2007-10-08 | 67,479 | 22.2% | 30,471 | 31.4% | |
| Chart | 25 | 79,823 | 1,617 | 2007-08-28 | 66,766 | 22.1% | 30,213 | 31.0% | |
| gson | Gson | 15 | 7,826 | 1,029 | 2017-05-31 | 5,044 | 64.2% | 2,670 | 76.1% |
| Gson | 10 | 7,693 | 996 | 2016-05-17 | 4,775 | 65.4% | 2,576 | 75.7% | |
| Gson | 5 | 7,630 | 984 | 2016-02-02 | 4,722 | 64.6% | 2,546 | 75.8% | |
| Gson | 1 | 5,418 | 720 | 2010-11-02 | 2,295 | 61.8% | 1,564 | 70.3% | |
| commons-cli | Cli | 30 | 2,497 | 354 | 2010-06-17 | 1,592 | 81.3% | 710 | 89.2% |
| Cli | 20 | 1,989 | 148 | 2008-07-28 | 1,118 | 77.3% | 509 | 83.5% | |
| Cli | 10 | 2,002 | 112 | 2008-05-29 | 1,151 | 68.4% | 515 | 77.9% | |
| Cli | 1 | 1,937 | 94 | 2007-05-15 | 1,118 | 66.3% | 499 | 73.3% | |
| jackson-core | JC | 25 | 25,218 | 573 | 2019-01-16 | 30,010 | 53.8% | 13,198 | 63.5% |
| JC | 20 | 21,480 | 384 | 2016-09-01 | 25,257 | 49.8% | 11,115 | 58.5% | |
| JC | 15 | 18,652 | 346 | 2016-03-21 | 21,599 | 48.1% | 9,632 | 56.1% | |
| JC | 10 | 18,930 | 330 | 2015-07-31 | 22,089 | 48.6% | 9,773 | 56.6% | |
| JC | 5 | 15,687 | 240 | 2014-12-07 | 18,610 | 47.3% | 8,227 | 54.6% | |
| JC | 1 | 15,882 | 206 | 2013-08-28 | 16,982 | 46.5% | 7,561 | 53.0% | |
| commons-csv | Csv | 15 | 1,619 | 290 | 2017-12-11 | 1,173 | 71.4% | 599 | 84.0% |
| Csv | 10 | 1,276 | 200 | 2014-06-09 | 1,043 | 71.1% | 493 | 81.9% | |
| Csv | 5 | 1,236 | 189 | 2014-03-13 | 996 | 72.3% | 469 | 81.9% | |
| Csv | 1 | 806 | 54 | 2012-03-27 | 695 | 68.1% | 280 | 80.4% | |
3.3 Mutation Tool
Since the result of mutation analysis is highly dependent on the mutation tool and its configuration, we evaluate Seshat using two widely studied Java mutation tools, PIT ver. 1.5.2 [6] and Major ver. 1.3.4 [25]. PIT uses bytecode mutator that is known to be efficient and well integrated with various development environments. Meanwhile, Major adopts compiler-integrated mutator that transforms the abstract syntax tree (AST) and provides in-depth mutation report. Table 1 lists the number of generated mutants, killed mutants, and kill percentage of PIT and Major. It shows that large LoC leads to the large number of mutants: Major generates up to 81k mutants for Chart whereas it generates 11k mutants for Csv.
In the study, we filter mutants of PIT that are not captured by our preprocess steps, or killed due to implicit oracles such as time out or uncaught out of memory exceptions, because PIT does not report the tests that caused the kill. Therefore, in Section 4.4, we have computed the mutation score ourselves after excluding all those mutants, not using the score reported by the mutation tool.
3.4 PMT and Coverage based Baseline Model
To compare the performance of Seshat against other models, we choose two models: PMT and a simple coverage based baseline model. Following the recent study that has investigated the model choices for PMT, we implement a Random Forest classifier using 12 features that has shown the best performance [32]. Most of the features of PMT are collected in the same way, but the test suite level features such as numExecuteCovered are collected in the test case level for PMA. In addition, as a sanity check, we also include a coverage based model that predicts all mutants covered by any test will be killed. Coverage information for this heuristic has been collected using Cobertura.
3.5 Mutation Based Fault Localisation
Mutation analysis has been successfully exploited for Fault Localisation (FL), resulting in a family of Mutation Based Fault Localisation (MBFL) techniques [37]. For instance, using the seeded faults (i.e., mutants), MUSE [33] computes a suspiciousness score based on the ratio of fail-becomes-pass tests and pass-becomes-fail tests for each statement. Metallaxis [38] observes the mutants that show similar test results with the faults using Spectrum based Fault Localisation (SBFL)-like formulas.
For the application study of RQ5, we apply Seshat to a state-of-the-art MBFL technique, SIMFL [27], a technique that utilises the entire kill matrices. SIMFL tries to locate faults using a statistical inference over the mutant-tests results in the kill matrix as follows. First, it computes a full kill matrix of a given program. Subsequently, SIMFL learns a statistical model that can predict where the mutant was based on the patterns of the failed test cases. This model can later be used to localise faults, as real faults can be considered as yet another mutation that causes test cases to fail.
A weakness of SIMFL is that, to use the learnt relationship between mutants and test cases to localise a new fault, SIMFL should have had access to the fault revealing test case during its learning phase. However, SIMFL cannot be applied to a new fault if the fault is revealed by a new test case that was not part of the original kill matrix it learnt from. Seshat can help SIMFL overcome this by inferring the individual mutant-test relationship for the new test case. With RQ5, we evaluate how much loss in accuracy occurs when we use the inferred kill matrices.
3.6 Evaluation Metric and Protocol
For all RQs, we use the standard evaluation metric for binary classification, as PMA is essentially a prediction of binary classes, i.e., killed or not killed. We compute precision, recall, and F-score, but only report F-score for the sake of brevity, as they show similar trends. Other metrics and omitted figures are available from a supplementary web page at https://coinse.github.io/seshat-results. The source code and the full raw results are publicly available at https://figshare.com/s/ffbcc010905f3942eaeb.
To simulate cross-version scenarios, we set the base versions used for training the model and apply them to predict the kill matrices of later versions. For all the two adjacent versions in our subjects, on average, the number of elapsed days is 445, the number of added lines is 14,469, and the number of removed lines is 14,826.555We use git-diff tool to extract changed lines in .java files.
3.7 Configuration and Environment
We use a default set of mutation operators for PIT and default template file (.mml) specified in Defects4J for Major. We run mutation analyses using PIT with two threads and fullMutationMatrix options. For Major, we use sort_methods and exportKillMap options to enable it to compute the entire kill matrix in a test case level. For the versions in Chart, we run Major within the killmap tool to reliably manage stack overflow errors involving JVM crashes.666We obtained the tool from https://bitbucket.org/rjust/fault-localization-data/src/master/killmap (commit ea1741dbb) and then modified it to run all given test cases.
In the preprocessing step, we perform lexical analysis using a Java lexer implemented in SLP library.777https://github.com/SLP-team/SLP-Core In training model, the dimension of word embedding is set to 50, the number of features in the hidden state of GRU is set to 100, and dropout rate is set to 0.5. The maximum training epoch is 10.
The mutation analysis using killmap tool was performed on four machines each of which runs Ubuntu 18.04.4 LTS on Intel i5-10600 CPU @ 3.30GHz and 16GB RAM. All remaining experiments were performed on machines running Ubuntu 16.04.4 LTS, Intel Xeon E5-2630 v4 CPU, Nvidia TITAN Xp GPU, and 256GB RAM.
4 Results
This section answers the research questions using the results from the empirical evaluation of Seshat.
4.1 Effectiveness (RQ1)
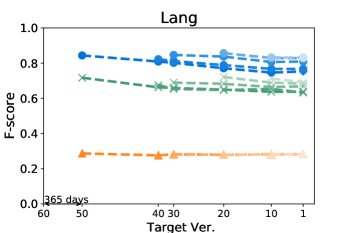
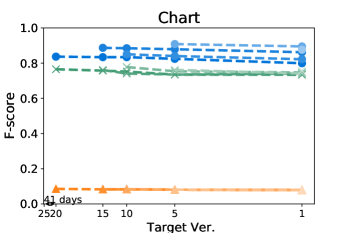
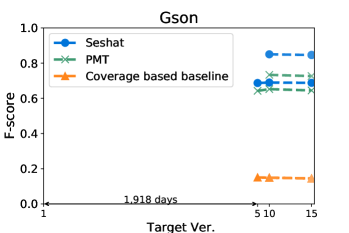
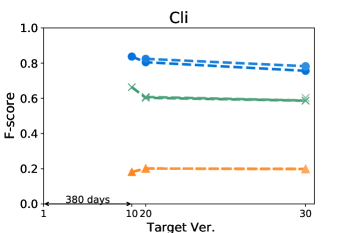
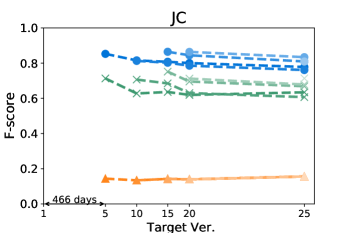
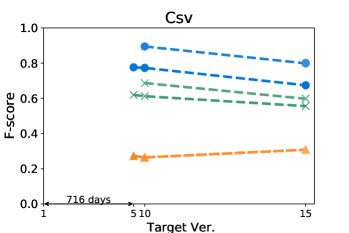
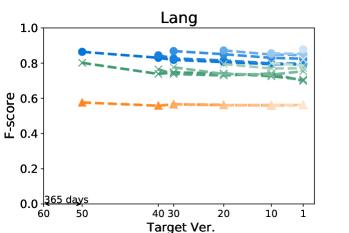
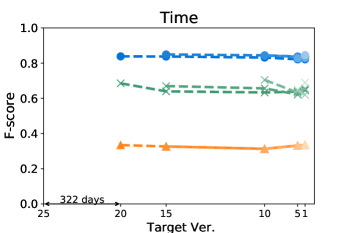
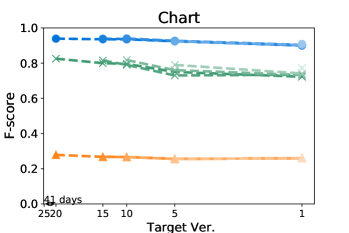
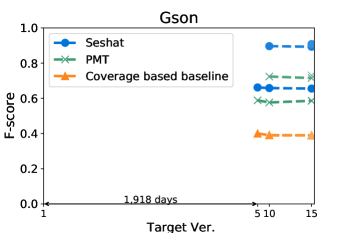
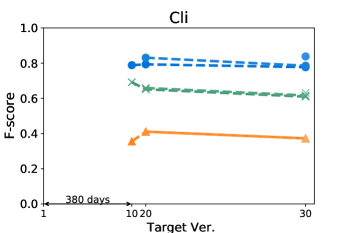
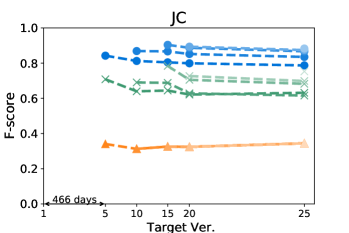
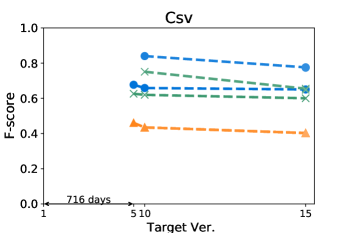
Figures 4 and 5 show how the F-score changes when we train a model using a kill matrix of a base version and predict kill matrices of subsequent versions that are gradually farther away. The -axis shows the relative time interval between versions: the longer the time interval between versions, the further the distance in -axis between them. We also specify the exact number of elapsed days between the first two versions in the -axis for the sake of understanding. The colours in Figures 4 and 5 represent the models we use: the blue circle marker represents Seshat, the green X marker represents PMT, and the orange triangle marker represents the coverage based baseline. In the same colour variation, the model trained with the older program is marked as darker colour, and the connected line between markers represent that the models are trained using the same base version.
Figure 5 shows that Seshat performs the best for versions of Chart on PIT: the average F-score from all pairs of versions of Chart is 0.92. For all subjects in PIT, Seshat achieves the average F-score 0.84. Compared to PIT, as shown in Figure 4, Seshat shows slightly worse prediction performance on Major, with the overall average F-score 0.81.
Also, Seshat outperforms PMT and the coverage based model. PMT and the coverage based model produce average F-scores of 0.70 and 0.39, respectively, when predicting the kill matrices of PIT, and 0.68 and 0.19 for the kill matrices of Major. This supports our hypothesis that PMT lacks fine-grained features needed for test case level prediction. It is not surprising that the coverage based heuristic performs the worst, since the coverage is not a sufficient condition for killing a mutant.
By comparing lines with different tints in the same colour variation, we can observe how the time between two versions affects the prediction accuracy of Seshat. The older the model used for training is, the worse the prediction becomes. When predicting for the latest version, models trained on the immediately preceding studied version shows 0.08 and 0.09 point higher F-scores when compared to models trained on the oldest versions, for Major and PIT respectively. However, we also note that the accuracy degradation is relatively slow: the F-scores decrease by 0.019 and 0.013 point per year on average for Major and PIT, respectively. PMT also follows this trend but the coverage based model does not.
The worst F-scores are observed in the models that are trained with the oldest versions of Gson and Csv. With both projects, the first interval is much longer than those in others: over five years for Gson, and almost two years for Csv. Combined with the relatively smaller size of these two projects, we suspect that the codebases for these two projects have changed more than other projects, which makes the prediction harder. For example, the oldest version of Gson only produces about half the mutants then those produced from the next analysed version, resulting in F-scores consistently lower than 0.7 for all predictions based on itself.
Answer to RQ1: Seshat successfully learns the features in the NL channel that are effective in predicting the full kill matrices: Seshat achieves average F-score of 0.81 and 0.84 for Major and PIT, respectively, which significantly outperforms PMT and the coverage based model.
| Project | Ver. | Major | Seshat | Speed-up | PIT | Seshat | Speed-up |
|---|---|---|---|---|---|---|---|
| Lang | 1 | 12,924s | 267s | 48.34X | 1,472s | 128s | 11.46X |
| 10 | 13,185s | 244s | 54.10X | 1,385s | 116s | 11.95X | |
| 20 | 5,395s | 214s | 25.15X | 970s | 104s | 9.30X | |
| 30 | 5,220s | 212s | 24.61X | 900s | 97s | 9.24X | |
| 40 | 4,756s | 206s | 23.08X | 836s | 93s | 9.02X | |
| 50 | 6,793s | 196s | 34.72X | 865s | 93s | 9.29X | |
| Time | 1 | - | - | - | 2,294s | 616s | 3.73X |
| 5 | - | - | - | 2,170s | 592s | 3.67X | |
| 10 | - | - | - | 1,957s | 614s | 3.19X | |
| 15 | - | - | - | 2,138s | 564s | 3.79X | |
| 20 | - | - | - | 2,309s | 557s | 4.15X | |
| Chart | 1 | 64,719s | 1,248s | 51.87X | 2,295s | 369s | 6.22X |
| 5 | 53,986s | 1,093s | 49.40X | 2,014s | 338s | 5.95X | |
| 10 | 46,983s | 998s | 47.07X | 1,542s | 293s | 5.26X | |
| 15 | 46,429s | 962s | 48.27X | 1,520s | 289s | 5.26X | |
| 20 | 42,475s | 873s | 48.68X | 1,466s | 258s | 5.68X | |
| Gson | 15 | 16,738s | 347s | 48.27X | 376s | 118s | 3.19X |
| 10 | 15,986s | 339s | 47.13X | 351s | 120s | 2.94X | |
| 5 | 15,253s | 348s | 43.82X | 345s | 113s | 3.04X | |
| Cli | 30 | 1,290s | 35s | 36.98X | 74s | 19s | 3.81X |
| 20 | 498s | 37s | 13.35X | 43s | 20s | 2.12X | |
| 10 | 408s | 32s | 12.94X | 42s | 18s | 2.30X | |
| JC | 25 | 113,343s | 538s | 210.53X | 1,391s | 204s | 6.81X |
| 20 | 88,075s | 392s | 224.44X | 1,013s | 142s | 7.16X | |
| 15 | 45,069s | 317s | 142.17X | 669s | 115s | 5.82X | |
| 10 | 44,110s | 305s | 144.85X | 676s | 113s | 5.99X | |
| 5 | 31,257s | 209s | 149.49X | 557s | 83s | 6.72X | |
| Csv | 15 | 5,289s | 52s | 101.00X | 1,781s | 23s | 77.91X |
| 10 | 1,317s | 33s | 40.30X | 1,359s | 16s | 83.12X | |
| 5 | 1,179s | 31s | 37.44X | 1,493s | 16s | 93.90X |
4.2 Efficiency (RQ2)
The main drawback of building a full kill matrix comes from its huge computational cost. It requires even more time than traditional mutation testing, because even if a mutant is killed by some test earlier, it does not skip running other tests. For example, considering Lang 10, traditional mutation testing using PIT was 4.3x faster than those with full kill matrix option. Therefore, we investigate how much execution time can be saved by Seshat, compared to that of traditional mutation analysis with full kill matrix option.
Table 2 shows the execution time of two mutation tools and Seshat to compute the full kill matrix. Columns 3 and 4 list the execution time of Major and Seshat that predicts Major’s kill matrix of the corresponding version, respectively. Similarly, Columns 6 and 7 list the execution time of PIT and Seshat. Overall, the results show that PIT can compute the full kill matrix in a reasonable time: it takes up to 38 minutes for Time and up to 74 seconds for Cli. Moreover, PIT is on average 28x faster than Major since Major has generated more mutants than PIT in our study. Still, Seshat can speed up from 2x to 94x, compared to PIT. In particular, Seshat predicts kill matrices of Csv exceptionally faster than others; although all Csv versions have fewer than 300 tests, they are executed relatively slow, resulting in PIT running more than 22 minutes. In contrast, Seshat is not affected by the test executions, but only the number of tests, so it can predict kill matrices in less than 23 seconds. Seshat also requires significantly less time than Major for all subjects, with the average speed-up of 68x. Major runs more than 31 hours for JC 25, but Seshat takes only nine minutes.
Note that the reported speed-ups are specifically in the context of predicting the entire kill matrices. It is theoretically possible that Seshat can be even more efficient if we only wanted to predict the mutation scores like PMT: we simply need to stop the prediction for a mutant once it is predicted to be killed by any test case. However, as Seshat maps one-to-one relation between multiple mutants and test cases, the inference phase is fully parallelised using a GPU across the elements in the kill matrices, making mutation score level evaluation of efficiency difficult. Even if we serialise the computation, the ordering of prediction would affect when the ideal early stopping point should be. Consequently, we limit our evaluation of efficiency to the prediction of entire kill matrices.
Answer to RQ2: Seshat is much more efficient in predicting the full kill matrix than traditional mutation analysis, with the average speed-up of 68x against Major and 14x against PIT.
4.3 Generalisation (RQ3)
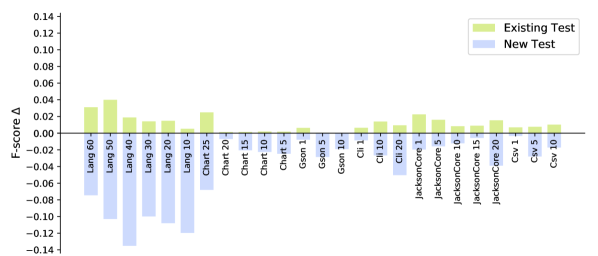
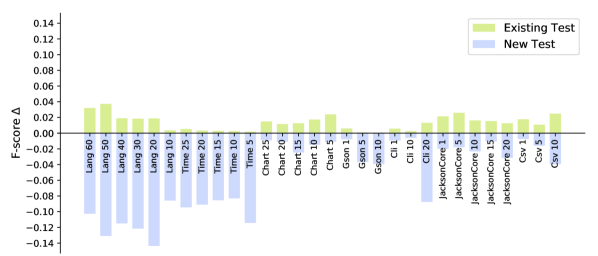
In RQ3, we investigate whether Seshat can generalise to the unseen test cases that did not exist in the test suite of the version used for training. Before prediction, we separate the test cases into two categories, existing and new. Subsequently, we report the prediction F-score for each group independently. While we only categorise test cases, we posit that the new test cases are likely to cover newly introduced code in the version that we apply Seshat to.
Figure 6 shows how F-score changes between the old and the new test categories per projects. The -axis represents the version used for training, and the -axis represents the averaged difference in the F-scores when both categories are compared to the F-score computed using all tests: the F-score of 0 means that the category produces the same F-score as that of the entire test suite.
For all subjects, the existing tests show F-scores that are higher by 0.01 and 0.01 on average, while new tests show F-scores that are lower by 0.04 and 0.05 on average, Major and PIT respectively. The difference suggests that Seshat does perform better for the existing test cases. The notable outliers are from the versions in Lang, for both Major and PIT: the average F-score is 0.11. We suspect that this is related to the test case granularity: test cases in Lang tend to cover fewer methods compared to other projects. In our analysis, a test case in Lang covers about 14 methods on average, whereas a test case in all the other projects covers about 127 methods on average. The finer granularity may drive Seshat to learn stronger one-to-one mappings between the test cases and the source methods, with higher risk of overfitting. In turn, this will make it more difficult for Seshat to make an accurate prediction for the new test cases. Another outlier is the versions in Time analysed with PIT; however, the reason may be the opposite because Time has the highest average number of methods covered by a test case, which is 360. It is more difficult to learn mappings between the source and the test methods if the relationship is dominantly one-to-many, resulting in low performance of Seshat.
Answer to RQ3: Seshat can generalise to the new source and test code: the F-score decreases only by 0.04 and 0.05 with Major and PIT, respectively, for new and unseen test cases.
4.4 Mutation Score (RQ4)
The test case level of PMA is finer-grained than the test suite level of PMT: once we predict a kill matrix, we can easily compute the Mutation Score (MS) from the matrix. We expect a conversion in the opposite direction to be more challenging. This is because, intuitively, PMA is more challenging as a learning problem than PMT, since it needs to learn and produce more information (an entire kill matrix) compared to PMT (which essentially predicts an aggregation of a kill matrix).
| Project | Major | PIT | ||||||
|---|---|---|---|---|---|---|---|---|
| F-Score | MS Error | F-Score | MS Error | |||||
| Seshat | PMT | Seshat | PMT | Seshat | PMT | Seshat | PMT | |
| Lang | 0.825 | 0.715 | 0.848 | 17.547 | 0.908 | 0.912 | 2.112 | 4.503 |
| Time | - | - | - | - | 0.894 | 0.903 | 0.254 | 6.091 |
| Chart | 0.818 | 0.747 | 3.047 | 4.641 | 0.896 | 0.827 | 1.785 | 6.306 |
| Gson | 0.625 | 0.644 | 10.837 | 9.590 | 0.817 | 0.795 | 4.281 | 6.445 |
| Cli | 0.669 | 0.781 | 23.943 | 7.922 | 0.847 | 0.905 | 10.813 | 3.583 |
| JC | 0.775 | 0.693 | 4.370 | 9.755 | 0.851 | 0.832 | 0.595 | 5.862 |
| Csv | 0.672 | 0.668 | 17.286 | 15.007 | 0.844 | 0.856 | 1.166 | 7.149 |
Table 3 shows the F-score and MS error (i.e., ) when Seshat and PMT predict whether a mutant is killed by the entire test suite. In general, it is hard to determine which model performs better because the differences of both F-score and MS error vary considerably between the subjects. However, despite the aggregation over the predicted kill matrix to compute MS, Seshat shows comparable and sometimes better results than PMT.
In addition to the analysis of the absolute error, we further investigate the actual difference (i.e., ) for all predictions by Seshat and PMT. In total, out of 55 predictions, 11 by Seshat are higher than . In contrast, all 55 by PMT are higher than . This indicates that PMT tends to overestimate mutation scores, while the errors of Seshat are both over and underestimations. For Seshat, the observed trend is plausible, because some of the kill relations may be very unique, and therefore harder to learn properly. In comparison, considering the importance of dynamic features for PMT, the overestimation by PMT is in line with the widely known limitations of structural coverage: it relies significantly on features related to the execution of the mutant, but the coverage does not necessarily result in killing it.
A hybrid model that combines the features of Seshat and PMT may improve the prediction performance for the MS, as well as the contents of the kill matrix. However, the focus of this paper was to evaluate the feasibility of Seshat based on the NL channel. We leave further investigation of hydridisation as future work.
Answer to RQ4: Seshat can predict the mutation results with average F-score of 0.80, and average mutation score error of 6.26, producing comparable results with PMT that achieves 0.79 and 8.03 respectively.
4.5 Application Study (RQ5)
| Technique | Project | # Faults | ||||
|---|---|---|---|---|---|---|
| MUSE [33] | Lang | 64 | 23 | 36 | 42 | 47 |
| Math | 105 | 20 | 42 | 51 | 64 | |
| Time | 26 | 3 | 5 | 6 | 9 | |
| Chart | 25 | 11 | 12 | 14 | 18 | |
| Total | 220 | 57 | 95 | 113 | 138 | |
| Metallaxis [38] | Lang | 64 | 30 | 44 | 48 | 57 |
| Math | 105 | 22 | 49 | 60 | 74 | |
| Time | 26 | 10 | 12 | 15 | 20 | |
| Chart | 25 | 4 | 10 | 12 | 13 | |
| Total | 220 | 66 | 115 | 135 | 164 | |
| SIMFL [27] | Lang | 64 | 47 | 54 | 55 | 55 |
| Math | 105 | 44 | 60 | 69 | 81 | |
| Time | 26 | 11 | 16 | 18 | 23 | |
| Chart | 25 | 9 | 13 | 15 | 19 | |
| Total | 220 | 111 | 143 | 157 | 178 | |
| SIMFL with Seshat | Lang | 64 | 36 | 48 | 52 | 56 |
| Math | 105 | 37 | 63 | 75 | 84 | |
| Time | 26 | 8 | 11 | 12 | 13 | |
| Chart | 25 | 7 | 14 | 19 | 22 | |
| Total | 220 | 88 | 136 | 158 | 175 |
In addition to evaluating the precision of Seshat, we design an application study showing its usefulness when it is applied to other domains; we employ Fault Localisation (FL) problem that aims to find a location of the faults. Our target tool is SIMFL, Mutation Based Fault Localisation (MBFL) technique that leverages the kill matrix to locate faults [27]. By replacing the kill matrix used in SIMFL with the predicted one by Seshat, we investigate how much the localisation accuracy of SIMFL changes. Also, we present a comparison to the two other MBFL techniques, MUSE and Metallaxis, using 220 buggy programs in Defects4J, as shown in Table 4. ‘SIMFL’ refers to the SIMFL with its own assumption utilising the original kill matrix, and ‘SIMFL with Seshat’ refers to SIMFL that uses the predicted kill matrix. In this study, we only used PIT mutation tool as we failed to get the original kill matrix of Math (commons-math) and Time using Major.888We have include commons-math of Defects4J for better comparison of the FL results to other techniques; running Major on Time causes timeout after 48 hours. Seshat models are trained on the oldest version of the project, e.g., the model used to infer the kill matrices of Chart 1 to Chart 25 is trained on Chart 26. As FL techniques usually produce the ranks of the suspicious program elements, the evaluation metric we use is , the number of buggy programs where the MBFL technique successfully located its faults within the top n position.
Table 4 reports that SIMFL outperforms others: it locates 111 faults at the top, followed by SIMFL with Seshat, Metallaxis, and MUSE. Note that SIMFL with Seshat still outperforms MUSE and Metallaxis for all metrics despite using predicted kill matrices. Moreover, compared to SIMFL, the degradation of localisation effectiveness is relatively small for and and it performs better with . It indicates that the predicted kill matrices are sufficiently accurate for the task of FL, especially with respect to metric, although higher accuracy is needed to achieve competitive and above.
Answer to RQ5: the predicted kill matrix by Seshat is successfully applied to the MBFL technique, SIMFL. SIMFL with Seshat outperforms other two MBFL techniques and does not show disruptive degradation compared to the original SIMFL assumption.
4.6 Naming Convention and Automated Test Generation (RQ6)
| Project | Target | Devtrain | Evotrain | Evotrain | Devtrain |
|---|---|---|---|---|---|
| Vesrion | Evotest | Devtest | Evotest | Devtest | |
| Lang | 60 | 0.61 | 0.68 | 0.74 | 0.86 |
| 50 | 0.61 | 0.67 | 0.72 | 0.84 | |
| 40 | 0.58 | 0.64 | 0.76 | 0.87 | |
| 30 | 0.62 | 0.62 | 0.71 | 0.87 | |
| 20 | 0.64 | 0.65 | 0.77 | 0.86 | |
| 10 | 0.65 | 0.67 | 0.76 | 0.88 | |
| Time | 25 | 0.65 | 0.66 | 0.77 | 0.84 |
| 20 | 0.66 | 0.64 | 0.76 | 0.85 | |
| 15 | 0.66 | 0.65 | 0.74 | 0.84 | |
| 10 | 0.65 | 0.64 | 0.73 | 0.83 | |
| 5 | 0.66 | 0.66 | 0.76 | 0.85 | |
| Gson | 1 | 0.56 | 0.60 | 0.67 | 0.66 |
| 5 | 0.72 | 0.64 | 0.82 | 0.90 | |
| 10 | 0.71 | 0.66 | 0.81 | 0.91 | |
| Cli | 1 | 0.57 | 0.59 | 0.52 | 0.79 |
| 10 | 0.56 | 0.60 | 0.87 | 0.83 | |
| 20 | 0.57 | 0.60 | 0.86 | 0.84 | |
| Csv | 1 | 0.57 | 0.58 | 0.66 | 0.68 |
| 5 | 0.68 | 0.71 | 0.76 | 0.84 | |
| 10 | 0.57 | 0.68 | 0.70 | 0.77 |
We evaluate Seshat with EvoSuite [10] generated test cases in RQ6: the aim is to investigate whether the NL channel still holds useful information when test cases are automatically generated. Instead of relying on naming conventions of human developers, we use the descriptive naming strategy of EvoSuite [7]. We hereafter denote developer-written test suites with Dev, and EvoSuite generated test suites with Evo. We first collect kill matrices of all Evo test suites. Subsequently, we train Seshat model on Evo (i.e., Evotrain) and test on Dev (i.e., Devtest), or train Seshat model on Dev (i.e., Devtrain) and infer kill matrix for Evo (i.e., Evotest). In addition, we provide the results of Evotrain & Evotest and Devtrain & Devtest. Note that we only conduct the experiment using PIT because running Major on EvoSuite tests times out after 48 hours.
Table 5 presents the F-scores for each train-test pair. Overall, Devtrain & Devtest pair achieves the highest F-scores, followed by Evotrain & Evotest pair. We posit that two factors contribute to the performance of Seshat with Dev test suites. First, human written tests may provide richer semantic information in the NL channel. Second, Dev is a regression test suite, whereas Evo test suites are obtained by independent and separate runs of EvoSuite for each version. Since Dev test suites are more stable (i.e., many test cases overlap between versions), the prediction of kill matrices may be easier for Dev test suites. However, the descriptive naming strategy of EvoSuite does provide some information in the NL channel, allowing Seshat to achieve F-score of up to 0.86 under the configuration of Evotrain & Evotest.
In contrast, replacing Dev with Evo results in deterioration of the effectiveness of Seshat. Devtrain & Evotest and Evotrain & Devtest show similar results, achieving average F-scores 0.62 and 0.64 respectively. The differences in naming convention between training and testing make the kill matrix prediction more difficult.
Answer to RQ6: As long as a meaningful naming convention is applied during test generation, Seshat can also predict kill matrices for automatically generated test cases.
5 Discussion
This section raises a few issues that we have identified while performing the empirical evaluation. We believe that these can lead into interesting future work.
5.1 Test Quality and Coding Convention
Suppose we take any test suite for which Seshat can successfully perform PMA, and remove all assertions from its test cases. This will render any prediction useless. What Seshat does is to reconstruct the relationship between test cases and mutants in the NL channel, based on the training data. Consequently, it is vulnerable to such manipulation. In contrast, if a test case without any assertion always kills a mutant using an implicit oracle (such as crashes), Seshat will duly learn this relationship. In practice, we expect Seshat to be used to reduce and amortise the cost of mutation analysis, and not to completely replace it. If there is a continuity in the coding and naming convention in both source and test code, Seshat is likely to maintain its prediction accuracy. If there is a meaningful change in test quality, either improvement or decrease, the prediction accuracy will degrade. We expect this deviation to be picked up by the regular application of concrete mutation testing.
5.2 Data Imbalance in PMA
The balance between the number of mutant-test pairs that result in kills and non-kills cannot be known in advance, and likely not to be perfectly 1:1. As Seshat is essentially solving a classification problem, here we consider the implications of data imbalance.
The text-based nature of Seshat prevents the use of resampling approaches such as SMOTE [3] or ADASYN [17]. Therefore, we investigate the impact of class imbalance on Seshat using random over- and undersampling (allowing duplicates). We over- and undersample the training data to make the class ratio 1:1. Subsequently, we train new models and evaluate them on the same subjects. Compared to the results of RQ1, with Major, the average F-score increases by 0.026 and 0.025 when we use over- and undersampling, respectively. With PIT, however, F-score decreases by 0.001 with oversampling, and increases by 0.010 with undersampling.
The different responses to over- and undersampling between Major and PIT can be attributed to the status of their initial imbalance. The initial class ratio between killed and not killed mutants generated by Major across all studied versions is 0.396 on average. With PIT, the initial imbalance ratio is much minor at 0.985 on average: there are actually more killed mutants than not killed ones in some projects. We suspect that this leads to over- and undersampling having more random effects on the results.
We note that the difference in F-score between initial and resampled results are not significant. Data imbalance will have more significant consequences if it only appears in the training data. However, due to the continuity in development, projects with imbalanced kill matrices are likely to exhibit the same imbalance in the future, resulting in relatively minor consequences in our cross-version evaluation.
Overall, we conclude that addressing the class imbalance issue can improve the performance of Seshat in general, but the implications of the imbalance can be subtly different depending on the choice of the mutation tool, its configuration, and the contents of the kill matrix itself.
| Project | Decrease in F-score | |||
|---|---|---|---|---|
| Method Name | Mutated Line | Before&After | Mutation Op. | |
| Lang | 0.009 | -0.003 | 0.041 | -0.011 |
| Chart | -0.056 | -0.057 | -0.030 | -0.072 |
| Gson | -0.010 | 0.028 | 0.025 | -0.014 |
| Cli | 0.018 | -0.003 | 0.078 | 0.014 |
| JC | -0.006 | 0.016 | 0.018 | -0.015 |
| Csv | 0.050 | -0.015 | 0.142 | 0.045 |
5.3 Ablation Study
To investigate which feature in Seshat contributes most to the prediction, we conduct an ablation study by removing each feature one by one and training the model. We then repeat the RQ1 study with Major to compare the F-scores from the ablated models to those from the original model. Table 6 reports the decrease of F-score for each removed feature. The column “Method Name” refers to the model that omits “Source Method Name”, and the column “Before & After” refers to the model that omits both “Before” and “After” in the model architecture, shown in Figure 3. The columns “Mutated Line” and “Mutation Operator” refer to the models with corresponding input components removed, respectively.
Interestingly, the results show that the model performance varies across the subjects but do not always deteriorate: for the versions of Chart, the ablated models perform better than the original model. However, the average difference of the F-score is 0.008, which may be too small to precisely assess the relative feature importance when considering the stochastic nature of training DNN models using hyperparameters. We presume that our features share some common information and complement each other, allowing the ablated model to retain its predictive power. We leave the design of more destructive study to measure the relative feature importance as future work.
| Project | Versions | # Commits | Added | Modified | Removed |
|---|---|---|---|---|---|
| Lang | 1 10 | 189 | 3,932 | 6,436 | 244 |
| 10 20 | 413 | 7,829 | 2,836 | 1,456 | |
| 20 30 | 552 | 4,965 | 1,120 | 1,834 | |
| 30 40 | 286 | 45,689 | 2 | 44,357 | |
| 40 50 | 444 | 7,819 | 1,250 | 10,540 | |
| 50 60 | 166 | 2,333 | 435 | 464 | |
| Gson | 15 10 | 89 | 637 | 222 | 74 |
| 10 5 | 79 | 377 | 21 | 137 | |
| 5 1 | 823 | 14,474 | 950 | 8,220 | |
| Time | 1 5 | 16 | 583 | 873 | 21 |
| 5 10 | 62 | 1,306 | 229 | 548 | |
| 10 15 | 68 | 623 | 81 | 11 | |
| 15 20 | 31 | 396 | 71 | 11 | |
| 20 25 | 65 | 855 | 136 | 99,260 | |
| Chart | 1 5 | 186 | 13,081 | 3,205 | 3,350 |
| 5 10 | 349 | 9,598 | 9,122 | 1,181 | |
| 10 15 | 50 | 1,046 | 917 | 196 | |
| 15 20 | 163 | 7,087 | 1,218 | 3,842 | |
| 20 25 | 31 | 1,527 | 652 | 110 | |
| Cli | 30 20 | 252 | 5,678 | 0 | 4,566 |
| 20 10 | 51 | 941 | 597 | 1,222 | |
| 10 1 | 61 | 520 | 72 | 141 | |
| Csv | 15 10 | 410 | 2,453 | 1,209 | 383 |
| 10 5 | 53 | 435 | 219 | 221 | |
| 5 1 | 489 | 2,350 | 497 | 675 | |
| JC | 25 20 | 304 | 10,684 | 459 | 725 |
| 20 15 | 150 | 7,522 | 755 | 3,387 | |
| 15 10 | 142 | 1,092 | 194 | 1,037 | |
| 10 5 | 260 | 6,387 | 360 | 1,130 | |
| 5 1 | 263 | 3,383 | 2,127 | 2,096 |
5.4 Relation to Regression Mutation Testing
We introduce and discuss the differences between Seshat and Regression Mutation Testing (ReMT) [53], as ReMT has a similar goal as Seshat, namely to reduce the cost of mutation analysis in the context of evolving programs. When considering successive commits of evolving systems, ReMT reuses mutation testing results from the previous version and selects only the subset of tests that are affected by the latest change to rerun and update the kill matrix. If the underlying Regression Test Selection (RTS) technique is sound and complete, ReMT can output the correctly updated kill matrix with the minimum effort required.
ReMT is the most efficient when successively applied to each and every version: if intervals become longer, changes will accumulate, making ReMT increasingly inefficient (i.e., it will have to execute more and more tests and mutants). This phenomenon is known to exist in the context of regression test case selection [28]. ReMT also involves other cost and assumptions. For example, to precisely select mutants whose kill outcome may change in the new version, some techniques adopt static analysis techniques that may incur additional cost; to determine the mutant kill accurately, we also need to assume that the current version is correct.
Seshat can be complementary to ReMT, as the results show that it can provide reasonable predictions of kill matrices across much longer intervals, incurring very little cost, without assuming anything about the correctness of the current version. As an extreme example, suppose we want to update the kill matrix of Lang 60 to get the kill matrix of Lang 1, two versions with 1,590 and 2,291 tests respectively (see Table 1). Even if we do not consider any modified tests between two versions, at least 701 newly introduced tests (44%) will have to be run. We do not think that this is a reasonable scenario for ReMT. Table 7 shows the magnitudes of accumulated changes between versions, listing the number of commits, added, modified, and removed lines between two adjacent versions. The number of commits between adjacent versions, on average, is 216, which is a wider interval than ReMT’s setting that only considers the consecutive commits.
6 Threats to Validity
The major threats to internal validity lie in the implementation of Seshat as well as the correctness of actual mutation analysis that provides training data to Seshat. The models are implemented using widely used frameworks that withstood public scrutiny, such as Scipy and PyTorch. For training data, we depend on the publicly available mutation analysis script provided by Defects4J.
The threats to external validity concern the choice of subjects, programming language, and the mutation tools. Due to the nature of our technique, the results are dependent on the coding conventions adopted by the studied projects. We tried to use the most recent version of Defects4J with more diverse projects to avoid overfitting to a specific coding style. Since writing informative names is regarded as best practice, we expect the NL channel in source code written in other programming languages will provide similarly rich information. We adopt two mutation tools, Major and PIT, to reduce the threats related to the choice of a mutation tool.
The threats to construct validity include evaluation metrics we used to draw the conclusions. All evaluation metrics are standard measures for classification tasks: precision, recall, and F-score.
7 Related Work
Existing approaches for mutation testing cost reduction include mutant selection, mutant execution acceleration, and mutant score prediction [39]. Offutt et al. [34] suggested to use a small set of sufficient mutation operators instead of using a vast number of mutation operators. Namin et al. [42] advanced mutation operator selection by leveraging a multi-objective linear regression which can learn an optimal mutation operator set according to given corpus of mutation testing results. To reduce the runtime of mutant executions, Zhang et al. [52] applied the idea of test case prioritization to improving the rate of mutant kills. AccMon [46] prevented redundant mutant executions by monitoring internal states and cutting off a mutant execution if it fails to induce different infection states. Regression Testing Selection (RTS) [4] presented a practical Regression Mutation Testing [53], by selecting relevant tests that should be rerun to determine whether the new mutants are killed. Despite having a similar regression assumption with ours, we note that the RTS approach is specifically aimed at reducing the mutation execution cost, while Seshat takes one step further to provide a predictive model. Consequently, the RTS approach can be combined with Seshat when Seshat needs to periodically update its reference kill matrix by (re)running test cases. Recently introduced Predictive Mutation Testing (PMT) [51] opened up a new dimension in mutation testing by seeking to predict whether a mutant will be killed or not by the entire test suite based on the structural information on the target program and the coverage information on the given test suite: consequently, it does not require any mutant execution. Seshat, whoever, aims for a finer granularity in its prediction by attempting to infer the entire kill matrices, instead of only predicting whether a mutant is killed by the test suite or not.
The finer-grained, kill matrix level prediction may be utilised in any application that depends on the one-to-one relationship between mutants and individual test cases. Test generation techniques that use the mutants as a guidance are one of such applications. For example, to create test cases that can kill Subsuming Higher Order Mutants (SHOM) [16], one needs to start from the entire kill matrices of First Order Mutants, which Seshat can approximate. DEMiner [29] proposed to improve a concolic testing based on the information of which mutation affects which test execution: if there exists an NL channel in test cases, Seshat can be used to approximately capture the relationship at a lower cost. Some existing Automated Program Repair (APR) techniques have taken advantage the mutation analysis. Weimer et al. [48] highlighted Generate-and-Validate program repair as a dual of the mutation testing, while PraPR [11] explicitly exploited mutation tools for APR. The high cost of patch validation in APR suggests that, in both cases, Seshat may partially replace concrete mutation analysis to find an attractive trade-off between analysis cost and accuracy.
A downstream task that can directly benefit from PMA in particular is Mutation Based Fault Localisation (MBFL) [49]. MBFL techniques have exploited a mutation analysis that relates source code and tests through mutants [27, 38, 33, 21]. By introducing the syntactic modifications (i.e., mutants) to the buggy program, MBFL techniques observe the changes of test results then assign a suspiciousness score to each statement to identify the possible location of the given faults. For instance, MUSE [33] and MUSEUM [21] are based on the two conjectures: mutating correct statements is likely to make passed tests fail, and mutating faulty statements is likely to make failed tests pass. Then they compute the suspiciousness scores using the ratio of fail-to-pass tests and pass-to-fail tests. Using Spectrum based Fault Localisation (SBFL)-like formulas, Metallaxis [38] mutates the buggy program and see whether the test results show a similar pattern with the patterns of the faults. SIMFL utilises a statistical inference on the kill matrix to find the mutant that makes tests fail in a similar pattern with the faults, then it suspects that the faults would be close to the location of the mutant [27]. In all cases, the cost of mutation analysis is directly added to the cost of debugging, as these techniques tend to perform mutation analysis once a bug is detected. Seshat can be easily applied to them to reduce the cost of the mutation analysis.
Even though the mutation testing has been considered a robust measurement of test effectiveness, code coverage has been widely used as an alternative proxy due to its efficiency. It measures how well the specific code structures are exercised by the tests, e.g., a statement coverage checks whether the line is executed by at least one test case. Several studies have shown that there is a correlation between code coverage and test effectiveness [12, 14], which supports the use of the coverage as one of our baselines. However, as it does not convey the intent of the given test suite, further studies have found that the test size and the assertion should be taken into account to quantify test effectiveness [24, 54]. Checked coverage [41] is one such example that attempted to incorporate the information of the assertions in the coverage using backwards slicing on the assertions in the test. However, its dependence on the static analysis may limit the applicability of checked coverage.
Moreover, our work is also different from the existing cost reduction techniques in that Seshat utilises the natural language channel between the target program and the test cases to construct the prediction model. Recent improvements of neural language models have enabled various techniques to exploit the semantic information inferred from the natural language channel in programs [19, 40, 2]. Since the natural language channel is both related to and constrained by the algorithm channel [2], a hybrid approach would be promising to overcome the limitation of any existing analysis that aims to reason about program semantics. For example, neural word embedding has been used to discover semantically similar code snippets [15], as well as for translating API descriptions into corresponding formal specifications [1]. Recurrent Neural Network (RNN) models have been used to predict type signatures of JavaScript functions based on function and parameter names and comments [31]. Similarly, Seshat aims to approximate the relationship between mutants and test cases that kill them based on the similarity between their names in the embedding space.
8 Conclusion
In this paper, we propose Seshat, a Predictive Mutation Analysis (PMA) technique that can learn and predict an entire kill matrix, as opposed to Predictive Mutation Testing (PMT) whose aim is to predict the mutation score. Seshat exploits a Natural Language channel in the source code and test, as well as the mutant-specific code fragments to organise input features through Deep Neural Network (DNN). Empirical evaluation on 37 subjects in Defects4J and two widely used Java mutation tools, Major and PIT, demonstrates that Seshat predicts kill matrices with average F-score of 0.83 and is 39 times faster than traditional mutation analysis. In addition to predicting existing tests precisely, Seshat generalises to the new tests, with degradation of the prediction accuracy by 0.05 in F-score. Seshat outperforms PMT and a coverage based baseline model in predicting of the entire kill matrix by 0.14 and 0.45 point in F-score, and performs as well as PMT in predicting of the mutation score only. An application study on Mutation Based Fault Localisation (MBFL) technique shows that Seshat is successfully applied to the MBFL technique called SIMFL and it achieves competitive accuracy even when it uses the predicted kill matrices instead of real ones. We also show that Seshat can exploit NL channel of automatically generated test suite as long as a meaningful naming convention is upheld.
References
- [1] Arianna Blasi, Alberto Goffi, Konstantin Kuznetsov, Alessandra Gorla, Michael D. Ernst, Mauro Pezzè, and Sergio Delgado Castellanos. Translating code comments to procedure specifications. In Proceedings of the 27th ACM SIGSOFT International Symposium on Software Testing and Analysis, ISSTA 2018, page 242–253, New York, NY, USA, 2018. Association for Computing Machinery.
- [2] Casey Casalnuovo, Earl T. Barr, Santanu Kumar Dash, Prem Devanbu, and Emily Morgan. A theory of dual channel constraints. In Proceedings of the 42nd IEEE/ACM International Conference on Software Engineering: New Ideas and Emerging Results, ICSE NIER 2020, pages 25–28, 2020.
- [3] Nitesh V. Chawla, Kevin W. Bowyer, Lawrence O. Hall, and W. Philip Kegelmeyer. Smote: Synthetic minority over-sampling technique. Journal of Artificial Intelligence Research, 16(1):321–357, June 2002.
- [4] Lingchao Chen and Lingming Zhang. Speeding up mutation testing via regression test selection: An extensive study. In 2018 IEEE 11th International Conference on Software Testing, Verification and Validation (ICST), pages 58–69. IEEE, 2018.
- [5] Kyunghyun Cho, Bart Van Merriënboer, Caglar Gulcehre, Dzmitry Bahdanau, Fethi Bougares, Holger Schwenk, and Yoshua Bengio. Learning phrase representations using rnn encoder-decoder for statistical machine translation. arXiv preprint arXiv:1406.1078, 2014.
- [6] Henry Coles, Thomas Laurent, Christopher Henard, Mike Papadakis, and Anthony Ventresque. Pit: A practical mutation testing tool for java (demo). In Proceedings of the 25th International Symposium on Software Testing and Analysis, ISSTA 2016, pages 449–452, New York, NY, USA, 2016. Association for Computing Machinery.
- [7] Ermira Daka, José Miguel Rojas, and Gordon Fraser. Generating unit tests with descriptive names or: Would you name your children thing1 and thing2? In Proceedings of the 26th ACM SIGSOFT International Symposium on Software Testing and Analysis, ISSTA 2017, pages 57–67, New York, NY, USA, 2017. Association for Computing Machinery.
- [8] V. Debroy and W. E. Wong. Using mutation to automatically suggest fixes for faulty programs. In 2010 Third International Conference on Software Testing, Verification and Validation, pages 65–74, 2010.
- [9] Vidroha Debroy and W. Eric Wong. Combining mutation and fault localization for automated program debugging. Journal of Systems and Software, 90:45 – 60, 2014.
- [10] Gordon Fraser and Andrea Arcuri. Whole test suite generation. IEEE Trans. Softw. Eng., 39(2):276–291, February 2013.
- [11] Ali Ghanbari, Samuel Benton, and Lingming Zhang. Practical program repair via bytecode mutation. In Proceedings of the 28th ACM SIGSOFT International Symposium on Software Testing and Analysis, pages 19–30, 2019.
- [12] Milos Gligoric, Alex Groce, Chaoqiang Zhang, Rohan Sharma, Mohammad Amin Alipour, and Darko Marinov. Comparing non-adequate test suites using coverage criteria. In Proceedings of the 2013 International Symposium on Software Testing and Analysis, pages 302–313, 2013.
- [13] R. Gopinath, A. Alipour, I. Ahmed, C. Jensen, and A. Groce. How hard does mutation analysis have to be, anyway? In 2015 IEEE 26th International Symposium on Software Reliability Engineering (ISSRE), pages 216–227, 2015.
- [14] Rahul Gopinath, Carlos Jensen, and Alex Groce. Code coverage for suite evaluation by developers. In Proceedings of the 36th International Conference on Software Engineering, pages 72–82, 2014.
- [15] Xiaodong Gu, Hongyu Zhang, and Sunghun Kim. Deep code search. In Proceedings of the 40th International Conference on Software Engineering, ICSE ’18, page 933–944, New York, NY, USA, 2018. Association for Computing Machinery.
- [16] Mark Harman, Yue Jia, and William B. Langdon. Strong higher order mutation-based test data generation. In Proceedings of the 19th ACM SIGSOFT Symposium and the 13th European Conference on Foundations of Software Engineering, ESEC/FSE ’11, pages 212–222, New York, NY, USA, 2011. Association for Computing Machinery.
- [17] Haibo He, Yang Bai, E. A. Garcia, and Shutao Li. Adasyn: Adaptive synthetic sampling approach for imbalanced learning. In 2008 IEEE International Joint Conference on Neural Networks (IEEE World Congress on Computational Intelligence), pages 1322–1328, June 2008.
- [18] Vincent J Hellendoorn and Premkumar Devanbu. Are deep neural networks the best choice for modeling source code? In Proceedings of the 2017 11th Joint Meeting on Foundations of Software Engineering, pages 763–773, 2017.
- [19] Abram Hindle, Earl T. Barr, Zhendong Su, Mark Gabel, and Premkumar Devanbu. On the naturalness of software. In Proceedings of the 34th International Conference on Software Engineering, ICSE ’12, pages 837–847, Piscataway, NJ, USA, 2012. IEEE Press.
- [20] Thong Hoang, Hong Jin Kang, Julia Lawall, and David Lo. Cc2vec: Distributed representations of code changes. In Proceedings of the 42nd International Conference on Software Engineering, ICSE ’20. ACM, 2020.
- [21] Shin Hong, Byeongcheol Lee, Taehoon Kwak, Yiru Jeon, Bongsuk Ko, Yunho Kim, and Moonzoo Kim. Mutation-based fault localization for real-world multilingual programs (T). In 30th IEEE/ACM International Conference on Automated Software Engineering, ASE 2015, Lincoln, NE, USA, November 9-13, 2015, pages 464–475, 2015.
- [22] William E. Howden. Weak mutation testing and completeness of test sets. IEEE Transactions on Software Engineering, 8:371–379, 1982.
- [23] Michael Hucka. Spiral: splitters for identifiers in source code files. Journal of Open Source Software, 3(24):653, 2018.
- [24] Laura Inozemtseva and Reid Holmes. Coverage is not strongly correlated with test suite effectiveness. In Proceedings of the 36th international conference on software engineering, pages 435–445, 2014.
- [25] René Just. The major mutation framework: Efficient and scalable mutation analysis for java. In Proceedings of the 2014 International Symposium on Software Testing and Analysis, pages 433–436, 2014.
- [26] Rafael Michael Karampatsis, Hlib Babii, Romain Robbes, Charles Sutton, and Andrea Janes. Big Code != Big Vocabulary: Open-Vocabulary Models for Source code. In Proceedings of the 42nd International Conference on Software Engineering, ICSE ’20. ACM, 2020.
- [27] Jinhan Kim, Gabin An, Robert Feldt, and Shin Yoo. Ahead of time mutation based fault localisation using statistical inference. In 32nd IEEE International Symposium on Software Reliability Engineering, ISSRE 2021, 2021.
- [28] Jung-Min Kim, Adam Porter, and Gregg Rothermel. An empirical study of regression test application frequency. Software Testing, Verification, and Reliability, 15(4):257–279, 2005.
- [29] Y. Kim, S. Hong, B. Ko, D. L. Phan, and M. Kim. Invasive software testing: Mutating target programs to diversify test exploration for high test coverage. In 2018 IEEE 11th International Conference on Software Testing, Verification and Validation (ICST), pages 239–249, April 2018.
- [30] Donald E. Knuth. Literate programming. Comput. J., 27(2):97–111, May 1984.
- [31] Rabee Sohail Malik, Jibesh Patra, and Michael Pradel. Nl2type: Inferring javascript function types from natural language information. In Proceedings of the 41st International Conference on Software Engineering, ICSE ’19, page 304–315. IEEE Press, 2019.
- [32] Dongyu Mao, Lingchao Chen, and Lingming Zhang. An extensive study on cross-project predictive mutation testing. In 2019 12th IEEE Conference on Software Testing, Validation and Verification (ICST), pages 160–171. IEEE, 2019.
- [33] Seokhyeon Moon, Yunho Kim, Moonzoo Kim, and Shin Yoo. Ask the mutants: Mutating faulty programs for fault localization. In Proceedings of the 7th International Conference on Software Testing, Verification and Validation, ICST 2014, pages 153–162, 2014.
- [34] A. Jefferson Offutt, Ammei Lee, Gregg Rothermel, Roland H. Untch, and Christian Zapf. An experimental determination of sufficient mutant operators. ACM Trans. Softw. Eng. Methodol., 5(2):99–118, April 1996.
- [35] A. Jefferson Offutt and Stephen D. Lee. An empirical evaluation of weak mutation. IEEE Transactions on Software Engineering, 20:337–344, 1994.
- [36] M. Papadakis and N. Malevris. Automatic mutation test case generation via dynamic symbolic execution. In 2010 IEEE 21st International Symposium on Software Reliability Engineering, pages 121–130, 2010.
- [37] Mike Papadakis, Marinos Kintis, Jie Zhang, Yue Jia, Yves Le Traon, and Mark Harman. Chapter six - mutation testing advances: An analysis and survey. volume 112 of Advances in Computers, pages 275 – 378. Elsevier, 2019.
- [38] Mike Papadakis and Yves Le Traon. Metallaxis-fl: mutation-based fault localization. Softw. Test., Verif. Reliab., 25(5-7):605–628, 2015.
- [39] Alessandro Viola Pizzoleto, Fabiano Cutigi Ferrari, Jeff Offutt, Leo Fernandes, and Márcio Ribeiro. A systematic literature review of techniques and metrics to reduce the cost of mutation testing. Journal of Systems and Software, 157:110388, 2019.
- [40] Baishakhi Ray, Vincent Hellendoorn, Saheel Godhane, Zhaopeng Tu, Alberto Bacchelli, and Premkumar Devanbu. On the ”naturalness” of buggy code. In Proceedings of the 38th International Conference on Software Engineering, ICSE ’16, pages 428–439, New York, NY, USA, 2016. ACM.
- [41] David Schuler and Andreas Zeller. Checked coverage: an indicator for oracle quality. Software testing, verification and reliability, 23(7):531–551, 2013.
- [42] Akbar Siami Namin, James H. Andrews, and Duncan J. Murdoch. Sufficient mutation operators for measuring test effectiveness. In Proceedings of the 30th International Conference on Software Engineering, ICSE ’08, page 351–360, New York, NY, USA, 2008. Association for Computing Machinery.
- [43] Andrew Trenk. Testing on the toilet: Writing descriptive test names. https://testing.googleblog.com/2014/10/testing-on-toilet-writing-descriptive.html. Accessed: 2020-08-28.
- [44] Roland H. Untch, A. Jefferson Offutt, and Mary Jean Harrold. Mutation analysis using mutant schemata. In Thomas Ostrand and Elaine Weyuker, editors, Proceedings of the 1993 International Symposium on Software Testing and Analysis (ISSTA), pages 139–148, 1993.
- [45] Jeffrey M. Voas. IEEE Transactions on Software Engineering.
- [46] Bo Wang, Yingfei Xiong, Yangqingwei Shi, Lu Zhang, and Dan Hao. Faster mutation analysis via equivalence modulo states. In Proceedings of the 26th ACM SIGSOFT International Symposium on Software Testing and Analysis, ISSTA 2017, page 295–306, New York, NY, USA, 2017. Association for Computing Machinery.
- [47] Shuohang Wang and Jing Jiang. A compare-aggregate model for matching text sequences. arXiv preprint arXiv:1611.01747, 2016.
- [48] W. Weimer, Z. P. Fry, and S. Forrest. Leveraging program equivalence for adaptive program repair: Models and first results. In 2013 28th IEEE/ACM International Conference on Automated Software Engineering (ASE), pages 356–366, 2013.
- [49] W. E. Wong, Ruizhi Gao, Yihao Li, Rui Abreu, and Franz Wotawa. A survey on software fault localization. IEEE Transactions on Software Engineering, 42(8):707, August 2016.
- [50] Shin Yoo and Mark Harman. Regression testing minimisation, selection and prioritisation: A survey. Software Testing, Verification, and Reliability, 22(2):67–120, March 2012.
- [51] Jie Zhang, Lingming Zhang, Mark Harman, Dan Hao, Yue Jia, and Lu Zhang. Predictive mutation testing. IEEE Transactions on Software Engineering, 45(9):898–918, 2018.
- [52] Lingming Zhang, Darko Marinov, and Sarfraz Khurshid. Faster mutation testing inspired by test prioritization and reduction. In Proceedings of the 2013 International Symposium on Software Testing and Analysis, ISSTA 2013, page 235–245, New York, NY, USA, 2013. Association for Computing Machinery.
- [53] Lingming Zhang, Darko Marinov, Lu Zhang, and Sarfraz Khurshid. Regression mutation testing. In Proceedings of the 2012 International Symposium on Software Testing and Analysis, pages 331–341, 2012.
- [54] Yucheng Zhang and Ali Mesbah. Assertions are strongly correlated with test suite effectiveness. In Proceedings of the 2015 10th Joint Meeting on Foundations of Software Engineering, pages 214–224, 2015.