Pressure induced superconductivity in the charge density wave compound terbium tritelluride
Abstract
A series of high-pressure electrical resistivity measurements on single crystals of TbTe3 reveal a complex phase diagram involving the interplay of superconducting, antiferromagnetic and charge density wave order. The onset of superconductivity reaches a maximum of almost 4 K (onset) near GPa.
pacs:
74.62.Fj, 74.25.DwIt has long been known that layered compounds with a high degree of structural anisotropy offer a promising avenue in the search for materials with high superconducting critical temperatures Ginzburg and Kirzhnits (1982). The highest temperature superconductors known today, the copper-oxide based high- materials, are strongly layered. Very recently, the pace of the search for layered compounds possesing high superconducting critical temperatures has greatly accelerated following the discovery of superconductivity (SC) at temperatures as high as 55 K in a class of layered materials containing FeAs planes Kamihara et al. (2008); Ren et al. (2008). Interestingly, the parent compounds of the cuprate and FeAs-based high temperature superconductors display antiferromagnetic Mott insulating and spin density wave instabilities, respectively, and only become superconducting when the instability is suppressed towards zero temperature through pressure or doping. Indeed, over the past several decades it has become clear that SC very often appears when a second order phase transition is driven towards zero temperature near a so-called quantum critical point.
The quasi-2D rare-earth tritelluride compounds Te3 ( = La-Nd, Sm, and Gd-Tm) have lately received significant attention as the first system in which nominal square-planar symmetry is broken by the formation of a unidirectional charge density wave (CDW) Fang et al. (2007). Furthermore, the CDW transition temperatures of these compounds display striking systematics across the rare-earth series DiMasi et al. (1995); Sacchetti et al. (2006); Ru et al. (2008a, b). They crystallize in a weakly orthorhombic structure composed of double layers of planar Te sheets separated by corrugated Te layers. For this space group, the crystalline -axis is perpendicular to the Te sheets. Because large areas of Fermi surface are parallel and may be connected by a single nesting vector, these compounds are unstable to the formation of an incommensurate CDW within the -planes. For tritellurides containing the heavier rare-earths Dy-Tm, a second charge density wave, orthogonal to the first, forms at lower temperatures Ru et al. (2008a, b). These compounds also display magnetic order at or below K Iyeiri et al. (2003); Ru et al. (2008b). Electronic structure calculations and ARPES measurements indicate that the the Te layers play little or no role in the Fermi surface which is instead determined by the Te sheets Komoda et al. (2004); Laverock et al. (2005); Brouet et al. (2008). Therefore, rare-earth substitution may be understood as applying “chemical pressure” in that it primarily alters the lattice parameters without effecting the band filling or structure type DiMasi et al. (1995). It has been found that the CDW transition temperatures of the Te3 compounds correlate remarkably well with the in-plane lattice parameters. A reduction in lattice parameter suppresses the upper CDW transition temperature and enhances the lower CDW transition temperature Ru et al. (2008a).
Sacchetti et al., Sacchetti et al. (2007, 2006), using optical reflectivity, found that the upper CDW gap of CeTe3 closes under increasing external pressure, leading to the conclusion that external and chemical pressure have qualitatively similar effects. However, to date there appear to have been no high-pressure transport studies of rare-earth tritellurides. Therefore, we undertook to study the influence of external pressure on the various ordering temperatures of TbTe3 and to investigate the possibility that SC might appear if any of these ordering temperatures could be driven towards zero temperature. At ambient pressure, TbTe3 orders magnetically at K and displays CDW ordering near 340 K Iyeiri et al. (2003); Ru et al. (2008b). A second orthogonal CDW has not been observed in TbTe3, although previous data suggests Ru et al. (2008b) that one might be induced by a small reduction in lattice parameter.
In this Letter, we report the results of ambient pressure calorimetric and high-pressure resistivity measurements on single crystalline TbTe3. The specific heat measurements show that, at ambient pressure, TbTe3 is non-superconducting down to 600 mK. Under pressure, the upper CDW transition temperature is suppressed. A second feature in the resistivity, appearing above 1.2 GPa and moving to higher temperatures with pressure, is consistent with the appearance of a second, lower temperature, CDW. Above 2.3 GPa, we find that TbTe3 becomes superconducting with (onset) reaching nearly 4 K near GPa. Remarkably, at 2.3 GPa, three types of order, charge density wave, antiferromagnetism, and SC all appear upon progressively cooling the sample.
Single crystals of TbTe3 were grown by slow cooling of a binary melt as described elsewhere Ru and Fisher (2006). Specific heat measurements were made K in a home-built 3He calorimeter using a semi-adiabatic heat-pulse technique. Single crystals were attached to a sapphire platform with a small amount of Apiezon N grease. For the high-field calorimetric measurements, the magnetic field was applied parallel to the crystallographic -axis.
We performed three high-pressure resistivity experiments on TbTe3. The first experiment, performed in a Teflon capsule piston-cylinder cell, reached a maximum pressure of 2.3 GPa and utilized a nearly hydrostatic, 1:1 mixture of n-pentane and isoamyl alcohol as the pressure transmitting medium. Two other experiments, performed in a Bridgman anvil cell, reached maximum pressures of 15.2 GPa and 12.4 GPa, respectively. The Bridgman anvil cell experiments utilize quasi-hydrostatic, solid steatite as the pressure transmitting medium, tungsten-carbide anvils with 3.5 mm diameter flats and a total of eight wires to measure the resistance of samples of TbTe3, CeTe3, and a Pb manometer. The results of the CeTe3 experiments will be reported in a separate paper. In all of the experiments, pressure was determined from the superconducting transition temperature of a strip of Pb foil using the calibration of Bireckoven and Wittig Bireckoven and Wittig (1988). The magnitude of pressure gradients over the sample can be estimated from the width of the Pb superconducting transition. Pressure gradients were as large as of the total pressure for the piston-cylinder experiment and for the Bridgman anvil cell experiment. The resistance of each sample was measured in the ac-plane using 4 wires and a Linear Research Inc. LR-700 AC resistance bridge. Due to uncertainties in the geometry of the small samples and placement of the leads (which may move during pressurization), the absolute resistivity values are only accurate to within a factor of .
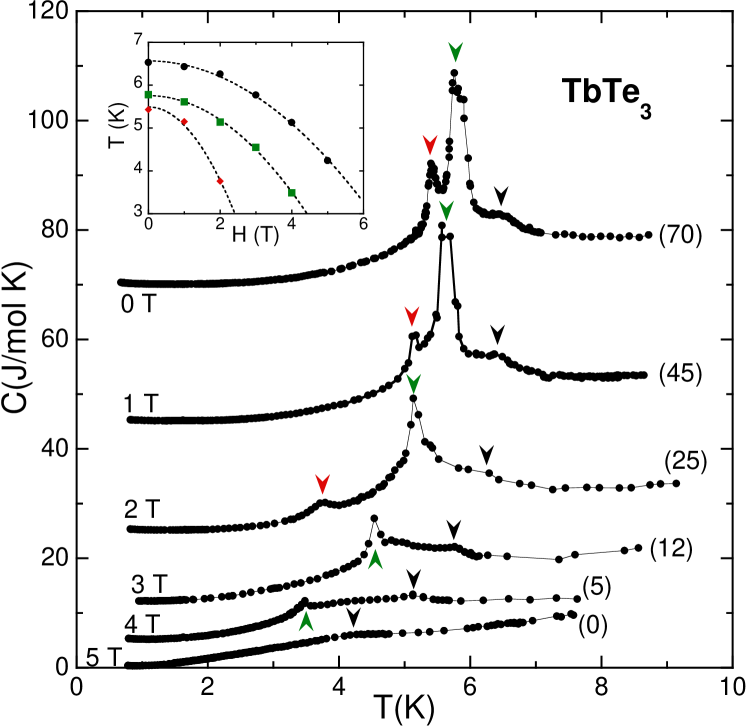
In figure 1, we plot the results of our specific heat measurements. The importance of these results is twofold: they lend further weight to the notion that TbTe3 orders antiferromagnetically at low temperature and they establish the lack of superconductivity in the previously uninvestigated temperature range 600 mK - 2 K. Similar to recently reported results Ru et al. (2008b), we observe several peaks near . A weak upturn at the lowest temperatures is most likely due to a nuclear Schottky anomaly. Under applied magnetic fields, all three of the peaks become smaller and move down in temperature with increasing field at differing rates. The inset to figure 1 shows the field dependence of these peaks. In a molecular field approximation analysis of the magnetic phase diagram of an antiferromagnet, the ordering temperature is expected to depend on the applied field as , where is a constant Shapira and Foner (1970). The dashed lines shown in the lower inset to figure 1 show that the data are well fit by the above equation affirming that all three peaks are likely due to a series of closely spaced antiferromagnetic transitions. Extrapolation of the fits implies that these transitions would be suppressed to zero temperature at 8.6, 6.4 and 3.6 tesla, respectively.
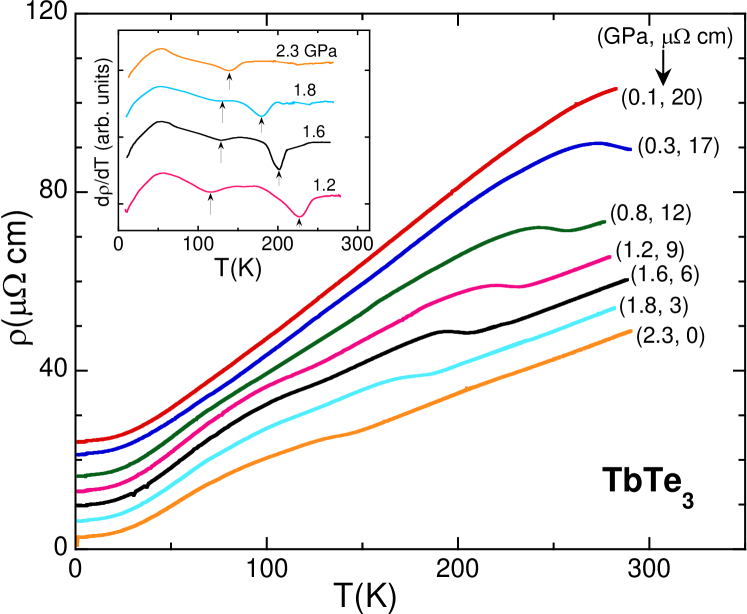
Figure 2 shows the result of the nearly-hydrostatic piston-cylinder cell high-pressure measurements on TbTe3. The onset of CDW ordering, , first becomes visible at 0.3 GPa as a kink in the resistivity just below room temperature. Upon further increasing the pressure, decreases monotonically to K at 2.3 GPa. A measurement taken on unloading from 2.3 to 1.2 GPa indicates that the pressure dependence of is reversible. A second feature, , below is visible as a minimum in the temperature derivative of the resistivity (inset to figure 2). Under pressure, moves to higher temperatures until, at 2.3 GPa, and can no longer be distinguished. We surmise that the feature at is related to the appearance of a second CDW, orthogonal to the first, as observed at ambient pressure for the heavy rare earth tritellurides Ru et al. (2008b), although this will have to be confirmed through direct measurements of the electron distribution under pressure. Also at 2.3 GPa, a sharp drop in the resistivity, suggestive of SC, appeared near 2 K.
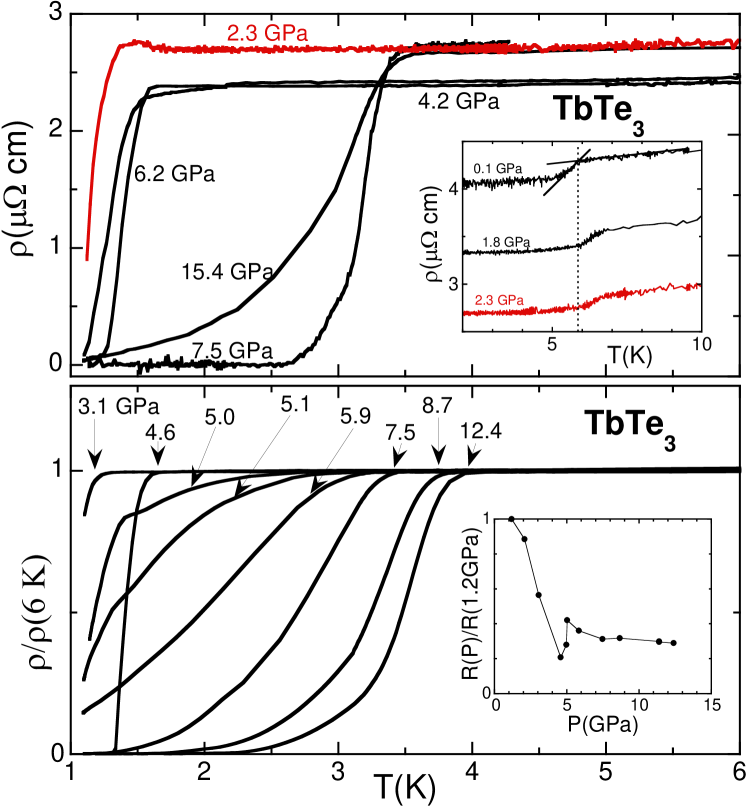
In order to further investigate the possibility of pressure induced SC in TbTe3, we performed additional high-pressure experiments in a Bridgman anvil cell. In these measurements we were unable to track , , or to higher pressures because appreciable pressure gradients in the Bridgman anvil cell lead to a broadening of the already weak resistive anomalies so that the transitions could not be unambiguously pinpointed. However, the Bridgman anvil cell data did allow us to confirm and further explore the superconducting state. Figure 3 illustrates the low temperature behavior of the resistivity of TbTe3 from the piston-cylinder and first Bridgman anvil cell experiment (upper panel) and second Bridgman anvil cell experiment (lower panel). Several measurements display complete resistive transitions to an immeasurably small resistivity below , providing clear evidence that TbTe3 becomes superconducting under pressure. The onset reaches nearly 4 K. The upper inset of figure 3 shows the resistivity versus temperature in the vicinity of at several pressures measured in the piston-cylinder cell. The Néel temperature increases monotonically with pressure over the measured pressure range. At 2.3 GPa (red curves in figure 3), the antiferromagnetic (AFM) resistive anomaly and SC are both present. Near a maximimum in versus pressure, pressure gradients have a minimal effect on the spread of values and thus the evolution of the width of the SC transition in our data suggests that may pass through a maximum near 12-15 GPa.
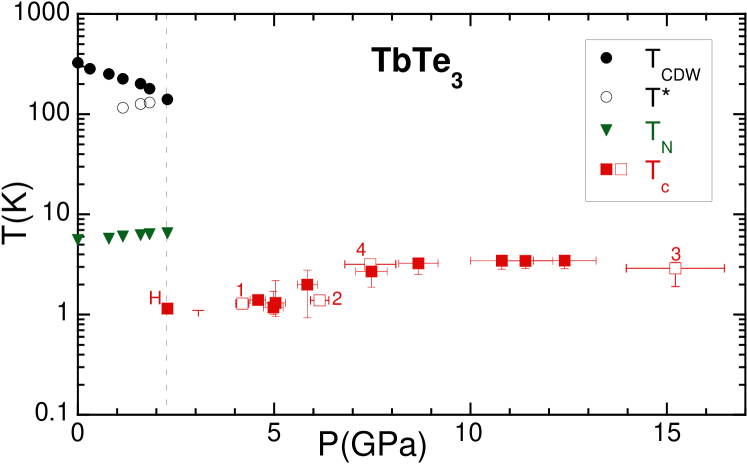
Figure 4 presents a summary of all of our our data in the form of a pressure-temperature phase diagram. The vertical dashed line near 2.3 GPa indicates the upper pressure limit for our hydrostatic piston-cylinder cell experiments; points beyond this line were measured using the Bridgman anvil cell technique. The lack of , , and data points at pressures above this dashed line is due to our inability to resolve these transitions in the Bridgman anvil cell, as discussed above, and does not necessarily indicate that the transitions are completely suppressed in this pressure region. We are investigating the possibility of tracking these transitions to higher pressures through the use of a more hydrostatic pressure medium or high-pressure ac calorimetric measurements. We find no evidence for SC at ambient pressure and pressures below 2.3 GPa down to 600 mK and K, respectively. At 2.3 GPa, CDW, AFM and SC order all appear upon cooling the sample.
Our measurements suggest that TbTe3 under pressure is likely a magnetically ordered superconductor in which long range AFM order coexists with SC. It would be illuminating to follow to higher pressures to determine its evolution and relation to SC. If drops below , measurements in the superconducting state could reveal through, for example, measurements of the upper critical field versus temperature which can be either enhanced or depressed below the Néel temperature Maple et al. (1982), or through features in the specific heat. A systematic study of the remaining rare-earth tritellurides under pressure ought to be performed in order to determine whether they also display SC and if the values follow a de Gennes’ scaling. If they do, then TbTe3 would be expected to posses amongst the lowest values in the series and significantly higher values would be expected in, for example, LaTe3 under pressure.
Though a purely electronic origin is the simplest explanation for the existence of the two CDWs at ambient pressure in Tm, Er, Ho and DyTe3 Ru et al. (2008a), it is conceivable that the progressive change in mass on going across the rare-earth series is somehow playing a role. However, if, as we propose, proves to be related to the formation of a second CDW in TbTe3, our results lend substantial weight to the arguments based on the changing band-width as the origin of the second CDW. It would be of particular interest to study and to higher pressures in order to determine if they are suppressed near the same pressure at which SC appears or reaches a maximum . It is possible that the SC in TbTe3 may be understood in terms of a Bilbro-McMillan partial gaping scenario Bilbro and McMillan (1976) in which the SC and CDW compete for the Fermi surface and, when the CDW is suppressed, SC is enhanced as additional Fermi surface becomes available to the superconducting state. The weak pressure dependence of beyond 7.5 GPa makes it likely that the superconductivity does not derive from quantum critical fluctuations, but rather from Fermi surface competition.
In summary, we have determined the effect of pressure on the CDW and magnetic ordering temperatures of TbTe3 and, to our knowledge, observed the first example of SC in a rare-earth tritelluride. Superconductivity first appears in TbTe3 at 2.3 GPa near 1.2 K and reaches a maximum of K (onset) near 12.4 GPa. It appears that the rare-earth tritellurides under pressure may offer an ideal class of compounds for the systematic study of the interplay and coexistence of charge density waves, magnetic order and superconductivity.
Acknowledgements.
Research at the University of California, San Diego, was supported by the U. S. Department of Energy (DOE) grant number DE-FG52-06NA26205. Crystal growth at Stanford University was supported by the U. S. DOE under contract No. DE-AC02-76SF00515.References
- Ginzburg and Kirzhnits (1982) V. L. Ginzburg and D. A. Kirzhnits, High-Temperature Superconductivity (Consultants Bureau, New York, 1982).
- Kamihara et al. (2008) Y. Kamihara, T. Watanabe, M. Hirano, and H. Hosono, J. Am. Chem. Soc. 130, 3296 (2008).
- Ren et al. (2008) Z. A. Ren, W. Lu, J. Yang, W. Yi, X. L. Shen, Z. C. Li, G. C. Che, X. L. Dong, L. L. Sun, F. Zhou, et al., Chinese Phys. Lett. 25, 2215 (2008).
- Fang et al. (2007) A. Fang, N. Ru, I. R. Fisher, and A. Kapitulnik, Phys. Rev. Lett. 99, 046401 (2007).
- DiMasi et al. (1995) E. DiMasi, M. C. Aronson, J. F. Mansfield, B. Foran, and S. Lee, Phys. Rev. B 52, 14516 (1995).
- Sacchetti et al. (2006) A. Sacchetti, L. Degiorgi, T. Giamarchi, N. Ru, and I. R. Fisher, Phys. Rev. B 74, 125115 (2006).
- Ru et al. (2008a) N. Ru, C. L. Condron, G. Y. Margulis, K. Y. Shin, J. Laverock, S. B. Dugdale, M. F. Toney, and I. R. Fisher, Phys. Rev. B 77, 035114 (2008a).
- Ru et al. (2008b) N. Ru, J. -H. Chu, and I. R. Fisher, Phys. Rev. B 78, 012410 (2008b).
- Iyeiri et al. (2003) Y. Iyeiri, T. Okumura, C. Michioka, and K. Suzuki, Phys. Rev. B 67, 144417 (2003).
- Komoda et al. (2004) H. Komoda, T. Sato, S. Souma, T. Takahashi, Y. Ito, and K. Suzuki, Phys. Rev. B 70, 195101 (2004).
- Laverock et al. (2005) J. Laverock, S. B. Dugdale, Z. Major, M. A. Alam, N. Ru, I. R. Fisher, G. Santi, and E. Bruno, Phys. Rev. B 71, 085114 (2005).
- Brouet et al. (2008) V. Brouet, W. L. Yang, X. J. Zhou, Z. Hussain, R. G. Moore, R. He, D. H. Lu, Z. X. Shen, J. Laverock, S. B. Dugdale, et al., Phys. Rev. B 77, 235104 (2008).
- Sacchetti et al. (2007) A. Sacchetti, E. Arcangeletti, A. Perucchi, L. Baldassarre, P. Postorino, S. Lupi, N. Ru, I. R. Fisher, and L. Degiorgi, Phys. Rev. Lett. 98, 026401 (2007).
- Ru and Fisher (2006) N. Ru and I. R. Fisher, Phys. Rev. B 73, 033101 (2006).
- Bireckoven and Wittig (1988) B. Bireckoven and J. Wittig, J. Phys. E: Sci. Instrum. 21, 841 (1988).
- Shapira and Foner (1970) Y. Shapira and S. Foner, Phys. Rev. B 1, 3083 (1970).
- Maple et al. (1982) M. B. Maple, H. C. Hamaker, and L. D. Woolf, Superconductivity in Ternary Compounds II, Ø. Fischer and M. B. Maple, editors. (Springer Verlag, 1982), chap. 4.
- Bilbro and McMillan (1976) G. Bilbro and W. L. McMillan, Phys. Rev. B 14, 1887 (1976).