Progenitor Dependence of Neutrino-driven Supernova Explosions
with the Aid of Heavy Axion-like Particles
Abstract
We perform spherically symmetric simulations of core-collapse supernovae with the aid of heavy axion-like particles (ALPs) which interact with photons and redistribute energy within supernova matter. We explore a wide ALP parameter space that includes MeV-scale ALP mass and the ALP-photon coupling constant , employing three progenitor models with zero-age main-sequence mass of , , and . We find a general trend that, given MeV, heavier ALPs are favorable for the shock wave to be successfully revived, aiding the onset of the neutrino-driven explosion. However, if ALPs are heavier than MeV, the explosion is failed or weaker than that for the models with smaller , because of an insufficient temperature inside the supernova core to produce heavy ALPs. The maximum temperature in the core depends on the initial progenitor structure. Our simulations indicate that the high-temperature environment in the collapsing core of massive progenitors leads to a significant impact of ALPs on the explodability.
I Introduction
Axion is a hypothetical particle that is introduced to solve the strong CP problem Wilczek (1978); Weinberg (1978). Axions can interact with the Standard Model particles such as nucleons, photons, and electrons, and hence they can be produced in a hot plasma in astrophysical objects. Motivated by the recent development in the string theory Svrcek and Witten (2006); Cicoli et al. (2012); Arvanitaki et al. (2010), a more general class of axion-like particles (ALPs) has been introduced as a new particle beyond the Standard Model, where the mass and the coupling constants are treated as independent parameters.
ALPs that interact with photons have been searched for through astronomical observations. For example, the energy loss and transfer induced by ALPs can shorten the stellar lifetime, particularly for horizontal branch (HB) stars. Since globular clusters contain many HB stars, their stellar populations have been used to constrain the ALP-photon coupling Raffelt and Dearborn (1987); Ayala et al. (2014); Carenza et al. (2020); Lucente et al. (2022).
ALPs can also affect dynamics of core-collapse supernovae (SNe), which are the most copious astrophysical source of ALPs. If ALPs are heavy and decay radiatively inside the star, they can heat the stellar mantle Sung et al. (2019). As a result, the explosion energy can become higher than the standard SN models. Recently, Refs. Caputo et al. (2022a, b) pointed out that low-energy SN events such as SN 1054 can be used to severely constrain the ALP-photon interaction strength. In addition, if the decay of ALPs takes place outside the star, the -rays produced via the ALPs’ decay can be detectable on the Earth Jaeckel et al. (2018a). The fact that such -rays accompanied by the neutrino burst were not detected from SN 1987A Chupp et al. (1989) imposed upper limits on the coupling constant Burrows et al. (1989); Turner (1988); Engel et al. (1990); Giannotti et al. (2011); Payez et al. (2015); Diamond et al. (2023); Müller et al. (2023).
The neutrino burst from SN 1987A, which lasted for s Hirata et al. (1987); Bionta et al. (1987); Alekseev et al. (1987), is also a useful probe into the production of new particles in SNe. If the ALP luminosity exceeds the neutrino luminosity, the proto-neutron star (PNS) cooling should be significantly accelerated, resulting in a shorter duration time of the SN 1987A neutrino burst than observed. This energy-loss argument has been applied to constrain the nature of ALPs Turner (1988); Raffelt and Seckel (1988); Masso and Toldra (1995); Lee (2018); Lucente et al. (2020); Lella et al. (2024). However, most of these studies of the traditional energy-loss argument were not based on realistic numerical simulations. Since the PNS cooling is a non-linear process, it is necessary to perform hydrodynamic simulations coupled with the ALP emission to predict the neutrino detection rate quantitatively. For example, SN models developed in Ref. Betranhandy and O’Connor (2022) show that QCD axions can promote the PNS contraction, contributing to the enhancement of the neutrino mean energy. Thus, since ALPs can change the SN properties, it is necessary to perform self-consistent neutrino-driven SN simulations that take ALPs into account.
ALPs, if they exist, can leave traces in multi-messenger signals such as neutrinos and gravitational waves from a nearby SN event. In order to predict the observable signals, it is required to perform self-consistent simulations that are coupled with the ALP transport, as performed in Refs. Fischer et al. (2016, 2021); Betranhandy and O’Connor (2022); Mori et al. (2022, 2023); Foguel and Fraga (2023). In a previous study Mori et al. (2022), they developed a SN simulation code that takes into account the backreactions of ALP production and decay. They employed ALPs with mass – and the ALP-photon coupling constant 4 – 40. As a result, they found that for heavy ALPs with the mass of MeV, shock revival can occur even in one-dimensional (1D) configuration. Most of those models have higher explosion energies than the typical value erg for observed (note that the typical value is recently updated to erg Martinez et al. (2022)).
Ref. Mori et al. (2022) performed SN simulations for and 11.2 progenitor models taking account of ALPs. Although the simulation studies Mori et al. (2022, 2023) have shown that heavy ALPs help SN explosions, the number of the available models is still limited. Since a wide range of massive star with masses above can lead to SN explosions Sukhbold et al. (2016); Müller et al. (2016); Ertl et al. (2016); Boccioli et al. (2023), we need to perform SN simulations with different progenitor models for preparing for a next Galactic SN whose progenitor mass is unknown.
In this study, we perform SN simulations based on Ref. Mori et al. (2022) for three progenitor stars. We use 11.2, 20 and 25 progenitor models, taking into account ALPs with and . The ALP parameter space we explore is more extended and detailed than that of the previous study. We perform 1D simulations, which do not require high computational cost, to compute 90 models in total and survey a wide range of the ALP mass, the coupling constant, and the progenitor models. In particular, we focus on the progenitor dependence of the ALP effects on SN dynamics.
This paper is organized as follows. In Section II, we explain the ALP model we adopt and the setup of our simulations. In Section III, we show the results of the simulations. In particular, in Section III.1, we focus on the dependence of SN dynamics on the ALP parameters for the progenitor, and in Section III.2, we discuss the ALP effects on different progenitors. In Section IV, we summarize our results and make the conclusion.
II Methods
Following Mori et al. (2022), we have performed 1D core-collapse SN simulations, taking account of ALP heating and cooling. For the ALP production and absorption rates, we employ the same formalism as used in Mori et al. (2022). In this section, we provide a brief summary of the treatment of the ALP effects in our simulations.
II.1 ALP production rates
In this work, we consider a photophilic ALP model where the ALPs are generated through two photon interaction processes; the Primakoff process and the photon coalescence .
The Primakoff rate is given as
| (1) |
where is the number density of ALPs, is photon energy and is the Bose-Einstein distribution of photons, is plasma frequency. The ALP energy is equal to because of the energy conservation, and is given by Di Lella et al. (2000)
| (2) |
where is the temperature, is the Debye-Hückel scale, is the ALP momentum, and is the wave number of photons in plasma.
The photon coalescence rate is given as Di Lella et al. (2000)
| (3) |
The energy loss rates via these two processes are given by
| (4) |
The photon coalescence contributes to the ALP production only when ALPs are heavier than where the plasma frequency is the “effective photon mass”.
II.2 ALP absorption rate
The ALPs produced by these processes propagate through the SN matter and affect the energy transfer. If they decay into photons within the SN matter and the photons are absorbed by the matter in the post-shock region, they could assist the shock revival. We consider the inverse Primakoff process and radiative decay as the ALP decay processes.
The inverse Primakoff rate is given as Lucente et al. (2020)
| (5) |
where = and is the velocity of ALPs. The radiative decay rate is given as
| (6) |
II.3 ALP transport
The previous study Mori et al. (2022) incorporated the ALP transport into SN simulations as follows. The evolution of the ALP energy per unit volume is described by
| (7) |
where is the ALP energy flux and is the heating rate per unit volume due to ALPs. Assuming stationarity and spherical symmetry, Eq. (7) is simplified to
| (8) |
here is ALP luminosity. We solve Eq. (8) at each time step to obtain . We then update the internal energy at the -th step as
| (9) |
where is the internal energy and is the time step.
II.4 Model setup
The numerical setup in this study is essentially the same as in Mori et al. (2022). We employ the 3DnSNe code Takiwaki et al. (2016), which is a multi-dimensional neutrino radiation hydrodynamics code developed to study core-collapse SNe. The neutrino transport is solved by the three-flavor isotropic diffusion source approximation (IDSA) scheme Liebendoerfer et al. (2009). We use the state-of-the-art neutrino opacity Kotake et al. (2018) and the neutrino energy spectrum is discretized with 20 energy bins for . We take account of the effective general relativistic effect Marek et al. (2006) for the gravitational potential and the gravitational redshift for the neutrino transport.
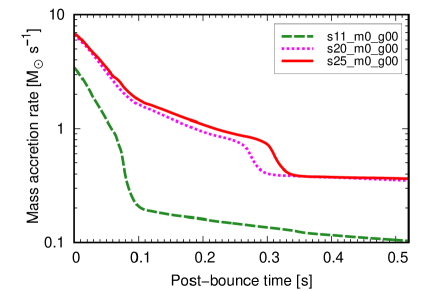
We use the 11.2 progenitor model from Woosley et al. (2002), and the 20 and 25 models from Woosley and Heger (2007), to investigate the progenitor dependence of ALP effects on core-collapse SN explosions. There are two reasons for the choice of these progenitors. First, these three progenitor models are red supergiants and massive enough for their core to undergo gravitational collapse during the final stage of their evolution Smartt et al. (2009, 2004). Their explosions will appear as type II SNe, the most commonly observed type among core-collapse SNe. Second, these progenitor models have a different mass-accretion history, due to their differences in compactness, as shown in Fig. 1. Since the gravitational potential of the accreting gas is the dominant energy reservoir for neutrino-driven explosions, the difference in the mass accretion rate leads to different dynamical evolution. Moreover, the thermal evolution of their core (for example, the maximum temperature achieved in the core) strongly affects the ALP production rate. The models examined in this study are suitable for the purpose to inspect the dependence of the ALP emissions on the progenitor structure.
For these progenitor models, we performed one-dimensional core-collapse SN simulations to investigate the impact of ALPs on the core-collapse SN dynamics. The ALP parameter space has been constrained by various studies (e.g. Lucente et al., 2020, 2022; Jaeckel et al., 2018b; NA64 Collaboration et al., 2020; Carenza et al., 2020; Döbrich et al., 2020; Dolan et al., 2017; Diamond et al., 2024; Dev et al., 2024). ALPs with MeV are reported to have significant effects on core-collapse SN dynamics Caputo et al. (2022b); Mori et al. (2022). Considering these results, we have chosen the parameter space of ALP mass, , and ALP-photon coupling constant, . Note that there is also discussion that excludes some parts of this range Caputo et al. (2022a); Fiorillo et al. (2025); Diamond et al. (2024).
The models are labeled as follows. For example, a model with the progenitor and ALPs with and is called ‘s20_m2_g08’. In addition, the model without ALPs is labeled as ‘s20_m0_g00’ and referred to as the no-ALP model.
III Results
We perform 90 simulations for the three progenitor models until the post-bounce time s. In Section III.1, we present the properties of the models and examine their dependence on the ALP parameters, and . In Section III.2, we compare the characteristics of the models with different masses for some certain choices of the ALP parameters.
III.1 ALP parameter dependence
When ALPs are not taken into account, shock revival does not occur in one-dimensional core-collapse SN models (e.g. Liebendörfer et al., 2001; O’Connor et al., 2018), except for models with a low-mass progenitor Kitaura et al. (2006); Fischer et al. (2010); Hüdepohl et al. (2010). However, in some of our models considering ALPs, the shock wave is successfully revived and leads to a supernova explosion.
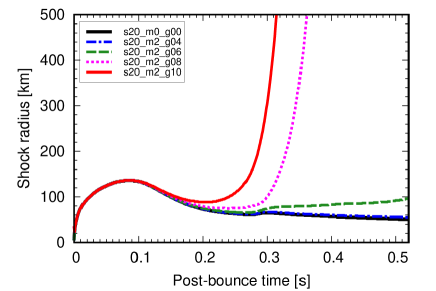
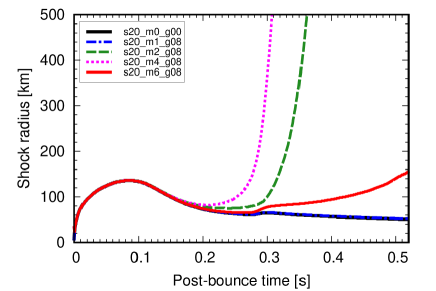
Figure 2 shows the time evolution of the shock radius for the s20_m2 model series with different coupling constants , 6, 8 and 10, along with the no-ALP model denoted by s20_m0_g00. For the no-ALP model and the model (solid black and dash-dot blue lines), the shock wave stalls at and fails to revive. This behavior is similar to conventional one-dimensional simulations without ALPs. However, in the cases of the and 10 models (dotted magenta and solid red lines), the shock wave successfully revives and turns to a runaway expansion around s. For the model (dashed green line), the shock wave gradually expands after s, but the shock radius remains at 100 km at the end of the simulation and it is not clear if the shock expansion continues afterward. These models indicate the trend that the shock wave is more likely to revive for the models with higher coupling constants.
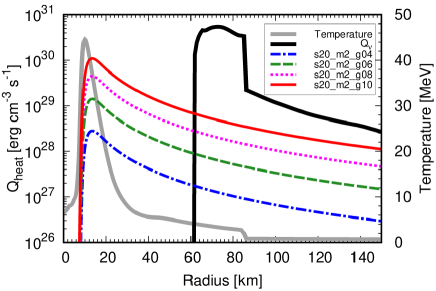
This trend can be explained by the dependence of the ALP heating rate induced by ALP decay photons on the coupling constant. In Fig. 3, the radial profiles of are shown for the s20_m2 model series at the time s. We can see that a higher coupling constant induces higher ALP heating rates, which can lead to the successful shock revival.
Figure 3 shows that the ALP heating rates peak at km regardless of the coupling constant. This is because the temperature distribution (drawn in the solid gray line) peaks at this location, where the ALP production rate is also maximized due to its sensitivity to temperature. Furthermore, because of the ray-by-ray approximation used in solving ALP transport, ALPs cannot propagate inward from the radius where they are produced. As a result, there is a precipitous cutoff in at km. Outside of the peak, decreases following a dependence shown in Eq. (15).
We can also see that the neutrino heating rate (drawn in the solid black line) is dominant between the gain radius km and the the shock radius km. The neutrino cooling dominates over the heating inside the gain radius, and they balance out at . The neutrino heating rate drops at because nucleons, which are the primary targets of the neutrino absorption process, are scarcely present outside the shock radius. The excess of the neutrino heating rate over the heating rate of ALPs implies that supernova explosions are primarily driven by the neutrino heating and ALPs play a secondary role.
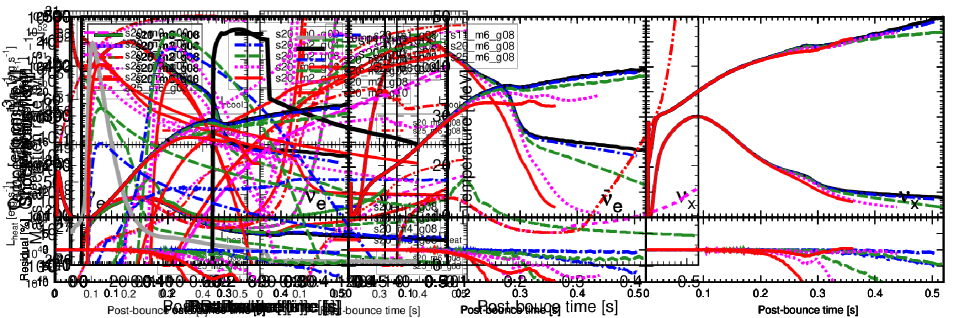
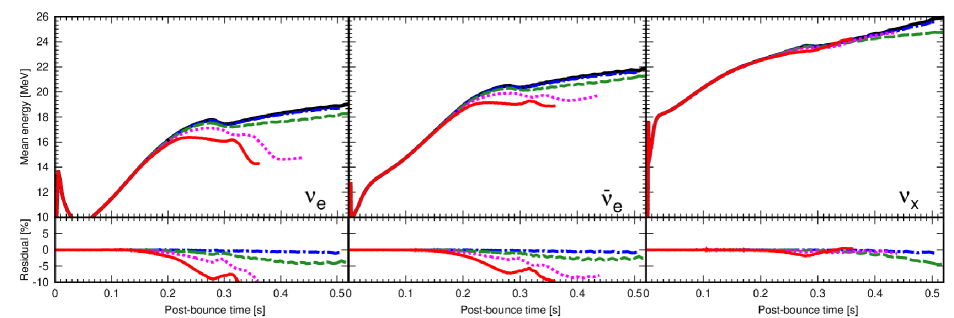
In Fig. 4, we present the neutrino luminosity and mean energy for the s20_m2 model series, along with the residuals relative to the no-ALP model. Before shock revival ( s), the luminosity and the mean energy for all flavors are essentially unchanged by considering the effects of ALPs. However, the models with higher coupling constants show decrease in the and luminosities and their mean energies, because these models experience early shock revival, leading to a decrease in the mass accretion rate. Only a slight difference is observed in the mean energy among these models because is predominantly produced in the dense core via neutral current pair production (e.g. Betranhandy and O’Connor, 2020) and less affected by the mass accretion history. Although ALP emission can rapidly extract energy from the PNS, it takes a time on the order of the neutrino diffusion time (several seconds) for the information to reach the neutrino sphere Bar et al. (2020).
The SN dynamics is also dependent on the ALP mass. In Fig. 5, we plot the shock evolution for the s20_g08 model series with , 200, 400, and 600 MeV. For the model with MeV (dash-dot blue line), the shock wave shows almost no change compared to the no-ALP model and fails to revive, whereas the shock waves of the models with 200 and 400 MeV models (dashed green and dotted magenta lines) turn to expand at ms and 250 ms after bounce. Therefore, within the range of , higher ALP masses lead to an earlier shock revival. However, in the case of the model with MeV (solid red line), the propagation of the bounce shock is slower than in the models with lighter ALPs, and in the MeV model, the shock wave does not initiate a runaway expansion, similar to the no-ALP model (solid black line). These results indicate that a higher ALP mass does not necessarily facilitate the shock revival and that the relationship between the ALP mass and the shock wave behavior exhibits a non-monotonic trend.
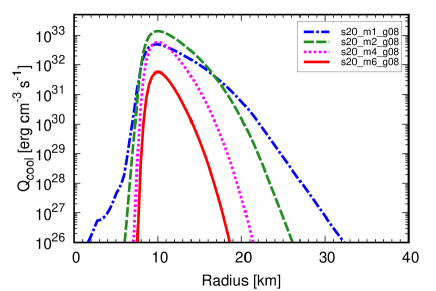
The non-monotonic dependence on can be explained by the dependence of the ALP production rate. Fig. 6 shows the radial profile of at s. The cooling rates reach a peak at regardless of the ALP masses, because the ALP production processes are sensitive to the matter temperature, which also peaks in this region. In the case of the s20_m6_g08 model (and the s20_m8_g08 model as well), the peak value is about an order of magnitude lower than the value in the other models. This is due to the Boltzmann suppression, as the temperature is not high enough to produce such heavy ALPs.
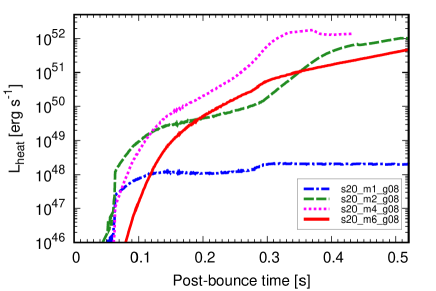
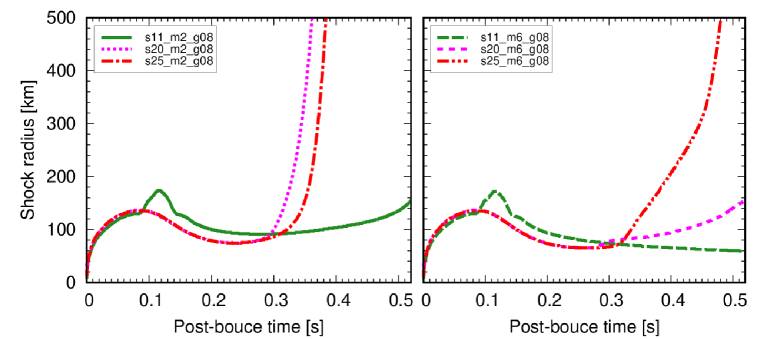
Figure 7 shows the time evolution of the ALP heating rate in the gain region defined as
| (10) |
For the s20_m1_g08 model (dash-dot blue line), the ALP heating rate is as low as erg s-1, which is insufficient for the revival of the shock wave. The s20_m2_g08 and s20_m4_g08 models (dashed green dotted magenta lines) show higher heating rates of erg s-1 at s compared to the other models, thus photons from decaying ALPs effectively heating the region behind the shock, promoting shock revival. The differences in the heating rates among these models can be explained by the fact that heavier ALP masses contribute to the higher heating rate and more efficient heating in the gain region because of their shorter mean free path. However, in the s20_m6_g08 model (solid red line), despite the higher mass, the heating rate is lower than that of the s20_m2_g08 and s20_m4_g08 models due to a reduction in the production rate. Furthermore, the s20_m6_g08 model shows a delayed increase in the heating rate compared to the other models, because it takes longer to reach a temperature to sufficiently produce 600 MeV ALPs. These delays in the increases in heating rate and temperature lead to the delayed shock expansion.
III.2 Progenitor dependence
In this section, we discuss the progenitor dependence of the shock evolution and its underlying causes, focusing on the s11_g08, s20_g08 and s25_g08 model series with ALP masses and .
Figure 8 shows the shock evolution for each model. For the progenitor model, a bump in the shock radius is observed at s, which is induced by the infall of the oxygen-silicon layer. For the models with MeV (the left panel of Figure 8), the model (solid green line) shows slow outward propagation of the shock wave, although it is not clear whether the model successfully explodes. The and models (dotted magenta and dash-dot red lines) show a successful shock revival at s.
Figure 8 also shows that the shock expansion is suppressed for the models with heavy ALPs ( MeV, the right panel). This is because the production rate of heavy ALPs is relatively low. In particular, the s20_m6_g08 model (loosely dashed line) exhibits a pronounced delay in shock expansion, with the shock failing to reach by s. These results show that the heavier progenitor models facilitated by ALPs are more likely to undergo shock expansion. This trend becomes more pronounced for the models with heavier ALPs such as MeV.
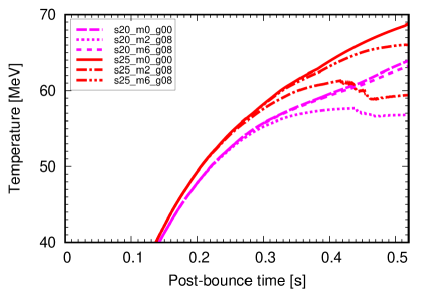
The dependence of the shock behavior on the progenitors is induced by the difference in the maximum temperature of the SN models. Fig. 9 shows the maximum temperature in the SN core, which is achieved at km, with a focus on the s20 and s25 model series. For all models, the temperature increases over time and reaches at s due to the gravitational compression of the accretion layer associated with the growth of the PNS mass. After s, the models taking account of the ALP effects show that the increase in temperature is suppressed because the shock expansion achieved at this time causes a decrease in the accretion rate.
Figure 9 also shows that, for any ALP parameter sets, the peak temperature of the s25 series models (red lines) is higher than that of the s20 series models (magenta lines). The difference in the PNS temperature can be interpreted in terms of the positive correlation between the iron core mass and the compactness parameter O’Connor and Ott (2011). For massive or high-compactness progenitors, the iron core masses tend to be heavier due to the thermal pressure support. This explains a general tendency that a progenitor with higher compactness leads to a hotter PNS.
The ALP production rate is higher for a heavier progenitor model because of the higher temperature. As a result, the ALP heating rate becomes also higher for a heavier progenitor.
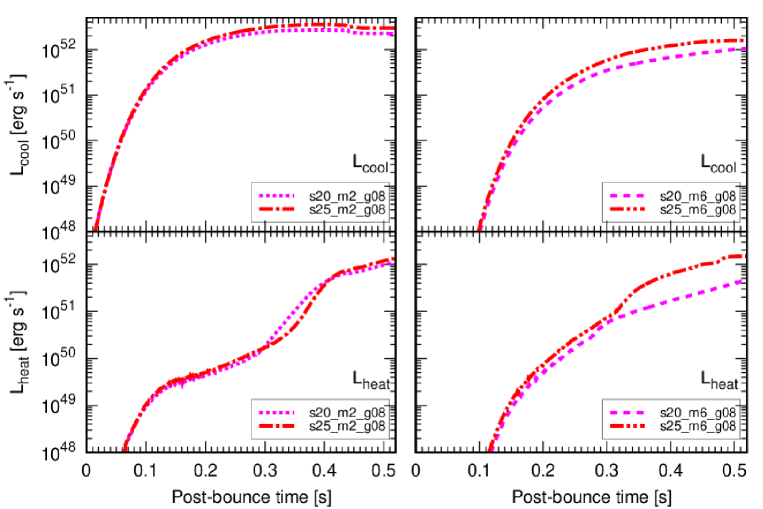
In Fig. 10, we show the evolution of the ALP cooling and heating rates in the gain region. Here the cooling rate is defined as
| (11) |
For the m2 model series, the cooling rates begin to increase early, with little noticeable difference between the and models (dotted magenta and dash-dot red lines). This is because the temperature required to produce 200 MeV ALPs is comparatively lower than that for heavier ALPs and realized shortly after post-bounce for both progenitor models. Accordingly, the differences in the ALP heating rates are observed to be negligible before the shock revival ( s). After the shock revival, the ALP heating rates show a substantial increase due to the extension of the gain region.
On the other hand, for the m6 model series, the cooling rates increase with a delay and are lower compared to the m2 model series. The reason for this is that it takes a longer time to realize a sufficient temperature to produce 600 MeV ALPs. We can also see that the s25_m6_g08 model (dash-dot-dot red line) exhibits the higher cooling and heating rates than the s20_m6_g08 model (loosely dashed magenta line), because of its higher temperature. From our systematic investigation, it is suggested that since is sensitive to the temperature, and tend to be higher in the heavier star. As a result, in the s25_m6_g08 model, ALPs heat the gain region more effectively, making shock wave revival more likely than in the s20_m6_g08 model.
In Ref. Lucente et al. (2020), post-processing calculations of the ALP cooling rate were performed using one-dimensional simulations that artificially amplify neutrino heating and trigger the explosion. They showed that, at s for the model, the cooling rate induced by ALPs with is orders of magnitude lower compared to the case for . However, in our study, although the progenitor model and time differ — and s, respectively — the difference in the cooling rates is only orders of magnitude. One of the reasons for this discrepancy is that, in our model, the delay in shock expansion for suppresses the decrease in mass accretion rate. This allows the temperature to continue increasing up to higher compared to the case for at s. As a result, ALPs with are more likely to be produced in our self-consistent simulations.
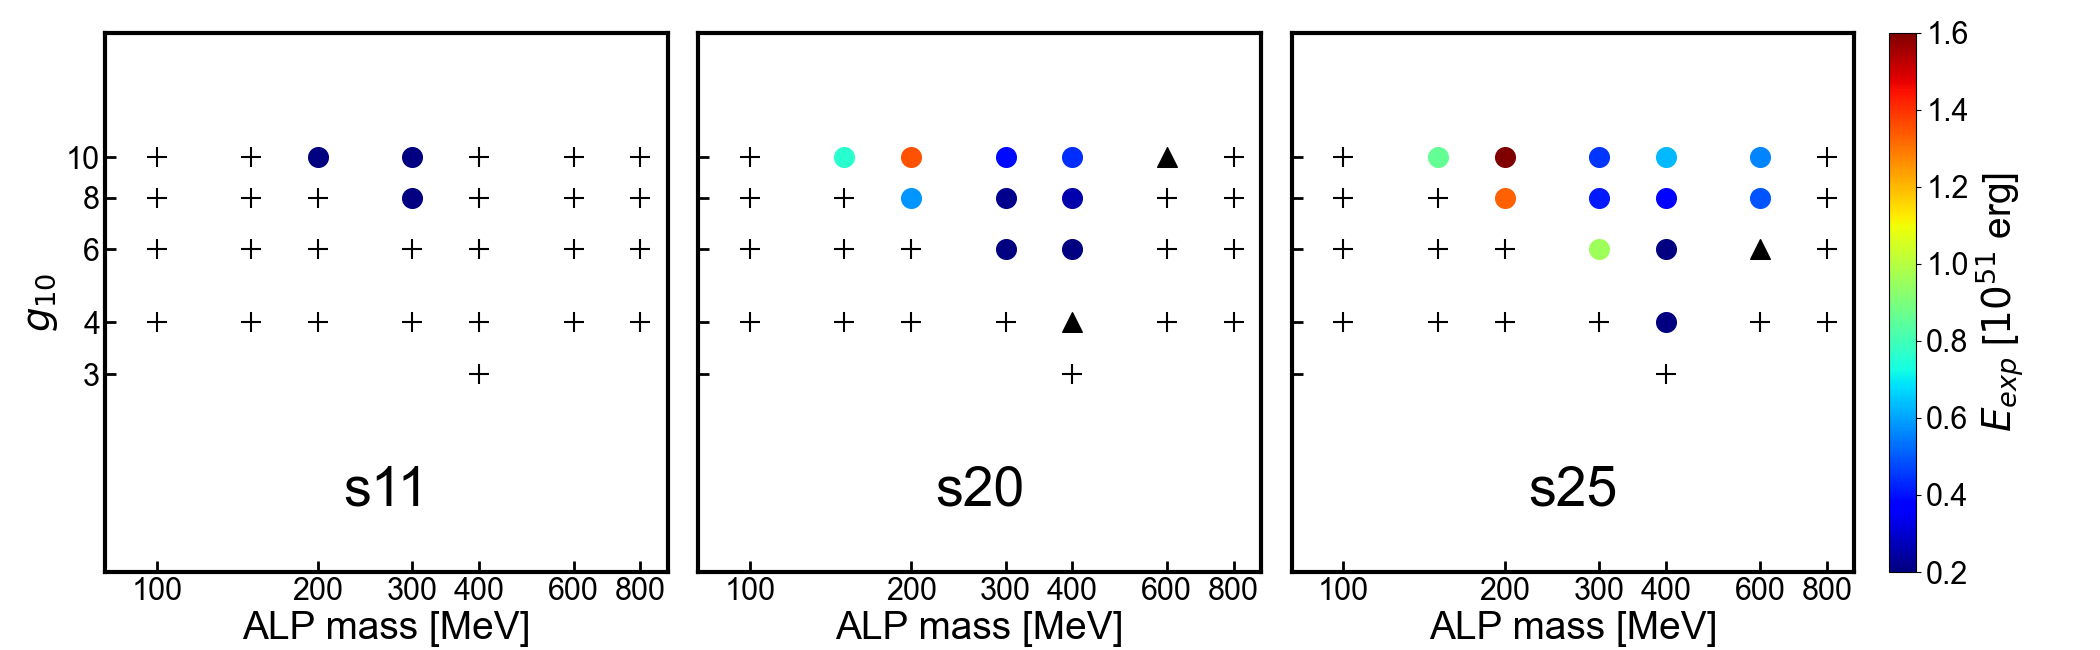
Figure 11 shows the explodability and explosion energies of our SN models with various ALP parameters. The symbols denote the final fate of the models and the color filling each symbol shows the explosion energy at the time when the shock wave reaches . In this plot, the crosses represent the models that fail to explode, while the filled circles represent the models with successful explosion. The triangles represent models in which the shock wave propagates outward but does not reach at the end of the simulations. This figure indicates that the heavier progenitor models have a more extended ALP parameter region that can lead to shock revival even with the spherically symmetric geometry. It is also shown that the heavier progenitor models exhibit higher explosion energies.
IV Conclusion and Discussion
In this study, we performed stellar core-collapse simulations with ALPs to investigate the progenitor dependence of the impact of ALPs on SNe. We employed the , and progenitor models, as well as ALPs with and .
The heating effect induced by the ALP radiative decay can lead to a successful SN explosion even in the one-dimensional geometry if the heating rate is sufficiently high Mori et al. (2022). Regardless of the ALP mass, when the coupling constant is higher, becomes higher. When the ALP mass is lower than MeV, heavier ALPs with a fixed induce higher because of a shorter mean free path of ALPs. However, when ALPs are heavier than MeV, heavier ALPs induce lower . This non-monotonicity is attributed to the Boltzmann suppression for the ALP production in the SN core.
We find that the ALP parameter region in which ALPs cause SN explosions with the one-dimensional geometry is more extended for heavier progenitor models. Also, our simulations indicate that the explosion energy becomes higher for heavier stars. For example, for ALPs with and , the s25 model successfully revives the shock wave, whereas the s11 and s20 models do not. This difference arises because the higher temperature environment in the heavier progenitor facilitates the production of heavy ALPs.
We will refer to the limitation of this study. In our simulations, the gravitational trapping effects on ALPs are not considered. As pointed out by Ref. Lucente et al. (2022), ALPs can be gravitationally trapped when the ALP kinetic energy is not large enough to escape from the stellar gravitational potential. Although the gravitational trapping is negligible for Lucente et al. (2022), it is worthwhile to develop an advanced transport scheme to study the effect of the trapping on the ALP heating.
In addition, the ALP luminosity could be influenced by the treatment of the nuclear equation of state (EoS). We employed the EoS from Lattimer and Swesty with MeV Lattimer and Douglas Swesty (1991), which is classified as a soft EoS. However, recent mass-radius measurements of neutron stars Miller et al. (2021); Riley et al. (2021); Raaijmakers et al. (2021) indicate that the radius of a neutron star is km, which is smaller than the prediction of Ref. Lattimer and Douglas Swesty (1991). From this perspective, stiffer EoSs such as the DD2F-SF Typel et al. (2010) and SFHo Steiner et al. (2013) are preferred. The stiffer EoSs would reduce the PNS temperature and decrease the ALP luminosity. It remains still to quantitatively investigate the effect of different EoSs on the ALP emission.
In our simulations, we focused on ALPs that interact only with photons. However, ALPs can interact with nucleons and pions as well (e.g. Manzari et al., 2024; Benabou et al., 2024). When the ALP-nucleon interaction is considered, ALPs can be produced through the nucleon bremsstrahlung Brinkmann and Turner (1988); Raffelt and Seckel (1995); Carenza et al. (2019) and the pion conversion Carenza et al. (2021); Fischer et al. (2021). These processes would enhance the ALP production rate and cause the PNS contraction because of the additional cooling Betranhandy and O’Connor (2020). If the ALP luminosity is high enough, this effect can significantly enhance the explosion energy. In addition, the radiative decay of ALPs produced through these processes would contribute to the heating rate in the gain region. Because these effects would affect neutrino signals Fischer et al. (2016, 2021), detailed comparison with SN 1987A neutrinos would provide information on ALPs. In order to establish a comprehensive understanding of the role of ALPs in the SN explosion mechanism, it is desirable to extend our framework to include the ALP interactions with nucleons and pions, in addition to photons, in future studies.
Our simulations employ spherically-symmetric geometry to perform systematic investigation across a broad range of the ALP parameter space. However, multidimensional effects and stellar rotation play important roles on the explodability and the explosion energy Janka (2012); Kotake et al. (2012); Burrows (2013); Foglizzo et al. (2015); Nordhaus et al. (2010); Hanke et al. (2012); Dolence et al. (2013); Takiwaki et al. (2014); Nakamura et al. (2019); Nagakura et al. (2019); Melson et al. (2020); Foglizzo et al. (2007); Blondin et al. (2003). Indeed, two-dimensional SN simulations taking into account ALPs have been performed to investigate their effects on the explosion energy and neutrino and gravitational wave signals Mori et al. (2023). Additionally, multi-dimensional models for the core-collapse of rotating stars Nakamura et al. (2014); Summa et al. (2018) indicate that the centrifugal force could reduce the PNS temperature. Since the ALP production rate is sensitive to the matter temperature, it is desirable to develop SN models taking both stellar rotation and ALPs into account to explore the ALP effects on rotating stars. Furthermore, three-dimensional simulations that account for ALPs have not yet been realized. The current study serves as a preparatory step toward developing three-dimensional simulations that incorporate ALPs, providing comprehensive insights into the important role of progenitor structure in ALPs’ contribution to CCSNe. These three-dimensional simulation results are expected to offer crucial insights for constraining ALP parameters using multi-messenger signals from the next nearby supernova event.
Acknowledgements.
Numerical computations were carried out on the PC cluster at the Center for Computational Astrophysics, National Astronomical Observatory of Japan. This work is supported by JSPS KAKENHI Grant Numbers JP23KJ2147, JP23K13107, JP23K20862, JP23K22494, JP24K00631 and funding from Fukuoka University (Grant No.GR2302) and also by MEXT as “Program for Promoting researches on the Supercomputer Fugaku” (Structure and Evolution of the Universe Unraveled by Fusion of Simulation and AI; Grant Number JPMXP1020230406) and JICFuS.Appendix A Analytic Expression for the ALP Heating Rate
In our simulations, we solve Eq. (8) to obtain the ALP heating rate per unit mass. Although the numerical integration of Eq. (8) is necessary to obtain its accurate solution, we can find an approximate expression for as follows. The ALP luminosity is written as
| (12) |
where is the mean free path of ALPs, is ALP flux, km is the peak radius of , and
| (13) |
The energy per second injected by the ALP into the spherical shell of to , , is
| (14) |
The heating rate can be evaluated as
| (15) |
The analytical estimation indicates that is approximately proportional to because are proportional is . One can also see that, when , obeys the inverse-square law.
References
- Wilczek (1978) F. Wilczek, Phys. Rev. Lett. 40, 279 (1978).
- Weinberg (1978) S. Weinberg, Phys. Rev. Lett. 40, 223 (1978).
- Svrcek and Witten (2006) P. Svrcek and E. Witten, J. High Energy Phys. 06, 051 (2006).
- Cicoli et al. (2012) M. Cicoli, M. Goodsell, and A. Ringwald, J. High Energy Phys. 2012, 146 (2012).
- Arvanitaki et al. (2010) A. Arvanitaki, S. Dimopoulos, S. Dubovsky, N. Kaloper, and J. March-Russell, Phys. Rev. D 81, 123530 (2010).
- Raffelt and Dearborn (1987) G. G. Raffelt and D. S. P. Dearborn, Phys. Rev. D 36, 2211 (1987).
- Ayala et al. (2014) A. Ayala, I. Domínguez, M. Giannotti, A. Mirizzi, and O. Straniero, Phys. Rev. Lett. 113, 191302 (2014).
- Carenza et al. (2020) P. Carenza, O. Straniero, B. Döbrich, M. Giannotti, G. Lucente, and A. Mirizzi, Phys. Lett. B 809, 135709 (2020).
- Lucente et al. (2022) G. Lucente, O. Straniero, P. Carenza, M. Giannotti, and A. Mirizzi, Phys. Rev. Lett. 129, 011101 (2022).
- Sung et al. (2019) A. Sung, H. Tu, and M.-R. Wu, Phys. Rev. D 99, 121305 (2019).
- Caputo et al. (2022a) A. Caputo, H.-T. Janka, G. Raffelt, and E. Vitagliano, Phys. Rev. Lett. 128, 221103 (2022a).
- Caputo et al. (2022b) A. Caputo, G. Raffelt, and E. Vitagliano, Phys. Rev. D 105, 035022 (2022b).
- Jaeckel et al. (2018a) J. Jaeckel, P. C. Malta, and J. Redondo, Phys. Rev. D 98, 055032 (2018a).
- Chupp et al. (1989) E. L. Chupp, W. T. Vestrand, and C. Reppin, Phys. Rev. Lett. 62, 505 (1989).
- Burrows et al. (1989) A. Burrows, M. S. Turner, and R. P. Brinkmann, Phys. Rev. D 39, 1020 (1989).
- Turner (1988) M. S. Turner, Phys. Rev. Lett. 60, 1797 (1988).
- Engel et al. (1990) J. Engel, D. Seckel, and A. C. Hayes, Phys. Rev. Lett. 65, 960 (1990).
- Giannotti et al. (2011) M. Giannotti, L. D. Duffy, and R. Nita, J. Cosmol. Astropart. Phys. 2011, 015 (2011).
- Payez et al. (2015) A. Payez, C. Evoli, T. Fischer, M. Giannotti, A. Mirizzi, and A. Ringwald, J. Cosmol. Astropart. Phys. 2015, 006 (2015).
- Diamond et al. (2023) M. Diamond, D. F. G. Fiorillo, G. Marques-Tavares, and E. Vitagliano, Phys. Rev. D 107, 103029 (2023).
- Müller et al. (2023) E. Müller, F. Calore, P. Carenza, C. Eckner, and M. C. D. Marsh, J. Cosmol. Astropart. Phys. 2023, 056 (2023).
- Hirata et al. (1987) K. Hirata, T. Kajita, M. Koshiba, M. Nakahata, Y. Oyama, N. Sato, A. Suzuki, M. Takita, Y. Totsuka, T. Kifune, T. Suda, K. Takahashi, T. Tanimori, K. Miyano, M. Yamada, E. W. Beier, L. R. Feldscher, S. B. Kim, A. K. Mann, F. M. Newcomer, R. Van, W. Zhang, and B. G. Cortez, Phys. Rev. Lett. 58, 1490 (1987).
- Bionta et al. (1987) R. M. Bionta, G. Blewitt, C. B. Bratton, D. Casper, A. Ciocio, R. Claus, B. Cortez, M. Crouch, S. T. Dye, S. Errede, G. W. Foster, W. Gajewski, K. S. Ganezer, M. Goldhaber, T. J. Haines, T. W. Jones, D. Kielczewska, W. R. Kropp, J. G. Learned, J. M. LoSecco, J. Matthews, R. Miller, M. S. Mudan, H. S. Park, L. R. Price, F. Reines, J. Schultz, S. Seidel, E. Shumard, D. Sinclair, H. W. Sobel, J. L. Stone, L. R. Sulak, R. Svoboda, G. Thornton, J. C. van der Velde, and C. Wuest, Phys. Rev. Lett. 58, 1494 (1987).
- Alekseev et al. (1987) E. N. Alekseev, L. N. Alekseeva, V. I. Volchenko, and I. V. Krivosheina, JETP Lett. 45, 589 (1987).
- Raffelt and Seckel (1988) G. Raffelt and D. Seckel, Phys. Rev. Lett. 60, 1793 (1988).
- Masso and Toldra (1995) E. Masso and R. Toldra, Phys. Rev. D 52, 1755 (1995).
- Lee (2018) J. S. Lee, (2018), arXiv:1808.10136 .
- Lucente et al. (2020) G. Lucente, P. Carenza, T. Fischer, M. Giannotti, and A. Mirizzi, J. Cosmol. Astropart. Phys. 2020, 008 (2020).
- Lella et al. (2024) A. Lella, P. Carenza, G. Co’, G. Lucente, M. Giannotti, A. Mirizzi, and T. Rauscher, Phys. Rev. D 109, 023001 (2024).
- Betranhandy and O’Connor (2022) A. Betranhandy and E. O’Connor, Phys. Rev. D 106, 063019 (2022).
- Fischer et al. (2016) T. Fischer, S. Chakraborty, M. Giannotti, A. Mirizzi, A. Payez, and A. Ringwald, Phys. Rev. D 94, 085012 (2016).
- Fischer et al. (2021) T. Fischer, P. Carenza, B. Fore, M. Giannotti, A. Mirizzi, and S. Reddy, Phys. Rev. D 104, 103012 (2021).
- Mori et al. (2022) K. Mori, T. Takiwaki, K. Kotake, and S. Horiuchi, Phys. Rev. D 105, 063009 (2022).
- Mori et al. (2023) K. Mori, T. Takiwaki, K. Kotake, and S. Horiuchi, Phys. Rev. D 108, 063027 (2023).
- Foguel and Fraga (2023) A. L. Foguel and E. S. Fraga, Astropart. Phys. 151, 102855 (2023).
- Martinez et al. (2022) L. Martinez, M. C. Bersten, J. P. Anderson, M. Hamuy, S. González-Gaitán, F. Förster, M. Orellana, M. Stritzinger, M. M. Phillips, C. P. Gutiérrez, C. Burns, C. Contreras, T. d. Jaeger, K. Ertini, G. Folatelli, L. Galbany, P. Hoeflich, E. Y. Hsiao, N. Morrell, P. J. Pessi, and N. B. Suntzeff, Astron. Astrophys. 660, A41 (2022).
- Sukhbold et al. (2016) T. Sukhbold, T. Ertl, S. E. Woosley, J. M. Brown, and H.-T. Janka, Astrophys. J. 821, 38 (2016).
- Müller et al. (2016) B. Müller, A. Heger, D. Liptai, and J. B. Cameron, Mon. Not. R. Astron. Soc. 460, 742 (2016).
- Ertl et al. (2016) T. Ertl, H.-T. Janka, S. E. Woosley, T. Sukhbold, and M. Ugliano, Astrophys. J. 818, 124 (2016).
- Boccioli et al. (2023) L. Boccioli, L. Roberti, M. Limongi, G. J. Mathews, and A. Chieffi, Astrophys. J. 949, 17 (2023).
- Di Lella et al. (2000) L. Di Lella, A. Pilaftsis, G. Raffelt, and K. Zioutas, Phys. Rev. D 62, 125011 (2000).
- Takiwaki et al. (2016) T. Takiwaki, K. Kotake, and Y. Suwa, Mon. Not. R. Astron. Soc. 461, L112 (2016).
- Liebendoerfer et al. (2009) M. Liebendoerfer, S. C. Whitehouse, and T. Fischer, Astrophys. J. 698, 1174 (2009).
- Kotake et al. (2018) K. Kotake, T. Takiwaki, T. Fischer, K. Nakamura, and G. Martínez-Pinedo, Astrophys. J. 853, 170 (2018).
- Marek et al. (2006) A. Marek, H. Dimmelmeier, H. T. Janka, E. Müller, and R. Buras, Astron. Astrophys. 445, 273 (2006).
- Woosley et al. (2002) S. E. Woosley, A. Heger, and T. A. Weaver, Rev. Mod. Phys. 74, 1015 (2002).
- Woosley and Heger (2007) S. E. Woosley and A. Heger, Phys. Rep. 442, 269 (2007).
- Smartt et al. (2009) S. J. Smartt, J. J. Eldridge, R. M. Crockett, and J. R. Maund, Mon. Not. R. Astron. Soc. 395, 1409 (2009).
- Smartt et al. (2004) S. J. Smartt, J. R. Maund, M. A. Hendry, C. A. Tout, G. F. Gilmore, S. Mattila, and C. R. Benn, Science 303, 499 (2004).
- Jaeckel et al. (2018b) J. Jaeckel, P. C. Malta, and J. Redondo, Phys. Rev. D 98, 055032 (2018b).
- NA64 Collaboration et al. (2020) NA64 Collaboration, D. Banerjee, J. Bernhard, V. Burtsev, A. Chumakov, D. Cooke, P. Crivelli, E. Depero, A. Dermenev, S. Donskov, R. Dusaev, T. Enik, N. Charitonidis, A. Feshchenko, V. Frolov, A. Gardikiotis, S. Gerassimov, S. Gninenko, M. Hösgen, M. Jeckel, V. Kachanov, A. Karneyeu, G. Kekelidze, B. Ketzer, D. Kirpichnikov, M. Kirsanov, V. Kolosov, I. Konorov, S. Kovalenko, V. Kramarenko, L. Kravchuk, N. Krasnikov, S. Kuleshov, V. Lyubovitskij, V. Lysan, V. Matveev, Y. Mikhailov, L. Molina Bueno, D. Peshekhonov, V. Polyakov, B. Radics, R. Rojas, A. Rubbia, V. Samoylenko, H. Sieber, D. Shchukin, V. Tikhomirov, I. Tlisova, D. Tlisov, A. Toropin, A. Trifonov, B. Vasilishin, G. Vasquez Arenas, P. Volkov, V. Volkov, and P. Ulloa, Phys. Rev. Lett. 125, 081801 (2020).
- Döbrich et al. (2020) B. Döbrich, J. Jaeckel, and T. Spadaro, J. High Energy Phys. 2020 (2020), 10.1007/jhep10(2020)046.
- Dolan et al. (2017) M. J. Dolan, T. Ferber, C. Hearty, F. Kahlhoefer, and K. Schmidt-Hoberg, J. High Energy Phys. 2017, 94 (2017).
- Diamond et al. (2024) M. Diamond, D. Fiorillo, G. Marques-Tavares, I. Tamborra, and E. Vitagliano, Phys. Rev. Lett. 132, 101004 (2024).
- Dev et al. (2024) P. S. B. Dev, J.-F. m. c. Fortin, S. P. Harris, K. Sinha, and Y. Zhang, Phys. Rev. Lett. 132, 101003 (2024).
- Fiorillo et al. (2025) D. F. G. Fiorillo, T. Pitik, and E. Vitagliano, (2025), arXiv:2503.13653 .
- Liebendörfer et al. (2001) M. Liebendörfer, A. Mezzacappa, F.-K. Thielemann, O. E. B. Messer, W. R. Hix, and S. W. Bruenn, Phys. Rev. D 63, 103004 (2001).
- O’Connor et al. (2018) E. O’Connor, R. Bollig, A. Burrows, S. Couch, T. Fischer, H.-T. Janka, K. Kotake, E. J. Lentz, M. Liebendörfer, O. E. B. Messer, A. Mezzacappa, T. Takiwaki, and D. Vartanyan, J. Phys. G Nucl. Phys. 45, 104001 (2018).
- Kitaura et al. (2006) F. S. Kitaura, H. T. Janka, and W. Hillebrandt, Astron. Astrophys. 450, 345 (2006).
- Fischer et al. (2010) T. Fischer, S. C. Whitehouse, A. Mezzacappa, F.-K. Thielemann, and M. Liebendörfer, Astron. Astrophys. 517, A80 (2010).
- Hüdepohl et al. (2010) L. Hüdepohl, B. Müller, H.-T. Janka, A. Marek, and G. G. Raffelt, Phys. Rev. Lett. 104, 251101 (2010).
- Betranhandy and O’Connor (2020) A. Betranhandy and E. O’Connor, Phys. Rev. D 102, 123015 (2020).
- Bar et al. (2020) N. Bar, K. Blum, and G. D’Amico, Phys. Rev. D 101, 123025 (2020).
- O’Connor and Ott (2011) E. O’Connor and C. D. Ott, Astrophys. J. 730, 70 (2011).
- Lattimer and Douglas Swesty (1991) J. M. Lattimer and F. Douglas Swesty, Nucl. Phys. A 535, 331 (1991).
- Miller et al. (2021) M. C. Miller, F. K. Lamb, A. J. Dittmann, S. Bogdanov, Z. Arzoumanian, K. C. Gendreau, S. Guillot, W. C. G. Ho, J. M. Lattimer, M. Loewenstein, S. M. Morsink, P. S. Ray, M. T. Wolff, C. L. Baker, T. Cazeau, S. Manthripragada, C. B. Markwardt, T. Okajima, S. Pollard, I. Cognard, H. T. Cromartie, E. Fonseca, L. Guillemot, M. Kerr, A. Parthasarathy, T. T. Pennucci, S. Ransom, and I. Stairs, Astrophys. J. Lett. 918, L28 (2021).
- Riley et al. (2021) T. E. Riley, A. L. Watts, P. S. Ray, S. Bogdanov, S. Guillot, S. M. Morsink, A. V. Bilous, Z. Arzoumanian, D. Choudhury, J. S. Deneva, K. C. Gendreau, A. K. Harding, W. C. G. Ho, J. M. Lattimer, M. Loewenstein, R. M. Ludlam, C. B. Markwardt, T. Okajima, C. Prescod-Weinstein, R. A. Remillard, M. T. Wolff, E. Fonseca, H. T. Cromartie, M. Kerr, T. T. Pennucci, A. Parthasarathy, S. Ransom, I. Stairs, L. Guillemot, and I. Cognard, Astrophys. J. Lett. 918, L27 (2021).
- Raaijmakers et al. (2021) G. Raaijmakers, S. K. Greif, K. Hebeler, T. Hinderer, S. Nissanke, A. Schwenk, T. E. Riley, A. L. Watts, J. M. Lattimer, and W. C. G. Ho, Astrophys. J. Lett. 918, L29 (2021).
- Typel et al. (2010) S. Typel, G. Röpke, T. Klähn, D. Blaschke, and H. H. Wolter, Phys. Rev. C 81, 015803 (2010).
- Steiner et al. (2013) A. W. Steiner, M. Hempel, and T. Fischer, Astrophys. J. 774, 17 (2013).
- Manzari et al. (2024) C. A. Manzari, Y. Park, B. R. Safdi, and I. Savoray, Phys. Rev. Lett. 133, 211002 (2024).
- Benabou et al. (2024) J. N. Benabou, C. A. Manzari, Y. Park, G. Prabhakar, B. R. Safdi, and I. Savoray, “Time-delayed gamma-ray signatures of heavy axions from core-collapse supernovae,” (2024), arXiv:2412.13247 .
- Brinkmann and Turner (1988) R. P. Brinkmann and M. S. Turner, Phys. Rev. D 38, 2338 (1988).
- Raffelt and Seckel (1995) G. Raffelt and D. Seckel, Phys. Rev. D 52, 1780 (1995).
- Carenza et al. (2019) P. Carenza, T. Fischer, M. Giannotti, G. Guo, G. Martínez-Pinedo, and A. Mirizzi, J. Cosmol. Astropart. Phys. 2019, 016 (2019).
- Carenza et al. (2021) P. Carenza, B. Fore, M. Giannotti, A. Mirizzi, and S. Reddy, Phys. Rev. Lett. 126, 071102 (2021).
- Janka (2012) H.-T. Janka, Annu. Rev. Nucl. Part. Sci. 62, 407 (2012).
- Kotake et al. (2012) K. Kotake, T. Takiwaki, Y. Suwa, W. Iwakami Nakano, S. Kawagoe, Y. Masada, and S.-i. Fujimoto, Adv. Astron. 2012, 428757 (2012).
- Burrows (2013) A. Burrows, Rev. Mod. Phys. 85, 245 (2013).
- Foglizzo et al. (2015) T. Foglizzo, R. Kazeroni, J. Guilet, F. Masset, M. González, B. K. Krueger, J. Novak, M. Oertel, J. Margueron, J. Faure, N. Martin, P. Blottiau, B. Peres, and G. Durand, Publ. Astron. Soc. Aust. 32, e009 (2015).
- Nordhaus et al. (2010) J. Nordhaus, A. Burrows, A. Almgren, and J. Bell, Astrophys. J. 720, 694 (2010).
- Hanke et al. (2012) F. Hanke, A. Marek, B. Müller, and H.-T. Janka, Astrophys. J. 755, 138 (2012).
- Dolence et al. (2013) J. C. Dolence, A. Burrows, J. W. Murphy, and J. Nordhaus, Astrophys. J. 765, 110 (2013).
- Takiwaki et al. (2014) T. Takiwaki, K. Kotake, and Y. Suwa, Astrophys. J. 786, 83 (2014).
- Nakamura et al. (2019) K. Nakamura, T. Takiwaki, and K. Kotake, Publ. Astron. Soc. Jpn. 71, 98 (2019).
- Nagakura et al. (2019) H. Nagakura, A. Burrows, D. Radice, and D. Vartanyan, Mon. Not. R. Astron. Soc. 490, 4622 (2019).
- Melson et al. (2020) T. Melson, D. Kresse, and H.-T. Janka, Astrophys. J. 891, 27 (2020).
- Foglizzo et al. (2007) T. Foglizzo, P. Galletti, L. Scheck, and H.-T. Janka, Astrophys. J. 654, 1006 (2007).
- Blondin et al. (2003) J. M. Blondin, A. Mezzacappa, and C. DeMarino, Astrophys. J. 584, 971 (2003).
- Nakamura et al. (2014) K. Nakamura, T. Kuroda, T. Takiwaki, and K. Kotake, The Astrophysical Journal 793, 45 (2014).
- Summa et al. (2018) A. Summa, H.-T. Janka, T. Melson, and A. Marek, Astrophys. J. 852, 28 (2018).