QuanAnts Machine: A Quantum Algorithm for Biomarker Discovery
Abstract
The discovery of biomarker sets for a targeted pathway is a challenging problem in biomedical medicine, which is computationally prohibited on classical algorithms due to the massive search space. Here, I present a quantum algorithm named QuantAnts Machine to address the task. The proposed algorithm is a quantum analog of the classical Ant Colony Optimization (ACO). We create the mixture of multi-domain from genetic networks by representation theory, enabling the search of biomarkers from the multi-modality of the human genome. Although the proposed model can be generalized, we investigate the RAS-mutational activation in this work. To the end, QuantAnts Machine discovers rarely-known biomarkers in clinical-associated domain for RAS-activation pathway, including COL5A1, COL5A2, CCT5, MTSS1 and NCAPD2. Besides, the model also suggests several therapeutic-targets such as JUP, CD9, CD34 and CD74.
1 Introduction
Cancer is a causality process. Specifically, given a patient with the genetic dataset , the mutation in a single biomarker could be caused by the activation of some other biomarkers, which can be presented as a causality model. In this paper, the biomarker is defined as: "A substance in the blood, bodily fluids, or tissues indicating a typical or atypical physiological process, state, or state ailment.[2]". We present the event that a gene witnesses a mutational event. Of note, mutations happen constantly[13]; hence, biomarkers attributed to a single target could vary. However, the underlying relationship among genes (still obscure up to this point) could leave the trait of evidence, with can be presented statistically. We define targets as biomarkers with empirical evidence that certainly leads to carcinogenesis. We will use the RAS-family (a group of oncogenes) for demonstrating the proposed algorithm.
We denote target as , in which and ; where is the event that the target got mutational activation; otherwise the biomarker-target stay wild-type. We use the term biomarker-target because a target can be a biomarker of other targets.
We define the biomarker set that activates the mutation on the target as ; set of the mother set . The complexity of finding this subset structure is challenging. Specifically, there are number of such subsets. Here, we highlight that each person will have characterized patterns for mutational alterations, which induce idiosyncratic biomarker sets. For all possibilities, we have the summation combination of
| (1) |
possibilities. Human genomes have approximately to genes which induce a massive search space of candidate biomarker sets for an biomarker identification algorithm, exponentially scaled with the number of input genes. Here, we would like to define the idiosyncratic-biomarker set of a given cohort as the biomarker-verse, as the number of possibilities is much larger than the number of atoms in one universe[21] (-).
This article introduces QuantAnts machine, a quantum algorithm for the discovery of a biomarker-verse associated with a given dataset , in which is the feature set; or genetic representations like DNA Methylation, RNA/miRNA expression, protein expressions. In other words, the outcome of our model is data-driven, which can be implemented in the next generation of quantum computers. Here, we will only introduce the quantum algorithm from the fundamentals of mathematical oncology. We organize the article as follows: Section 2 introduces the algorithm, QuantAnts machine for the identification of data-driven biomarker-verse. Section 3 reports the numerical results using three case studies associated with the running exemplary of the discussed targets. We will give several future directions to this work in Section 5 with clinical significance discussed in Section 3.3.
2 QuantAnts Machine
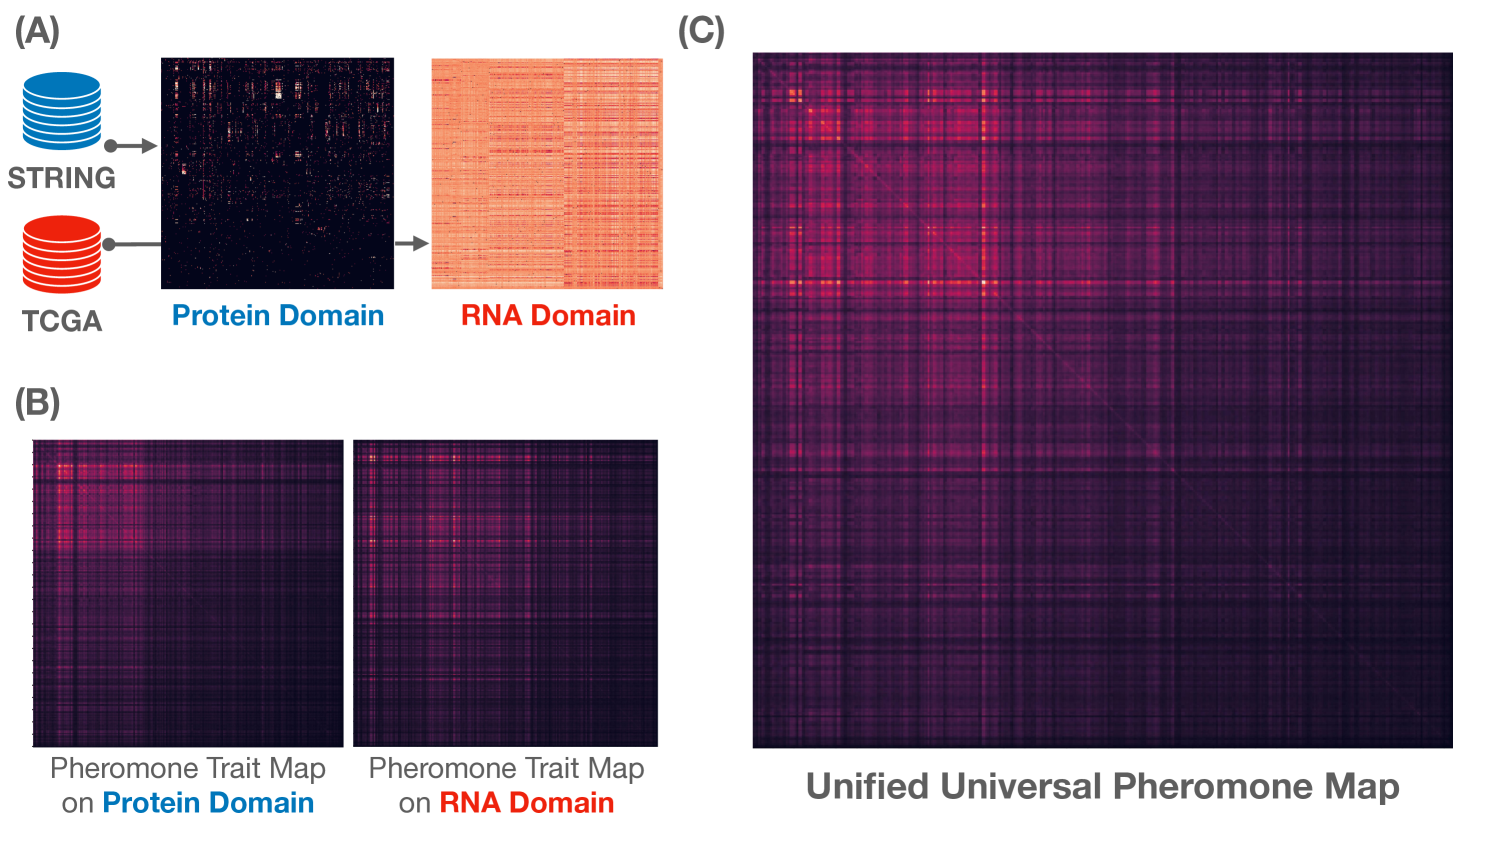
Given and are adjacency associated with two domain graphs and induced from input dataset . We will construct dual representations for the two given matrices in Figure 1(A).
- 1.
-
2.
as an interaction network computed from RNA expression by mRMR criteria (SuppMat B.1).
Definition 1
A representation of a group is a homomorphism with . We have as the endomorphism ring of (finite-dimensional) vector space , or a set of linear mapping from to .
Definition 2
We defined the mapping with direct sum (from Euler’s formula)
| (2) |
as Euler Representations[8]. The dual-generators for sub-representations is
| (3) |
We encode the domain information, i.e., and , by altering Euler Representations with spectral decomposition theorem. We have
| (4) |
where and are diagonal matrix of eigenvalues for and , respectively. Noted that both and are complex-valued matrix as and is asymmetric matrices; i.e., and .
We define the mapping
| (5) |
generating the dual representations:
| (6) |
We now have the initial transition maps containing information for both protein and RNA domains; i.e., and are presented into through their eigenvalue set.
Definition 3
We define quantum propagation from one state to other-state in a short time step as
| (7) |
with is either associated with or . We define a simple propagator (transformation from complex-valued to real-valued) as the
2.1 Algorithms
We introduce QuantAnts training procedure in Algorithm 1. Our algorithm has emergent properties: with some choice for , the quantum state after propagation processes can converge to the initial state within the loop. The quantum agents will finish discovering the dual domains at some point. There is some crucial observation surrounding Algorithm 1:
-
•
The proposed quantum propagation in (Definition 3) deviates the agent into a dual-agent system walking on two graphs and , represented by the corresponding and .
-
•
Thus, each element of the set and are consider the pheromone trait maps during the quantum walking process (unobservable). In other words, we cannot tell the exact adventure of the ant, but the pheromone trait maps can hint at which genes the ant visited with some intensity (probability).
-
•
By all means, this is a quantum phenomenon: we cannot tell the exact location of a sub-particle (the ant) but instead the probability of finding them in some interval of locations. The ant system is walking dependently on the dual regimes, as the domain information is tied (entangled) by representation Equation 6.
Input: and are adjacency maps for the protein interaction network and the RNA domain is propagating time.
-
create: ,
-
initiate
-
compute:
-
as in Equation 7)
-
-
-
-
for in {1, iters}:
-
compute:
-
, Spectral Decomposition()
-
, Spectral Decomposition()
-
( is eigenvector matrix, is diagonal matrix of eigenvalues)
-
-
update:
-
; (, ).
-
-
-
-
.append()
-
.append()
-
end if:
-
-
return: learned maps and .
Input: A k-ant system is initiated by {ant()} with each ant parameterized by , with is the smaller prime number between .
-
create: and
-
for :
-
, = QuantAnts()
-
.append()
-
.append()
-
-
return: universal maps and
The proposed algorithm can then be extended to a multi-agent system, i.e., starting with different ant-agent parameterized by troubled times. As discussed, each initial setting will result in completely different pheromone maps; thus, new connections from gene-to-gene can be found when multi-QuantAnts searching for biomarkers. We define the algorithm output as universal pheromone maps (UPM) and , with
| (8) |
Within the scope of this work, we consider simple mean-pooling over the pheromone maps given as
| (9) |
with is the number of discovered pheromone maps by the quantum -ant system. We use the SoftMax function to normalize the simulated states at each iteration so that presenting saturated distributions.
We specifically choose the basis set generated by prime numbers: the nominator is scalar , while the denominator is the least prime number between . This selection makes the exponential terms in our dual-generators (Equation 5) become
| (10) |
The selection of from the prime basis provides good ansatzes for (guessed) for domain propagation that makes asymmetric domain to a more symmetric domain; i.e., with making asymmetric domain (Figure 1) to the symmetric domain (Definition 2).
| Discovered Biomarkers (Post-Selection) | Catergory |
| COL5A2∗, COL5A1∗, COL7A1, COL6A3, | Collagen chains |
| COL1A2, COL1A1, COL3A2. | |
| CD9, CD34, CD74. | Immuno-therapeutic antigens |
| MYBL2, MTSS1∗, LRP2, EGR1, GABARAP, | Other notable cancer-related genes |
| HSP90AA1, HSP90AB1, JUP, IGF2, MCM3, | |
| MCM4, MMP14, MCM2, MCM4, MSH6, CCT5∗, NCAPD2∗ |
3 Results
3.1 Case-study
3.1.1 RAS-activation Pathway
The Ras/Raf/MAPK pathway is a signal transduction pathway that is extensively studied in the field of cell biology[12]. Its main role is to convey signals from outside the cell to the cell nucleus, where specific genes are activated to promote cell growth, division, and differentiation. Additionally, this pathway is crucial in regulating the cell cycle, promoting wound healing and tissue repair, and enabling integrin signaling and cell migration[26, 5, 14]. Notably, it also can induce angiogenesis, which involves the formation of new blood vessels, by regulating the expression of genes involved in this process. Overall, the Ras/Raf/MAPK pathway controls various cellular functions that are significant in the development of tumors. In this work, we concern three biomarkers for the RAS-family, including NRAS, HRAS, and KRAS. We define the mutation activation of the RAS-family as when at least one of the three RAS-associated targets got mutations.
3.1.2 Datasets
We use The Cancer Genome Atlas (TCGA[31]) for RNA expression data and the STRING[28] database for interaction network. The dataset includes samples, with input genes. We pre-select the top gene with high variation in its expressions. Although the number of evaluated genes is relatively smaller than the whole genome, the search space induced by this evaluated set is huge, equals . However, the proposed algorithm is a generalized model that can be applied to any input gene set. Hence, the scalability and robustness of larger databases are worth investigating in further research. The generation of the mRMR-based graph is given in Appendix B.1.
3.1.3 Environmental Settings
Our proposed algorithm is a cost-efficient computational approach. All experiments used Python , numpy , sci-kit-learn , and PyTorch on an Intel i9 processor (2.3 GHz, eight cores), 16GB DDR4 memory and GeForce GTX Mobile GPU with 6GB memory. The full technical report is in Appendix B.
3.2 Discovered Biomarkers
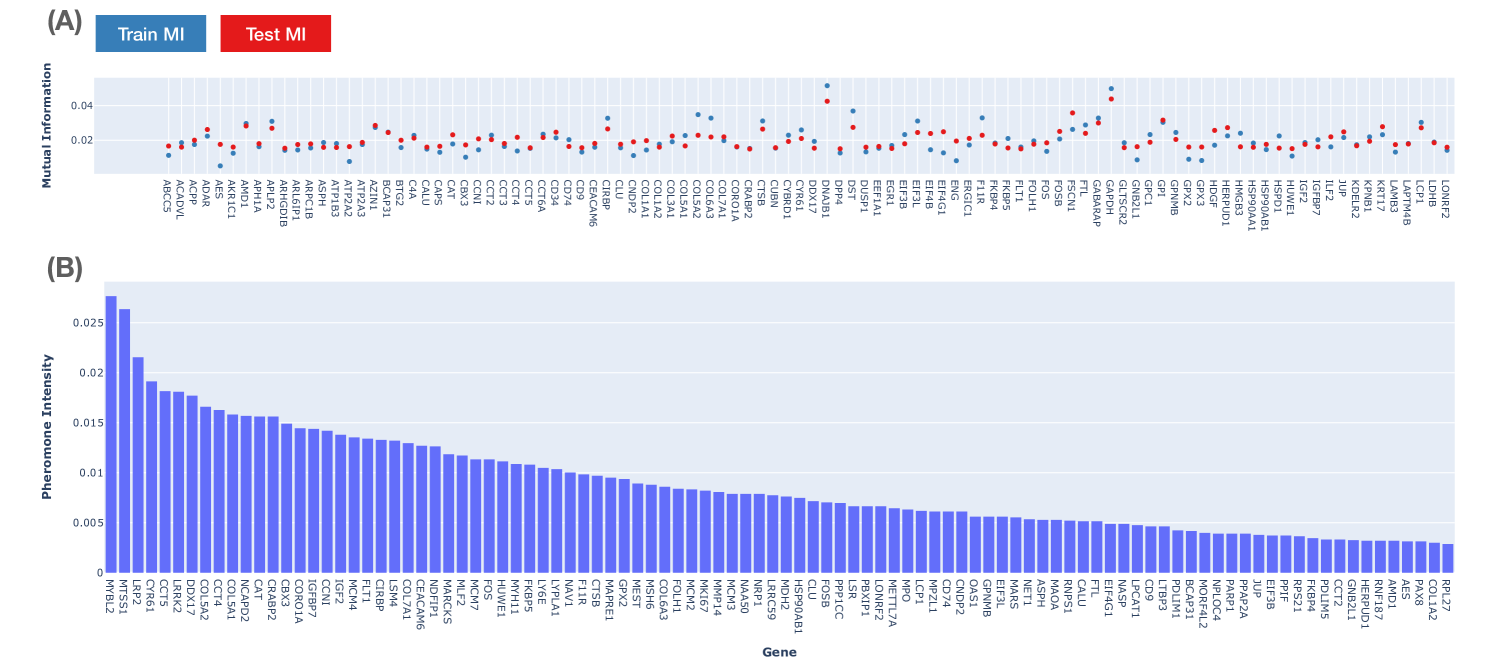
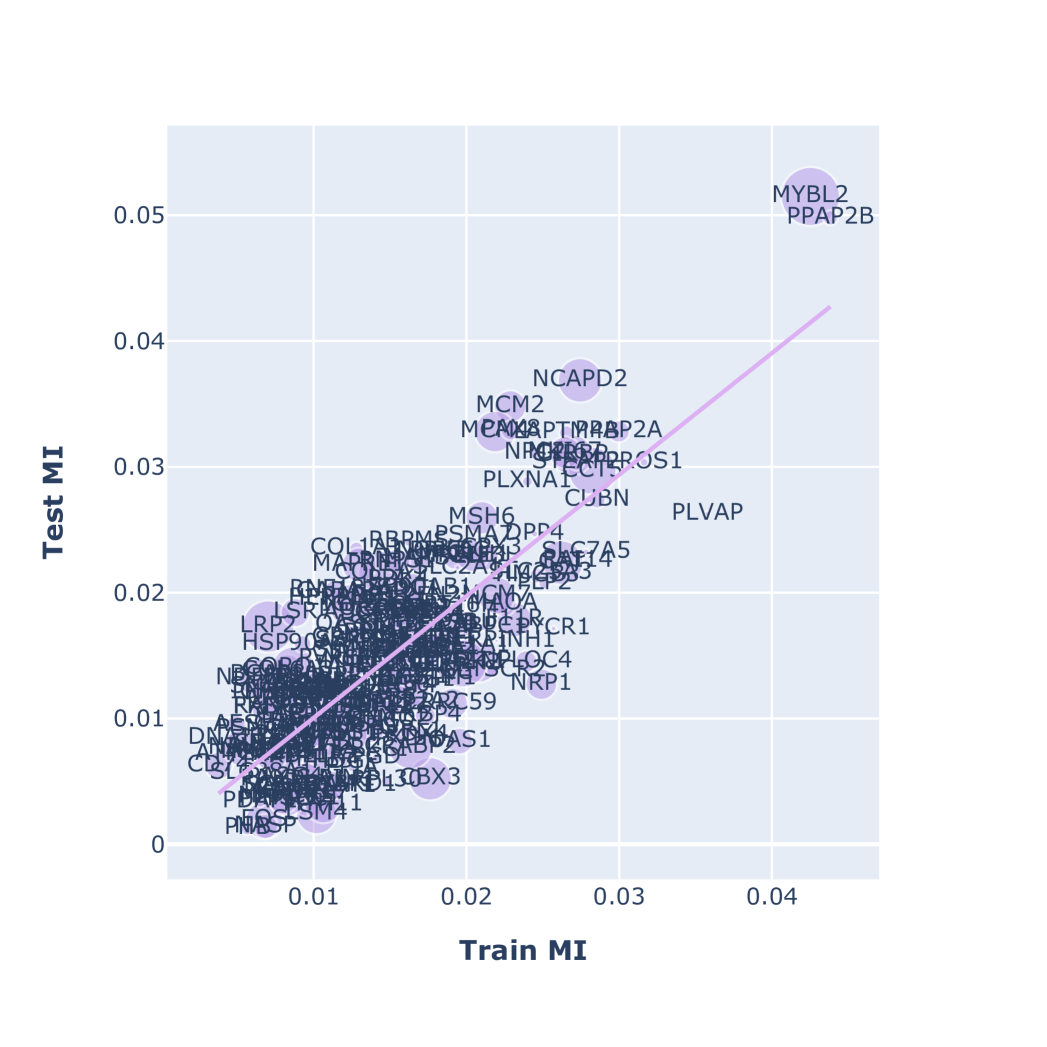
We summarize the biomarker-verses found for targeting the RAS-family in Figure 2. We performed 10-Fold cross-validation to evaluate the relevancy of sampled biomarker sets toward a given target (Figure 2(A)). The ratio of train/test sets is with no overlapped patients. The database used in this numerical result is given in SuppMat-S1. The train MI and test MI is positively correlated with -squared of in RAS-associated targets (SuppFig 4). We associate the pheromone intensity with biomarker score, which is discussed in Appendix A and summarized in Figure 2(B). The top three biomarkers of the RAS-family targets proposed by QuantAnts Machines is MYBL2, MTSS1 and LRP2. We post-select the markers by two criteria: (1) high phenomenon intensity and (2) high relevancy score to the target. As a result, our study suggests notable biomarkers grouped in three categories, which is summarized in Table 1.
3.3 Clinical Significance
3.3.1 Validation through Literature Mining
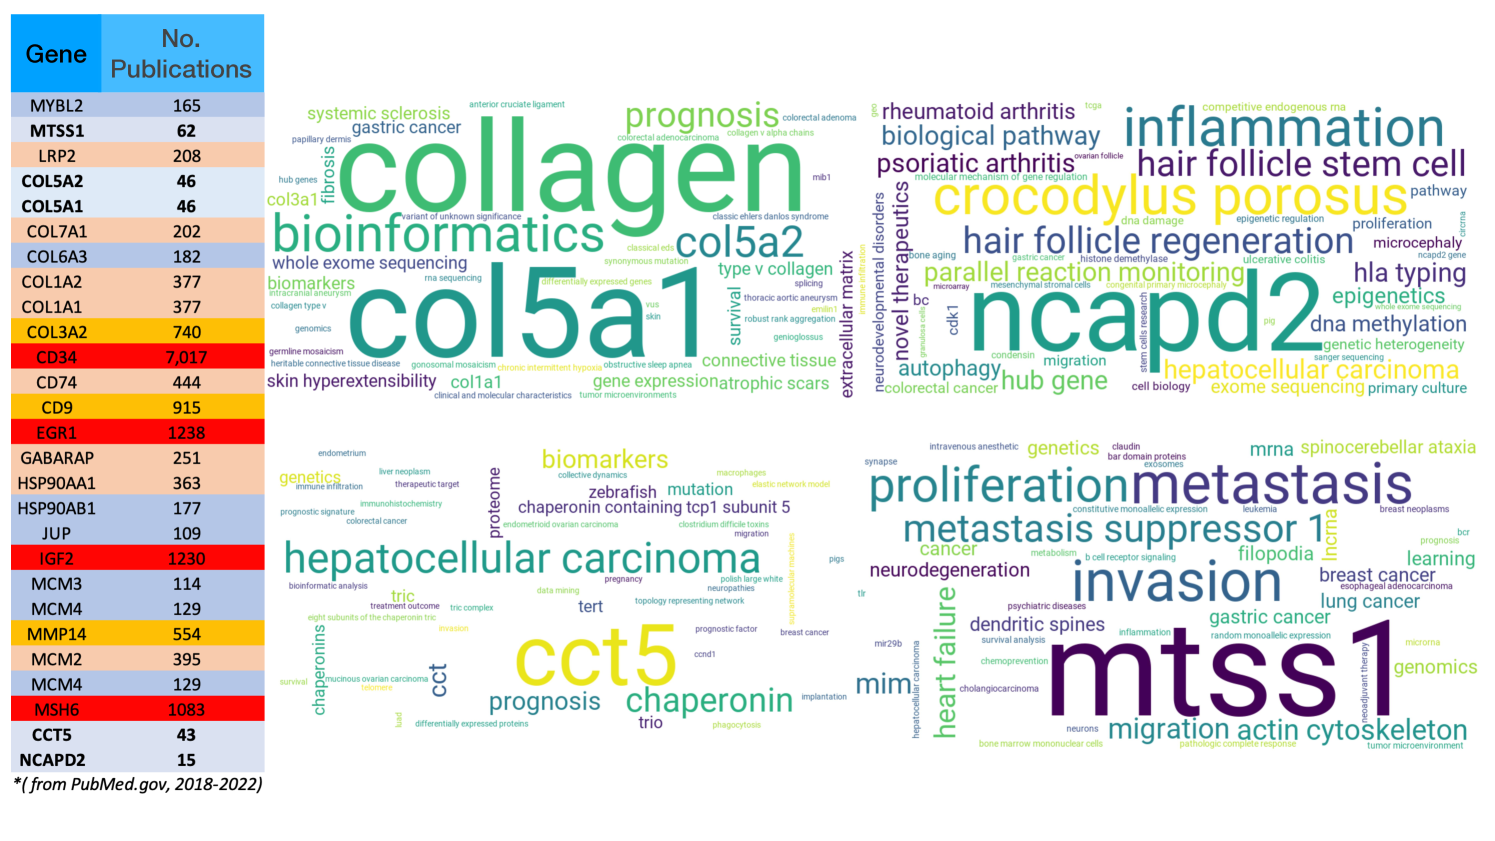
One of the main challenges in the biomarker discovery task is validating the clinical significance of the found biomarkers. Here, we perform a comprehensive literature mining of the discovered biomarker verse. Specifically, we analyze the abstract of publications from PubMed.gov regarding notable markers proposed from our algorithm from 2018 to 2022 (the collections is up to 12/06/2022). The keywords for such protocol are given as "Found Biomarkers" and "RAS." The literature mining offers a comprehensive view of the development of biomarker discovery tasks. We highlight five newly discovered drivers for RAS-family that suggested by QuanAnts Machine, including MTSS1, COL5A1, COL5A2, CCT5 and NCAPD2 with less than associated publications. We summarize the newly discovered biomarkers’ biological meanings and related pathways in Table 2.
3.3.2 Translation of Algorithm to Potential Therapeutic Targets
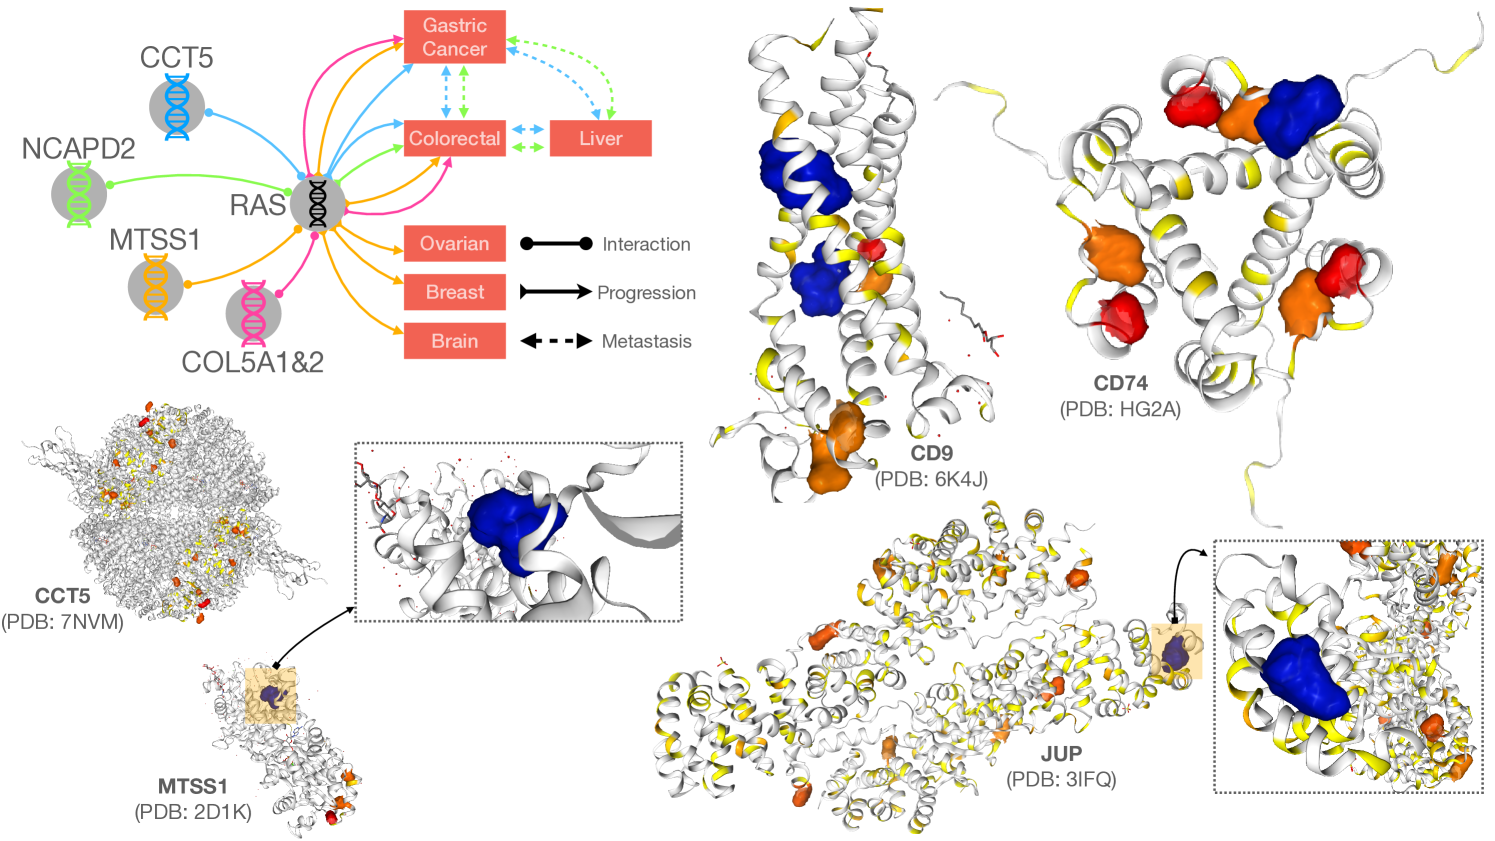
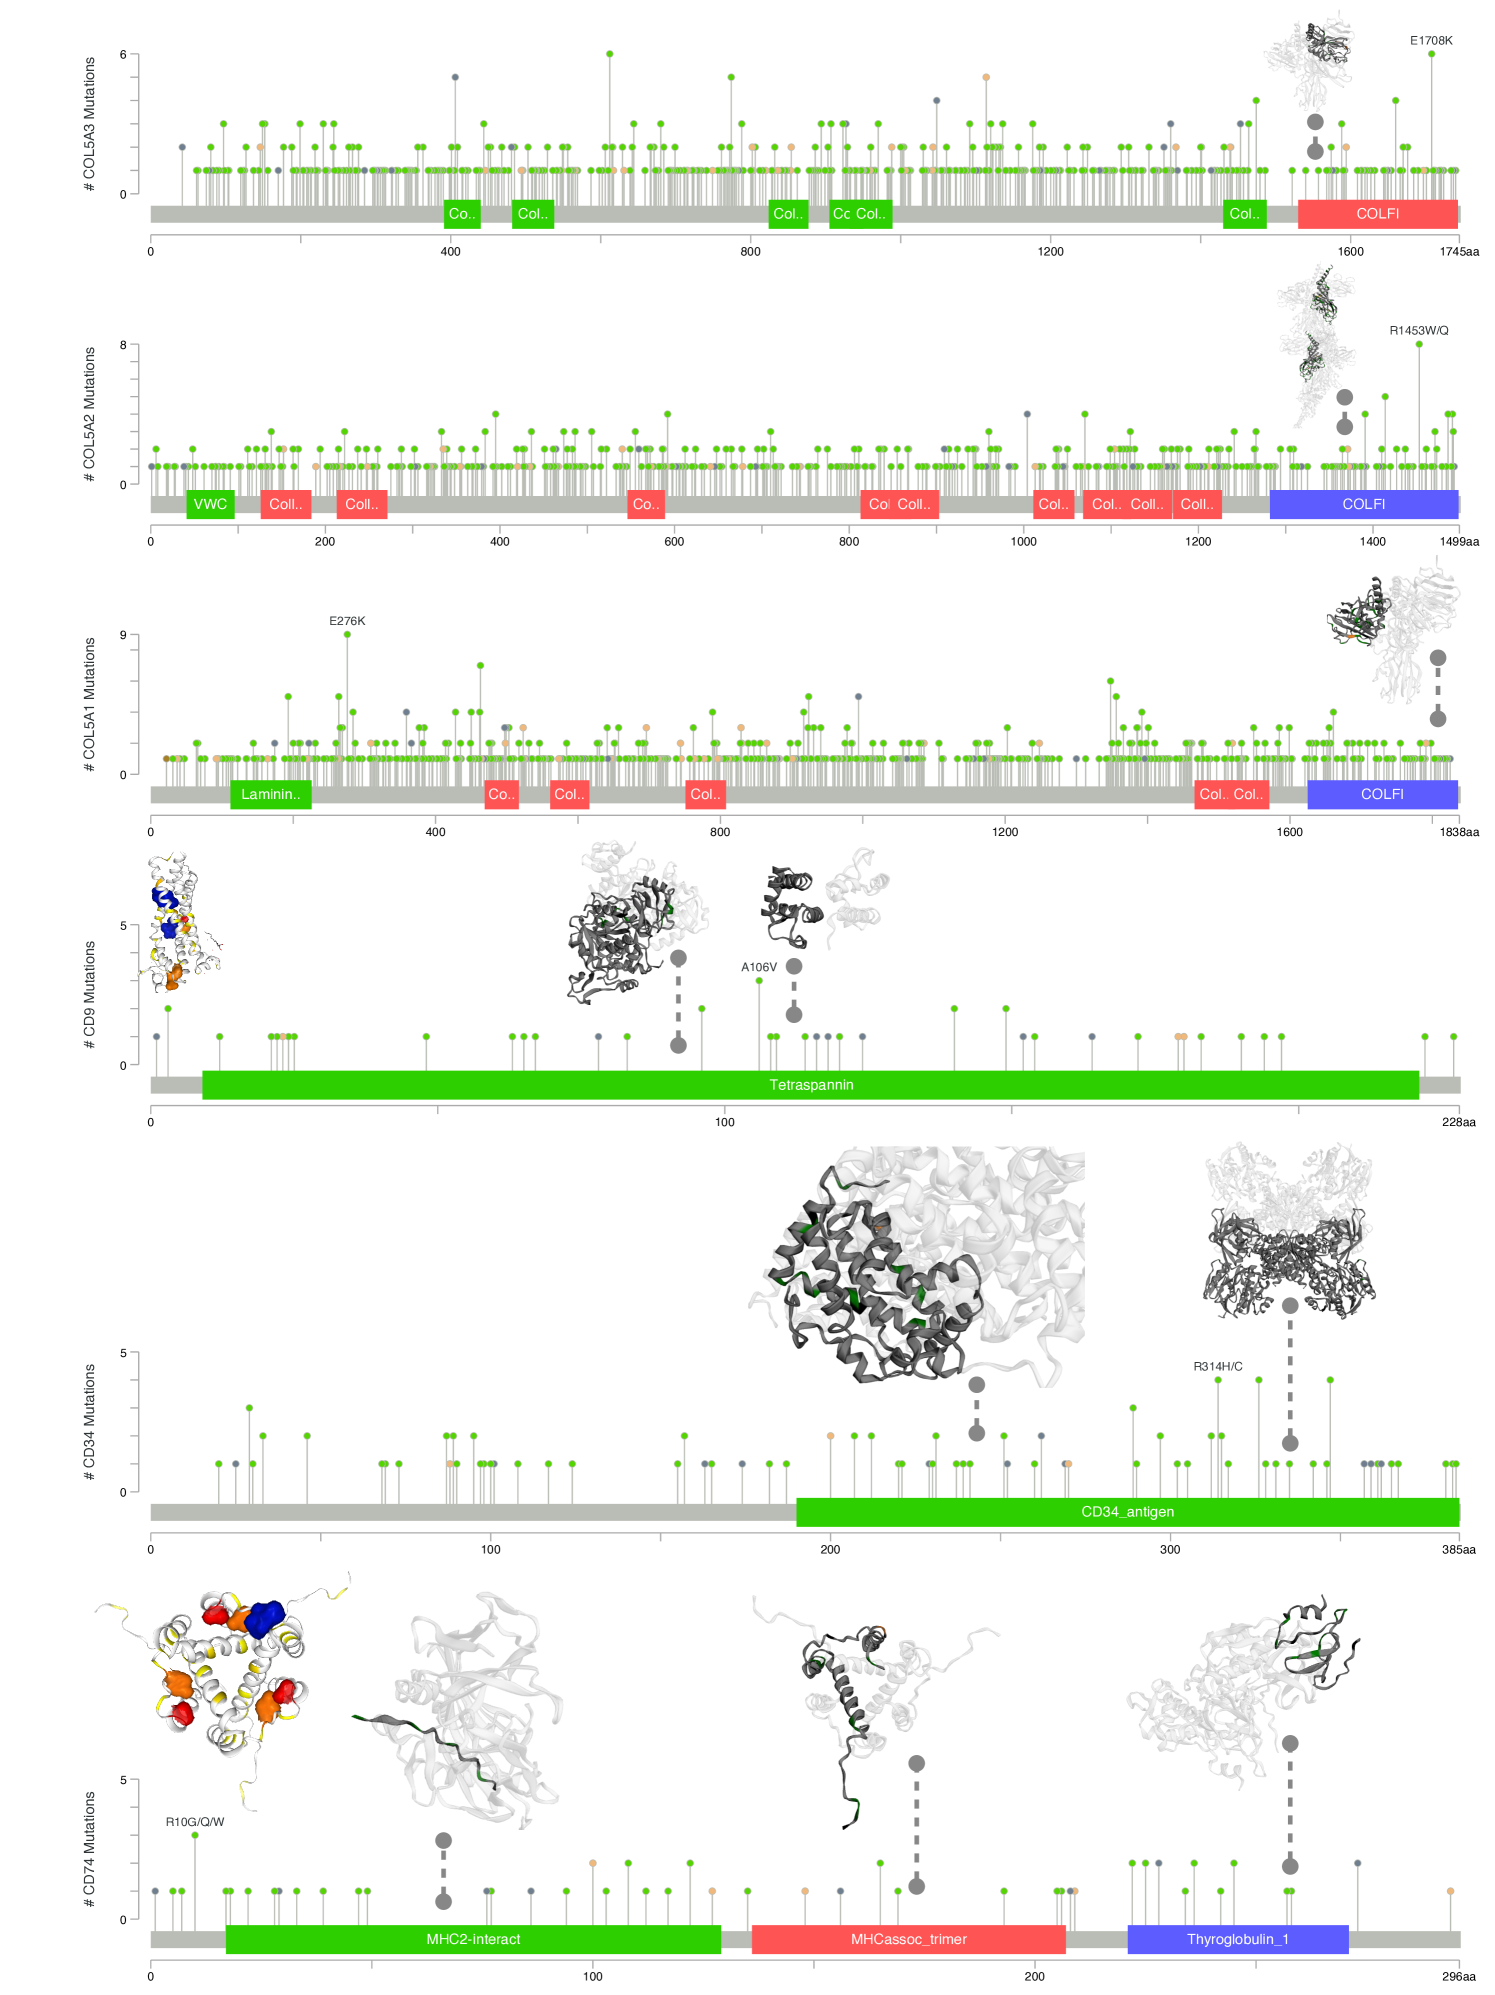
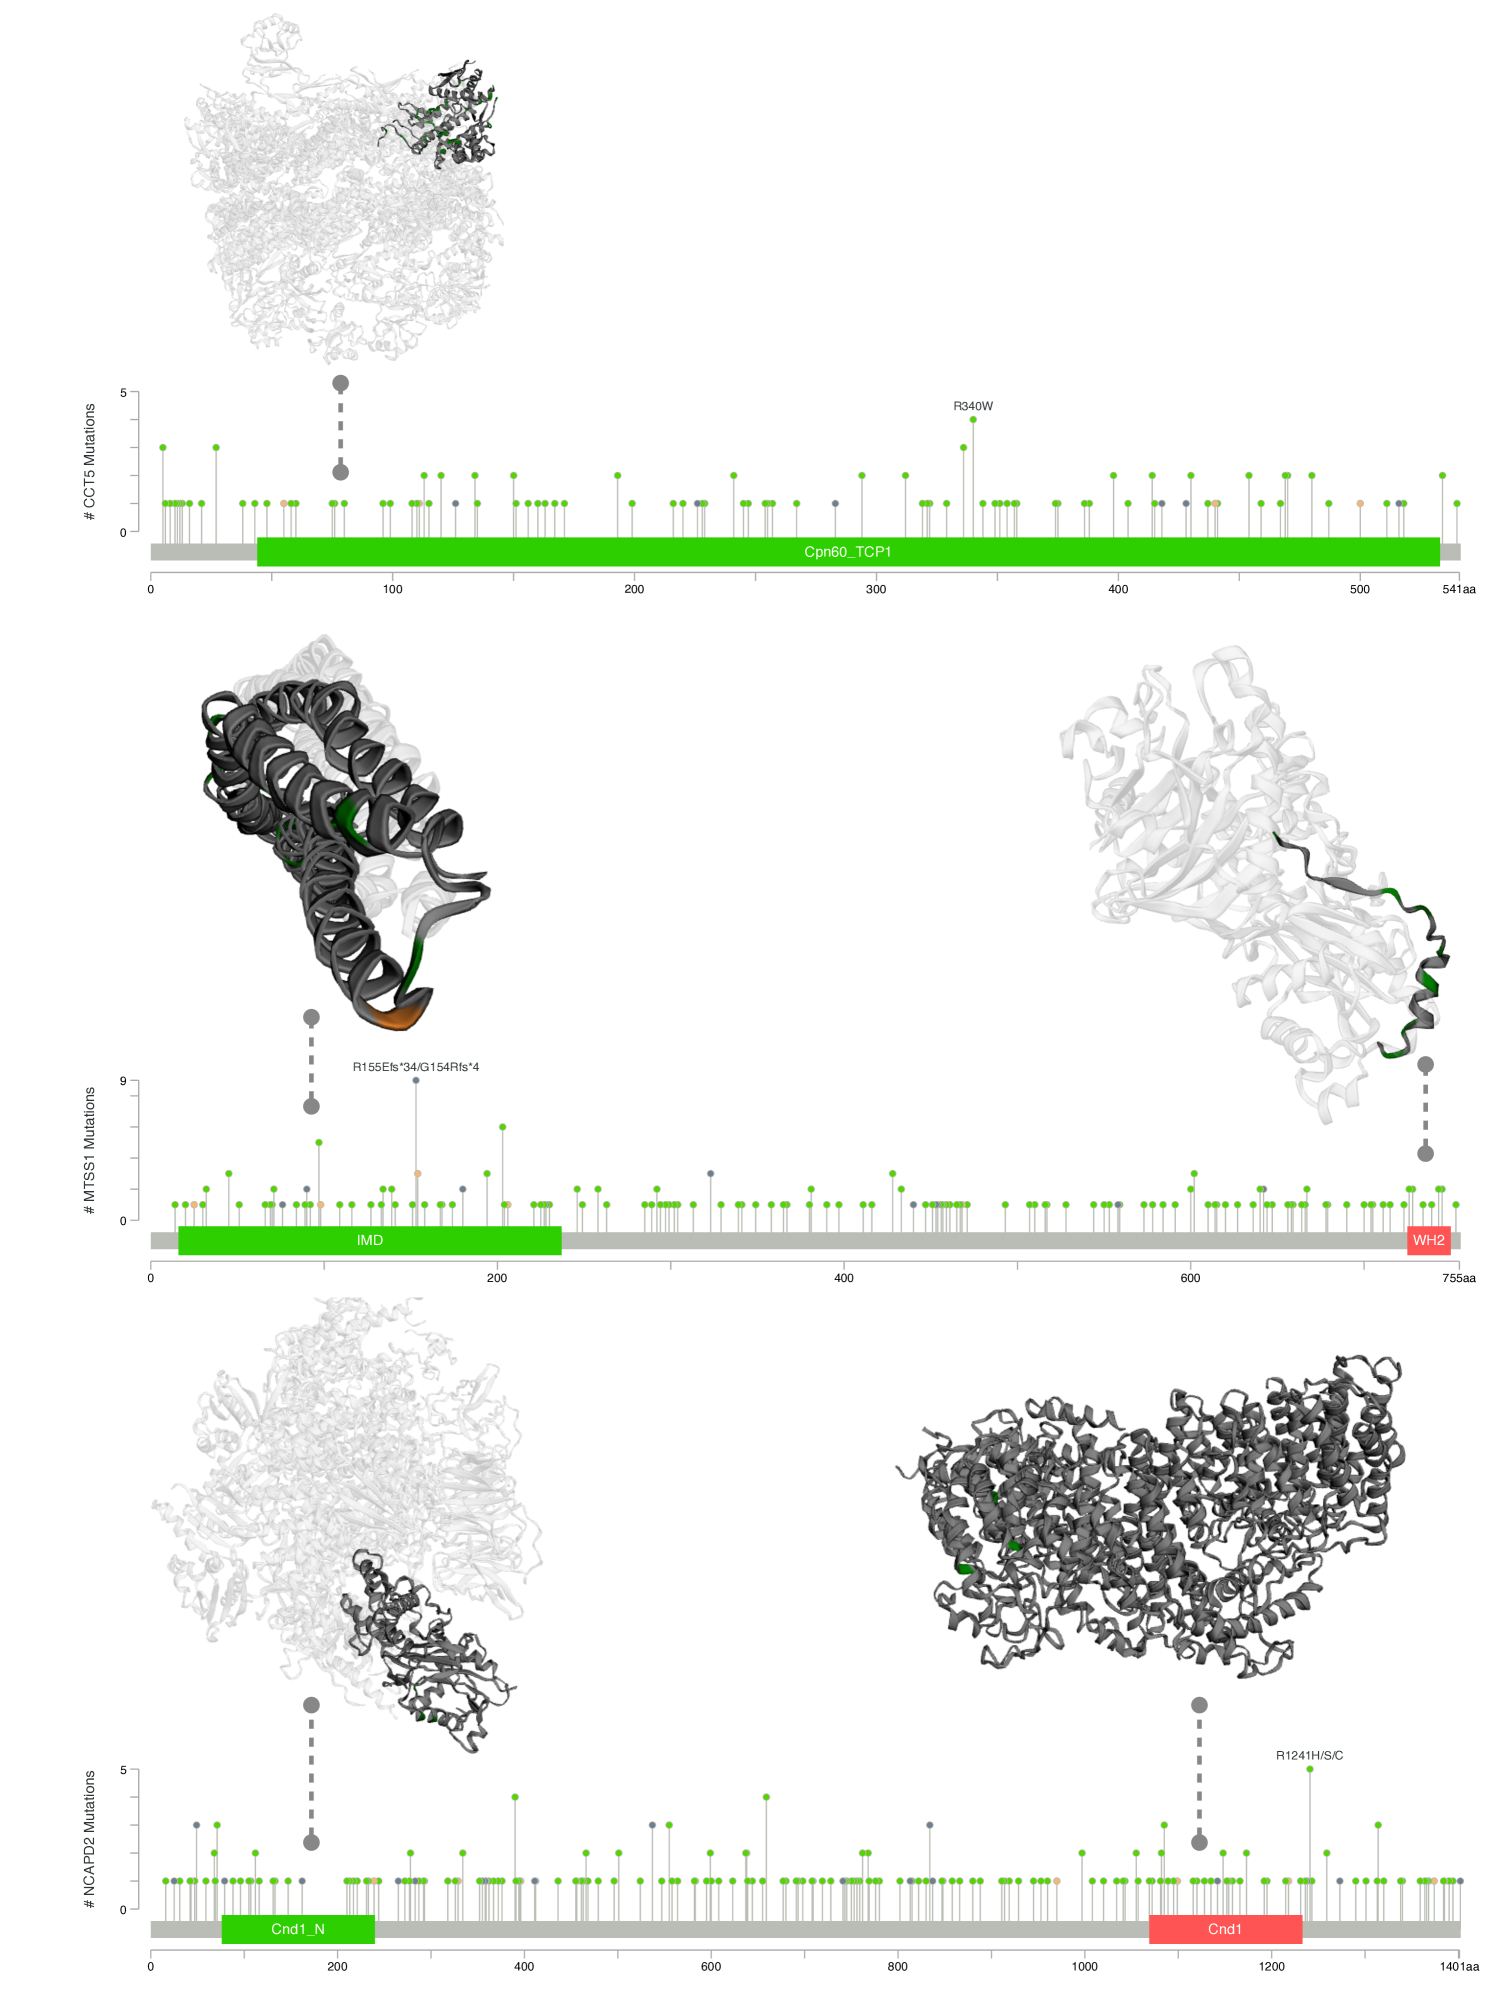
We translate the clinical findings toward potential therapeutic targets for cancer treatments. We use COSMIC[29] database to identify potential binding sites over the discovered biomarkers. Figure 3 shows the analysis on three group of biomarkers reported in Table 1 and 2. The interactions between biomarkers and cancer phenotypes have been summarized to demonstrate the causal relationship between disease progression and metastasis. By utilizing data from the protein data bank (PDB[3]), potential pocket sites for each target marker have been identified. Two pocket sites have been discovered on the large molecular MTSS1 and JUP, while two binding sites have been predicted in CD9 and one site in CD74. A comprehensive report using projects[16, 1, 32, 4, 24, 25, 11, 15, 23, 33] from cBioPortal[6] on the structural information with mutational profiles of the complex COL5A1,2,3 and CD9-CD34-CD74 is given in Figure 6; and that of CCT5, MTSS1 and NCAPD2 is given in Figure 7.
In Figure 6, CD9 has a common mutation at A106V, which involves two small sub-structures, while CD34 has a hot spot mutation at R314H/C, which is a large complex of antigen. In COL5A2 and COL5A3, we found two regions with high mutation rates in the COLFI (Fibrillar collagen C-terminal domain). In contrast, COL5A1’s hot spot mutation is at E267K near the laminin G-like domain. This complex is located in the extracellular matrix glycoproteins laminin, which binds to heparin and the cell surface receptor -dystroglycan.
In Figure 7, we identified three potential sites with high mutation rates, such as the sub-unit CND1 of NCAPD2, which tends to be mutated in both ends, with more mutations recorded at the R1241H/S/C end. Another potential target is the WH2 domain of MTSS1, a 35 residue actin monomer-binding motif that plays a central role in many cell biological processes. We also found sites with high mutations recorded in drosophila immune deficiency (IDM) of MTSS1, but the binding configurations were not provided in these databases[3]. We recommend studying these potential targets in the future.
4 Discussion
4.1 QuantAnts Machine is A Machine Learning Algorithm
The input data of QuantAnts machine is the two network domains, and the output is the pheromone trait maps associated with the G-Score of evaluated biomarker sets. Thus, the model outcome is data-driven; thus, QuantAnts machine is a Machine Learning algorithm. The proposed model is generalized; however, the algorithm’s scalability by several input genes should be addressed in further studies.
4.2 QuantAnts Machine is A Quantum Algorithm
The core of QuantAnts Machine algorithm is the defined representations in Definition 2. Of note, this representation is equivalent to unitary transformations in quantum computing. Specifically, we have the equivalent class of representations[27]
| (11) |
where is the conventional Ry-rotation of gate-based quantum computers[18, 19].
5 Conclusion
To this end, I have introduced QuantAnts machine - a quantum algorithm for biomarker discovery in Section 2. Two algorithms to run single and multi-ant systems are introduced in Algorithm 1 and 2. The numerical results address the emergent RAS-family target, which is accounted for many cancer types. QuantAnts elucidates biomarkers that are rarely known by clinical literature, comprehensively reported in Table 1 and 2. Finally, the study concluded by the translation of model outcome to potential therapeutics, which is summarized in Figure 3, SuppFig 6 and 7.
References
- [1] Pan-cancer analysis of whole genomes. Nature, 578(7793):82–93, 2020.
- [2] Biomarker. https://www.cancer.gov/publications/dictionaries/cancer-terms/def/biomarker, n.d. Accessed: May 10, 2023.
- [3] H. M. Berman, T. Battistuz, T. N. Bhat, W. F. Bluhm, P. E. Bourne, K. Burkhardt, Z. Feng, G. L. Gilliland, L. Iype, S. Jain, et al. The protein data bank. Acta Crystallographica Section D: Biological Crystallography, 58(6):899–907, 2002.
- [4] K. L. Bolton, R. N. Ptashkin, T. Gao, L. Braunstein, S. M. Devlin, D. Kelly, M. Patel, A. Berthon, A. Syed, M. Yabe, et al. Cancer therapy shapes the fitness landscape of clonal hematopoiesis. Nature genetics, 52(11):1219–1226, 2020.
- [5] J. Boonstra, P. Rijken, B. Humbel, F. Cremers, A. Verkleij, and P. v. B. en Henegouwen. The epidermal growth factor. Cell biology international, 19(5):413–430, 1995.
- [6] E. Cerami, J. Gao, U. Dogrusoz, B. E. Gross, S. O. Sumer, B. A. Aksoy, A. Jacobsen, C. J. Byrne, M. L. Heuer, E. Larsson, et al. The cbio cancer genomics portal: an open platform for exploring multidimensional cancer genomics data. Cancer discovery, 2(5):401–404, 2012.
- [7] M. Dorigo, M. Birattari, and T. Stutzle. Ant colony optimization. IEEE computational intelligence magazine, 1(4):28–39, 2006.
- [8] W. Feit. The representation theory of finite groups. Elsevier, 1982.
- [9] . N. B.-A. Giovanni Spitale. Topictracker: a python pipeline to search, download and explore pubmed entries (version 1.2.0). zenodo. 2021.
- [10] M. Griffith, N. C. Spies, K. Krysiak, J. F. McMichael, A. C. Coffman, A. M. Danos, B. J. Ainscough, C. A. Ramirez, D. T. Rieke, L. Kujan, et al. Civic is a community knowledgebase for expert crowdsourcing the clinical interpretation of variants in cancer. Nature genetics, 49(2):170–174, 2017.
- [11] D. M. Hyman, S. A. Piha-Paul, H. Won, J. Rodon, C. Saura, G. I. Shapiro, D. Juric, D. I. Quinn, V. Moreno, B. Doger, et al. Her kinase inhibition in patients with her2-and her3-mutant cancers. Nature, 554(7691):189–194, 2018.
- [12] T. A. Knijnenburg, L. Wang, M. T. Zimmermann, N. Chambwe, G. F. Gao, A. D. Cherniack, H. Fan, H. Shen, G. P. Way, C. S. Greene, et al. Genomic and molecular landscape of dna damage repair deficiency across the cancer genome atlas. Cell reports, 23(1):239–254, 2018.
- [13] R. C. Lewontin. Population genetics. Annual review of genetics, 19(1):81–102, 1985.
- [14] C. Longhurst and L. Jennings. Integrin-mediated signal transduction. Cellular and Molecular Life Sciences CMLS, 54:514–526, 1998.
- [15] D. Miao, C. A. Margolis, N. I. Vokes, D. Liu, A. Taylor-Weiner, S. M. Wankowicz, D. Adeegbe, D. Keliher, B. Schilling, A. Tracy, et al. Genomic correlates of response to immune checkpoint blockade in microsatellite-stable solid tumors. Nature genetics, 50(9):1271–1281, 2018.
- [16] B. Nguyen, C. Fong, A. Luthra, S. A. Smith, R. G. DiNatale, S. Nandakumar, H. Walch, W. K. Chatila, R. Madupuri, R. Kundra, et al. Genomic characterization of metastatic patterns from prospective clinical sequencing of 25,000 patients. Cell, 185(3):563–575, 2022.
- [17] N. Nguyen. Quantants machines discover biomarkers for ras signaling activation and design sgrnas for crispr to target complex cd9, cd34, and cd74. 2022.
- [18] N. Nguyen and K.-C. Chen. Bayesian quantum neural networks. IEEE Access, 2022.
- [19] N. Nguyen and K.-C. Chen. Quantum embedding search for quantum machine learning. IEEE Access, 10:41444–41456, 2022.
- [20] X. V. Nguyen, J. Chan, S. Romano, and J. Bailey. Effective global approaches for mutual information based feature selection. In Proceedings of the 20th ACM SIGKDD international conference on Knowledge discovery and data mining, pages 512–521, 2014.
- [21] M. A. Nielsen and I. Chuang. Quantum computation and quantum information, 2002.
- [22] H. Peng, F. Long, and C. Ding. Feature selection based on mutual information criteria of max-dependency, max-relevance, and min-redundancy. IEEE Transactions on pattern analysis and machine intelligence, 27(8):1226–1238, 2005.
- [23] D. R. Robinson, Y.-M. Wu, R. J. Lonigro, P. Vats, E. Cobain, J. Everett, X. Cao, E. Rabban, C. Kumar-Sinha, V. Raymond, et al. Integrative clinical genomics of metastatic cancer. Nature, 548(7667):297–303, 2017.
- [24] E. Y. Rosen, D. A. Goldman, J. F. Hechtman, R. Benayed, A. M. Schram, E. Cocco, S. Shifman, Y. Gong, R. Kundra, J. P. Solomon, et al. Trk fusions are enriched in cancers with uncommon histologies and the absence of canonical driver mutationslandscape and outcome of trk fusion–positive cancers. Clinical Cancer Research, 26(7):1624–1632, 2020.
- [25] R. M. Samstein, C.-H. Lee, A. N. Shoushtari, M. D. Hellmann, R. Shen, Y. Y. Janjigian, D. A. Barron, A. Zehir, E. J. Jordan, A. Omuro, et al. Tumor mutational load predicts survival after immunotherapy across multiple cancer types. Nature genetics, 51(2):202–206, 2019.
- [26] D. W. Stacey. Cyclin d1 serves as a cell cycle regulatory switch in actively proliferating cells. Current opinion in cell biology, 15(2):158–163, 2003.
- [27] B. Steinberg. Representation theory of finite groups: an introductory approach. Springer, 2012.
- [28] D. Szklarczyk, A. L. Gable, D. Lyon, A. Junge, S. Wyder, J. Huerta-Cepas, M. Simonovic, N. T. Doncheva, J. H. Morris, P. Bork, et al. String v11: protein–protein association networks with increased coverage, supporting functional discovery in genome-wide experimental datasets. Nucleic acids research, 47(D1):D607–D613, 2019.
- [29] J. G. Tate, S. Bamford, H. C. Jubb, Z. Sondka, D. M. Beare, N. Bindal, H. Boutselakis, C. G. Cole, C. Creatore, E. Dawson, et al. Cosmic: the catalogue of somatic mutations in cancer. Nucleic acids research, 47(D1):D941–D947, 2019.
- [30] G. P. Way, F. Sanchez-Vega, K. La, J. Armenia, W. K. Chatila, A. Luna, C. Sander, A. D. Cherniack, M. Mina, G. Ciriello, et al. Machine learning detects pan-cancer ras pathway activation in the cancer genome atlas. Cell reports, 23(1):172–180, 2018.
- [31] J. N. Weinstein, E. A. Collisson, G. B. Mills, K. R. Shaw, B. A. Ozenberger, K. Ellrott, I. Shmulevich, C. Sander, and J. M. Stuart. The cancer genome atlas pan-cancer analysis project. Nature genetics, 45(10):1113–1120, 2013.
- [32] L. Wu, H. Yao, H. Chen, A. Wang, K. Guo, W. Gou, Y. Yu, X. Li, M. Yao, S. Yuan, et al. Landscape of somatic alterations in large-scale solid tumors from an asian population. Nature communications, 13(1):1–11, 2022.
- [33] A. Zehir, R. Benayed, R. H. Shah, A. Syed, S. Middha, H. R. Kim, P. Srinivasan, J. Gao, D. Chakravarty, S. M. Devlin, et al. Mutational landscape of metastatic cancer revealed from prospective clinical sequencing of 10,000 patients. Nature medicine, 23(6):703–713, 2017.
| Gene symbol | Gene name | Description | Pathways |
| CCT5 | T-complex protein one subunit epsilon | Molecular chaperone that is a chaperonin with TCP1 complex (CCT), also known as the TCP1 ring complex (TRiC) | Organelle biogenesis and maintenance, Prefoldin mediated transfer of substrate to CCT/TriC, Cooperation of Prefoldin and TriC/CCT in actin and tubulin folding, Formation of tubulin folding intermediates by CCT/TriC, Folding of actin by CCT/TriC, Chaperonin-mediated protein folding, Association of TriC/CCT with target proteins during biosynthesis, Protein folding, Metabolism of proteins, Assembly of the primary cilium, Cargo trafficking to the periciliary membrane, BBSome-mediated cargo-targeting to the cilium |
| COL5A1 | Collagen alpha-1(V) chain | Minor connective tissue component of nearly ubiquitous distribution | Integrins in angiogenesis, Validated transcriptional targets of deltaNp63 isoforms, Beta1 integrin cell surface interactions, Syndecan-1-mediated signaling events, Extracellular matrix organization, Collagen formation, collagen biosynthesis, and modifying enzymes, Allograft rejection, miRNA targets in ECM and membrane receptors, Focal Adhesion, PI3K-Akt signaling pathway |
| COL5A2 | Collagen alpha-2(V) chain | Minor connective tissue component of nearly ubiquitous distribution | Integrins in angiogenesis, Validated transcriptional targets of deltaNp63 isoforms, Beta1 integrin cell surface interactions, Syndecan-1-mediated signaling events, Extracellular matrix organization, Collagen formation, collagen biosynthesis, and modifying enzymes, Allograft rejection, miRNA targets in ECM and membrane receptors, Focal Adhesion, PI3K-Akt signaling pathway |
| MTSS1 | Metastasis suppressor protein 1 | Could be related to cancer progression or tumor metastasis | Hedgehog signaling events mediated by Gli proteins |
| NCAPD2 | Condensin complex subunit 1 | Regulatory subunit of the condensin complex used in the interphase chromatin’s conversion into mitotic-like condense chromosomes | Aurora B signaling, Akap95 role in mitosis and chromosome dynamics, Cell Cycle, condensation of prometaphase chromosomes, mitotic prometaphase, M Phase |
Appendix A Discussion
Motivation: QuantAnts Machine is the quantum analogy of the well-known classical ant colony optimization (ACO). The ACO algorithm is a discrete optimization algorithm introduced in [7], which has the natural beauty of nature: a group of ants walking on a graph (domain) from their nest (site 1) to the food source (site 2) and then come back to the nest (site 3). During the process, they left pheromone trait on their paths. Suppose each ant carries an equal initial tank of liquid, decaying during the quest from (site 1) to (site 2) to (site 3). The intensity is computed by (liquid volume)/(total distance). Thus, the longer the distance, the less intensive the pheromone; equivalently, the shorter path will have a higher pheromone intensity.
Ants can sense the pheromone trait to build stochastic models for the optimal traveling paths:
-
•
The pheromone is evaporating due to the environment’s evolution. Thus, a path with a more intensive pheromone will last longer, and more ants will follow these paths. This phenomenon is beneficial-natural bias; the system of ants is optimized in the sense of resources: more ants will have to travel less due to the optimal pheromone trait paths.
-
•
When ants touch each other, there is hypothesized to have communication transferred from ant to ant. The biological facts are out of the scope of this work. Here, we observe that if the information can be shared among ant workers, it will be more optimized and beneficial, as they will share prior knowledge so that (1) more-common paths will be known and (2) less-common paths will be forgotten.
We introduce the quantum analog of ACO algorithm, named QuantAnts Machine for biomarker discovery in oncology to achieve two major goals:
- 1.
-
2.
QuantAnts Machine enables biomarker discovery over multiple modalities of cancer development by learning from dual-domain representations (Equation 6).
Previous Submission: QuantAnts Machine was submitted to Nature Cancer (NATCANCER-A08553) with the associated pre-print[17]. We summarize the merit comments of reviewers in two major points. The development of quantum algorithms for identifying biomarker combinations will be compelling to researchers in this field. However, the conceptual and translational advance these findings represent for a broad cancer research audience is more limited. Thanks to the valuable reviews, I decided to re-organize the article. The summary of changes is as follows:
- 1.
- 2.
- 3.
- 4.
-
5.
The sgRNA design is excluded and will be introduced in a separate article.
-
6.
In general, we revise the article for a broader audience, ranging from computational and clinical practitioners.
Appendix B Technical Reports
B.1 mRMR Graph Generation
We categorize pathways of interest in cancer research into two types: (1) direct or (2) indirect pathways. In the former case, the target variable straightforwardly presents the appearance of cancer types or sub-types (disease class). In contrast, the latter case concerns genetic-signaling pathways underlying disease-of-interest, such as TP53[30] or RAS activation[12]. We aim to identify a subset of genes which is considered -biomarker for the targeted pathways . The selection criteria for gene is based on mutual information between the gene’s molecular feature (DNA methylation, mRNA or RNA expression) and target , given by[21]
| (12) |
where
| (13) |
is the Shannon entropy of a random variable . The calculation of the IT-quantity in Equation 12 is challenging in multivariable case since the estimation of the joint distribution is computationally expensive with current techniques. We can reduce the difficulty of the problem by assuming that are independent variables, yielding . However, this is a weak assumption for genomics features since we argue that the biological interactions among genes in set straightforwardly induce statistical dependency among their feature set .
An efficient method to reduce the computational complexity of the given problem is using forward stage-wise search with relevancy and redundancy measurements. Specifically, the subset of features is defined by greedy approaches, in which only a single gene is added to the subset in each iteration. The Minimum Redundancy-Maximum Relevancy-based[22] (mRMR-based). Specifically, we aim to simultaneously maximize the relevancy between a new feature with target
| (14) |
and minimizing the redundancy of the chosen set [20]
| (15) |
The optimization problem is given as
| (16) |
This problem is equivalent to minimizing the loss value:
| (17) |
where is considered weights that scales the pairwise-mutual information between and . We show the interaction network of the RAS family (including NRAS, HRAS, and KRAS) computed by mRMR in SuppFig 4.
B.2 Literature Mining
We summarize the most used keywords regarding the biomarker found in Table 1 and 2 as follows
-
•
CCT5: zebrafish, clostridium difficile toxins, glycosyltransferase toxins, hepatocellular carcinoma, tert, dendrite morphogenesis, genetic chaperonopathies, endometrioid/mucinous ovarian carcinoma, immunohistochemistry, telomere, breast cancer, endometrium, migration, therapeutic target, invasion, liver neoplasm, treatment outcome, colorectal cancer, immune infiltration, p53 (TP53), enzyme activity, sperm proteome, sperm, fertility, cancer stem cells.
-
•
COL5A1 and COL5A2: systemic sclerosis, gastric cancer, COL3A1, extracellular matrix, COL1A1, connective tissue, skin hyperextensibility, anterior cruciate ligament, germline/gonosomal mosaicism, colorectal adenocarcinoma, colorectal adenoma, cell adhesion, inflammatory disease, predictive biomarkers, COL6A3, COL11A1, colorectal cancer.
-
•
MTSS1: invasion, metastasis, proliferation, metastasis suppressor 1, migration, lung cancer, gastric cancer, ovarian cancer, breast cancer, brain cancer, hepatocellular carcinoma, breast neoplasms, neoadjuvant therapy, collagen I, immune infiltration, genetic differentiation, colorectal cancer, anxiety, weight loss, obesity, oncogene, acute myeloid leukemia, cell growth, prostate cancer, DNA methylation, receptor protein tyrosine phosphatase, tumor suppressor.
-
•
NCAPD2: inflammation, Crocodylus porosus, hair, follicle regeneration, hair follicle stem cell, hepatocellular, carcinoma, DNA methylation, novel therapeutics, bc, CDK1, migration, proliferation, colorectal cancer, DNA damage, gastric cancer.
We find the potential cancer phenotypes and some symptoms discovered within the literature mining. Moreover, we analyze additional drivers with potential therapeutic applications, including:
-
1.
CD74 - HLA class II histocompatibility antigen gamma chain ( papers): macrophage migration inhibitory factor, inflammation, tumor microenvironment, immunotherapy, lung adenocarcinoma, breast cancer, immunohistochemistry, migration inhibitory factor, innate immunity, proliferation, pancreatic cancer, hepatocellular carcinoma, metastasis, MAPK, fish, TP53, KRAS, metastatic melanoma, cervical cancer, AKT, epigenetic, immune resistance, cleaner fish, T-cell, metastatic melanoma, immunotherapy resistance, driver mutation, T-cell activation, immunesuppresion, adaptive immune response, EGFR mutation, immune infiltration.
-
2.
JUP - Common junctional plaque protein ( papers): inflammation, gastric cancer, prostate cancer, wnt family member 10a, gamma catenin, KPP, GJB6, GJB2, EGFR, MTBPS2, PPK, TP53 apoptosis effector related to pmp22, oncogenes, apoptosis, UGDH, PDGFRB, HL1, CRISPR, bladder cancer.