1061 \vgtccategoryResearch \vgtcpapertypeApplications \authorfooter Zhen Wen, Yihan Liu, Jieyi Chen, Dongming Han and Wei Chen are with the State Key Lab of CAD&CG, Zhejiang University. E-mail: {wenzhen lyh1024 chenjieyi_juraws dongminghan chenvis}@zju.edu.cn. Siwei Tan and Jianwei Yin are with the Advanced Computing and System Laboratory, Zhejiang University. E-mail: siweitan@zju.edu.cn, zjuyjw@cs.zju.edu.cn. Minfeng Zhu is with Zhejiang University. E-mail: minfeng_zhu@zju.edu.cn. Dongming Han is also with Hithink RoyalFlush Information Network Co., Ltd. Zhejiang, China. Mingliang Xu is with Zhengzhou University. E-mail: iexumingliang@zzu.edu.cn. Wei Chen is the corresponding author.
Quantivine: A Visualization Approach for Large-scale
Quantum Circuit Representation and Analysis
Abstract
Quantum computing is a rapidly evolving field that enables exponential speed-up over classical algorithms. At the heart of this revolutionary technology are quantum circuits, which serve as vital tools for implementing, analyzing, and optimizing quantum algorithms. Recent advancements in quantum computing and the increasing capability of quantum devices have led to the development of more complex quantum circuits. However, traditional quantum circuit diagrams suffer from scalability and readability issues, which limit the efficiency of analysis and optimization processes. In this research, we propose a novel visualization approach for large-scale quantum circuits by adopting semantic analysis to facilitate the comprehension of quantum circuits. We first exploit meta-data and semantic information extracted from the underlying code of quantum circuits to create component segmentations and pattern abstractions, allowing for easier wrangling of massive circuit diagrams. We then develop Quantivine, an interactive system for exploring and understanding quantum circuits. A series of novel circuit visualizations are designed to uncover contextual details such as qubit provenance, parallelism, and entanglement. The effectiveness of Quantivine is demonstrated through two usage scenarios of quantum circuits with up to 100 qubits and a formal user evaluation with quantum experts. A free copy of this paper and all supplemental materials are available at https://osf.io/2m9yh/?view_only=0aa1618c97244f5093cd7ce15f1431f9.
keywords:
Quantum circuit, semantic analysis, visual abstraction, context visualization![[Uncaptioned image]](https://cdn.awesomepapers.org/papers/59ceaa35-5119-4696-87bb-e42fd11db984/x1.png)
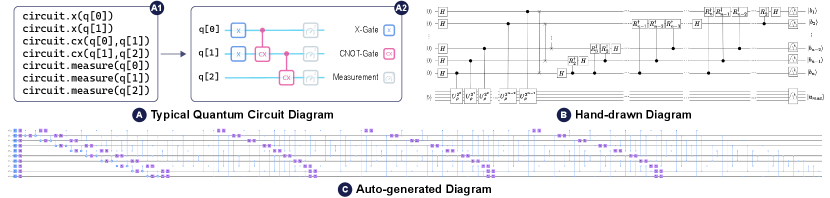
Quantum circuit visualizations for a 50-qubit quantum circuit. (A) Typical quantum circuit diagram generated by Qiskit[67]. (B) The resulting visualizations of Quantivine, including structured components, pattern abstractions, and context enhancement.
Introduction
Quantum computers utilize the principles of quantum mechanics, which have the potential to outperform classical computers in certain tasks [56] when reaching hundreds of qubits. Most current quantum computers perform calculations by executing quantum circuits, a computation model that is employed for both representation and implementation. Emergent quantum algorithms implemented by quantum circuits suggest exponential speedup over classical algorithms, which benefits various research communities, such as finance[13], chemistry[2], biological sciences[14], and machine learning[5, 46].
In the workflow of quantum computing[74], researchers describe quantum circuits by programming languages or libraries, such as Q#[66] and Qiskit[67] as shown in Fig. 1-A1. The compiler then transforms the code into executable quantum circuits. As the original program can not reveal the dependencies between gates, researchers often use quantum circuit diagrams to assist in the design of quantum algorithms. These diagrams use time-dependent representations to visualize the structure and behavior of quantum circuits. Fig. 1-A2 shows a typical diagram that depicts a quantum circuit including its fundamental elements, i.e. quantum bits and quantum gates. Each horizontal line in the diagram corresponds to the operation timeline of a quantum bit (or qubit). A notation (e.g. a square box) on the timeline specifies a quantum operation, referred to a quantum gate, that modifies the information stored in the qubits. The execution sequence of quantum gates follows a left-to-right order. The final information of qubits after the operations are regarded as the circuit output, which can be sent to other quantum circuits or transformed into classical information by measurement. In summary, a quantum circuit diagram can explicitly describe a quantum computation procedure.
The creation of quantum circuit diagrams typically involves two techniques, i.e., hand-drawing and automatic generation. Hand-drawing methods summarize quantum circuits and present their semantic information through visual abstractions (Fig. 1-B), whereas the manual design and creation process is time-consuming and error-prone. Furthermore, updating the diagram when the actual circuit changes is a tedious work. On the other hand, some libraries [67, 11] offer built-in functions for automatic visualization (Fig. 1-C), which enable efficient and accurate circuit representation and benefits for the development of small-scale quantum circuits. However, this technique is limited when scaling to a large number of qubits and quantum gates.
Recent advances in quantum computers pose significant challenges for creating clear and effective representations for quantum circuits, as the development of quantum circuits are expanding to larger scales. A number of institutions and universities have proposed quantum computers that can implement circuits with hundreds of qubits. Nevertheless, the increasing number of qubits and quantum gates results in visual clutter and overplotting when they are visualized in typical diagrams. For instance, Fig. 1-C shows an auto-generated diagram that consists of only 10 qubits and 306 quantum gates, which is hard to examine. The readability of automatically generated visualizations significantly decreases when scaling up to more than 100 qubits. Therefore, an appropriate visualization approach is required to enable users to easily comprehend and analyze large-scale quantum circuits.
This work thus explores how visualization techniques, such as graph summarization[47] and visual abstraction[71], can be used for scalable quantum circuits. Due to the complexity in deciphering quantum circuits, we introduce the semantic information to increase the readability. To better support the goals of quantum researchers who frequently develop quantum circuits, we conduct expert interviews to understand the pain points and requirements when visualizing quantum circuits. Inspired by findings from the interviews, we develop Quantivine111Quantivine is derived from ”quantum circuit” and ”vine,” with the metaphorical representation of a growing and branching plant symbolizing the system’s ability to help users navigate the complex pathways of quantum circuits., a quantum circuit visualization system that provides efficient visual representations of large-scale quantum circuits and supports interactive exploration and analysis.
Quantivine utilizes a novel pipeline that extracts latent semantics of quantum programs to automatically visualize scalable quantum circuits using graph summarization and visual abstraction techniques. Our approach first collects meta-data and semantic information of the quantum circuit from its underlying code. The circuit is then segmented into components based on its semantic structure, while reorganizing it through qubit bundling and gate grouping. We also employ a semantic-preserving layout strategy in this process to ensure the new diagram is clear and easy to interpret. Furthermore, we exploit semantic meanings of the code fragments to identify repetitive patterns in the circuit, which are subsequently presented through visual abstractions. These patterns are summarized from a comprehensive survey on a circuit benchmark, that covers all well-known quantum algorithms. Lastly, we design a series of visual representations that complement contextual information to facilitate the comprehension and analysis of the quantum circuit.
In summary, the contributions of this research include:
-
•
We distill a list of design requirements for visualizations of large-scale quantum circuits from expert interviews.
-
•
We propose a novel pipeline for visualizing quantum circuits that addresses challenges in readability and scalability with the support of semantic information and a series of visual designs.
-
•
We develop Quantivine, a proof-of-concept system to demonstrate the effectiveness of our pipeline through two benchmark quantum algorithms with up to 99 qubits and an evaluation with 10 experts.
1 Related Work
In this section, we discuss the related work in quantum circuit analysis, semantic analysis, and visualization techniques of complex graphs.
1.1 Quantum Circuit Analysis
The quantum circuit is an important computation model of current quantum computers. The increasing interest in quantum computing [56], coupled with advancements in actual quantum devices[60], has motivated research in the analysis and visualization of quantum circuits.
Quantum-Classic Difference. Although quantum circuits are made up of bits and logical gates similar to classic circuits, they are two different models. Quantum circuits have unique features such as quantum superposition and entanglement[36, 59], which are building blocks of quantum algorithms. These features power quantum algorithms as necessary parts of any quantum advantage that cannot be replicated in classical circuits. As such, the research in classical circuits[37] cannot be directly applied to quantum circuits.
Performance Analysis. Most quantum research leverages mathematical or logical methods during the analysis process of quantum circuits[50, 3, 68, 75]. Besides, the network and graph theory is also applied to quantum circuit analysis[4, 33]. Recently, VACSEN[62] introduces visualization techniques for quantum circuit analysis, which provides an intuitive way for users to aware noises in the computation. These studies mainly focus on the performance of quantum circuits.
Quantum Circuit Visualization. As the growing complexity of quantum circuits and the non-intuitive nature of quantum mechanism, it becomes increasingly challenging to comprehend the circuits. A number of studies have investigated visualization techniques to aid in the comprehension of quantum computing. For example, ShorVis[70] visualizes a quantum algorithm in terms of quantum states, circuit and probability distribution. QuFlow[45] displays the parameter flow of quantum circuits. GraphStateVis[53] offers visual analysis of qubit graph states and their stabilizer. In addition, Fickler et al.[16] present real-time visualization of quantum entanglement state through advanced devices. Existing research focuses on visualizing qubit states, parameters or quality indicators to enhance the comprehension of the circuit. Nevertheless, these studies are limited when scaling to large quantum circuits as the space of quantum states exponential increases.
Our work proposes a novel approach to tackle this challenge by focusing on the efficient representation of quantum circuit structure. We combine semantic analysis and graph visualization techniques to generate visual representations for scalable circuits with high readability. This approach provides a significant contribution towards enhancing the comprehension of quantum circuits and facilitating circuit analysis.
1.2 Semantic Analysis of Programming Languages
Quantum circuits are commonly constructed using specific programming languages[66, 35, 21], or Python toolkits[67, 11]. Researchers have studied utilizing semantics of quantum circuits for performance optimization and correctness verification[80, 69]. But there is a scarcity of research that employs semantics to interpret the quantum circuit.
Semantic analysis has been extensively used in the field of information visualization to facilitate the exploration and analysis of complex datasets. Two forms of frequently used semantic information are semantic structure and semantic meanings. The semantic structure describes internal relationship of the data, which is often used to navigate exploring data or complex visualizations[7, 1, 76]. The semantic meanings, such as keywords, are often used to characterize data samples for efficient similarity measurements[8, 41, 78, 77] and visual representations[63, 40]. In recent years, there has been growing interest in applying semantic analysis techniques to code representation to facilitate comprehension and analysis of programs. Using semantic structure information, such as abstract syntax tree (AST), to enhance code representation has been proven to be effective[23, 22]. Additionally, certain studies have focused on visualizing the semantic meanings of scripts, aiming to improve comprehension of data provenance[79, 15].
Motivated by previous studies, we attempt to utilize semantics to enhance the representation of quantum circuits. We employ AST to extract the semantic structure of quantum circuits from quantum programs, followed by inferring semantic meanings of code statements that represents various patterns in the circuits. Thus, our approach results in highly readable circuit diagrams that incorporate semantics.
1.3 Visual Representation of Graph Data
The visual representation of graph data can be classified into two major categories: node-link diagram and matrix representation. Matrix representation [54, 58, 27] uses an adjacency matrix to visualize a graph and utilizes the ordering of rows and columns to highlight typical patterns. An intuitive way for non-experts is using node-link diagram by utilizing nodes and edges to represent topology structures [19, 61, 29]. The key issue of node-link diagram is how to place nodes, as the positions impact the visual patterns. Various layout strategies and methods [25, 26, 39, 83, 73] are proposed to handle different tasks and requirements, such as force-directed layout [24, 34], hierarchical layout [57], orthogonal layout [20, 6] and so on.
As the scale of graph data continues to grow [42], graph summarization[47] and visual abstraction techniques are employed to enhance the readability of graph visualization [9, 28] and facilitate the analysis of graph data. Graph summarization focuses on extracting important information from the original graph, involving aggregation based, bit compression based, simplification based and influence based methods. Aggregation based methods aggregate nodes or edges into super-nodes based on optimization function[43, 48]. Bit compression based methods minimize the number of bits in describing graphs[55, 38]. Simplification based methods remove inessential nodes or edges to simplify graphs[64, 18]. Influence based methods utilize high-level description of the influence propagation to represent graphs[52, 51]. Some of these techniques may not faithfully represent the original data or introduce complex graph theory concepts that increase the cognitive load on users. For visual abstraction, it focuses on reducing visual complexity of graphs. Graph motifs[12, 44] are utilized to simplify graph visualizations, but the motifs and glyphs involve cognitive burden in comprehension. In addition, customized visual abstraction techniques [71] are employed to achieve different tasks and requirements[81, 82].
However, the aforementioned work on visual representation of graph data is extensive and not tailored specifically to quantum circuits. Given the specialty of quantum circuits, a simple and customized representation that is more suitable for quantum experts is required. Our work builds upon the requirements of domain experts and provides a significant contribution towards the exploration of utilizing graph visualization techniques for large-scale quantum circuits.
2 Approach Designs
In this section, we first introduce the background (Section 2.1), then list the design requirements (Section 2.2) and our system overview (Section 2.3).
2.1 Background and Concepts
2.1.1 Quantum Circuit Model
Analogous to classical circuits including bits and logic gates, quantum circuits are made up of qubits and quantum gates[56].
Qubit. In quantum computation, quantum qubits, i.e. qubits, are basic units of information storage. A qubit is a “quantum version” of a classical bit. Compared to the classical bit that can be either 0 or 1, a qubit can stay in a superposition state[56]. Mathematically, a qubit state is represented as a linear combination of classical states , where and represent the classical states 0 and 1, respectively. Complex parameters and can be configured via the quantum operation.
Quantum gate. In a quantum circuit, operations on qubits are specified by quantum gates. Given an initial state of multiple qubits, each gate of the circuit operates one or more qubits, which changes the parameters of qubits (e,g, and ). For example, a Pauli-X-gate can invert the state of a qubit from to . There are many types of quantum gates (e.g., X-gate and CNOT-gate) introduced in [56]. In summary, all gate types can be categorized into single-qubit gates and multi-qubit gates. A single-qubit gate only operates one qubit, while a multi-qubit gate can operate more qubits, which creates entanglement between qubits (correlations between parameters of different qubits). Note that two quantum gates can be executed simultaneously in a circuit if they do not operate the same qubit, leading to parallelism in the qubit timelines.
2.1.2 Visual Representation of Quantum Circuit
To interpret the quantum circuit, a time-dependent diagram is widely adopted. The creation of a quantum circuit diagram involves both glyph representation and layout. Here we briefly introduce these concepts.
Basic glyphs. The qubits and quantum gates are represented as glyphs in the diagram. This paper presents them in a uniform visual representation as follows:
-
\scalerel*
![[Uncaptioned image]](https://cdn.awesomepapers.org/papers/59ceaa35-5119-4696-87bb-e42fd11db984/x3.png)
Qubit wire. A qubit is represented as a horizontal wire in the diagram, and a set of parallel qubit wires forms the basis of a quantum circuit diagram.
-
\scalerel*
![[Uncaptioned image]](https://cdn.awesomepapers.org/papers/59ceaa35-5119-4696-87bb-e42fd11db984/x5.png)
Single-qubit gate. A single-qubit gate is represented as a square box placed on a qubit wire, which is labeled with the names of gates to differentiate between distinct types of gates, such as “H” for a Hadamard gate, “X” for a Pauli-X gate.
-
\scalerel*
![[Uncaptioned image]](https://cdn.awesomepapers.org/papers/59ceaa35-5119-4696-87bb-e42fd11db984/x7.png)
Multi-qubit gate. A multi-qubit gate is represented as boxes or dots on the qubit wires, which are vertically connected. These boxes and dots also serve as an indication of the qubit’s role as either a target or controlled qubit. The boxes are also labeled to reflect the specific gate type, such as “CX” for a CNOT gate.
-
\scalerel*
![[Uncaptioned image]](https://cdn.awesomepapers.org/papers/59ceaa35-5119-4696-87bb-e42fd11db984/x9.png)
Component gate. A component gate is a composition of multiple other gates. It is represented as a rectangular box spanning one or more qubit wires. The component gate is typically used to simplify the representation of more complex gates in the diagram.
Layout. The layout provides important visual cues to help understand the circuit. Each gate’s notation type corresponds to its operation type, while its horizontal and vertical positions specify the order of operations and the qubits being operated upon, respectively. Notations of multiple-qubit gates connect multiple qubits, indicating potential entanglement between qubits. The layout can be modified to meet certain goals while keeping the circuit equivalence. Specifically, the horizontal position of a gate can be moved forward or backward, as long as the order of gates on each qubit remains unchanged. This work adopts a semantic-preserving layout strategy to enhance the readability of the circuit diagram (described in Section 3.2).
2.2 Design Requirements
The target users of this work are quantum researchers. Two domain experts from university labs were involved in the entire process of this research. In their daily work, quantum circuit diagrams are major visualization tools to interpret quantum circuits. We conducted iterative interviews with them to distill requirements. They propose the requirements for large-scale quantum circuit analysis, which can be translated into visualization requirements below.
R1. Clarify the components of quantum circuits. When designing quantum algorithms, it is common to use some typical sub-circuits as components of entire circuits. Quantum researchers could easily recognize a typical component in an isolate circuit. However, in a complex quantum circuit that consists of numerous quantum gates, it is challenging to identify and distinguish components from the general quantum circuit diagram. Therefore, new diagrams should clarify the structure of quantum circuits with multiple components.
R2. Simplify the patterns of quantum gates. Performing batch operations increases the scale of quantum circuits, and results in repeated patterns in circuit diagrams. In practice, quantum researchers need to identify patterns in diagrams to understand the circuits. Nevertheless, repeatedly examining patterns imposes a substantial cognitive load. Therefore, new diagrams should reveal the patterns of quantum gates and reduce unnecessary repetitions.
R3. Explicate the context of qubits and quantum gates. Quantum researchers have different concerns in quantum circuit analysis, such as qubit provenance[31], idling[10], quantum gate parallelisms[17] and the entanglement of quantum circuits[32, 35]. These considerations are essential for programming and debugging circuits. However, when exploring large circuit diagrams, these contextual details become intricate and challenging to comprehend. Therefore, new diagrams should explicitly present context information, enabling the analysis of idling, parallelism, and entanglement in quantum circuits.
R4. Adopt familiar visual designs and flexible interactions. As our users are specialized in quantum computing, they have no experience in visual analysis. Thus, a concise and familiar design is preferred. Also, they need flexibly-customized visualizations on demand. For example, some users focus on the outline of the circuit, while other users are interested in details of qubits. New diagrams should thus use visual designs that are intuitive and familiar to quantum researchers.
2.3 System Overview
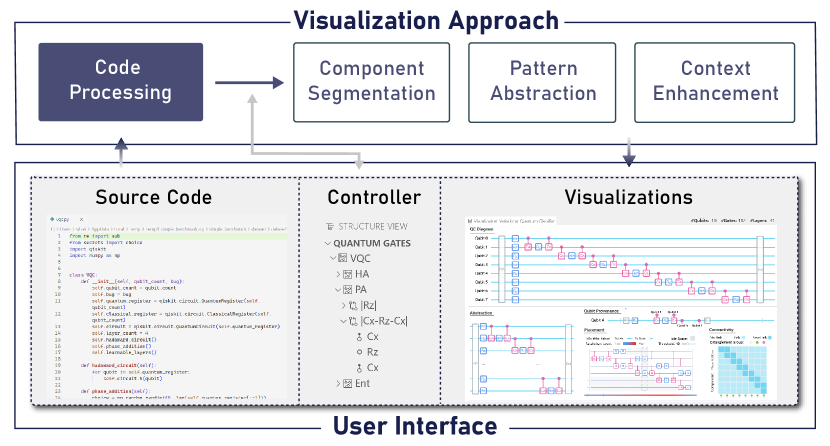
To fulfill these requirements, we design Quantivine, a proof-of-concept system that visualizes scalable quantum circuits. Figure 2 illustrates the architecture of the system. A novel visualization approach (Section 3) is undertaken. It accepts a piece of quantum programming code, and generates flexibly-organized quantum circuit diagrams with comprehensive context information. A user interface and a series of interactions (Section 4) are provided to support interactive exploring and analysis of the quantum circuits. Quantivine is implemented as a Visual Studio Code plugin and available at https://github.com/MeU1024/qc-vis.
3 Visualization Approach
In this section, we present a pipeline that accepts the programming code of quantum algorithms, and results in a series of visual representations to reveal the components (R1), patterns (R2) and context information (R3) of the quantum circuits (Fig. 3). The semantic structure tree of the quantum circuit is introduced to support flexibly-customized experience throughout the visualization pipeline (R4). To prove the concept of our approach, we implement the proposed pipeline for the quantum circuits that are built using Python with Qiskit toolkit.
3.1 Code Processing
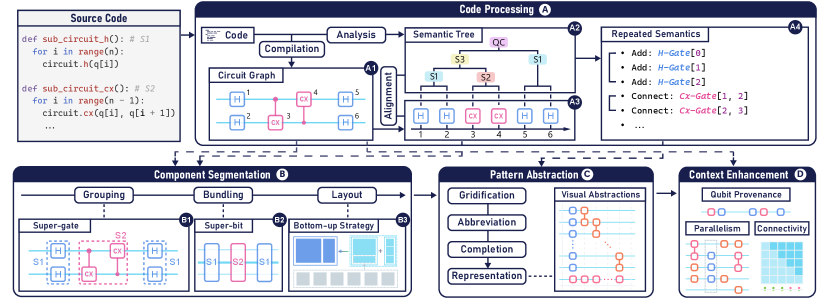
To support the visualization of a quantum circuit, our pipeline first processes its underlying code through circuit compilation, semantic analysis, and data alignment (Fig. 3-A). This process allows us to extract meta-data and semantic information from the circuit.
Circuit Compilation. We compile the code and extract the following data from the quantum circuit: (1) the qubits involved in the circuit, (2) the quantum gates applied in the circuit with their correlations to qubits, and (3) the placements of quantum gates in the circuit which indicate the order of execution. The above data can be translated to the nodes, edges, and the layout of a circuit graph, which could construct a definite quantum circuit diagram as shown in Fig. 3-A1.
Semantic Analysis. Two types of semantic information are derived from the source code. (1) The semantic structure of the code implies the hierarchical structure of sub-circuits. As there are sub-circuit reuses, researchers usually define some frequently-used circuit construction processes as functions, where each function corresponds to a specific functionality. Thus, the source code is organized as a tree structure where each tree node represents a function (Fig. 3-A2). We extract this structure through an AST. (2) The semantic meanings of code provide insights into patterns in the quantum circuit. We identify three categories of repetitive patterns from loop statements using a rule-based method, which are detailed in Section 3.3.1.
Node Alignment. We apply node alignment to establish a connection between the quantum gates and the nodes of semantic structure tree. Applying semantic or syntactic analysis alone is insufficient to establish a precise correspondence between gates and tree nodes. We thus insert interrupts in the circuit compilation procedure to track the insertion sequence of quantum gates, and link the newly-built gates to their semantic representations along with the circuit constructing process. Figure 3-A3 indicates the time stamp of each gate and its corresponding tree node. As a result, all quantum gates are aligned to the semantic tree nodes.
3.2 Component Segmentation
To incorporate R1, we present a three-step approach for breaking down a typical quantum circuit diagram into hierarchical representations (Fig. 3-B). Our approach draws inspiration from techniques such as node grouping and edge bundling that are effective for graph summarization[47]. Afterwards, a semantic-preserving layout strategy is introduced to arrange the new diagram.
Quantum Gate Grouping.
The semantic tree (Fig. 3-A2) is first employed to guide the segmentation of circuit components.
We label attributes on quantum gates based on a user-customized semantic tree.
Before grouping, users can interactively fold or unfold the tree nodes to control the level of detail (Section 4.2).
Then, all quantum gates will be labeled with two attributes.
(1) Tree node label:
Each gate will be labeled in accord with the nearest unfolded node to which it belongs.
For example, if the tree node is folded while is unfolded, then and would be labeled with .
(2) Loop time label:
As a tree node may be repeated in compilation due to loops, two groups of gates may correspond to the same tree node.
We thus label each gate with a time stamp to differentiate separated gate groups that are built from the same function.
Subsequently, the gates will be aggregated by attributes to compose super-gates (Fig. 3-B1), analogous to a supernode in a summarized graph.
As a result, the quantum circuit is broken down to a series of primitive \scalerel*![]() \scalerel*
\scalerel*![]() and component \scalerel*
and component \scalerel*![]() gates.
gates.
Qubit Bundling. For a circuit with hundreds of qubits, a typical diagram will display a line for each qubit, which causes massive overlaps when displaying multi-qubit gates. An effective solution to alleviate the problem is adopting the edge bundling technique[30] for combining neighboring edges. However, the classic method needs to be modified for the quantum circuit. Due to the fact that each wire represents a distinct qubit throughout the whole circuit, solely sharing end nodes within a local scope is not a sufficient reason to bundle two qubits together. They may play a different role in other portions of the circuit. Therefore, the bundled qubits must be contiguous and of the same provenance throughout the circuit. The same provenance means these qubits go through the same sequence of primitive or component gates. For example, all the qubits in Fig. 3-B2 go through , so they can be bundled as one super-bit.
Layout Strategy.
Since the grouping and bundling process breaks up the placements of quantum gates, we present a bottom-up layout strategy to reorganize the placements with minimum circuit length and maximum semantic-preserving.
First, we order the sequence of gates by their insertion time stamps (Fig. 3-A3).
The time stamp of the primitive gates \scalerel*![]() \scalerel*
\scalerel*![]() has been calculated in the node alignment process (Section 3.1).
On this basis, the time stamp of the component gate \scalerel*
has been calculated in the node alignment process (Section 3.1).
On this basis, the time stamp of the component gate \scalerel*![]() is retrieved from its sub-components.
Secondly, we arrange the layout referring to the semantic structure from the bottom to the top.
The gates in the same tree node are arranged in a local circuit space following the order of their time stamp.
They are laid out on the left most idle place of its correlated qubit wires \scalerel*
is retrieved from its sub-components.
Secondly, we arrange the layout referring to the semantic structure from the bottom to the top.
The gates in the same tree node are arranged in a local circuit space following the order of their time stamp.
They are laid out on the left most idle place of its correlated qubit wires \scalerel*![]() to compress the length of circuit.
If two gates are intersected at the same column, the later gate would be moved backward.
Subsequently, the local layouts of sibling tree nodes will be concatenated while calculating layout for their parent node.
In this way, we could construct a layout from the bottom to the top that shortens circuit length and preserves the semantic structure.
to compress the length of circuit.
If two gates are intersected at the same column, the later gate would be moved backward.
Subsequently, the local layouts of sibling tree nodes will be concatenated while calculating layout for their parent node.
In this way, we could construct a layout from the bottom to the top that shortens circuit length and preserves the semantic structure.
3.3 Pattern Abstraction
Quantivine abstracts patterns of quantum gates to simplify the representation of the quantum circuit (R2). The pattern of quantum gates refers to the composition and repetition paradigm in a sub-circuit. However, the composition of the circuit has been explicitly outlined through the component segmentation approach (Section 3.2). Therefore, we focus on visual abstractions of repeated patterns in this phase.
3.3.1 Abstraction Space
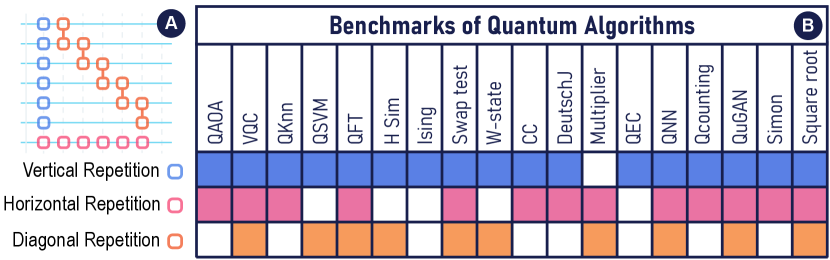
Based on a survey of 18 benchmarks of quantum algorithms and expert interviews, we distilled common patterns and abstraction designs of quantum circuits. The classification and visual representations for these patterns are summarized in Fig. 4.
The statistic result demonstrates that repetitions are necessary patterns in the design of scalable quantum circuits (Fig. 4-A). One observation is that researchers utilize loop statements to repeat sub-circuits for creating scalable circuit. The repeated sub-circuits are represented as periodic visual patterns in the general quantum circuit diagrams. We categorize these repetitions owing to their direction, including vertical, horizontal, and diagonal repetitions (Fig. 4-B).
![[Uncaptioned image]](https://cdn.awesomepapers.org/papers/59ceaa35-5119-4696-87bb-e42fd11db984/x20.png)
Vertical Repetition describes the application of the same operation on a sequence of qubits simultaneously. A typical instance of vertical repetition is applying H-gates on all qubits simultaneously.
![[Uncaptioned image]](https://cdn.awesomepapers.org/papers/59ceaa35-5119-4696-87bb-e42fd11db984/x21.png)
Horizontal Repetition presents a sequence of similar operations applied continuously on a single qubit. An example of horizontal repetition is applying a series of Rz-gates on the same qubit.
![[Uncaptioned image]](https://cdn.awesomepapers.org/papers/59ceaa35-5119-4696-87bb-e42fd11db984/x22.png)
Diagonal Repetition stands for applying a sequence of end-to-end operations on a series of qubits continuously. These gates are shown in stages. An example of diagonal repetition is applying a series of Cx-gates one next to another.
In abstractions, each repeated sub-circuit is regarded as a group. To reveal the frequency and the detail of groups, we preserve the first two sub-circuits and the last sub-circuit for each directional repetition, whilst the intermediate units are simplified as dots.
3.3.2 Abstraction Method
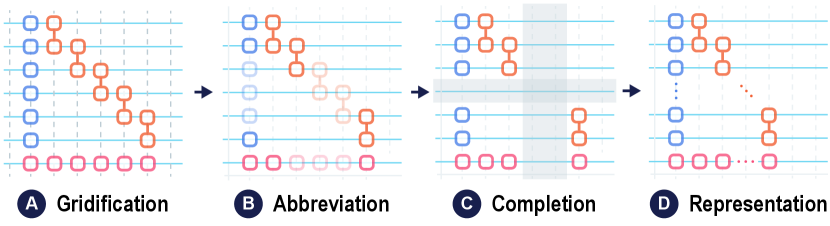
Our abstraction method effectively abstracts the quantum circuit by selectively highlighting only the necessary components and removing redundant information. Figure 5 depicts an illustration of the procedure. This method consists of the following steps:
STEP1: Gridification. We convert the quantum circuit diagram into a series of grids. Each grid contains exactly one unit box or none. We assign a visibility attribute to each row and column of the diagram. A grid is considered visible if its row or column is visible. Initially, all grids are invisible.
STEP2: Abbreviation. We identify repetitive patterns in the quantum circuit with the support of semantic meanings extracted from the code, and highlight their start and end parts. The covered rows and columns are marked as visible.
STEP3: Completion. We iterate through all quantum gates and determine their visibility. A quantum gate is visible if and only if its connected qubits are all laid on visible grids.
STEP4: Representation. We render all visible gates and aggregate contiguous idle rows and columns. Besides, we complement dot marks in the intermediate space of abstractions to improve readability and produce the final representation of the circuit.
3.4 Context Enhancement
To provide a contextual perspective of the quantum circuit (R3), we extract contextual information from meta-data and utilize a set of visual representations to reveal three factors of interest to domain experts.
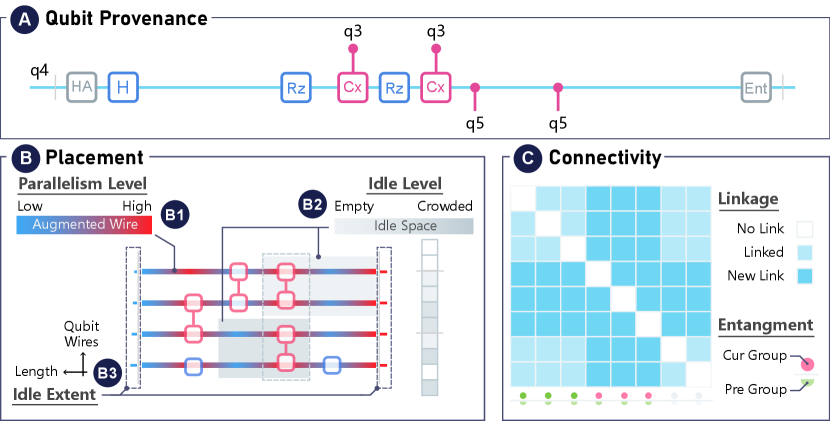
Qubit Provenance. We design a timeline representation for revealing the provenance of each qubit (Fig. 6-A). All operations applied on the qubit are projected onto the timeline with relative intervals preserved. This design enables domain experts to focus on the genealogy of one qubit and trace the evolution across various stages of the circuit.
Placement. We propose three designs to enhance the visual representation of the quantum circuit and provide contextual information about the placement of quantum gates (Fig. 6-B). The enhancement involves two aspects: Parallelism and Idle Qubit. We first augment the circuit by incorporating color-encoded parallelism levels on the qubit wires (Fig. 6-B1). Specifically, we assign the color red to indicate heavy-load circuits, while blue denotes light-load circuits. In addition, the idle spaces around each gate are highlighted to assist in the adjustment of gate placement (Fig. 6-B2). The color of the highlighted area represents the idle level. Notably, when highlighting the idle space for one gate, the idle space of its parallel gates is also highlighted. Due to the limitation of screen space, the extent of the idle wire is visualized next to the end of the wires (Fig. 6-B3). The new diagram reveals the patterns of idling and parallelism in the quantum circuit, which are important factors in understanding and optimizing the performance of the quantum circuit[3].
Connectivity.
We employ a matrix-based design to depict the qubit connectivity (Fig. 6-C),
where a highlighted indicates a direct connection between the -th and -th qubits via one or multiple multi-qubit quantum gates \scalerel*![]() .
Additionally, we propose a glyph-based design to represent entanglement states. The currently entangled qubits are assigned the same color, while the previous entangled states are visually differentiated and reflected below.
This view provides valuable insights into the overall structure and behavior of the circuit, enabling domain experts to make informed decisions about its optimization.
.
Additionally, we propose a glyph-based design to represent entanglement states. The currently entangled qubits are assigned the same color, while the previous entangled states are visually differentiated and reflected below.
This view provides valuable insights into the overall structure and behavior of the circuit, enabling domain experts to make informed decisions about its optimization.
4 Quantivine: User Interface
In this section, we introduce the user interface design of Quantivine, which is motivated by our proposed visualization approach, including the interface design (Section 4.1) and the interaction design (Section 4.2).
4.1 Interface Design
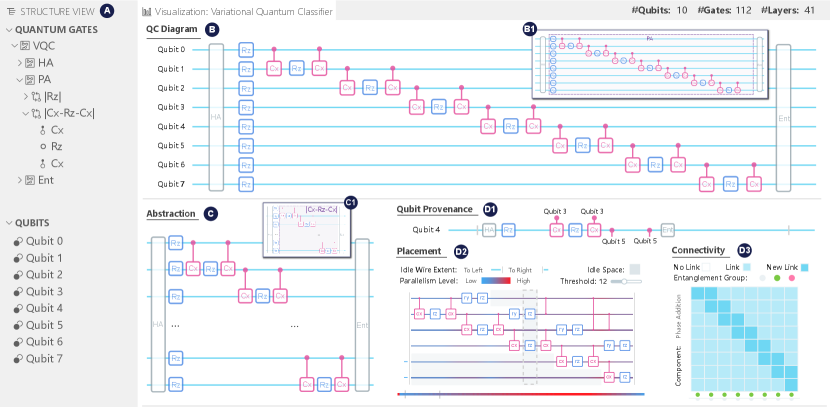
An overview of the Quantivine interface is shown in Fig. 7, which consists of views (A-D) that present the results of our visualization approach. Quantivine visualizes the quantum circuit from four aspects:
-
•
Structure: The Structure View (Fig. 7-A) presents the semantic structure of the quantum circuit as a tree diagram. This view serves to provide an overview of the circuit (R1) and allows for flexible customization of the circuit visualizations (R4). The tree structure corresponds to the semantic tree extracted from the source code (Section 3.1). The branches of the tree outline the hierarchical components and repetitive patterns of the circuit. Three interactions based on this view are also designed and further elaborated in Section 4.2.
-
•
Components: The Component View (Fig. 7-B) presents a quantum circuit diagram in a generalized form where subsets of quantum gates are aggregated into components. This view aims to provide a high-level abstraction of the circuit structure, emphasizing the modularity and reusability of the components (R1). The components are grouped and arranged based on their execution time and semantics, as extracted from the source code (Section 3.2). The users can use interactions in the Structure View, as detailed in Section 4.2, to customize the level of detail in this view (R4).
-
•
Abstractions: The Abstraction View (Fig. 7-C) presents the patterns of quantum gates. It aims to provide a global perspective of the circuit, highlighting the repetitive patterns and simplifying the visual representation (R2). Even though the Component View enables scaling down the circuit diagram to a certain extent, it might still take up a large space due to the numerous repeated patterns. Hence, we identify and visually abstract such patterns using our approach outlined in Section 3.3. The level of detail in this view is consistent with the Component View.
-
•
Context: The Context Views (Fig. 7-D1,D2, and D3) consist of three views. The first view, D1, provides a summary of the provenance of a qubit within a limited space. The second view, D2, depicts the actual placement of quantum gates while visualizing contextual idling and parallelism information. The third view, D3, displays the matrix showing the connectivity and entanglement between qubits. These views are designed to uncover implicit contextual information within the quantum circuit (R3). Additionally, they are interactive and coordinated with other views for specific analysis needs (R4).
4.2 Interactions
We implement two interactions in the Structure View to enable users to customize the circuit diagrams (R4): folding and highlighting. Folding allows users to fold/unfold items in the Structure View. Initially, all items in the structure tree are collapsed, providing a high-level summary of the circuit. Users can expand the items of interest in the tree to explore specific components in more detail. This allows users to obtain a more detailed view of the circuit by expanding more low-level items. With the highlighting operation, when users select a particular tree item in the Structure View, the corresponding gate will be highlighted in the circuit diagrams in both the Component and Abstraction Views (Fig. 7-B1,C1). This reduces the manual effort required to match items between code structure and the quantum circuit, and the hierarchical highlights provide a clear division of complex circuit diagrams.
To facilitate exploration of context information, we design a series of interactions for the Context Views in accordance with R3. Users can select a specific qubit in the structure view to display its provenance (Fig. 7-D1). Clicking on the gates associated with this qubit enables navigation to its placement within the context. In the placement view, users can adjust the threshold of parallelism level via a scroll bar. Clicking on a specific column of gates shows potential adjustment places for current parallel operations. In terms of connectivity, Quantivine allows users to specify a component and highlight its connections and entanglement behaviors for a more comprehensive view of the circuit.
5 Usage Scenarios
In this section, we demonstrate the effectiveness of Quantivine through two usage scenarios with domain experts. The first scenario (Section 5.1) shows the exploration of a 99-qubit quantum circuit that implements a quantum neural network model. The second scenario (Section 5.2) introduces the workflow of bug identification in a quantum algorithm.
5.1 Scenario 1 - Visual Analysis of QuGAN
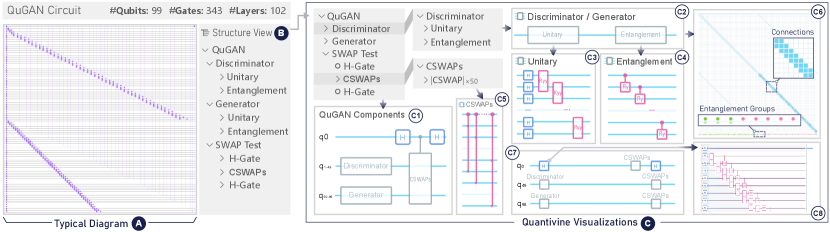
Quantum Generative Adversarial Network (QuGAN) is an emerging topic of quantum machine learning[65]. However, as shown in Fig. 8-A, the meaning of gates in a typical 99-qubit circuit diagram of QuGAN is difficult to understand due to a lack of semantic information.
The expert E1 intends to implement QuGAN on a real quantum computer. Thus, he is interested in exploring the functionality of each part of the QuGAN circuit. E1 first examines the high-level structure of QuGAN in the Structure View (Fig. 8-B): the Discriminator, Generator, and SWAP Test. After collapsing the components, the circuit diagram becomes clearer and easier to comprehend (Fig. 8-C1). E1 then visualizes the detailed structure of the circuit. By expanding the Discriminator and Generator components, E1 discovers that they both consist of a Unitary component and an Entanglement component (Fig. 8-C2). Upon further expansion, E1 finds that these components include quantum gates that show repeated patterns. To confirm the role of these components, E1 employs the connectivity matrix to analyze the connections between different qubits. As such, E1 leverages the Abstraction View to get a concise view of these patterns. In Fig. 8-C3, the Unitary component includes a sequence of Ryy gates, connecting qubits in a linear manner. In Fig. 8-C4, instead of Ryy gates, the Entanglement component involves linearly-connected CRy gates. E1 says, “With my knowledge of quantum machine learning, now I understand why the Discriminator and Generator have the same structure. Analogous to classical neural networks, QuGAN trains the parameters of gates to fit the data. In the GAN framework, both the discriminator and generator are neural networks. Thus, their two quantum versions use the same model for simplicity.” To verify this observation, he then highlights the Discriminator, Generator, and SWAP Test components in the matrix view (Figure 8-C6), which shows that the qubits of the Generator component are fully connected. “This is designed to utilize the unique entanglement property of quantum physics to improve the model complexity, which further improves the prediction accuracy,” said E1. He also notices that the SWAP Test component entangles all the qubits at the end, as shown in Fig. 8-C5, which sends the predictions from the Generator to the Discriminator.
After grasping the detailed structure of the circuit, E1 decides to collapse the details, keeping an overview of it as shown in Fig. 8-C1. He then proceeds to analyze the circuit in terms of the arrangement of qubits and quantum gates. He first selects q0, and the qubit provenance view shows that it passes through an H-gate, a CSWAPs component, and another H-gate (Fig. 8-C7). This provenance demonstrates that q0 is acting as a control qubit in the SWAP test. However, via Fig. 8-C8, E1 identifies a suboptimal placement of the first H-gate and the CSWAPs component, as there is significant idle time between these operations, which might introduce noise when executed on a quantum computer. Therefore, he clicks on these two gates to check if it is possible to adjust their placement. In the placement view, the visual cues show that there is a space for the H-gate to move backwards (Fig. 8-C8). The color of the qubit wire indicates a possible location on the left of the next gate with a low parallelism level, which is suitable for replacing the H-gate.
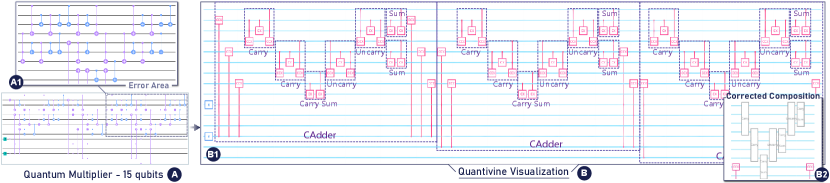
5.2 Scenario 2 - Bug Detection of Quantum Multiplier
The complexity of quantum circuits makes it difficult to detect bugs at the circuit level. The quantum multiplier, which is designed to calculate the product of two numbers stored in qubits, is a prime example of this complexity. Even a small-scale quantum multiplier has an intricate structure that is arduous to grasp (Fig. 9-A).
The expert E2 is tasked with detecting bugs in a 15-qubit quantum multiplier circuit, where the bugs are hidden within a cluttered area of the circuit diagram (Fig. 9-A1). To accomplish this, he employs Quantivine to visualize and explore the construction of the circuit. E2 starts by collapsing all sub-components to obtain an overview of the circuit. After confirming the high-level structure of the circuit is correct in the Component View, he guesses that the bugs are hidden within more detailed structures. Thus, he drills down by expanding all components. Despite the circuit becoming lengthy when fully expanded, our layout strategy ensures an organized and semantically meaningful layout (Fig. 9-B1). In this view, he notices that the composition of the UnCarry and Sum components in the Adder is incorrect, which should be composed as shown in Fig. 9-B2. Guided by the structured view and visual cues of the circuit diagram, E2 quickly locates the bugs in the underlying code of the circuit and effectively fixes them.
6 User Evaluation
In this section, we introduce our evaluation methodology (Section 6.1), and report findings derived from the results (Section 6.2).
6.1 Methodology
To evaluate the effectiveness of our pipeline, we conducted a qualitative expert evaluation using Quantivine as a technology probe. The evaluation had two goals: firstly, to assess whether our approach is effective in assisting users in comprehending quantum circuits, and secondly, to evaluate the usefulness of our visual designs in the analysis and optimization of large-scale quantum circuits.
Participants. We recruited 10 quantum researchers (P1-P10; age: 22-30) from university quantum computing laboratories. They included undergraduates, graduates, and professors from computer science and physics departments. All participants majored in quantum computing with experience in developing quantum circuits (P1-P4: < 1 year, P5-P8: 1-4 years, P9-P10: > 8 years). Their most frequently used visualization tool for quantum circuit is Qiskit. Four of them (P3-4, P6-7) focused on small-scale circuits with up to 20 qubits, while the others had worked on larger circuits with more than 50 qubits. We conducted online experiments that lasted 40 to 60 minutes. Each participant received approximately $15 at the start of the session.
Task. The participants were asked to complete three tasks using Quantivine: a training task (T0), a depiction task (T1), and an analysis task (T2). For the depiction task, we prepared a quantum circuit with multi-level structure, and required participants to illustrate the backbone of the circuit using the resulting visualizations from the structure, component, and abstraction views. The analysis task required participants to use context visualizations to analyze and find potential optimization in a quantum circuit. The training task was prepared to cover all the features in T1 and T2. In total, we prepared six quantum circuits that represents different quantum algorithms, respectively. Each circuit contains 30 to 99 qubits and over 10 hierarchical components. We also provided the participants with a document that included the textual description and source code for the algorithms.
Procedure. The study began with the introduction (10 min) of the study purpose, the motivation of improving quantum circuit representation, and the concepts in our proposed approach. Next, we proceeded to the training task (T0, 15 min). We demonstrated the features of Quantivine with a quantum circuit and asked the experts to reproduce the process themselves. After the training, we provided the experts with two quantum circuits for the two practical tasks (T1 and T2, 10 min for each). We ensured that the participants were not familiar with the circuit provided in T1 and encouraged them to learn and ask questions about the quantum algorithms before starting the trial. For each task, we asked the experts to depict at least two levels of structure and one visual abstraction. Finally, the session ended with a semi-structured interview (15 min) and a post-study questionnaire (5-Point Likert Scale). Each session was run in-lab following a think-aloud protocol.
6.2 Findings
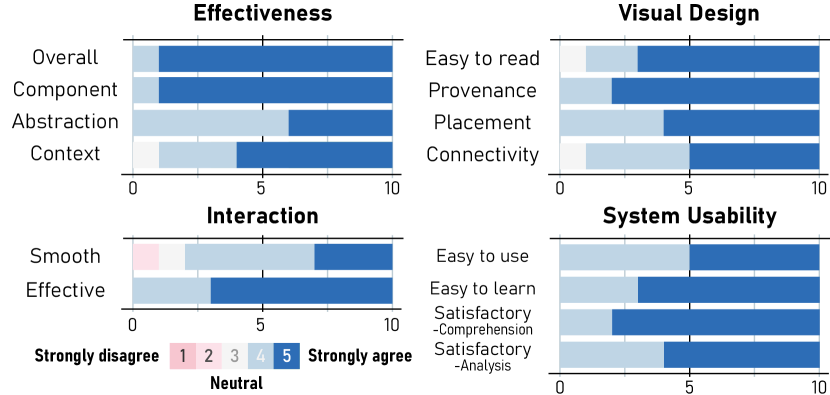
In summary, the evaluation results demonstrate a high level of user satisfaction and effectiveness of Quantivine in supporting quantum circuit exploration and analysis. Figure 10 illustrates the results of our evaluation, and we provide a detailed analysis of the findings below.
Effectiveness. Participants appreciated the effectiveness of Quantivine in exploring and analyzing quantum circuits ( = 4.7, = 0.5). The Structure and Component Views were particularly praised for their ability to hierarchically outline the circuit, as well as the ability to customize the level of detail in the views. Participants also noted the usefulness of Abstraction View in identifying repetitive patterns, with P8 commenting that “it’s easier to read a scalable circuit with abstractions”. Most participants believed the Context View provided effective contextual information for circuit analysis, whilst some participants expressed the desire for more detailed indicators of the circuit, such as noises and parameters (P1,P3). Overall, Quantivine was perceived as an effective tool for reducing the complexity of circuit representation, and was noted that “it eases the burden of interpreting circuits” (P6).
Visual Design. Participants rated Quantivine highly for its aesthetics, clarity, and usefulness of visual encoding ( = 4.6, = 0.6). They responded that our design was visually appealing and easy to use. Participants particularly appreciated the color-coding and highlighting of the placement view for its “clear and intuitive perception of global placement information” (P3). The Connectivity View received mixed responses. While some participants were “not convinced” (P2) due to their unfamiliarity with the matrix representation, other participants found “it’s interesting to investigate the circuit using an adjacency matrix” (P9) and obtained valuable insights from it. One participant, P4, specifically noted the usefulness of the connectivity view in his current research about the entanglement analysis of quantum circuit.
Interaction & System Usability. Participants responded positively about the usability of Quantivine ( = 4.7, = 0.5), finding it easy to learn and use with fluent and efficient interactions ( = 4.4, = 0.8). They expressed interest in using Quantivine to comprehend and explain other quantum algorithms in the future, as well as for circuit analysis and optimization. Furthermore, two professors appreciated for the comprehensive views of quantum circuits provided by Quantivine, and expressed interest in sharing the tool in their educational work, indicating its potential to contribute to the advancement of quantum computing education and research.
Suggestions. Some participants suggested improvements to certain features, such as the ability to annotate and save their work within the tool. P10 noted that the current system was targeted for the expert users, adding direct manipulation on the diagram, and synchronization with the source code may make it friendly to novice users. P3 commented that he would be happy if Quantivine could additionally visualize the state of qubits in the intermediate or final stages of the execution.
7 Discussion
In this section, we reflect on our research and discuss implications for quantum circuit visualization, followed by future work and limitations.
7.1 Implications
This study reveals implications for future quantum circuit visualization.
Benefits of semantics in quantum circuit interpretation. Our evaluation results indicate that semantics has a promising potential for enhancing the interpretation of quantum circuits. The user feedback showed a highly positive response towards the semantic representation of the circuit, which offered a new perspective of circuit visualization. To our knowledge, this area has not yet been explored in-depth by other researchers. This approach effectively reduces the cognitive load of comprehending complex and scalable circuits and further facilitates navigation and analysis tasks. Moreover, the use of semantics could lead to the development of more advanced tools and techniques for quantum circuit visualization and analysis in the future.
Visual representations beyond typical diagrams. Our work also explores the potential of visual representations beyond the typical quantum circuit diagrams. We involve a series of new diagrams to present various perspectives of circuits. For example, the abstracted circuit diagram allows users to analyze the circuit at various levels of abstraction, making it easier to identify patterns and relationships between different parts of the circuit. The augmented circuit diagram that uses color-coding and highlighting enhances the perception of gate placement context, which is critical for optimizing the circuit performance. These new diagrams could be extended to other visualizations and graphical interfaces for quantum computing, providing users with a more intuitive and interactive way to analyze and optimize quantum circuits.
7.2 Limitations and Future Work
Although our work has shown promising results, there are several limitations and opportunities for future research.
Scalability. Our semantic-based segmentation and abstraction approaches for quantum circuits are scalable, enabling the visualization of larger and more complex circuits without any limitations. Our usage scenarios and user evaluation confirm that Quantivine can efficiently visualize quantum circuits with up to 100 qubits. The feedback from domain experts suggests that the system’s capability covers the majority of their research on current quantum devices. Nevertheless, as circuits scale up to hundreds of qubits, our system encounters challenges with interactions. The fully expanded circuits and matrix diagrams impose overhead in terms of rendering and visual perception, thereby hindering the interactivity of the system. Although our design of folding circuit mitigates this issue to some extent, optimizing rendering techniques and developing new interactions tailored to the demands of large graphs and matrices can address it more adequately in future work.
Generalizability. Although our study focuses on semantic analysis of Python + Qiskit code, the methodologies employed in this research have the potential to be extended to other high-level quantum programming languages. The fundamental idea involves utilizing static analysis to deduce the structures and meanings of code snippets and then mapping them to dynamic compiled circuits. These semantic meanings are derived from predefined rules, which can be expanded to encompass more complicated patterns and leverage advanced deep learning techniques for intelligent inference [72] in forthcoming research.
Potentiality. With increasing capability of the quantum circuit, its visualization and analysis are becoming an emerging field of research. While our work illustrates a potential pipeline of using semantic analysis and visualization techniques for quantum circuit representation and analysis, further work is needed to explore how it can be integrated with other quantum programming and simulation tools. We believe our work has the potential to lay the foundation for future research in large-scale quantum circuits by making their exploration and analysis more accessible to a wider range of researchers and practitioners.
Limitations. Our system currently supports the visualization of static quantum circuits. Future work could focus on developing a real-time visualization system that captures the dynamics of quantum circuits during execution. The current system is tailored to expert users and lacks certain features that could make it more accessible to novice users. Future work could focus on improving the user interface and developing features such as direct manipulation on diagrams. Furthermore, it would be beneficial to offer users the ability to define their own grouping of quantum gates, in addition to automated methods, resulting in a more customizable and user-centric experience.
8 Conclusion
This work presents a novel visualization approach for large-scale quantum circuits, that produces comprehensive representations of the circuit to fulfill the analysis requirements. The approach involves graph visualization techniques incorporated with semantic analysis, and a set of visual designs specialized for quantum circuits. Then, we develop Quantivine, a prototype system that allows quantum experts to interactively explore and analyze scalable quantum circuits. The evaluation results demonstrate the effectiveness of our pipeline and visual designs.
Acknowledgements.
This work was supported by the National Natural Science Foundation of China (No. 62132017). This work was also funded by Zhejiang Pioneer (Jianbing) Project (No. 2023C01036).References
- [1] R. Albertoni, A. Bertone, and M. D. Martino. Visualization and semantic analysis of geographic metadata. In Proc. GIR, pp. 9–16. ACM, New York, Nov. 2005. doi: 10 . 1145/1096985 . 1096989
- [2] B. Bauer, S. Bravyi, M. Motta, and G. K.-L. Chan. Quantum algorithms for quantum chemistry and quantum materials science. Chem. Rev., 120(22):12685–12717, Nov. 2020. doi: 10 . 1021/acs . chemrev . 9b00829
- [3] D. Bhattacharjee and A. Chattopadhyay. Depth-optimal quantum circuit placement for arbitrary topologies. CoRR, abs/1703.08540, Mar. 2017. doi: 10 . 48550/arXiv . 1703 . 08540
- [4] J. Biamonte, M. Faccin, and M. De Domenico. Complex networks from classical to quantum. Commun. Phys., 2(1):53, May 2019. doi: 10 . 1038/s42005-019-0152-6
- [5] J. D. Biamonte, P. Wittek, N. Pancotti, P. Rebentrost, N. Wiebe, and S. Lloyd. Quantum machine learning. Nat., 549(7671):195–202, Sept. 2017. doi: 10 . 1038/nature23474
- [6] T. Biedl and G. Kant. A better heuristic for orthogonal graph drawings. Comput. Geom., 9(3):159–180, Feb. 1998. doi: 10 . 1016/S0925-7721(97)00026-6
- [7] K. Börner. Extracting and visualizing semantic structures in retrieval results for browsing. In Proc. DL, pp. 234–235. ACM, New York, 2000. doi: 10 . 1145/336597 . 336672
- [8] U. Brandes and T. Willhalm. Visualization of bibliographic networks with a reshaped landscape metaphor. In Proc. VisSym, pp. 159–164. Eurographics Association, Eindhoven ,The Netherlands, May 2002. doi: 10 . 2312/VisSym/VisSym02/159-164
- [9] W. Chen, F. Guo, D. Han, J. Pan, X. Nie, J. Xia, and X. Zhang. Structure-based suggestive exploration: a new approach for effective exploration of large networks. IEEE Trans. Vis. Comput. Graph., 25(1):555–565, Aug. 2018. doi: 10 . 1109/TVCG . 2018 . 2865139
- [10] P. Das, S. S. Tannu, S. Dangwal, and M. K. Qureshi. ADAPT: mitigating idling errors in qubits via adaptive dynamical decoupling. In Proc. MICRO, pp. 950–962. ACM, New York, 2021. doi: 10 . 1145/3466752 . 3480059
- [11] C. Developers. Cirq. Zenodo, December 2022. doi: 10 . 5281/zenodo . 7465577
- [12] C. Dunne and B. Shneiderman. Motif simplification: Improving network visualization readability with fan, connector, and clique glyphs. In Proc. CHI, p. 3247–3256. ACM, New York, 2013. doi: 10 . 1145/2470654 . 2466444
- [13] D. J. Egger, C. Gambella, J. Marecek, S. McFaddin, M. Mevissen, R. Raymond, A. Simonetto, S. Woerner, and E. Yndurain. Quantum computing for finance: State-of-the-art and future prospects. IEEE Trans. Quantum Eng., 1:1–24, Oct. 2020. doi: 10 . 1109/TQE . 2020 . 3030314
- [14] P. S. Emani, J. Warrell, A. Anticevic, S. Bekiranov, M. Gandal, M. J. McConnell, G. Sapiro, A. Aspuru-Guzik, J. T. Baker, M. Bastiani, et al. Quantum computing at the frontiers of biological sciences. Nat. Methods, 18(7):701–709, Jan. 2021. doi: 10 . 1038/s41592-020-01004-3
- [15] Y. Feng, X. Wang, B. Pan, K. K. Wong, Y. Ren, S. Liu, Z. Yan, Y. Ma, H. Qu, and W. Chen. XNLI: Explaining and diagnosing NLI-based visual data analysis. IEEE Trans. Vis. Comput. Graph., pp. 1–14, Jan. 2023. doi: 10 . 1109/TVCG . 2023 . 3240003
- [16] R. Fickler, M. Krenn, R. Lapkiewicz, S. Ramelow, and A. Zeilinger. Real-time imaging of quantum entanglement. Sci. Rep., 3(1):1–5, May 2013. doi: 10 . 1038/srep01914
- [17] C. Figgatt, A. Ostrander, N. M. Linke, K. A. Landsman, D. Zhu, D. Maslov, and C. R. Monroe. Parallel entangling operations on a universal ion trap quantum computer. Nat., 572(7769):368–372, July 2019. doi: 10 . 1038/s41586-019-1427-5
- [18] M. Ghashami, E. Liberty, and J. M. Phillips. Efficient frequent directions algorithm for sparse matrices. In Proc. SIGKDD, pp. 845–854. ACM, New York, 2016. doi: 10 . 1145/2939672 . 2939800
- [19] M. Ghoniem, J.-D. Fekete, and P. Castagliola. A comparison of the readability of graphs using node-link and matrix-based representations. In Proc. INFOVIS, pp. 17–24. IEEE, Piscataway, 2004. doi: 10 . 1109/INFVIS . 2004 . 1
- [20] C. Görg, P. Birke, M. Pohl, and S. Diehl. Dynamic graph drawing of sequences of orthogonal and hierarchical graphs. In Proc. GD, pp. 228–238. Springer, Berlin, 2005. doi: 10 . 1007/978-3-540-31843-9_24
- [21] A. S. Green, P. L. Lumsdaine, N. J. Ross, P. Selinger, and B. Valiron. Quipper: a scalable quantum programming language. In Proc. PLDI, pp. 333–342. ACM, New York, 2013. doi: 10 . 1145/2499370 . 2462177
- [22] D. Guo, S. Lu, N. Duan, Y. Wang, M. Zhou, and J. Yin. UniXcoder: Unified cross-modal pre-training for code representation. In Proc. ACL, pp. 7212–7225. Association for Computational Linguistics, Dublin, Ireland, 2022. doi: 10 . 18653/v1/2022 . acl-long . 499
- [23] D. Guo, S. Ren, S. Lu, Z. Feng, D. Tang, S. Liu, L. Zhou, N. Duan, A. Svyatkovskiy, S. Fu, M. Tufano, S. K. Deng, C. B. Clement, D. Drain, N. Sundaresan, J. Yin, D. Jiang, and M. Zhou. GraphCodeBERT: Pre-training code representations with data flow. In Proc. ICLR. OpenReview.net, Toronto, 2021. doi: 10 . 48550/arXiv . 2009 . 08366
- [24] S. Hachul and M. Jünger. Drawing large graphs with a potential-field-based multilevel algorithm. In Proc. DG, pp. 285–295. Springer, Berlin, 2005. doi: 10 . 1007/978-3-540-31843-9_29
- [25] S. Hachul and M. Jünger. Large-graph layout algorithms at work: An experimental study. J. Graph Algorithms Appl., 11(21):345–369, Jan. 2007. doi: 10 . 7155/jgaa . 00150
- [26] H. Haleem, Y. Wang, A. Puri, S. Wadhwa, and H. Qu. Evaluating the readability of force directed graph layouts: A deep learning approach. IEEE Comput. Graph. Appl., 39(4):40–53, June 2019. doi: 10 . 1109/MCG . 2018 . 2881501
- [27] D. Han, J. Pan, R. Pan, D. Zhou, N. Cao, J. He, M. Xu, and W. Chen. iNet: visual analysis of irregular transition in multivariate dynamic networks. Front. Comput. Sci., 16(2):1–16, Sept. 2022. doi: 10 . 1007/s11704-020-0013-1
- [28] D. Han, J. Pan, C. Xie, X. Zhao, X. Luo, and W. Chen. A visual analytics approach for structural differences among graphs via deep learning. IEEE Comput. Graph. Appl., 41(5):18–31, July 2021. doi: 10 . 1109/MCG . 2021 . 3097799
- [29] D. Han, J. Pan, X. Zhao, and W. Chen. Netv. js: A web-based library for high-efficiency visualization of large-scale graphs and networks. Vis. Informatics, 5(1):61–66, Mar. 2021. doi: 10 . 1016/j . visinf . 2021 . 01 . 002
- [30] D. Holten. Hierarchical edge bundles: Visualization of adjacency relations in hierarchical data. IEEE Trans. Vis. Comput. Graph., 12(5):741–748, Nov. 2006. doi: 10 . 1109/TVCG . 2006 . 147
- [31] Y. Huang and M. Martonosi. Statistical assertions for validating patterns and finding bugs in quantum programs. In Proc. ISCA, pp. 541–553. ACM, New York, 2019. doi: 10 . 1145/3307650 . 3322213
- [32] T. Hubregtsen, J. Pichlmeier, P. Stecher, and K. Bertels. Evaluation of parameterized quantum circuits: on the relation between classification accuracy, expressibility, and entangling capability. Quantum Mach. Intell., 3(1):1–19, Mar. 2021. doi: 10 . 1007/s42484-021-00038-w
- [33] R. Iten, R. Moyard, T. Metger, D. Sutter, and S. Woerner. Exact and practical pattern matching for quantum circuit optimization. ACM Trans. Quantum Comput., 3(1):1–41, Jan. 2022. doi: 10 . 1145/3498325
- [34] M. Jacomy, T. Venturini, S. Heymann, and M. Bastian. ForceAtlas2, a continuous graph layout algorithm for handy network visualization designed for the gephi software. PloS one, 9(6):e98679, June 2014. doi: 10 . 1371/journal . pone . 0098679
- [35] A. JavadiAbhari, S. Patil, D. Kudrow, J. Heckey, A. Lvov, F. T. Chong, and M. Martonosi. ScaffCC: a framework for compilation and analysis of quantum computing programs. In Proc. CF, pp. 1–10. ACM, New York, 2014. doi: 10 . 1145/2597917 . 2597939
- [36] R. Jozsa and N. Linden. On the role of entanglement in quantum-computational speed-up. Proc. R. Soc. Lond. A., 459(2036):2011–2032, Aug. 2003. doi: 10 . 1098/rspa . 2002 . 1097
- [37] S. Kim, I. Woo, R. Maciejewski, D. S. Ebert, T. D. Ropp, and K. M. Thomas. Evaluating the effectiveness of visualization techniques for schematic diagrams in maintenance tasks. In Proc. APGV, pp. 33–40. ACM, New York, 2010. doi: 10 . 1145/1836248 . 1836254
- [38] D. Koutra, U. Kang, J. Vreeken, and C. Faloutsos. VOG: Summarizing and understanding large graphs. In Proc. SDM, pp. 91–99. SIAM, SIAM, Philadelphia, USA, 2014. doi: 10 . 1137/1 . 9781611973440 . 11
- [39] O.-H. Kwon and K.-L. Ma. A deep generative model for graph layout. IEEE Trans. Vis. Comput. Graph., 26(1):665–675, Aug. 2019. doi: 10 . 1109/TVCG . 2019 . 2934396
- [40] C. Lai, Z. Lin, R. Jiang, Y. Han, C. Liu, and X. Yuan. Automatic annotation synchronizing with textual description for visualization. In Proc. CHI, pp. 1–13. ACM, New York, 2020. doi: 10 . 1145/3313831 . 3376443
- [41] T. K. Landauer, D. Laham, and M. Derr. From paragraph to graph: Latent semantic analysis for information visualization. PNAS, 101(suppl_1):5214–5219, Apr. 2004. doi: 10 . 1073/pnas . 0400341101
- [42] B. Lee, C. Plaisant, C. S. Parr, J.-D. Fekete, and N. Henry. Task taxonomy for graph visualization. In Proc. BELIV, pp. 1–5. New York, 2006. doi: 10 . 1145/1168149 . 1168168
- [43] K. LeFevre and E. Terzi. GraSS: Graph structure summarization. In Proc. SDM, pp. 454–465. SIAM, SIAM, Philadelphia, USA, 2010. doi: 10 . 1137/1 . 9781611972801 . 40
- [44] C. Li, G. Baciu, and Y. Wang. Module-based visualization of large-scale graph network data. J. Vis., 20(2):205–215, May 2017. doi: 10 . 1007/s12650-016-0375-5
- [45] S. Lin, J. Hao, and L. Sun. Quflow: Visualizing parameter flow in quantum circuits for understanding quantum computation. In Proc. SciVis, pp. 37–41. IEEE, Piscataway, 2018. doi: 10 . 1109/SciVis . 2018 . 8823602
- [46] Y. Liu, S. Arunachalam, and K. Temme. A rigorous and robust quantum speed-up in supervised machine learning. Nat. Phys., 17(9):1013–1017, July 2021. doi: 10 . 1038/s41586-019-0980-2
- [47] Y. Liu, T. Safavi, A. Dighe, and D. Koutra. Graph summarization methods and applications: A survey. ACM Comput. Surv., 51(3), June 2018. doi: 10 . 1145/3186727
- [48] A. Maccioni and D. J. Abadi. Scalable pattern matching over compressed graphs via dedensification. In Proc. SIGKDD, pp. 1755–1764. ACM, New York, 2016. doi: 10 . 1145/2939672 . 2939856
- [49] A. Martin, B. Candelas, A. Rodríguez-Rozas, J. D. Martín-Guerrero, X. Chen, L. Lamata, R. Orús, E. Solano, and M. Sanz. Toward pricing financial derivatives with an IBM quantum computer. Phys. Rev. Res., 3:013167, Feb. 2021. doi: 10 . 1103/PhysRevResearch . 3 . 013167
- [50] D. Maslov, G. W. Dueck, D. M. Miller, and C. Negrevergne. Quantum circuit simplification and level compaction. IEEE Trans. Comput. Aided Des. Integr. Circuits Syst., 27(3):436–444, Feb. 2008. doi: 10 . 1109/TCAD . 2007 . 911334
- [51] M. Mathioudakis, F. Bonchi, C. Castillo, A. Gionis, and A. Ukkonen. Sparsification of influence networks. In Proc. SIGKDD, pp. 529–537. ACM, New York, 2011. doi: 10 . 1145/2020408 . 2020492
- [52] Y. Mehmood, N. Barbieri, F. Bonchi, and A. Ukkonen. CSI: Community-level social influence analysis. In Proc. ECML PKDD, pp. 48–63. Springer, Springer, Berlin, 2013. doi: 10 . 1007/978-3-642-40991-2_4
- [53] M. Miller and D. Miller. GraphStateVis: Interactive visual analysis of qubit graph states and their stabilizer groups. In Proc. QCE, pp. 378–384. IEEE, Piscataway, 2021. doi: 10 . 1109/QCE52317 . 2021 . 00057
- [54] C. Mueller, B. Martin, and A. Lumsdaine. A comparison of vertex ordering algorithms for large graph visualization. In Proc. APVIS, pp. 141–148. IEEE, IEEE, Piscataway, 2007. doi: 10 . 1109/APVIS . 2007 . 329289
- [55] S. Navlakha, R. Rastogi, and N. Shrivastava. Graph summarization with bounded error. In Proc. SIGMOD, pp. 419–432. ACM, New York, 2008. doi: 10 . 1145/1376616 . 1376661
- [56] M. A. Nielsen and I. L. Chuang. Quantum Computation and Quantum Information: 10th Anniversary Edition. Cambridge University Press, Cambridge, 10th ed., 2010. doi: 10 . 1017/CBO9780511976667
- [57] S. C. North and G. Woodhull. Online hierarchical graph drawing. In Proc. GD, pp. 232–246. Springer, Berlin, 2002. doi: 10 . 1007/3-540-45848-4_19
- [58] J. Pan, D. Han, F. Guo, D. Zhou, N. Cao, J. He, M. Xu, and W. Chen. RCAnalyzer: visual analytics of rare categories in dynamic networks. Front. Inf. Technol. Electron. Eng., 21(4):491–506, Apr. 2020. doi: 10 . 1631/FITEE . 1900310
- [59] J. Preskill. Quantum computing and the entanglement frontier. CoRR, Mar. 2012. doi: 10 . 48550/arXiv . 1203 . 5813
- [60] J. Preskill. Quantum computing in the NISQ era and beyond. Quantum, 2:79, Aug. 2018. doi: 10 . 22331/q-2018-08-06-79
- [61] H. C. Purchase, E. Hoggan, and C. Görg. How important is the “Mental Map”?–an empirical investigation of a dynamic graph layout algorithm. In Proc. GD, pp. 184–195. Springer, Berlin, 2007. doi: 10 . 1007/978-3-540-70904-6_19
- [62] S. Ruan, Y. Wang, W. Jiang, Y. Mao, and Q. Guan. VACSEN: A visualization approach for noise awareness in quantum computing. IEEE Trans. Vis. Comput. Graph., 29(1):462–472, Jan. 2023. doi: 10 . 1109/TVCG . 2022 . 3209455
- [63] S. Sen, A. B. Swoap, Q. Li, B. Boatman, I. N. Dippenaar, R. Gold, M. Ngo, S. Pujol, B. Jackson, and B. J. Hecht. Cartograph: Unlocking spatial visualization through semantic enhancement. In Proc. IUI, pp. 179–190. ACM, New York, 2017. doi: 10 . 1145/3025171 . 3025233
- [64] Z. Shen, K.-L. Ma, and T. Eliassi-Rad. Visual analysis of large heterogeneous social networks by semantic and structural abstraction. IEEE Trans. Vis. Comput. Graph., 12(6):1427–1439, Sept. 2006. doi: 10 . 1109/TVCG . 2006 . 107
- [65] S. A. Stein, B. Baheri, D. Chen, Y. Mao, Q. Guan, A. Li, B. Fang, and S. Xu. QuGAN: A quantum state fidelity based generative adversarial network. In Proc. QCE, pp. 71–81. IEEE, Piscataway, 2021. doi: 10 . 1109/QCE52317 . 2021 . 00023
- [66] K. M. Svore, A. Geller, M. Troyer, J. Azariah, C. E. Granade, B. Heim, V. Kliuchnikov, M. Mykhailova, A. Paz, and M. Roetteler. Q#: Enabling scalable quantum computing and development with a high-level DSL. In Proc. RWDSL@CGO, pp. 1–10. ACM, New York, 2018. doi: 10 . 1145/3183895 . 3183901
- [67] A. tA v, M. S. ANIS, Abby-Mitchell, H. Abraham, AduOffei, R. Agarwal, G. Agliardi, M. Aharoni, V. Ajith, I. Y. Akhalwaya, G. Aleksandrowicz, et al. Qiskit: An open-source framework for quantum computing, 2021. doi: 10 . 5281/zenodo . 2573505
- [68] B. Tan and J. Cong. Optimal layout synthesis for quantum computing. In Proc. ICCAD. ACM, New York, 2020. doi: 10 . 1145/3400302 . 3415620
- [69] R. Tao, Y. Shi, J. Yao, X. Li, A. Javadi-Abhari, A. W. Cross, F. T. Chong, and R. Gu. Giallar: push-button verification for the qiskit quantum compiler. In Proc. PLDI, pp. 641–656. ACM, New York, 2022. doi: 10 . 1145/3519939 . 3523431
- [70] Z. Tao, Y. Pan, A. Chen, and L. Wang. ShorVis: A comprehensive case study of quantum computing visualization. In Proc. ICVRV, pp. 360–365. IEEE, Berlin, 2017. doi: 10 . 1109/ICVRV . 2017 . 00082
- [71] I. Viola and T. Isenberg. Pondering the concept of abstraction in (illustrative) visualization. IEEE Trans. Vis. Comput. Graph., 24(9):2573–2588, Sept. 2018. doi: 10 . 1109/TVCG . 2017 . 2747545
- [72] X. Wang, Z. Wu, W. Huang, Y. Wei, Z. Huang, M. Xu, and W. Chen. VIS+AI: integrating visualization with artificial intelligence for efficient data analysis. Frontiers Comput. Sci., 17(6):176709, June 2023. doi: 10 . 1007/s11704-023-2691-y
- [73] Y. Wang, Z. Bai, Z. Lin, X. Dong, Y. Feng, J. Pan, and W. Chen. G6: A web-based library for graph visualization. Vis. Informatics, 5(4):49–55, Dec. 2021. doi: 10 . 1016/j . visinf . 2021 . 12 . 003
- [74] B. Weder, U. Breitenbücher, F. Leymann, and K. Wild. Integrating quantum computing into workflow modeling and execution. In Proc. UCC, pp. 279–291. IEEE, Piscataway, 2020. doi: 10 . 1109/UCC48980 . 2020 . 00046
- [75] M. Weiden, J. Kalloor, J. Kubiatowicz, E. Younis, and C. Iancu. Wide quantum circuit optimization with topology aware synthesis. In Proc. QCS, pp. 1–11. IEEE, Piscataway, 2022. doi: 10 . 1109/QCS56647 . 2022 . 00006
- [76] W. Willett, J. Heer, and M. Agrawala. Scented widgets: Improving navigation cues with embedded visualizations. IEEE Trans. Vis. Comput. Graph., 13(6):1129–1136, Nov. 2007. doi: 10 . 1109/TVCG . 2007 . 70589
- [77] Y. Wu, T. Provan, F. Wei, S. Liu, and K. Ma. Semantic-preserving word clouds by seam carving. Comput. Graph. Forum, 30(3):741–750, June 2011. doi: 10 . 1111/j . 1467-8659 . 2011 . 01923 . x
- [78] X. Xie, X. Cai, J. Zhou, N. Cao, and Y. Wu. A semantic-based method for visualizing large image collections. IEEE Trans. Vis. Comput. Graph., 25(7):2362–2377, July 2019. doi: 10 . 1109/TVCG . 2018 . 2835485
- [79] K. Xiong, S. Fu, G. Ding, Z. Luo, R. Yu, W. Chen, H. Bao, and Y. Wu. Visualizing the scripts of data wrangling with SOMNUS. IEEE Trans. Vis. Comput. Graph., pp. 1–1, Jan. 2022. doi: 10 . 1109/TVCG . 2022 . 3144975
- [80] M. Xu, Z. Li, O. Padon, S. Lin, J. Pointing, A. Hirth, H. Ma, J. Palsberg, A. Aiken, U. A. Acar, and Z. Jia. Quartz: superoptimization of quantum circuits. In Proc. PLDI, pp. 625–640. ACM, New York, 2022. doi: 10 . 1145/3519939 . 3523433
- [81] Y. Zhao, L. Ge, H. Xie, G. Bai, Z. Zhang, Q. Wei, Y. Lin, Y. Liu, and F. Zhou. ASTF: visual abstractions of time-varying patterns in radio signals. IEEE Trans. Vis. Comput. Graph., 29(1):214–224, Jan. 2023. doi: 10 . 1109/TVCG . 2022 . 3209469
- [82] Z. Zhou, L. Meng, C. Tang, Y. Zhao, Z. Guo, M. Hu, and W. Chen. Visual abstraction of large scale geospatial origin-destination movement data. IEEE Trans. Vis. Comput. Graph., 25(1):43–53, Jan. 2019. doi: 10 . 1109/TVCG . 2018 . 2864503
- [83] M. Zhu, W. Chen, Y. Hu, Y. Hou, L. Liu, and K. Zhang. DRGraph: An efficient graph layout algorithm for large-scale graphs by dimensionality reduction. IEEE Trans. Vis. Comput. Graph., 27(2):1666–1676, Dec. 2020. doi: 10 . 1109/TVCG . 2020 . 3030447