2021
[1,2]\fnmMichael \surKramer \equalcontThese authors contributed equally to this work.
[1]\fnmKuo \surLiu \equalcontThese authors contributed equally to this work.
1]\orgnameMax-Planck-Institut für Radioastronomie, \orgaddress\streetAuf dem Hügel 69, \cityBonn, \postcode53121, \countryGermany
2]\orgdivJodrell Bank Centre for Astrophysics, \orgnameThe University of Manchester, \orgaddress\streetOxford Road, \cityManchester, \postcodeM13 9PL, \countryUnited Kingdom
Quasi-periodic sub-pulse structure as a unifying feature for radio-emitting neutron stars
Abstract
Magnetars are highly-magnetised rotating neutron stars that are predominantly observed as high-energy sources. Six of this class of neutron star are known to also emit radio emission, and magnetars are, thus, a favoured model for the origin for at least some of the Fast Radio Bursts (FRBs). If magnetars, or neutron stars in general, are indeed responsible, sharp empirical constraints on the mechanism producing radio emission are required. Here we report on the detection of polarised quasi-periodic sub-structure in the emission of all well-studied radio-detected magnetars. A correlation previously seen, relating sub-structure in pulsed emission of radio emitting neutron stars to their rotational period, is extended, and shown to now span more than six of orders of magnitude in pulse period. This behaviour is not only seen in magnetars but in members of all classes of radio-emitting rotating neutron stars, regardless of their evolutionary history, their power source or their inferred magnetic field strength. If magnetars are responsible for FRBs, it supports the idea of being able to infer underlying periods from sub-burst timescales in FRBs.
Neutron stars manifest themselves in a number of classes. Arguably, the most extensively studied one is that of Galactic rotation-powered radio pulsars, with their emission properties investigated across the electromagnetic spectrum lk04 ; pk22 . “Normal” pulsars have an average rotation period of about 0.6 s, but some of those range from a few tens of milliseconds after birth to a few seconds or up to 23 s for old pulsars tbc+18 , or possibly even 76-s Caleb2022 . The ”millisecond pulsars” have periods of a few milliseconds, obtained after a spin-up phase via mass accretion from a binary companion, which “recycles” a previously “dead” radio pulsar to enable it to become radio emitting again.
Among the most energetic neutron stars is the class called “magnetars”, neutron stars with typical rotation periods of 1 - 12 s. They emit high energy outbursts powered by their extremely large ( G) magnetic fields kb17 , which can trigger transient radio emission as seen in six magnetars so far crh+06 ; efk+13 ; kb17 .
Recently, interest in magnetars and their properties heightened further by their possible connection to “Fast Radio Bursts” (FRBs), which are millisecond-long bursts of radio emission from extra-galactic sources lbm+07 ; tsb+13 . The origin of FRBs is not yet understood, but the models discussed are apparently able to explain certain observed FRB features, such as spectra or characteristic frequency sweeps (mml19, ; lyu21, ). Some differences in the emission properties have been identified between signals from FRBs that are observed to repeat sch+14 and those, where no repeating signal has been detected so far chimecat . Currently about 24 FRBs, or about 5% of the detected FRBs, are known to have emitted more than one burst frbstatS . It is not clear whether all non-repeating FRBs will eventually be seen to repeat csrf19 ; jof+20 .
While the verdict on the existence of (at least two) distinct FRB source populations is still out, the origin of repeating FRB signals is clearly associated with non-cataclysmic processes. Soon after the discovery of FRBs, magnetars were speculated to be a possible source of FRBs due to their energetic nature pww+19 . The recent outburst of the Galactic magnetar, SGR J19352154, showed some FRB-like properties brb+20 ; chime1935 ; ksj+21 , lending credence to such an association, although questions, for instance whether magnetar radio emission is luminous enough to explain FRBs, still remain (e.g. bel21 ).
If FRBs are indeed associated with magnetars, one may also expect to detect periodicities in repeating FRBs that are related to the rotation of the underlying neutron star, i.e. in the range of a few seconds to tens or, possibly, hundreds of seconds. However, an attempt to find a periodicity between 1 ms and 1000 s, for instance, in hundreds of bursts from FRB 20121102A has not been successful dwz+21 . In contrast, on sub-burst timescales, quasi-periodic sub-structure was reported mpp+21 ; abb+22 ; pvb+22 for several bursts from FRBs, though we note that the significance of some detections has been questioned pvb+22 . Such FRB sub-burst structure has been likened to quasi-periodic “micropulses” seen in radio pulsars (e.g. Ref. mpp+21 ).
The short-duration micropulses in radio pulsars have a typical width, , and often appear quasi-periodically with a quasi-periodicity, . They are often superimposed on top of wider sub-pulses comprising the individual pulses for each rotationlk04 . It has been long established for normal, non-recycled pulsars that both and scale with the rotational period, , and tmh75 ; cor79a ; kjv02 . Recently, it has also been found that micropulses (also called “microstructure”) can be observed in recycled millisecond pulsars dgs16 ; lab+22 at very short periods, which follow the same trend. Hence, while the names “microstructure” or “micropulses” were coined after discovering this emission feature in observations of pulsars with slow spin periods (in the approximate range of 0.2-3 s) han71 ; cor79a , in light of an increasing range of timescales (see below), we suggest that it is more appropriate to refer to it as “quasi-periodic sub-structure” that is linked to the pulsar rotation period.
In this work, we show that this quasi-periodic sub-structure is detectable in members of all sub-classes of radio emitting neutron stars, especially in radio-loud magnetars, and that the previously observed dependence of sub-structure quasi-periodicity on rotational period is still obeyed. This may support attempts mpp+21 ; lab+22 ; pvb+22 to potentially infer underlying rotational periods from FRBs, if they were indeed emitted by extra-galactic magnetars. More importantly, however, the observation provides a unifying feature that links the radio emission of members in all sub-classes of radio emitting neutron stars.
Data
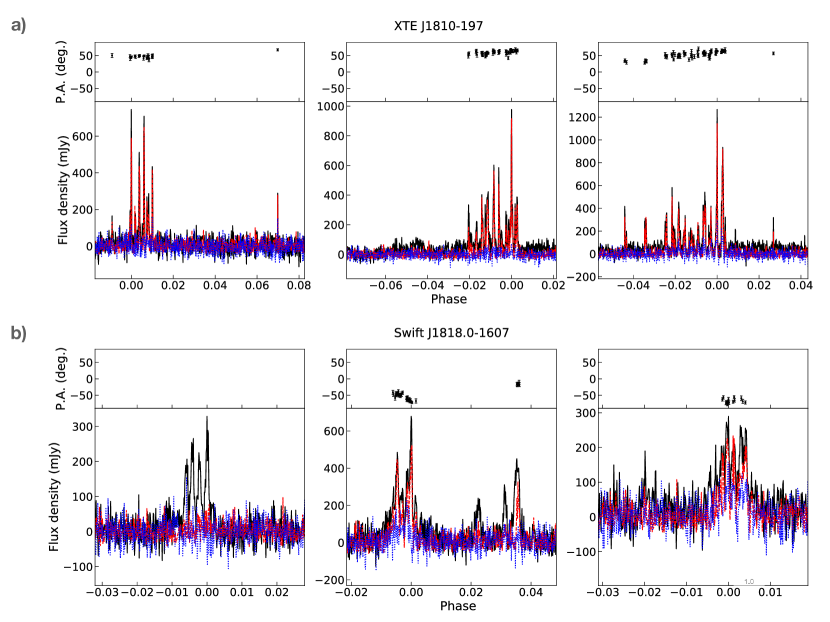
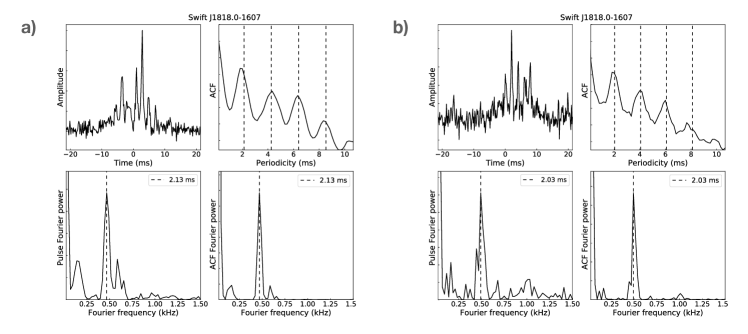
To perform this study, we collected data from all radio-loud magnetars known so far: XTE J1810197, Swift J1818.01607, PSR J16224950, 1E 1547.05408 (also known as PSR J15505418), PSR J17452900 and SGR J19352154. In addition, we included the recently discovered source GLEAMX J162759.5523504.3, which has also been considered as an ultra-long period magnetar hzb+22 . Due to the typically flat flux density spectrum of radio-loud magnetars, our study has been conducted using data obtained at relatively high radio frequencies (i.e. typically several GHz), with the exception of GLEAMX J162759.5523504.3, which was only seen at frequencies below 230 MHz. For XTE J1810197 and Swift J1818.01607, we conducted new polarisation observations of individual pulses using the Effelsberg 100-m radio telescope (Methods). for each of the two sources, the observations took place at 6 GHz on three different epochs (see Table 1). The data were recorded as a filterbank in all four Stokes parameters, with a total bandwidth of 4 GHz and time and frequency resolution of 131 s and 0.976 MHz, respectively. We removed the frequency dependent time delay caused by free electrons along the line of sight and formed a series of pulses which correspond to each individual rotation of the magnetar (i.e., single-pulse data). The single-pulse data were then calibrated for polarisation and flux density and cleaned to remove radio interference. For the rest of the sources, the data were collected from either public archives or published literature and analysed accordingly. See Methods for more details.
Results
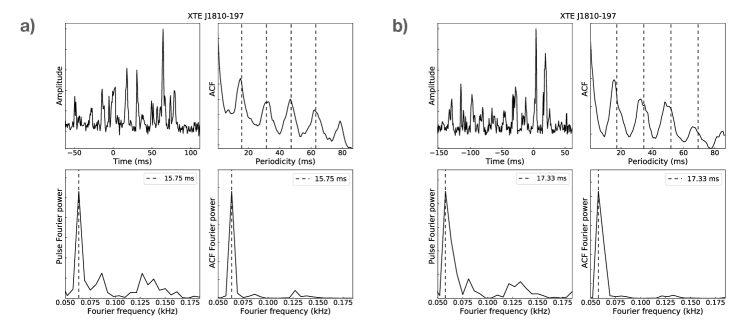
The best studied radio-detected magnetar is XTE J1810197 crh+06 . Quasi-periodic sub-structure in its pulses was suggested during its first phase ssw+09 and more recent phase Maan2019 ; crd+22 of radio emission. Even though neither work reported a value for the quasi-periodicity, our result appears to be fully consistent with the previous qualitative discussion.
With this work, we have demonstrated the existence of quasi-periodic substructure in all radio-loud magnetars (see Figure 1), except for SGR J1935+2154 for which there are too few detected pulses with sufficient time resolution so far to make a clear detection (see Methods). We note, however, that very recently fine-structure was reported in sub-pulses on time scales of 5 ms zhu23 .
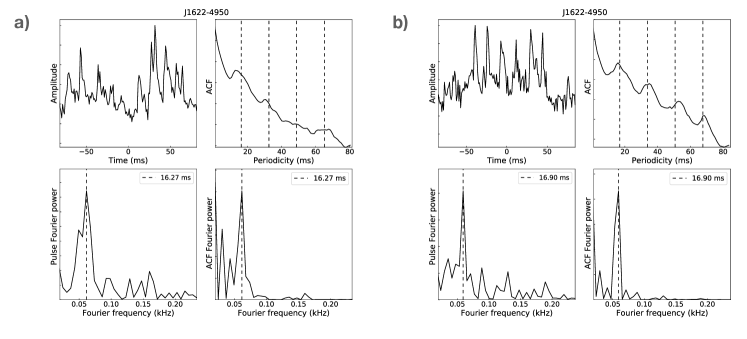
The ability to detect quasi-periodic sub-structure depends crucially on the available time resolution and the signal-to-noise ratio, while the strength of the source can vary with time, especially for magnetars (e.g. Ref. ljk+08 ). But even under similar observing conditions, quasi-periodic sub-pulses are not ubiquitous and are not detectable all the time. For instance, the magnetar PSR J16224950 shows such structure very prominently in observations in 2017, but less clearly before or later in 2018 (see Methods). This is very similar to what is also observed in normal pulsars lkwj98 . Therefore, it is possible that SGR J19352154 may reveal quasi-periodic sub-structure in a later, larger samples of pulses (see e.g. zhu23 ).
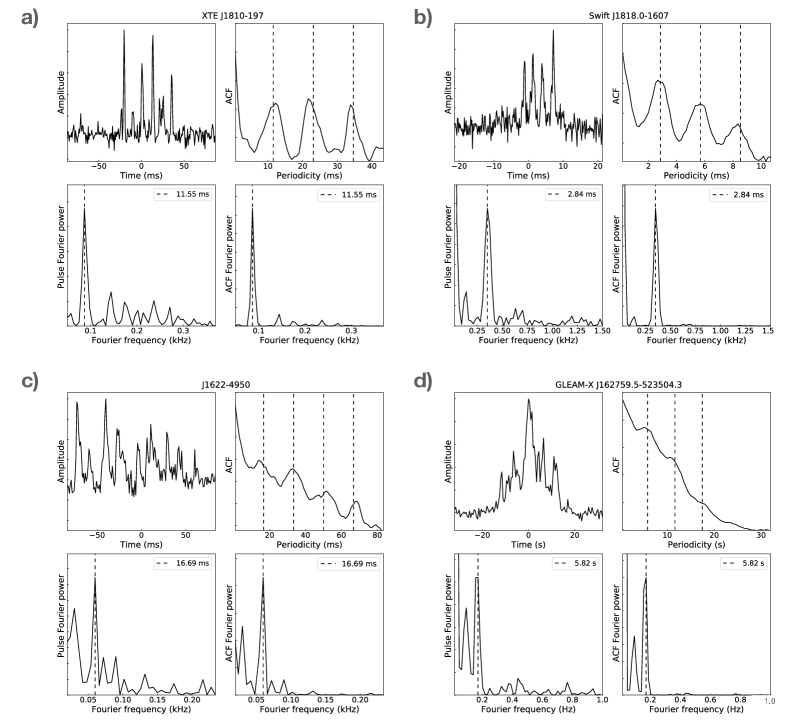
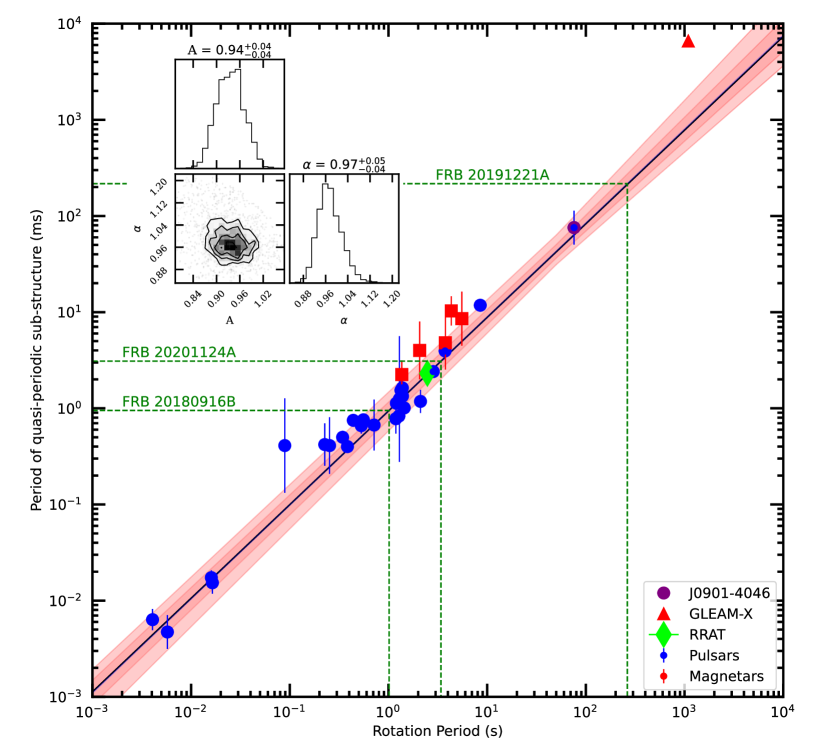
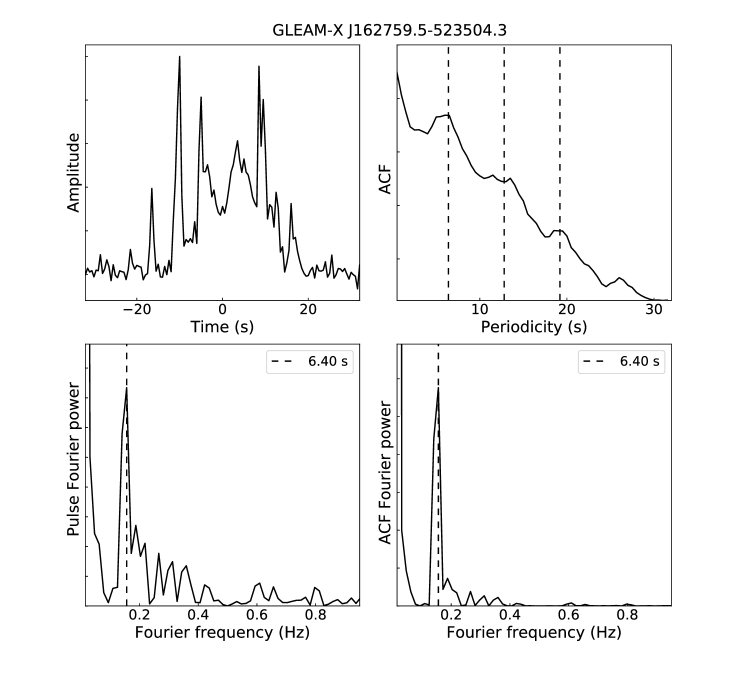
Examples of the detected quasi-periodic sub-structure from four of the sources, XTE J1810197, Swift J1818.01607, J16224950, and GLEAMX J162759.5523504.3 are displayed in Figure 1. We measure the quasi-periodicities () and widths () and list them in Table 2, which also summarises values compiled from the literature (see Methods). Similar to normal pulsars lkwj98 and millisecond pulsars lab+22 (Table 3), when quasi-periodic sub-structure is detected (see Methods), we measure a range of values forming a source-specific distribution (with one or two clearly preferred values) for the typical quasi-periodicities and widths measured (see e.g. Supplementary Information). Using the geometrical mean as a robust measure, the values of quasi-periodicities measured for magnetars are shown as red symbols in Figures 2, 3 & 4. Strikingly, magnetars do not only show quasi-periodic sub-structure, but its quasi-periodicity also follows the exact same scaling with rotational period that was established for normal pulsars and millisecond pulsars (Figure 2). This even extends to the recently discovered 76-s PSR J09014046, where pulses are also observed to show a set of (otherwise well-defined) quasi-periodicities in single pulses Caleb2022 . As pointed out, the source establishes the existence of ultra-long period neutron stars and also suggests a possible connection to magnetars Caleb2022 .
One can even go further by considering the, also recently discovered, pulsating radio source GLEAM-X J with a period of s, which is also speculated to be an ultra-long period neutron star or, specifically, an old magnetar hzb+22 . We have analysed the available data and also identified quasi-periodic sub-structure in its pulses (see Methods). But, just as discussed for magnetars and normal pulsars, it is only detectable in a limited range of epochs. The measured quasi-periodicity is somewhat larger than a scaling would suggest, i.e., we measure a value of s. While we discuss this further below, the measurement nevertheless fits the general trend, extending the observed relationship to about six orders of magnitude. Fitting a power-law to the whole range of sources, we obtain , confirming the previously inferred scaling of tmh75 ; cor79a ; kjv+10 determined for normal pulsars alone.
Very interestingly, the recent discovery of a Rotating Radio Transient (RRAT), RRAT J19180449, with the Five Hundred Meter Aperture Spherical Telescope, allows to resolve and for the first time detect quasi-periodic sub-structure in pulses from RRATs cwy+22 . The measured quasi-periodicity agrees perfectly with our scaling law (see Figure 2).
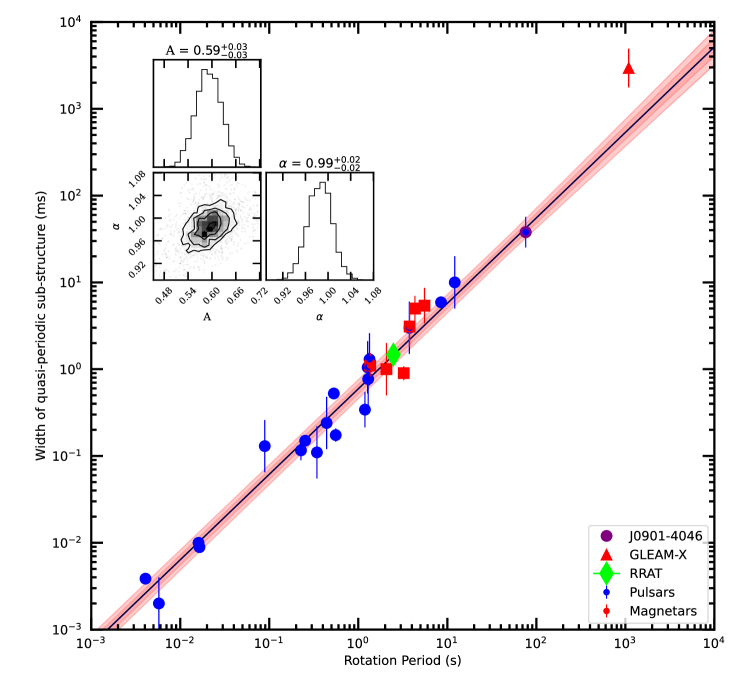
The measurements of the sub-structure width, , are sometimes more difficult to obtain than those of quasi-periodicities, as pointed out for normal pulsars mar15 . This results in fewer measurements or larger uncertainties, but we also find a linear scaling with rotational period as shown in Figure 4 and express this fit to the data as . This is consistent with previous findings from normal pulsars alone, but now also expanded in period range and, in particular, in type of radio-emitting neutron star.
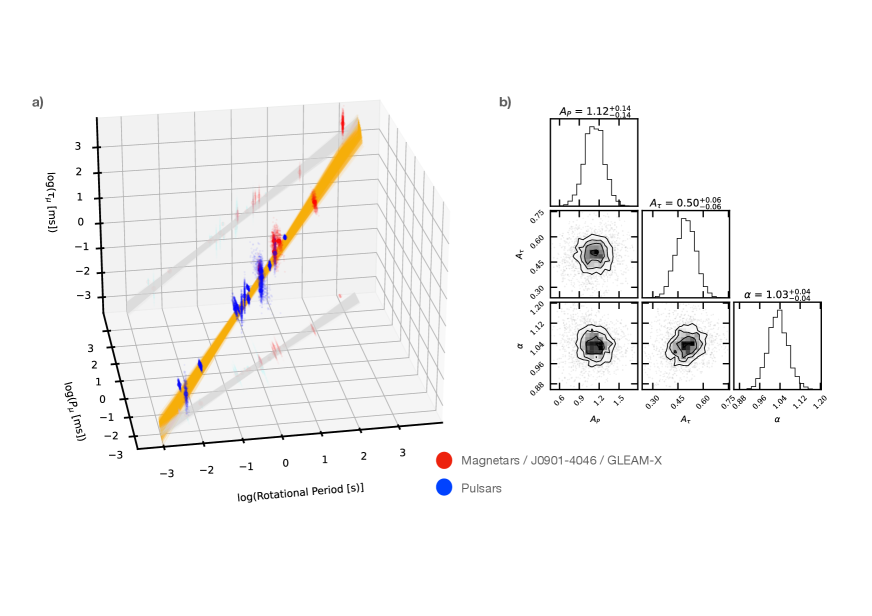
Given that both independently measured quantities, and , obviously depend on rotational period, , we also perform a joint fit for those sources, where both measurements can be made. We determine the joint power law index, , and the independent scale factors, and , i.e. (ms)(s)α and (ms)(s)α. We again confirm a linear dependency on rotational period, , while the spacing of the quasi-periodic sub-pulse structure is approximately twice their width, i.e. and . The results are shown in Figure 3.
Discussion
We have established an universal relationship between the rotational period and emission features that can be found in members of every type of radio-emitting neutron star. The relationship scales simply with rotational period and applies regardless of the formation or evolutionary history of the neutron star, its presumed energy source, or the regularity (or sporadicity) of its radio emission.
The relationship extends over about six orders of magnitude. But some deviations are observed. Firstly, the quasi-periodic sub-structure seen in magnetar pulses is not always present and, secondly, the periodicities vary to some extent, leading to a classification as a quasi-periodicity within a pulse and leading to a narrow distribution of quasi-periods from pulse-to-pulse that is nevertheless specific for a given source. But this is also well known for many normal pulsars and was also recently established for the 76-s PSR J09014046, and shown here for GLEAMX J162759.5523504.3. In other words, the similarity goes beyond the existence of the scaling relationship itself. Future measurements will help to establish and constrain the range of values further to identify more commonality.
The scatter in the measurements around the predicted values is clearly caused to some extent by the observed fluctuation in periodicities around preferred values. We can speculate whether the measured magnetar periodicity values really tend to be somewhat physically larger than those values for normal pulsars, as suggested by Figure 2, but the deviations by themselves are hardly statistically significant given the uncertainties (see Methods). Similar thoughts should also apply to the measurements for GLEAM-X J. But here, we also note that unlike for the other magnetars studied here, the observations of GLEAM-X J were made at a rather low frequency of MHz.
Even though pulsar sub-structure properties are usually consistent across large frequency ranges (e.g. cor79a ; lkwj98 ), observations at lower frequencies could possibly lead to broader sub-structures and larger spacing compared to the much higher radio frequencies used here otherwise (see e.g. kjv02 ). At the moment, the limited range of available epochs prevents further studies.
The origin of the quasi-periodic sub-structure in the radio emission has been a matter of debate since it was first discovered in normal pulsars. It was interpreted either as a temporal or angular phenomenon cor79a . A temporal phenomenon would suggest emission patterns which originate ultimately from processes in the interior or on the surface of neutron stars (e.g. cr04c ). In contrast, interpreting the observations as an angular pattern, the quasi-periodic sub-structure represents “beamlets” of a characteristic angular width that sweep across the observer with the pulsar rotation cor79a . It has already been argued for normal pulsars kjv02 that a -correlation is more naturally explained as an angular pattern. Given the extent of the relationship in period space and to members of all types of radio-emitting neutron stars, an angular beamlet interpretation of the quasi-periodic sub-structure appears as the only viable explanation. Interestingly, recent work tom21a ; tom21b appears to derive the exact relationship that we see in Figure 2. Applying their experience with Tokamak fusion experiments, it connects radio emission of rotating neutron stars to slow tearing instabilities feeding off an inhomogeneous twist profile within the open pulsar circuit tom21a . In this picture, radio emission occurs in the form of coherent curvature emission created by Cerenkov-like instabilities of current-carrying Alfven waves in thin current sheets with relativistic particle flow tom21b . The model, which is also applicable to magnetars, predicts that beamed radio emission is created from packets of charged particles, with quasi-periodic sub-structure being a natural consequence. The encountered timescales are constrained by relativistic beaming, deriving a scaling relationship where the relevant timescale depends only on the angular frequency and an effective gamma-factor, , i.e. , predicting a period dependency of the order of tom21b , as we observe. Even though a range of size structures may be present in the current profile in the pulsar circuit, possibly explaining the fluctuation in the observed quasi-periodicities of a particular source, only the largest are visible due to the smearing effect of relativistic emission tom21a ; tom21b . The universality of the scaling law shown here suggests that the effective gamma-factor may be the same for all radio emitting neutron stars, i.e. .
The fundamental dependence of emission sub-structure (i.e. quasi-periodicities and also pulse width, see Figures 2, 3 & 4) on rotational period among all types of radio-loud rotating neutron stars is especially intriguing for the magnetic-field powered magnetars, even though young (rotation powered) pulsars and magnetars have been known to show some similarities in their emission features ksj+07 ; pk22 ; Radio pulsars usually have a steep flux density spectrum lk04 , while the spectrum of younger pulsars tend to be flatter jvk+18 and that of magnetars is usually very flat or even inverted ljk+08 ; torne22 or may also be complex sometimes Lower2020 .
In contrast, the polarisation features of magnetars and young and energetic pulsars (defined here as those with erg s-1) are very similar. The latter often show a very large degree of linearly polarised emission (wj08, ), while magnetars are also typically 100% linearly polarised ksj+07 ; pk22 . The corresponding position angle (PA) of the average pulse profile of pulsars usually shows a distinct variation as a function of pulse duration (wj08, ), but it tends to be flatter or irregular for magnetars ksj+07 ; pk22 . However, quasi-periodic sub-structure from individual rotations in normal pulsars can also exhibit an apparently flat PA swing mar15 . Our observations (see Figure 5) clearly demonstrate that this is also the case for polarised quasi-periodic sub-structure emission in magnetars.
It has been noted before that these magnetar polarisation features are akin to those of bursts from repeating FRBs hsm+21 , although exceptions exist Luo2020 ; ksl+21 . If magnetars are indeed responsible for (some or all) FRBs, suggestions that quasi-periodic sub-structures in FRBs may be similar to that in normal pulsars phl19 ; abb+22 ; lab+22 would imply that similar plasma processes (and not vibrations of the neutron star mvh88 ) are responsible. If periodicities abide by the same scaling law, one can follow suggestions mpp+21 ; lab+22 ; pvb+22 to use the observed timescales for deriving the underlying rotation period, as also demonstrated in Fig. 2. In this case, one may wonder why underlying rotation periods have not yet been detected, e.g. in detailed studies of FRB repeaters such as Ref. dwz+21 . However, the ability to find a periodicity can be hampered severely if the pulse window were to extend over a significant fraction of the rotational period lbh+15 . Indeed, magnetar radio emission tends to have much wider duty cycles than normal pulsars pk22 . For instance, PSR J16224950 emits across almost the full rotation lbb+10 . A large pulse duty cycle may be caused by a non-dipolar magnetic field structure in magnetars, and implies a generally much wider beam than for normal pulsars, covering a much wider area of sky. If that were also the case for FRBs, it would reduce the number of FRBs inferred from population studies accordingly.
In summary, we have demonstrated the existence of quasi-periodic sub-structure in the radio emission of members of all types of radio-emitting rotating neutron stars, regardless of their evolutionary history, their power source or their inferred magnetic field strength. Whether magnetars are related to FRBs remains to be seen, but we have shown that quasi-periodic emission structures exist in the individual pulses of radio-loud magnetars, often showing a high degree of polarisation with flat position angles, that follows the same dependence on rotational periods as found for normal and millisecond pulsars. This universal relationship now spans six-orders of magnitude in rotational period. Considering the various types of radio-emitting neutrons stars as whole, we obtain tantalising insight that all appear to share some similar fundamental processes in their magnetosphere.
Methods
Observations and data collection
The data utilized for this study result from new observations, re-analysed archival data and published results, covering all six radio-detected magnetars known to date. New observations of two magnetars, XTE J1810197 crh+06 and Swift J1818.01607 ccc+20 , were carried out each on three epochs using the Effelsberg 100-m telescope and its CX-band receiver which covers observing frequencies of 4–8 GHz. Data acquisition was made with a pulsar backend consisting of two units of the second generation of the Reconfigurable Open Architecture Computing Hardware developed with the Field Programmable Gate Array technique by the CASPER teamcasper . The data were recorded in 8-bit samples stored in psrfits search mode format hsm04 , with a time resolution of 131 s and 4096 frequency channels. Single pulse data with specifications detailed in Table 1 were extracted from the search-mode data stream; this used the psrfits_utils software toolkit (see https://github.com/demorest/psrfits_utils) and an ephemeris obtained from our regular timing program on these two sources. Dispersion measures (DMs) of 178.0 and 703.0 cm-3 pc were used to de-disperse the data of XTE J1810197 and Swift J1818.01607, respectively crh+16 ; ccc+20 . Next, the single-pulse data were calibrated for polarisation, flux density and cleaned for radio interference using the psrchive software package hsm04 . Polarisation calibration was obtained using information from an injected noise diode signal associated with the pulsar observation. The data were flux-density calibrated using an exposure on the calibration source NGC 7027 and its catalogued flux density spectrum zvp08 . Finally, rotation measures (RMs) of 74.44 and 1442 rad m-2 were applied to the data of XTE J1810197 crh+06 and Swift J1818.01607 crh+16 ; ccc+20 , respectively, to correct for interstellar Faraday rotation in the linear polarisation component.
Data of magnetar J16224950 measured at 3.1 GHz with the Parkes telescope lbb+10 were obtained from the public ATNF data archive (see https://atoa.atnf.csiro.au); the selection of data focused on epochs when the magnetar was exceedingly bright allowing for detailed single-pulse analyses. These data are available in psrfits search format with total intensity information and specifications detailed in Table 1. They were processed to generate single-pulse data with the dspsr software package, an ephemeris obtained from Ref. scs+17 and a DM of 820 cm-3 pc.
Pulsation data on the magnetar-like periodic radio transient GLEAMX J162759.5523504.3 were obtained from the data archive published by hzb+22 . The observations were carried out with the Murchison Widefield Array at 88 MHz to 215 MHz. In addition, we obtained information on pulse properties of magnetar 1E 1547.05408 from data retrieved from the ATNF archive, and collected information from the literature on the well-studied Galactic Centre magnetar, PSR J17452900, and the sparsely detected SGR J1935+2154 (see the next section for details).
Measurement of magnetar sub-structure’s widths and quasi-periodicities
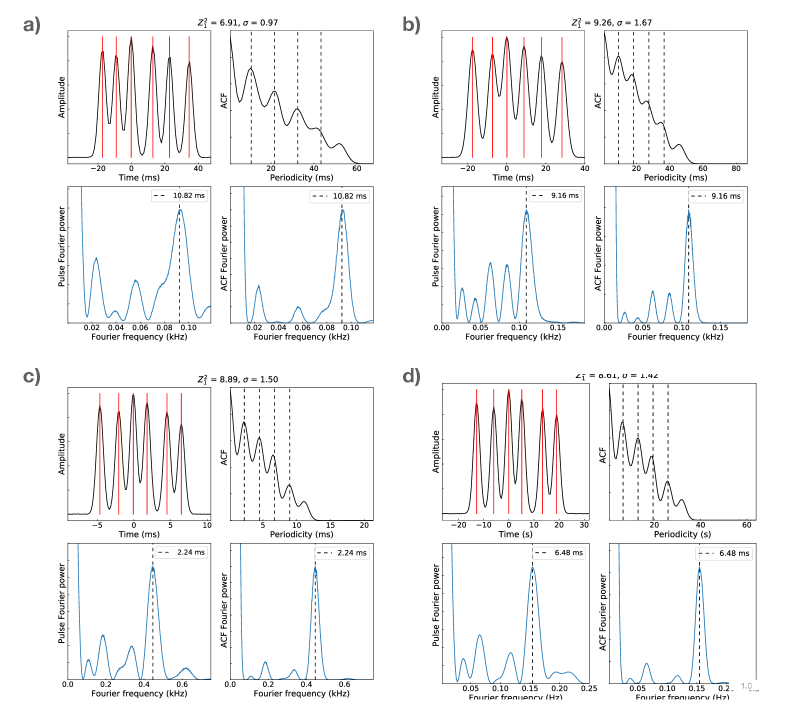
XTE J1810197, Swift J1818.01607, PSR J16224950 and GLEAMX J162759.5523504.3: For these three magnetars and the GLEAM source, the sub-structure’s quasi-periodicities and widths were measured using the auto-correlation analysis. The methodology of this analysis is well summarised in Section 7.4.2.2 of Ref. lk04 and many other publications (e.g., tmh75, ; cor76a, ). Here, the first principle of this methodology is also shown in the sketch in the Supplementary Information. For a given waveform , its auto-correlation function (ACF) is defined as:
| (1) |
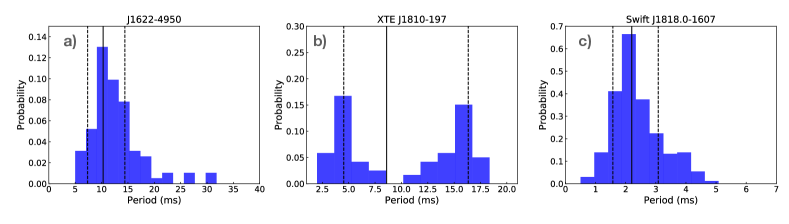
When there is quasi-periodic structure in the pulse, it manifests itself by exhibiting a sequence of equally spaced local maxima in the ACF. The time lag of the first local maximum corresponds to the characteristic separation, i.e., quasi-periodicity of the sub-structure, while those of the rest equal to incremental numbers times the periodicity (see Supplementary Information). Thus, the value of the characteristic quasi-periodicity can be defined as the first local maximum in the ACF. In order to search for quasi-periodic sub-structure and to determine a value for the periodicity, we first calculated the ACFs for all of the single pulses in our data. Then we used a Fourier Transform to calculate the Power Spectral Density of each of the pulse and its ACF, and in both identified a set of maxima each of which may correspond to the presence of a periodicity. Next we cross-checked the two groups of maxima and kept those which were reported in both (within 20% difference in values) as candidates of the periodicity. Finally, we visually checked the pulse profile and its ACF, and noted the pulse as a detection only when at least one of the reported periodicity corresponds to a real periodic feature in both the profile and its ACF. The shortest reported candidate periodicity was recorded as the value of the detected quasi-periodicity in the pulse. In total, 452, 4126, 208, 12 pulses from XTE J1810197, Swift J1818.01607, PSR J16224950 and GLEAMX J162759.5523504.3, respectively, were investigated and the number of pulses detected with quasi-periodic sub-structure were in turn 77, 400, 93, 2. The results are displayed in corresponding Figures of the Supplementary Information. We note that for XTE J1810197 we observe a bimodal distribution of periodicities, as it is occasionally observed for normal pulsars mar15 . We note that our derived value is at the lower end implied by the averaged ACF shown by Ref. crd+22 , whereas a value reported by Ref. Maan2019 is consistent with the first peak of our distribution.
We also measured the width of the sub-structure using the ACF analysis. As in our data the inverse of the channel bandwidth is smaller than the used sampling times, the width can be defined as the first turning point in the ACF from zero lag (see Supplementary Information). Its value corresponds approximately to the Full Width at Half Maximum of the sub-structure cwh90 ; lkwj98 . To obtain the turning point for each pulse, a spline fit was conducted to the ACF starting from the first non-zero lag bin until the first bin before the identified quasi-periodicity, which reported a group of detected knots. Then all reported knots were visually inspected together with the ACF, to identify the exact one that corresponds to the first turning point in the ACF for each pulse.
As observed for normal pulsars, not all individual pulses exhibit identifiable quasi-periodic sub-structure. Also similar to normal pulsars, a limited range of periodicities can sometimes be observed. This is caused by a mixture of intrinsic variation, the occurrence of harmonically related quasi-periodicities, or instrumental and observational constraints (see e.g., cor76a ; lkwj98 ). For this reason, we studied the distribution of values measured for the ensemble of studied pulses. In order to account for possible cases where the histogram does not show a single, clearly identifiable peak, we refer to the geometric mean as our preferred values as a robust method to determined a preferred value. In Table 2 we quote uncertainties of the geometric mean, , expressed in the form of the geometric standard deviation (GSTD) factor, , defining a range from to . We also quote the mean, the error of the mean and the median for comparison.
There are three more magnetars that have been detected at radio frequencies: 1E 1547.05408 (also known as PSR J15505418) crhr07 , the Galactic Centre magnetar PSR J17452900 efk+13 and SGR J19352154 brb+20 ; chime1935 ; ksj+21 . Below we discuss the obtained sub-structure properties for these sources in turn, using partly archival data and previously published results.
1E 1547.05408: This 2.1-s magnetar showed strong transient radio emission, especially after its 2009 outburst camilo2009 . Retrospectively, for this outburst, two strong radio pulses were reported recently ibr+21 , which saturated the 1-bit digitisation of the observing system and potentially distorted the pulse signal. Thus, we chose to study a different observation with the Parkes telescope from 2009, February 25, (MJD 54887), UT, at 8.3 GHz. With a time resolution of 1 ms, this 30-min observation reveals very narrow pulses leading the main pulse by about 500 ms. To our knowledge, these features have not yet been reported. The recorded sub-integrations contain 9 periods each, but the spacing of these pulse suggests that they are the result of single bright bursts occurring at slightly different rotational phases during the folded 18 s. The pulses are consistent with having a width ms. Inspecting the spacing of these pulses, one can infer a periodicity of about 4 ms. These estimates are consistent with an analysis of further search-mode data accessible from the archive and recorded during 2016 and 2017, although the available time resolution here is also limited to 1 ms. Given these constraints, we consider these measurements with caution but list them for completeness with a GSTD of 2.0.
J17452900: This magnetar exhibits the longest duration of uninterrupted detectable radio emission since its first detection in the radio in 2013 efk+13 . The profile has been observed to be very variable in frequency tek+15 and on short and long timescales wcc+19 , with its strength diminishing in recent years scc+21 . The strong background emission from Sgr A* combined with the relatively long period of 3.76 s causes significant red noise in single-dish timeseries measurements, and with a very large dispersion measure of pc cm-3, this implies that high-frequency observations with interferometers are best suited to study the existence of quasi-periodic sub-structure. Summarizing the wealth of observations, the broad pulse envelope often reveals partly overlapping subpulses with clearly discernable short pulses (see e.g. Figure 3 of pwp+18 of Figure 4 of Ref. wcc+19 ). The typical intrinsic width of individual emission components is found to be as short as 1.6 ms wcc+19 or 1.8 ms pwp+18 . Such narrow components, when resolvable, are separated from each other, often in a quasi-periodic fashion, with typical separations from ms (see Figures 4 and 8 of wcc+19 ) to about ms (see Figure 3 of pwp+18 ). More often these emission features are somewhat wider and blend into each other, overlapping at about a sub-structure width. The most common pulse width for all components is either 3.2 or 6.4 ms wcc+19 . This is consistent with recent pulse width of ms measured between 4.4 and 7.8 GHz and corrected for interstellar scattering scc+21 . For our purposes, we account for the variety of measurements by computing the geometrical mean from the above values, i.e. a pulse width of 3.1 ms (with a GSTD of 1.7, cf. Figure 5 of wcc+19 ) and a quasi-periodicity of 4.8 ms (GSTD 1.9).
SGR J19352154: Efforts to detect radio emission from this 3.24-s magnetar following its outbursts had failed repeatedly, providing stringent upper limits on existence of detectable radio emission ykj+17 . In contrast, on April 28, 2020, both the CHIME chime1935 and STARE2 stare1935 telescopes detected the same short radio burst from a direction consistent with that of SGR J19352154, which were followed by a sequence of detections within a short time window (e.g., ATEL14074, ; ATel14080, ; ATel15681, ). Both CHIME and STARE2 measured a DM around 333 pc cm-3. The CHIME data observed between 400 and 800 MHz revealed two sub-bursts with widths determined to 0.585(14) ms and 0.335(7) ms, respectively, after correcting for apparent effects of multi-path scattering (with a thin-screen scattering timescale of 0.759(8) ms when referenced to 600 MHz). Both components were separated by 28.91(2) ms. The STARE2 data taken at higher frequencies between 1280 MHz and 1530 MHz showed no significant evidence for scattering stare1935 . Nevertheless, because CHIME adopted a scattering model, they also fitted a corresponding model, deriving an apparent intrinsic width of 0.61(9) ms and a scattering timescale of 0.4(1) ms when referenced to 1 GHz. Scaling the CHIME scattering time to the same frequency, using the expected radio frequency dependency of tsb+13 , one finds 0.098(1) ms, which is clearly inconsistent with the STARE2 measurement. Further detections of radio pulses to clarify this matter turned out to be difficult. Observations of the magnetar with the FAST telescope on April 30, 2020, detected a weak radio pulse with a DM consistent with the CHIME and STARE2 events. While this indicated that all three radio pulses were emitted by the magnetar, a reliable width measurement was not reported atelFASTdetect . Further follow-up radio observations had mixed successes, mostly reporting non-detections (see e.g. Refs. bbb+21 ; yhb+22 and references therein), including even deep unsuccessful FAST observations lzw+20 . A later successful detection with FAST appeared again to be too weak to study the pulse properties 1935weiwei . More recently, however, using over 500h of follow-up observations, two further radio bursts from the magnetar were reported ksj+21 . These bursts showed an observed width of 0.866(43) ms and 0.961(48) ms, respectively, separated in time by about 1.4 s, at a frequency of 1324 MHz. Attempts to fit a scattering tail to the slightly asymmetric burst shapes, derived scattering timescales of 0.315(12) ms and 0.299(29) ms, respectively. At a reference frequency of 1 GHz, this would amount to an average of about 0.952(21) ms, for the expected frequency scaling. Since the three measured timescales are barely consistent with each other, unless one postulates an unusually flat frequency dependence, we follow the discussion in Ref. ksj+21 . and their suggestion that it is more straightforward to reconcile the measurements by assuming that the slight asymmetries observed in the bursts are actually intrinsic. As the -timescale of pulse smearing due to scattering can be usually accounted for, to first order, by adding the widths in quadrature, we derive from the published value estimates for the originally observed pulse width as follows: 0.73(36) ms for the STARE2 detection, 0.96(48) ms and 0.93(41) ms for the two CHIME sub-bursts, respectively. Computing the geometric mean of all five measurements, we derive 0.88 ms and with a GSTD of 1.2. The paucity of events registered for SGR J19352154 prevents a study of possible periodicities within the magnetar bursts beyond noting that the two CHIME components were separated by 28.91(2) ms. We note, however, that very recently fine-structure was reported in sub-pulses on time scales of 5 ms zhu23 .
Measurement of pulsar sub-structure widths and quasi-periodicities
The period-scaling of pulse sub-structure timescales and periodicities was already established for normal pulsars in the late 1970s. Since then many more measurements have been made, and we make an attempt to compile them here. Meanwhile, quasi-periodic sub-structure has been also detected in a sample of millisecond pulsars, which we also include to expand the study of the period-scaling to the shortest periods. In recent years, a number of pulsars have been discovered with periods above 10 s and even more recently with even larger periods, as discussed above.
Normal pulsars: Quasi-periodic sub-structure known as “microstructure” has been studied extensively for normal pulsars, measuring both width and quasi-periodicities. We compiled a list of values for normal pulsars from Refs. tmh75 ; cor76a ; cor79a ; cwh90 ; lkwj98 ; kjv+10 and references therein. We also used quasi-periodicity measurements presented in Ref. mar15 , reevaluated some of their measurements for weak pulsars, based on the data provided by the authors with the publication. In cases where values differed across different studies, we again computed the geometrical mean and GSTD factors as shown in Figure 2.
Fast-spinning millisecond pulsars: In recent years, measurements of quasi-periodic sub-structure have also become available for fast-rotating millisecond pulsars using high-sensitivity and high-time-resolution observations dgs16 ; lab+22 . As for normal pulsars, we do not consider measurements of giant pulses (and their nanoshots) as they may have a different origin compared to regular pulsar radio emission lk04 , but concentrate on the studies of normal pulses emitted by millisecond pulsars. The combined measurements for both the width and quasi-periodicity follow the period scaling as pointed out by Refs. cor79a ; kjv+10 ; dgs16 ; lab+22 .
Long-period radio pulsars: Since magnetars share the same period range as long-period pulsars, we also include unusually slowly rotating pulsars, namely the 8.5-s PSR J21443933, the 12.1-s PSR J22513711 and the 23.5-s PSR J02505854. Recently, the presence of quasi-periodic sub-structure was reported for PSR J21443933 mbma20 , with an estimate of sub-structure quasi-periodicity (as a median derived from a distribution of 355 single pulses) of ms. The width of the sub-structure shown in Ref. mbma20 is consistent with a value half this size, hence we estimate . We convert this into corresponding estimates for the geometric means accordingly.
For J22513711, Ref. mke+20 presents single pulses with sub-pulses with a typical width of 4 to 16 ms. No clear quasi-periodic sub-structure is visible, but we tentatively adopt a typical sub-structure width of ms, or in terms of a geometric mean of 9.8 ms with a GSTD of 1.6.
PSR J02505854’s average profile and single pulses show differences across frequencies awb+21 . Single pulses have only been detected confidently at at 320 MHz, where the strong individual pulses appear only in the first pulse component. However, no reliable detection of quasi-periodic sub-structure can be made from the published data, preventing us from including it in our analysis.
Rotating Radio Transients (RRATs): This sub-set of rotating neutron stars emits radio pulses sporadically (mll+06, ). First considered to be a different class of neutron stars, continued or more sensitive observations often allow to associate the emission with an underlying period which increases with time, confirming a rotational origin of the period (mlk+09, ). Ref. kkl+11 argued that RRATs are not a distinct or a separate population, but an extreme class of ordinary pulsars, which happen to be discovered more easily via their single pulses. Observations of RRATs with sufficient time resolution and sensitivity to reveal potential quasi-periodic sub-structure are rare. Recently, however, the 2.48-s RRAT J19180449 was discovered and monitored with the Five Hundred Metre Spherical Aperture Telescope (FAST) showing clear quasi-periodic sub-structure with a periodicity of ms. The sub-structure width is measured to be ms cwy+22 .
The results of our magnetar measurements, combined with the values for normal pulsars, millisecond pulsars and the recent discoveries of PSR J09014046, GLEAM-X J162759.5523504.3 and RRAT J19180449 are shown in Tables 2 and in Table 3. They are summarised in Figures 2, 3 and 4, for the sub-structure’s quasi-periodicities and widths, respectively.
We have modelled the data with power-law fits. We first conducted a normal least-square fit by minimising a standard expression. This provided initial guesses for two fitted parameters, power-law index and scale factor, and their uncertainties. In order to check for co-variances and the shape of posterior distributions, we then employed the UltraNest sampler ultranest to perform an analysis with uniform priors, covering a range of times the uncertainties around the least-squares results. As a likelihood function we used the usual . The resulting power-law fits and the posterior distributions are presented in the main text and the figure captions. They all have in common that both quantities depend linearly on rotational period of the neutron star.
With the quasi-periodicities of magnetars somewhat larger than the values implied by the scaling law, we performed a weighted least-squares fit to the magnetar data points alone. We assumed the same linear scaling with rotational period, , as in Figure 3 to determine only the scaling factors. We derive for the periodicity: which compares to for the whole data set. This is a factor of larger. A similar fit for the magnetar sub-structure widths finds , which compares to , i.e. being a factor smaller. Both scalings are consistent within 2 sigma.
Polarisation of quasi-periodic sub-structure
We analysed the polarisation of all quasi-periodic sub-structure from XTE J1810197 and Swift J1818.01607 obtained during our new observations with the Effelsberg Radio Telescope. The polarisation profile and its corresponding linear polarisation position angles (PA) of the pulses shown in Figure 1 and additional examples (shown in the Supplementary Information) are presented in Figure 5. For XTE J1810197, most sub-structures are close to be 100% linearly polarised, consistent with a very high degree of linear polarisation of the integrated profile of this magnetar. The PA swings of these quasi-periodic sub-structures are apparently flat within several percentages of the rotational period. For quasi-periodic sub-structures from Swift J1818.01607, the fraction of linear polarisation is high on average while exhibiting some distinct pulse-to-pulse variability. In some pulses the linear component can be close to 100% while in others it may not turn out to be significant. The PA swings of most sub-structure are shown to be flat, some with low-level variation on a scale of roughly 10 deg. These features of the PA swings are similar to what have been seen in quasi-periodic sub-structures from ordinary pulsars (mar15, ).
Data availability
Most data used in this study are available from the literature or already downloaded
from publicly accessible archives (see https://atoa.atnf.csiro.au). Magnetar data
obtained especially for this study are available by contacting
the corresponding author to arrange the data transfer
due to the large data volume for these observations.
Acknowledgements
This manuscript makes use of observations conducted with the 100-m
radio telescope in Effelsberg owned and operated by the
Max-Planck-Institut für Radioastronomy. We are grateful to Duncan Lorimer and David Champion for comments on the manuscript and thank Laura Spitler and her group for stimulating discussions. We thank Robert Main for useful discussions on microstructure in the FRBs.
MK, KL, GD
acknowledge the financial support by the European Research Council for the ERC Synergy Grant BlackHoleCam under contract no. 610058. BWS acknowledges the financial support by the European Research Council for the ERC Advanced Grant MeerTRAP under contract no. 694745.
Author contributions
MK and KL drafted the manuscript with suggestions from co-authors. MK
and KL reduced and analyzed the Effelberg 100-m telescope data and archival data. KL,
GD and RK conducted observations with the 100-m radio telescope and
preprocessed data.
\bmheadConflict of interest/Competing interests
The authors declare no competing interests.
Figures
References
- \bibcommenthead
- (1) Lorimer, D. R. & Kramer, M. Handbook of Pulsar Astronomy Vol. 4 (Cambridge University Press, 2004).
- (2) Philippov, A. & Kramer, M. Pulsar Magnetospheres and Their Radiation. Annual Rev. in Astron. Astrophys 60, 495–558 (2022).
- (3) Tan, C. M. et al. LOFAR Discovery of a 23.5 s Radio Pulsar. Astrophys. J. 866, 54 (2018).
- (4) Caleb, M. et al. Discovery of a radio-emitting neutron star with an ultra-long spin period of 76 s. Nature Astronomy 6, 828–836 (2022).
- (5) Kaspi, V. M. & Beloborodov, A. M. Magnetars. Ann. Rev. Astr. Ap. 55, 261–301 (2017).
- (6) Camilo, F. et al. Transient pulsed radio emission from a magnetar. Nature 442, 892–895 (2006).
- (7) Eatough, R. P. et al. A strong magnetic field around the supermassive black hole at the centre of the Galaxy. Nature 501, 391–394 (2013).
- (8) Lorimer, D. R., Bailes, M., McLaughlin, M. A., Narkevic, D. J. & Crawford, F. A bright millisecond radio burst of extragalactic origin. Science 318, 777– (2007).
- (9) Thornton, D. et al. A Population of Fast Radio Bursts at Cosmological Distances. Science 341, 53–56 (2013).
- (10) Metzger, B. D., Margalit, B. & Sironi, L. Fast radio bursts as synchrotron maser emission from decelerating relativistic blast waves. Mon. Not. R. Astron. Soc. 485, 4091–4106 (2019).
- (11) Lyubarsky, Y. Emission Mechanisms of Fast Radio Bursts. Universe 7, 56 (2021).
- (12) Spitler, L. G. et al. Fast Radio Burst Discovered in the Arecibo Pulsar ALFA Survey. Astrophys. J. 790, 101 (2014).
- (13) Pleunis, Z. et al. Fast Radio Burst Morphology in the First CHIME/FRB Catalog. Astrophys. J. 923, 1 (2021).
- (14) Spanakis-Misirlis, A. FRBSTATS: A web-based platform for visualization of fast radio burst properties. Astrophysics Source Code Library, record ascl:2106.028 (2021). 2106.028.
- (15) Caleb, M., Stappers, B. W., Rajwade, K. & Flynn, C. Are all fast radio bursts repeating sources? Mon. Not. R. Astron. Soc. 484, 5500–5508 (2019).
- (16) James, C. W. et al. Which bright fast radio bursts repeat? Mon. Not. R. Astron. Soc. 495, 2416–2427 (2020).
- (17) Platts, E. et al. A living theory catalogue for fast radio bursts. Phys. Rep. 821, 1–27 (2019).
- (18) Bochenek, C. D. et al. A fast radio burst associated with a Galactic magnetar. Nature 587, 59–62 (2020).
- (19) CHIME/FRB Collaboration et al. A bright millisecond-duration radio burst from a Galactic magnetar. Nature 587, 54–58 (2020).
- (20) Kirsten, F. et al. Detection of two bright radio bursts from magnetar SGR 1935 + 2154. Nature Astronomy 5, 414–422 (2021).
- (21) Beloborodov, A. M. Can a Strong Radio Burst Escape the Magnetosphere of a Magnetar? Astrophys. J. Let. 922, L7 (2021).
- (22) Li, D. et al. A bimodal burst energy distribution of a repeating fast radio burst source. Nature 598, 267–271 (2021).
- (23) Majid, W. A. et al. A Bright Fast Radio Burst from FRB 20200120E with Sub-100 Nanosecond Structure. Astrophys. J. Let. 919, L6 (2021).
- (24) Chime/Frb Collaboration, B. C., Andersen et al. Sub-second periodicity in a fast radio burst. Nature 607, 256–259 (2022).
- (25) Pastor-Marazuela, I. et al. A fast radio burst with sub-millisecond quasi-periodic structure. arXiv e-prints arXiv:2202.08002 (2022).
- (26) Taylor, J. H., Manchester, R. N. & Huguenin, G. R. Observations of pulsar radio emission. I. Total–intensity measurements of individual pulses. Astrophys. J. 195, 513 (1975).
- (27) Cordes, J. M. Pulsar microstructure - Periodicities, polarization and probes of pulsar magnetospheres. Aust. J. Phys. 32, 9–24 (1979).
- (28) Kramer, M., Johnston, S. & van Straten, W. High-resolution single-pulse studies of the Vela pulsar. Mon. Not. R. Astron. Soc. 334, 523–532 (2002).
- (29) De, K., Gupta, Y. & Sharma, P. Detection of Polarized Quasi-periodic Microstructure Emission in Millisecond Pulsars. Astrophys. J. Let. 833, L10 (2016).
- (30) Liu, K. et al. Detection of quasi-periodic micro-structure in three millisecond pulsars with the Large European Array for Pulsars. Mon. Not. R. Astron. Soc. 513, 4037–4044 (2022).
- (31) Hankins, T. H. Microsecond intensity variation in the radio emission from CP 0950. Astrophys. J. 169, 487–494 (1971).
- (32) Hurley-Walker, N. et al. A radio transient with unusually slow periodic emission. Nature 601, 526–530 (2022).
- (33) Serylak, M. et al. Simultaneous multifrequency single-pulse properties of AXP XTE J1810-197. Mon. Not. R. Astron. Soc. 394, 295–308 (2009).
- (34) Maan, Y., Joshi, B. C., Surnis, M. P., Bagchi, M. & Manoharan, P. K. Distinct Properties of the Radio Burst Emission from the Magnetar XTE J1810-197. Astrophys. J. Let. 882, L9 (2019).
- (35) Caleb, M. et al. Radio and X-ray observations of giant pulses from XTE J1810 - 197. Mon. Not. R. Astron. Soc. 510, 1996–2010 (2022).
- (36) Zhu, W. et al. A radio pulsar phase from SGR J1935+2154 provides clues to the magnetar FRB mechanism. Science Advances 9, eadf6198 (2023).
- (37) Lazaridis, K. et al. Radio spectrum of the AXP J1810-197 and of its profile components. Mon. Not. R. Astron. Soc. 390, 839–846 (2008).
- (38) Lange, C., Kramer, M., Wielebinski, R. & Jessner, A. Radio pulsar microstructure at 1.41 and 4.85 GHz. Astron. Astrophys 332, 111 (1998).
- (39) Keith, M. J. et al. The High Time Resolution Universe Pulsar Survey - I. System configuration and initial discoveries. Mon. Not. R. Astron. Soc. 409, 619–627 (2010).
- (40) Chen, J. L. et al. The Discovery of a Rotating Radio Transient J1918-0449 with Intriguing Emission Properties with the Five-hundred-meter Aperture Spherical Radio Telescope. Astrophys. J. 934, 24 (2022).
- (41) Mitra, D., Arjunwadkar, M. & Rankin, J. M. Polarized Quasiperiodic Structures in Pulsar Radio Emission Reflect Temporal Modulations of Non-stationary Plasma Flow. Astrophys. J. 806, 236 (2015).
- (42) Clemens, J. C. & Rosen, R. Observations of Nonradial Pulsations in Radio Pulsars. Astrophys. J. 609, 340–353 (2004).
- (43) Thompson, C. Radio Emission of Pulsars. I. Slow Tearing of a Quantizing Magnetic Field. Astrophys. J. 933, 231 (2022).
- (44) Thompson, C. Radio Emission of Pulsars. II. Coherence Catalyzed by Cerenkov-unstable Shear Alfvén Waves. Astrophys. J. 933, 232 (2022).
- (45) Kramer, M., Stappers, B. W., Jessner, A., Lyne, A. G. & Jordan, C. A. Polarized radio emission from a magnetar. Mon. Not. R. Astron. Soc. 377, 107–119 (2007).
- (46) Jankowski, F. et al. Spectral properties of 441 radio pulsars. Mon. Not. R. Astron. Soc. 473, 4436–4458 (2018).
- (47) Torne, P. et al. Submillimeter Pulsations from the Magnetar XTE J1810-197. Astrophys. J. Let. 925, L17 (2022).
- (48) Lower, M. E., Shannon, R. M., Johnston, S. & Bailes, M. Spectropolarimetric Properties of Swift J1818.0-1607: A 1.4 s Radio Magnetar. Astrophys. J. Let. 896, L37 (2020).
- (49) Weltevrede, P. & Johnston, S. Profile and polarization characteristics of energetic pulsars. Mon. Not. R. Astron. Soc. 391, 1210–1226 (2008).
- (50) Hilmarsson, G. H., Spitler, L. G., Main, R. A. & Li, D. Z. Polarization properties of FRB 20201124A from detections with the Effelsberg 100-m radio telescope. Mon. Not. R. Astron. Soc. 508, 5354–5361 (2021).
- (51) Luo, R. et al. Diverse polarization angle swings from a repeating fast radio burst source. Nature 586, 693–696 (2020).
- (52) Kumar, P. et al. Circularly polarized radio emission from the repeating fast radio burst source FRB 20201124A. Mon. Not. R. Astron. Soc. 512, 3400–3413 (2022).
- (53) Petroff, E., Hessels, J. W. T. & Lorimer, D. R. Fast radio bursts. Astron. Astrophys. Rev 27, 4 (2019).
- (54) McDermott, P. N., Van Horn, H. M. & Hansen, C. J. Nonradial oscillations of neutron stars. Astrophys. J. 325, 725–748 (1988).
- (55) Lazarus, P. et al. Arecibo Pulsar Survey Using ALFA. IV. Mock Spectrometer Data Analysis, Survey Sensitivity, and the Discovery of 40 Pulsars. Astrophys. J. 812, 81 (2015).
- (56) Levin, L. et al. A Radio-loud Magnetar in X-ray Quiescence. Astrophys. J. Let. 721, L33–L37 (2010).
- (57) Champion, D. et al. High-cadence observations and variable spin behaviour of magnetar Swift J1818.0-1607 after its outburst. Mon. Not. R. Astron. Soc. 498, 6044–6056 (2020).
- (58) Werthimer, D. Peta-Flop Real Time Radio Astronomy Signal Processing Instrumentation and the CASPER Collaboration, Vol. 2, 20102 (2014).
- (59) Hotan, A. W., van Straten, W. & Manchester, R. N. psrchive and psrfits: An Open Approach to Radio Pulsar Data Storage and Analysis. Publications of the Astronomical Society of Australia 21, 302–309 (2004).
- (60) Camilo, F. et al. Radio Disappearance of the Magnetar XTE J1810-197 and Continued X-ray Timing. Astrophys. J. 820, 110 (2016).
- (61) Zijlstra, A. A., van Hoof, P. A. M. & Perley, R. A. The Evolution of NGC 7027 at Radio Frequencies: A New Determination of the Distance and Core Mass. Astrophys. J. 681, 1296–1309 (2008).
- (62) Scholz, P. et al. Spin-down Evolution and Radio Disappearance of the Magnetar PSR J1622-4950. Astrophys. J. 841, 126 (2017).
- (63) Cordes, J. M. Pulsar radiation as polarized shot noise. Astrophys. J. 210, 780–791 (1976).
- (64) Cordes, J. M., Weisberg, J. M. & Hankins, T. H. Quasiperiodic microstructure in radio pulsar emissions. Astron. J. 100, 1882–1891 (1990).
- (65) Camilo, F., Ransom, S. M., Halpern, J. P. & Reynolds, J. 1E 1547.0-5408: A Radio-emitting Magnetar with a Rotation Period of 2 Seconds. Astrophys. J. Let. 666, L93–L96 (2007).
- (66) Camilo, F., Halpern, J. P. & Ransom, S. M. Radio pulsations not detected from AXP/SGR 1E1547.0-5408 following recent outburst. The Astronomer’s Telegram 1907, 1 (2009).
- (67) Israel, G. L. et al. X-Ray and Radio Bursts from the Magnetar 1E 1547.0-5408. Astrophys. J. 907, 7 (2021).
- (68) Torne, P. et al. Simultaneous multifrequency radio observations of the Galactic Centre magnetar SGR J1745-2900. Mon. Not. R. Astron. Soc. 451, L50–L54 (2015).
- (69) Wharton, R. S. et al. VLA Observations of Single Pulses from the Galactic Center Magnetar. Astrophys. J. 875, 143 (2019).
- (70) Suresh, A. et al. 4-8 GHz Spectrotemporal Emission from the Galactic Center Magnetar PSR J1745-2900. Astrophys. J. 921, 101 (2021).
- (71) Pearlman, A. B., Majid, W. A., Prince, T. A., Kocz, J. & Horiuchi, S. Pulse morphology of the galactic center magnetar PSR j17452900. Astrophys. J. 866, 160 (2018).
- (72) Younes, G. et al. X-Ray and Radio Observations of the Magnetar SGR J1935+2154 during Its 2014, 2015, and 2016 Outbursts. Astrophys. J. 847, 85 (2017).
- (73) Bochenek, C. D. et al. A fast radio burst associated with a Galactic magnetar. Nature 587, 59–62 (2020).
- (74) Bochenek, C. D. et al. Upper limit to radio bursts from SGR 1935+2154 (ATEL 14074) by STARE2. The Astronomer’s Telegram 14077, 1 (2020).
- (75) Pleunis, Z. & CHIME/FRB Collaboration. Properties of the CHIME/FRB 2020 October 8 detections of SGR 1935+2154. The Astronomer’s Telegram 14080, 1 (2020).
- (76) Dong, F. A. & Chime/Frb Collaboration. CHIME/FRB Detection of a Bright Radio Burst from SGR 1935+2154. The Astronomer’s Telegram 15681, 1 (2022).
- (77) Zhang, C. F. et al. A highly polarised radio burst detected from SGR 1935+2154 by FAST. The Astronomer’s Telegram 13699, 1 (2020).
- (78) Bailes, M. et al. Multifrequency observations of SGR J1935+2154. Mon. Not. R. Astron. Soc. 503, 5367–5384 (2021).
- (79) Younes, G. et al. X-Ray Burst and Persistent Emission Properties of the Magnetar SGR 1830-0645 in Outburst. Astrophys. J. 924, 136 (2022).
- (80) Lin, L. et al. No pulsed radio emission during a bursting phase of a Galactic magnetar. Nature 587, 63–65 (2020).
- (81) Zhu, W. et al. FAST detection of radio bursts and pulsed emission from SGR J1935+2154. The Astronomer’s Telegram 14084, 1 (2020).
- (82) Mitra, D., Basu, R., Melikidze, G. I. & Arjunwadkar, M. A single spark model for PSR J2144-3933. Mon. Not. R. Astron. Soc. 492, 2468–2480 (2020).
- (83) Morello, V. et al. The SUrvey for Pulsars and Extragalactic Radio Bursts - IV. Discovery and polarimetry of a 12.1-s radio pulsar. Mon. Not. R. Astron. Soc. 493, 1165–1177 (2020).
- (84) Agar, C. H. et al. A broad-band radio study of PSR J0250+5854: the slowest spinning radio pulsar known. Mon. Not. R. Astron. Soc. 508, 1102–1114 (2021).
- (85) McLaughlin, M. A. et al. Transient radio bursts from rotating neutron stars. Nature 439, 817–820 (2006).
- (86) McLaughlin, M. A. et al. Timing observations of rotating radio transients. Mon. Not. R. Astron. Soc. 400, 1431–1438 (2009).
- (87) Keane, E. F., Kramer, M., Lyne, A. G., Stappers, B. W. & McLaughlin, M. A. Rotating Radio Transients: new discoveries, timing solutions and musings. Mon. Not. R. Astron. Soc. 415, 3065–3080 (2011).
- (88) Buchner, J. UltraNest - a robust, general purpose Bayesian inference engine. The Journal of Open Source Software 6, 3001 (2021).
- (89) Niu, J.-R. et al. FAST Observations of an Extremely Active Episode of FRB 20201124A. IV. Spin Period Search. Research in Astronomy and Astrophysics 22, 124004 (2022).
- (90) Kardashev, N. S. et al. Pulsar observations with a time resolution of 10 microsec at 102.5 MHz. Sov. Astron. 22, 583–587 (1978).
- (91) Cordes, J. M. Space Sci. Rev. 24, 567 (1979).
- (92) Hankins, T. H. & Boriakoff, V. Microstructure in the pulsar 0950+08 interpulse at radio wavelengths. Astrophys. J. 249, 238–240 (1981).
- (93) Popov, M. V. et al. Pulsar microstructure and its quasi-periodicities with the S2 VLBI system at a resolution of 62.5 nanoseconds. Astron. Astrophys 396, 171–187 (2002).
- (94) Ferguson, D. C. & Seiradakis, J. H. A detailed, high time resolution study of high frequency radio emission from PSR 1133+16. Astron. Astrophys 64, 27–42 (1978).
- (95) Boriakoff, V. On the radio pulse emission mechanism of PSR 1133+16: Simultaneous dual-frequency high time resolution observations. Astrophys. J. 272, 687 (1983).
- (96) Vaughan, S. A simple test for periodic signals in red noise. Astron. Astrophys 431, 391–403 (2005).
- (97) Cordes, J. M. & Downs, G. S. JPL Pulsar timing observations. III. Pulsar rotation fluctuations. Astrophys. J. Supp. Ser. 59, 343–382 (1985).
Extended Data Figures
Extended Data Tables
| Source | Date | (GHz) | (MHz) | (min) | (ms) |
|---|---|---|---|---|---|
| 1E 1547.05408 | 2009-02-25 | 8.3 | 512 | 30 | 1.0 |
| PSR J16224950 | 2017-07-04 | 3.1 | 1024 | 15 | 1.0 |
| XTE J1810197 | 2020-08-10 | 6.0 | 4000 | 15 | 0.68 |
| 2020-08-28 | 6.0 | 4000 | 14 | 0.68 | |
| 2020-09-25 | 6.0 | 4000 | 13 | 0.68 | |
| Swift J1818.01607 | 2021-02-12 | 6.0 | 4000 | 39 | 0.17 |
| 2021-07-05 | 6.0 | 4000 | 25 | 0.17 | |
| 2021-09-16 | 6.0 | 4000 | 30 | 0.17 | |
| GLEAMX J162759.5523504.3 | 2018-01-09 | 0.152 | 159 | - | 500 |
| Source | —– —– | —– —– | |||||||
|---|---|---|---|---|---|---|---|---|---|
| (s) | MN (ms) | MD (ms) | GM (ms) | GSTD | MN (ms) | MD (ms) | GM (ms) | GSTD | |
| 1E 1547.05408 | 2.07 | – | – | 1.0 | 2.0 | – | – | 4.0 | 2.0 |
| J16224950 | 4.33 | 4.7 | 5.0 | 1.4 | 10.0 | 10.3 | 1.4 | ||
| J17452900 | 3.77 | – | – | (3.1) | (1.7) | – | – | (4.8) | (1.9) |
| XTE J1810197 | 5.54 | 6.8 | 5.4 | 1.6 | 12.0 | 8.6 | 1.9 | ||
| Swift J1818.01607 | 1.37 | 1.0 | 1.1 | 1.4 | 2.24 | 2.2 | 1.4 | ||
| SGR J19352154 | 3.24 | () | (0.93) | (0.88) | (1.2) | – | – | – | – |
| GLEAMX | 1090.8 | 3200 | 3000 | 1.7 | 6110 | 6103 | 1.0 | ||
| Source | —- —- | —- —– | References | |||
|---|---|---|---|---|---|---|
| J2000 | (s) | GM (ms) | GSTD | GM (ms) | GSTD | |
| 03041932 | 1.3876 | – | – | 1.34 | 1.2 | mar15 |
| 03325434 | 0.7145 | – | – | 0.67 | 1.8 | kkn+78 ; lkwj98 |
| 04374715 | 0.0058 | 0.002 | 2.0 | 0.005 | 1.5 | dgs16 |
| 05282200 | 3.7455 | 3.05 | 2.0 | 3.95 | 1.2 | cor79 ; mar15 |
| 05462441 | 2.8439 | – | – | 2.41 | 1.1 | mar15 |
| 06591414 | 0.3849 | – | – | 0.40 | 1.1 | mar15 |
| 08147429 | 1.2922 | 0.77 | 2.0 | 1.25 | 4.5 | cwh90 |
| 08262637 | 0.5307 | 0.53 | 1.1 | 0.66 | 1.2 | cor79 ; lkwj98 ; mar15 |
| 08354510 | 0.0893 | 0.13 | 2.0 | 0.41 | 3.1 | kjv02 |
| 08370610 | 1.2738 | 1.05 | 2.0 | 0.83 | 1.2 | mar15 |
| 09014046 | 75.886 | 37.9 | 1.5 | 75.7 | 1.5 | Caleb2022 |
| 09530755 | 0.253 1 | 0.15 | 1.1 | 0.41 | 2.0 | hb81 ; cwh90 ; lkwj98 ; pbc+02b ; mar15 |
| 10221001 | 0.0165 | 0.009 | 1.1 | 0.015 | 1.3 | lab+22 |
| 11361551 | 1.1879 | 0.34 | 1.6 | 0.78 | 1.4 | fs78 ; bor83 ; cwh90 ; pbc+02b ; mar15 |
| 12392453 | 1.3824 | – | – | 1.63 | 1.4 | mar15 |
| 17441134 | 0.0041 | 0.004 | 1.1 | 0.006 | 1.3 | lab+22 |
| 19180449 | 2.479 | 1.47 | 1.2 | 2.31 | 1.1 | cwy+22 |
| 19212153 | 1.3373 | 1.30 | 2.0 | 1.54 | 1.6 | cor79 ; mar15 |
| 19321059 | 0.2265 | 0.12 | 1.3 | 0.42 | 1.7 | lkwj98 ; pbc+02b ; mar15 |
| 19461805 | 0.4406 | 0.24 | 2.0 | 0.75 | 1.1 | cor79 ; cwh90 ; mar15 |
| 20043137 | 2.1112 | – | – | 1.18 | 1.3 | mar15 |
| 20182839 | 0.5579 | 0.17 | 1.2 | 0.76 | 1.2 | cor76a ; cor79 ; cwh90 ; lkwj98 ; mar15 |
| 20222854 | 0.3434 | 0.11 | 2.0 | 0.50 | 1.1 | cor79 ; mar15 |
| 21132754 | 1.2028 | – | - | 1.13 | 1.1 | mar15 |
| 21443933 | 8.5098 | 5.90 | 1.1 | 11.8 | 1.1 | mbma20 |
| 21450750 | 0.0161 | 0.011 | 1.1 | 0.017 | 1.2 | dgs16 |
| 22513711 | 12.123 | 10.0 | 2.0 | – | – | mke+20 |
| 23172149 | 1.4447 | – | – | 1.01 | 1.1 | mar15 |
Supplementary Information
Statistical tests on quasi-periodic signals
The method to determine sub-pulse structure and its properties as described in the Methods section is illustrated in Figure S1. Further examples of applying this method are shown in Figures S2, S3, S4 and S5.
In order to evaluate the significance of those detected quasi-periodicities, we performed and compared a number of statistical tests. In the following, we describe those tests. In addition to two tests closely related to our detection method described in detail earlier, we also studied the suitability of the Rayleigh test, which is a standard method to detect and quantify potential periodicity in data using the Rayleigh () statistic. Recently, this latter method has been applied frequently in the evaluation of possible quasi-periodicities in FRBs. The various methods are in particular useful, if only single or few bursts are available, as in the case of most FRBs. Obviously, the ability of studying large samples of pulses (as available for normal pulsar observations and demonstrated in many past studies, or for radio loud magnetars studied here) can provide additional and even stronger evidence by building up robust statistics from many independent measurements, leading to histograms like Figure S6.
ACF-based test: component phase scrambling. This test is applied to all example pulses shown in Table S1. As discussed in the Methods Section, the periodic / quasi-periodic features in the data will result in a sequence of local maxima in the ACF with spacing equalling to the periodicity. Thus, one can construct a statistical quantity , by summing the power of these relative maxima in the ACF () that correspond to the periodicity:
| (2) |
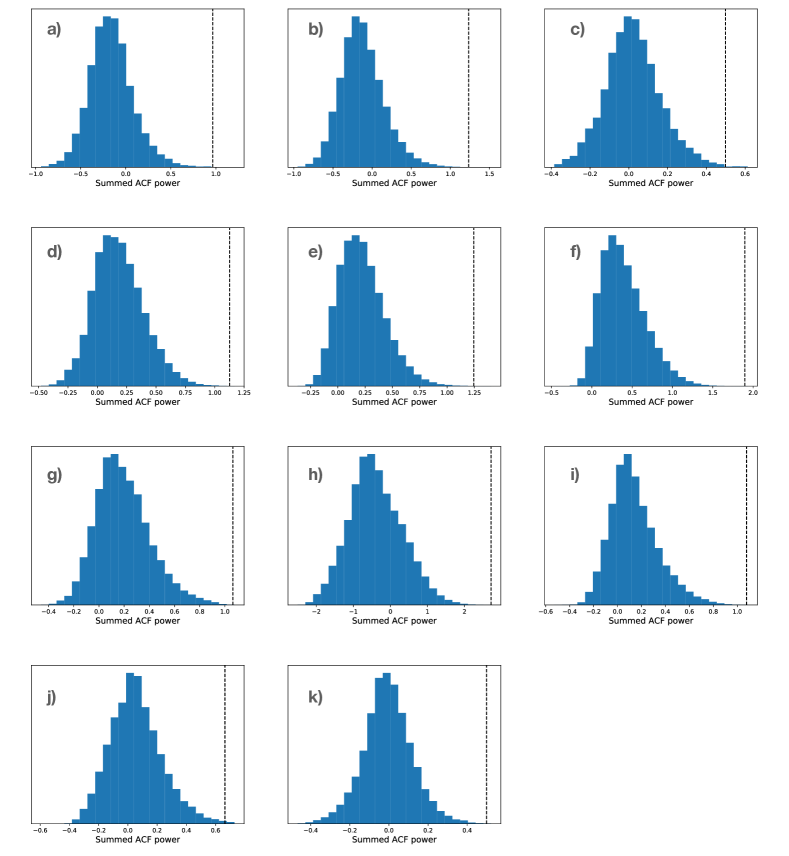
where is the length of the data. Thus, the detection significance can be obtained by comparing this quantity from the real data to a null distribution. To construct the null distribution, we simulated a number of pulses and calculated their corresponding values. Each simulated pulse consists of the same number of components as in the example pulse, each created using the measured sub-structure width and amplitudes from the pulse. The centers of these components were computed by adding random variations to a set of equally spaced positions separated by the measured periodicity. The random variation was drawn from a uniform probability distribution defined as Equation (9) of abb+22 , with the same scaling value of . Then for all simulated pulses, we obtained the periodicity from the ACF analysis and calculated the corresponding values from their ACFs. The detection significance was thus obtained by comparing the value from the real pulse to its distribution constructed from these simulated pulses, as shown in Figure S7.
The resulting detection significance from this analysis are summarized in Table S1. It can be seen that for all pulses from XTE J1810197, Swift J1818.01607 and one from GLEAMX J162759.5523504.3, the significance is higher than 4; this suggests a strong evidence for the presence of periodicity in the data. The rest pulses all reach a significance between 3 and , indicating the existence of a weaker evidence.
ACF-based test: phase bin scrambling. This test is similar to the previous one but goes one step further by comparing the observed pulses with representations of themselves that have the order of the corresponding phase bins scrambled completely in a random fashion. This method is similar to the recipe provided, for instance, in Ref. vaug05 : For each pulse passing the criteria for containing a quasi-periodicity as determined by the method described in the Methods Section, the phase bins of the pulse window are scrambled in a random fashion. This randomized pulse is subjected to the same ACF computation as the real pulse, i.e. the resulting ACF is Fourier-transformed to calculate the Power Spectral Density. For this, the maximum peak (ignoring the zeroth and Nyquist frequency bins) is recorded. The maximum peak obtained from the original, unscrambled pulse is compared to the distribution of recorded peaks from thousands of such random pulses. The resulting statistics allows to compute the corresponding significance levels. In order to limit the number of random pulses required to be studied, we stopped the computations when a significance of more than was established. Figure S8 shows the distributions of significance values as established for all pulses of those three sources, where many observed pulses were available and studied in detail, i.e. for Swift J1818.01607, XTE J1810197, PSR J16224950. In this figure, we mark a threshold of and . The latter was marked separately, since the last bin (displayed from to ) contains all pulses, where the significance is exceeding or more. The derived significance for the quasi-periodicities seen in all other pulses and sources displayed in the various figures of this work is summarised in Table S1 for a comparison with the other methods. We note the significance values are very much consistent among the first two methods but typically exceed the significance given by the Rayleigh tests for the reasons demonstrated in the following.
Rayleigh test. Using the Rayleigh statistic, Refs. abb+22 , pvb+22 and nzz+22 conducted significance tests of periodicity on several FRBs with quasi-regularly spaced features. These returned a high significance () for the presence of periodicity only for three of the overall samples. Here, following a similar recipe as described in abb+22 , we carried out the Rayleigh statistic test to the example pulses shown in Figure 1, S3, S4, S2 and S5. In detail, we first smoothed the pulse data using continuous wavelet transformation, and recorded the positions of the relative maxima detected with sufficiently high S/N and when the peaks were at least as wide as two to three phase bins. Then we conducted a blind search for periodicity, by finding the maximum of Rayleigh () test statistic
| (3) |
where is the number of peaks and is the phase of the peak positions with respect to the trial period. The trial periods range from five times the sampling interval up to half the entire duration of the on-pulse region, with a step size one fifth of the sampling interval. The detected periodicity was then the trial period corresponding to the maximum value.
To estimate the corresponding significance of the value, we followed the recipe described in abb+22 to construct the null distribution, by conducting Monte Carlo simulations based on the measured peak positions. In each iteration, we added a random variation to the peak positions drawn from a uniform probability distribution defined as Equation (9) of abb+22 . Here we assumed an exclusion parameter of as in the analysis of abb+22 . Then a maximum value was obtained by following the same procedure as described above. Eventually, we compared the distribution of the maximum values from such iterations, to the measurement from real data. The false-alarm probability was calculated based on the number iterations that have a maximum value larger than the measurement from real data.
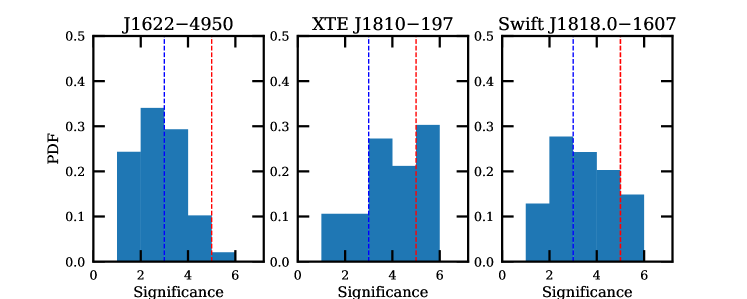
The results for all of our samples are shown in Table S1, while the obtained values in comparison with the null distribution can be found in Figure S9. It can be seen that all sample pulses from XTE J1810197 and Swift J1818.01607 return a significance higher than 3. In all cases of PSR J16224950 and GLEAMX J162759.5523504.3 have such a value above 2.
However, it should be noted that the Rayleigh statistical test is designed and optimal for verifying signals of a precise period. Therefore, as we show in the following, the test can fail to identify quasi-periodicities in the signal, which is exactly the type of features seen in numerous pulsars by far cwh90 ; lkwj98 ; dgs16 ; lab+22 . In contrast, this type of signal would still manifest itself as a strongly preferred times/frequency scale in the ACF and PSD. To demonstrate this, we have conducted a series of mock data simulations. For each of the four sources, XTE J1810197, Swift J1818.01607, PSR J16224950 and GLEAMX J162759.5523504.3, we created a set of mock pulse profiles based on a template which consists of a sequence of Gaussian components:
| (4) |
Here is the number of components. These components are precisely equally spaced in the first place. The values of component spacing and width used in the simulation for each of the source were obtained from the real measurements shown in Table 2. Then in each iteration, we created a new pulse by altering the centre () of each component randomly within a range of , , where specify the level of phase variability. This pulse-to-pulse signal variability, also known as “pulse jittering”, is commonly seen in pulsar radio emission (e.g., cd85, ). With this variability being present, the simulated pulsar signal usually shows quasi-regularly spaced pattern instead of a precise periodicity.
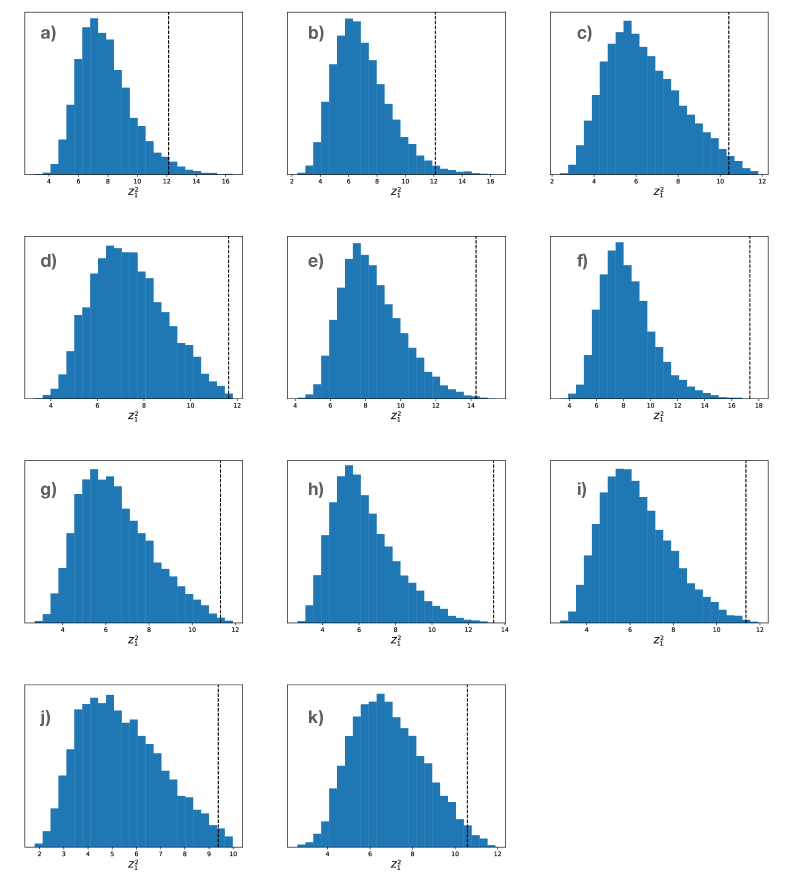
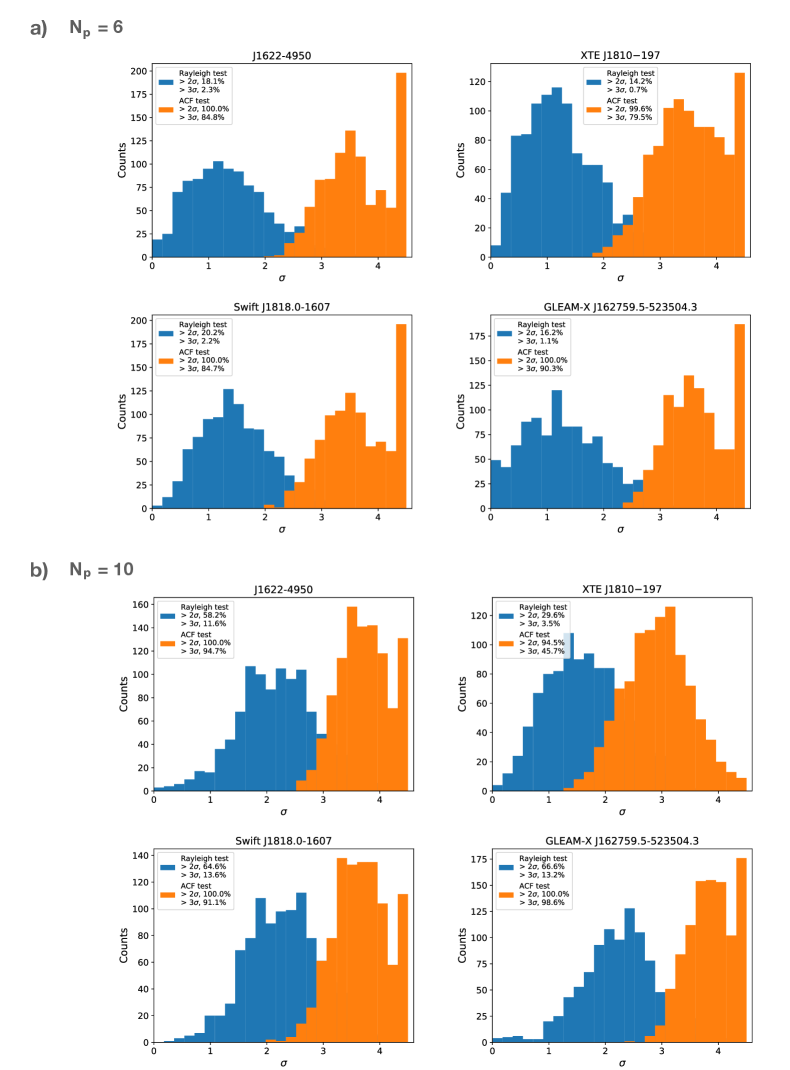
Next for each simulated pulse, we followed the same steps as described above to obtain the detected periodicity, the Rayleigh test statistics and the significance of periodicity. As a comparison, we also obtained the detection significance of periodicities from the phase-bin-scrambling ACF test as described above. The distribution of the significance from iterations are shown in Figure S10 for the case of all four sources. Here, we conducted two sets of simulations, one with and the other with , so as to cover the range of number of components seen in our selected samples as shown in Table S1. In both sets, we used a typical value of . Four sample pulses (one for each source) from the simulation with are shown in Figure S11. It can be seen that for the simulation set with , in all cases only a small fraction, i.e., of the simulated pulses return a significance of periodicity above and no more than 2% of them are above significance. In contrast, the low-significance pulses show strong evidence for quasi-periodicity in the Fourier-domain and ACF analysis as can be seen in Figure S11. When the number of components in each simulated pulse is increased from 6 to 10, the performance of Rayleigh test is improved as also anticipated in abb+22 . Still, only a small fraction () of simulated pulses yield a significance above significance, and the contrast between the distributions of significance obtained from the two methods is still apparent. Overall, the ACF tests return a significantly higher detection significance of periodicity. These demonstrate that the apparent significance derived from the statistical test can be easily affected when the feature in the signal deviates from being precisely periodic, even though we start from a highly periodic signal. In contrast, the detection scheme based on PSD and ACF as applied routinely in pulsar astronomy, and also in this work, can still correctly identify the underlying quasi-periods and widths.
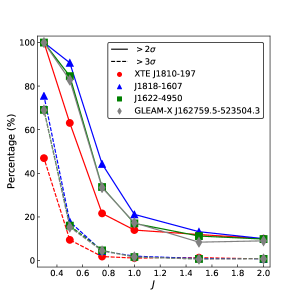
To further investigate the impact by pulse phase variability on the performance of Rayleigh test, we extended the simulation study above to a range of values for . Then for each source and choice of , we again simulated pulses and recorded the percentage of these iterations that returned a detection significance above 2 and 3 from the Rayleigh test. From Figure S12, it can be seen that for , the Rayleigh test is of barely any sensitivity to the embedded quasi-periodicity. When the intensity of phase variability decreases, i.e., the periodicity becomes more precise, the output by Rayleigh test then has a higher probability to return a high detection significance. For , all iterations return a detection significance higher than 2 and a large fraction higher than 3, which is the case for all four sources studied in this paper.
In summary, the performance of Rayleigh test depends strongly on the intrinsic pulse phase variability when it is used for evaluating the presence of quasi-periodicity. For this reason, we prefer the established method applied in pulsar astronomy over the past decades, to study the quasi-periodic feature in the data.

| Source | (ms) | (ms) | Reference | ||||
|---|---|---|---|---|---|---|---|
| XTE J1810197 | 6 | 11.6 | 4.1 | 11.2 | 3.2 | Figure 1 | |
| 8 | 15.8 | 4.1 | 15.6 | 3.2 | Figure S3 (left) | ||
| 10 | 17.3 | 4.9 | 16.9 | 3.7 | Figure S3 (right) | ||
| Swift J1818.01607 | 6 | 2.84 | 4.1 | 2.78 | 3.0 | Figure 1 | |
| 7 | 2.13 | 4.6 | 4.9 | 2.13 | 3.9 | Figure S4 (left) | |
| 6 | 2.03 | 4.4 | 4.7 | 2.03 | 3.2 | Figure S4 (right) | |
| PSR J16224950 | 9 | 16.7 | 3.8 | 16.6 | 2.4 | Figure 1 | |
| 9 | 16.3 | 3.6 | 4.4 | 16.8 | 2.3 | Figure S2 (left) | |
| 6 | 16.9 | 3.0 | 4.3 | 17.2 | 2.3 | Figure S2 (right) | |
| GLEAMX | 5 | 5824 | 3.2 | 5925 | 2.5 | Figure 1 | |
| J162759.5523504.3 | 6 | 6404 | 4.2 | 4.4 | 6711 | 2.4 | Figure S5 |