Quiescent galaxies in a virialized cluster at redshift 2: Evidence for accelerated size-growth
Abstract
We present an analysis of the galaxy population in XLSSC 122, an X-ray selected, virialized cluster at redshift . We utilize HST WFC3 photometry to characterize the activity and morphology of spectroscopically confirmed cluster members. The quiescent fraction is found to be per cent within 0.5, significantly enhanced over the field value of per cent at . We find an excess of “bulge-like” quiescent cluster members with Sérsic index relative to the field. These galaxies are found to be larger than their field counterparts at 99.6 per cent confidence, being on average per cent larger at a fixed mass of . This suggests that these cluster member galaxies have experienced an accelerated size evolution relative to the field at . We discuss minor mergers as a possible mechanism underlying this disproportionate size growth.
keywords:
galaxies: clusters: general – galaxies: evolution – galaxies: high-redshift – galaxies: structure – galaxies: stellar content – galaxies: fundamental parameters1 Introduction
The nature of galaxy evolution from the early universe to the present day is intricately linked to large-scale environment. Denser environments tend to host more massive galaxies (e.g. Hogg et al., 2003; Baldry et al., 2006) that have had an accelerated evolution towards quiescence and bulge-dominated morphologies (e.g. Dressler, 1980; Butcher & Oemler, 1978). This is exceptionally clear in the nearby universe where galaxy clusters are host to the most massive quiescent galaxies containing uniformly old populations of stars (e.g. Kodama & Arimoto, 1997; Mei et al., 2009). It is thought that this early-type cluster galaxy population is in place by (e.g. Lidman et al., 2008) with the bulk of star formation having occurred in these galaxies at (e.g. Strazzullo et al., 2006; Andreon, 2013; Newman et al., 2014).
The extreme overdensities of galaxy clusters can influence the evolution of their member galaxies through a variety of processes such as ram pressures stripping (e.g. Gunn & Gott, 1972; Ebeling et al., 2014), tidal interactions (e.g. Farouki & Shapiro, 1981; Moore et al., 1996; Moore et al., 1999), and “strangulation” (e.g. Larson et al., 1980; Bekki et al., 2002). Galaxy clusters also play an important role in the evolution of their member galaxies by regulating the frequency of galaxy mergers. During the formation of clusters, when galaxy densities are high and velocity dispersions are low, galaxy interaction rates are enhanced relative to the field (e.g. McIntosh et al., 2008; Lin et al., 2010; Kampczyk et al., 2013; Delaye et al., 2014). However, the subsequent high-velocity dispersion of massive clusters greatly inhibits the rate of future mergers among its members (e.g. Mamon, 1992). This merger-driven dynamic has been suggested to significantly influence galaxy morphologies (e.g. Bekki, 1998; Matharu et al., 2019), star-formation activity (e.g. Brodwin et al., 2013), and active galactic nuclei (e.g. Ehlert et al., 2014; Noordeh et al., 2020).
While galaxy clusters serve as important laboratories to probe galaxy evolution and investigate the relative importance of environmental and secular processes, studies become increasingly rare at high redshifts. This is due to both a decline in the number of massive clusters at high redshift as well as increasing observational difficulty in reliably identifying them. In particular, at high redshift, clusters are increasingly selected in the IR through their member galaxy population, which introduces biases into galaxy population studies. Rather, these clusters should ideally be identified through an observational proxy that is less dependent on the properties of the galaxy population, such as the Sunyaev-Zeldovich effect or through X-ray emission of the Intra-Cluster medium (ICM). While the X-ray emitting ICM may be partially composed of stripped/ejected material from galaxies prior to the observing epoch, it is not directly dependent on the current state of star-formation in the member galaxies; whereas IR color, red-sequence cluster selection techniques are. To date, only two clusters at with extended X-ray emission have been reported (Gobat et al., 2011; Newman et al., 2014), however both clusters were initially selected in the IR through their member galaxy population.
In this paper we examine the cluster member population of XLSSC 122, an ICM selected, mature cluster at with 37 spectroscopically confirmed members (Willis et al., 2020). XLSSC 122 is the highest redshift, ICM selected cluster discovered to date and provides a unique opportunity to investigate the influence of environment on galaxy evolution in the regime where galaxy growth is expected to be most rapid.
In Section 2 we describe our observations and detail our methodology for characterizing galaxy quiescence, mass, and size in both XLSSC 122 and a CANDELS control field. We investigate the distribution and structure of the passive and active cluster member population in Section 3. In Section 4 we compute the mass-size relation of the quiescent cluster members and compare to that of the field at . Finally, we summarise our findings in Section 5.
All magnitudes quoted in this work are AB magnitudes. Distances are computed adopting a cosmology with , , and . Uncertainties are quoted at the 68 per cent confidence level following Cameron (2011) for Binomial population proportions. Cluster radii are measured in units of , which is defined as the radius within which the mean density of the cluster is 500 times the critical density at that redshift. Cluster masses are quoted as values, with these being the mass contained within a sphere of radius .
2 Data and Methods
2.1 XLSSC 122
The galaxy cluster XLSSC 122 (XLSSU J021744.1034536) was originally discovered through its ICM emission in the XMM Large Scale Structure survey (Pierre et al., 2006; Willis et al., 2013). With 100 ks of follow-up XMM observations, it was found to have a temperature of keV, an emission-weighted metallicity of , and cluster mass of (Mantz et al., 2014, 2018).
This study utilizes Hubble Space Telescope (HST) Wide Field Camera 3 (WFC3) imaging of XLSSC 122 in the F105W and F140W bands as well as slitless spectroscopy with the G141 grism. The observations extend out to , approximately the virial radius of the cluster. The same data were previously used in Willis et al. (2020) to confirm XLSSC 122 as a mature cluster at and robustly identify 37 member galaxies.
2.2 Photometry, spectroscopy, and member selection
The photometric and spectroscopic data reduction and processing procedures used are described in detail in Willis
et al. (2020). In short, the F105W and F140W imaging were reduced using Grizli (Brammer, 2019) and processed with SExtractor (Bertin &
Arnouts, 1996) to produce source catalogs with AB magnitudes measured within 0.8 arcsecond circular apertures. The F140W segmentation map was used to identify undispersed source positions which we employed to build a full field spectral contamination model for each G141 image. With G141 observations split into four orientations, we were able to build robust contamination models for most sources in the crowded field and extract two-dimensional spectra for each source.
These spectra were cross-correlated with a suite of galaxy templates over the redshift range from which a probability distribution function (PDF) for the redshift of each source were derived. Cluster membership was split into two categories: “gold” and “silver”, representing high and moderate probability members respectively. In this study we focus solely on gold members with F140W , , and . is the integral of the redshift PDF over , an interval corresponding to , where is the expected observed frame velocity dispersion of a 5-keV galaxy cluster (Willis et al., 2020). There are 28 such members identified in XLSSC 122.
2.3 Galactic activity
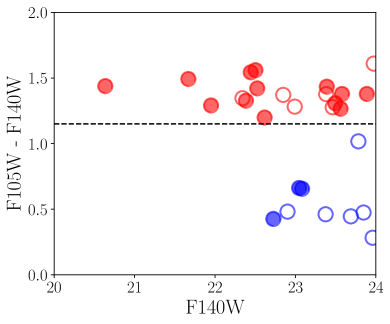
We classify XLSSC 122 member galaxies as quiescent based on the red-sequence of the cluster color-magnitude diagram (CMD) shown in Fig. 1. Sources with F105W-F140W are classified as quiescent whereas bluer sources are considered star-forming. Color-magnitude selection is a good proxy for galaxy specific star formation rates (sSFRs) as illustrated in Fig. 2.
2.4 Field comparison sample
We establish a field comparison sample by utilizing the AEGIS, COSMOS, GOODS-S, and UDS fields from CANDELS/3D-HST (Koekemoer et al., 2011; Brammer et al., 2012; Skelton et al., 2014; Momcheva et al., 2016). We select sources in the redshift range using spectroscopic redshifts when available and photometric redshifts otherwise ( from Momcheva et al., 2016). We select only galaxies with F140W to match our cluster sample and remove sources with bad photometry flags from Skelton et al. (2014). There are a total of 417 field galaxies satisfying these criteria.
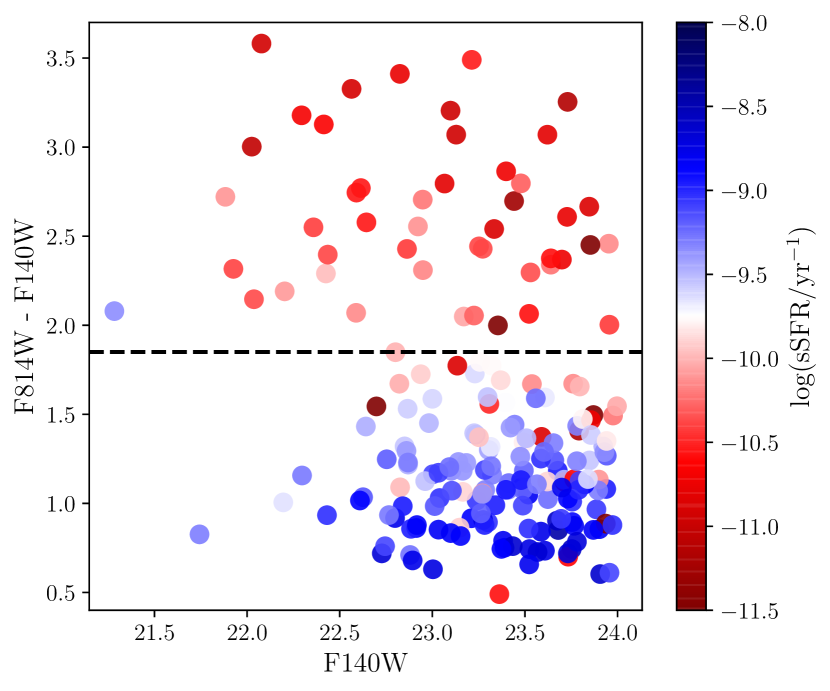
Rather than selecting quiescent field galaxies based on their cataloged star-formation rates (Kriek et al., 2009; Skelton et al., 2014; Whitaker et al., 2014), we attempt to make the quiescent galaxy selection as similar to that of XLSSC 122 as possible. While the CANDELS/3D-HST fields have F140W imaging, there is no F105W data available. Instead, we utilize the F814W filter (the closest available filter to F105W) to construct the F814W-F140W vs. F140W CMD shown in Fig. 2. We visually identify the red sequence in this CMD as F814W-F140W and use this threshold to classify quiescent galaxies comparable to those selected in XLSSC 122111We use the PySynphot package (STScI Development Team, 2013) to confirm that this threshold separates comparable galaxies as the F105W-F140W threshold described in Section 2.3. This is done by first finding all stellar templates from Bruzual & Charlot (2003) that would give the same galaxy colors as the quiescent and star forming XLSSC 122 members shown in Fig. 1. We then simulate the F814W-F140W colors of these templates and find that this threshold cleanly separates the same quiescent and star-forming galaxies.. We identify 84 quiescent field galaxies following this procedure. We perform our analysis adjusting this threshold by and find no significant change in our results.
2.5 Sizes
We fit all galaxies in XLSSC 122 and our field comparison sample with a single component, two-dimensional Sérsic profile. This profile takes the functional form:
| (1) |
| (2) |
Here is the radial distance of pixel location from the source center at , where the coordinate axes are aligned with the principle axes of the ellipse. is the intensity at radius , is the axis ratio, is the Sérsic index, is the half-light radius, and is an dependent normalization constant. 222Following van der Wel et al. (2014); Newman et al. (2014); Matharu et al. (2019), the effective radii used in our study are not circularized as is sometimes done in the literature. However, for comparison to such studies, we perform our analysis with circularized radii as well () and find no significant change to our conclusions. For reference, the circularized radii of cluster members are provided in Table 1.
We perform these fits in the F140W band, for both the cluster and the field, using GALFIT (Peng
et al., 2002), closely following the methodology of Van Der Wel
et al. (2012) and Matharu
et al. (2019). We start by making square image cutouts centered on each object with a width equal to 10 times the SExtractor determined half-light radius. These images are sky-subtracted and have units of electrons s-1. We also produce a noise map for each fitting region by first computing the intrinsic variance for each pixel from the drizzled weight images.
To this we add the variance at each pixel from the Poisson noise due the sources themselves. We take the square root of this total variance and divide by the computed exposure time in each pixel to arrive at a noise map in electrons s-1, matching our input images. This is provided as a “sigma image” to GALFIT for each source.
We simultaneously fit all neighbouring sources whose centers fall within 10 half-light radii of each object, provided they are no more than than 4 magnitudes fainter than the primary source. This allows us to account for any contamination from nearby sources.
For the AEGIS, COSMOS, GOODS-S, and UDS
fields we utilize their respective published F140W Point Spread Functions (PSFs) from Skelton
et al. (2014). To construct the PSF of our XLSSC 122 galaxies we first identify “clean” stars in our WFC3 F140W imaging as those with F140W that have no contamination from nearby sources within a square region of width 3 arcseconds. We find three such stars with F140W magnitudes of 19.4, 19.7, 19.9. We then perform three separate GALFIT runs on the XLSSC 122 galaxies with the PSF set as: 1) the nearest clean star, 2) the brightest clean star, and 3) the published F140W PSF for the COSMOS field from Skelton
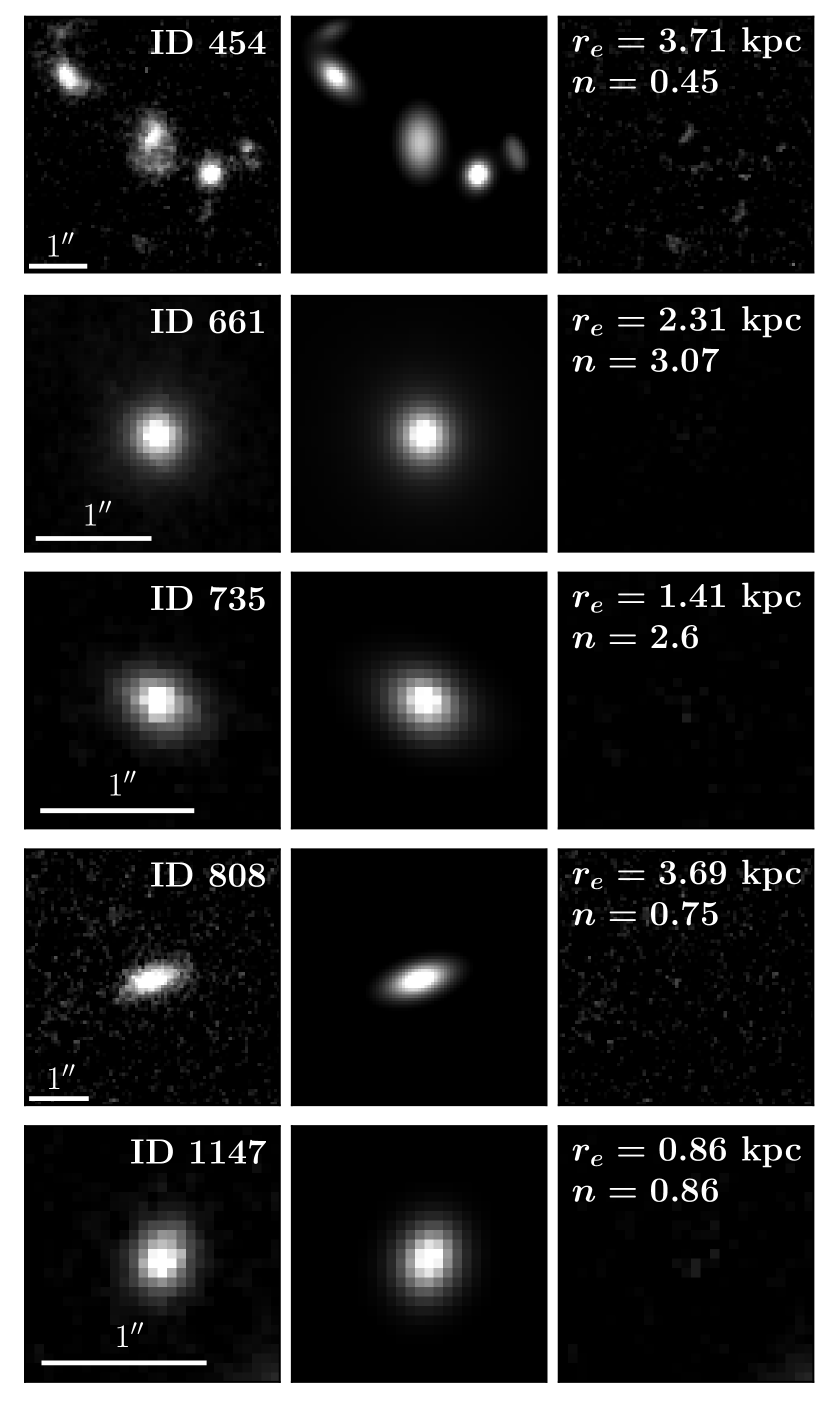
et al. (2014). For all sources but three, which are contaminated by significant Intra-Cluster Light (ICL; discussed below), we find that the measured agree within uncertainties for all three runs. This suggests that our choice of PSF is not impacting the accuracy of our measurements and we select the brightest clean star with F140W as our default PSF since it resulted in the highest precision measurements. This PSF is convolved with a pixel region ( arcseconds) centered on each model component during the fitting routine. A set of sample fits to XLSSC 122 members are shown in Fig. 3.
The Brightest Cluster Galaxy (BCG) in XLSSC 122 and two nearby gold quiescent members are contaminated by significant ICL and have large ( per cent) errors on the measured following the procedure above. These sources are refit with a larger fitting region of 40 times the half light radius which resulted in visually confirmed robust fits with significantly smaller errors.
We identify failures in our fitting procedure as those with . There are zero failures among XLSSC 122 members and 9 in the control field. We visually inspect these failures and find them to be almost entirely associated with low surface brightness, irregular galaxies that are poorly characterized by a single component Sérsic fit. These sources are excluded from our study going forward.
We test our fitting procedure by refitting a sample of COSMOS galaxies and comparing to the published structural parameters in Van Der Wel et al. (2012). This comparison is detailed in Appendix A. We find our measured to be on average 2.4 per cent smaller than the published values. This difference is reasonable given the average cataloged error of per cent on these high redshift sources and negligible for the purposes of our analysis. The fitting region and convolution box-sizes described above have been tuned to maximize the agreement of our measured radii to the cataloged radii in this test.
2.6 Stellar masses
We determine the stellar masses of the XLSSC 122 quiescent members by starting with the stellar masses published in Willis
et al. (2020), which were measured using F105W and F140W magnitudes from 0.8 arcsecond apertures. We apply a correction factor to these masses to account for the fact that fixed sized apertures will be missing light from larger sources and will be contaminated by the ICL for sources near the BCG. We do this by leveraging the fact that our GALFIT routine disentangles the source flux from the local ICL of each source by modelling the ICL as a background. We use our Sérsic fits to compute a fully integrated source flux and convert to a total mass value.
The mass correction factor, , is computed as:
| (3) |
where is the F140W magnitude from a fixed aperture and is the fully integrated magnitude from our best fitting Sérsic model. The value of ranges from for members significantly contaminated by ICL to for the largest cluster members. The stellar masses of the quiescent cluster members are cataloged in Table 1. Note that with only two bands of HST photometry, we are unable to reliably determine stellar masses for star-forming cluster members.
3 Passive and active galaxy populations
3.1 Environmental quenching
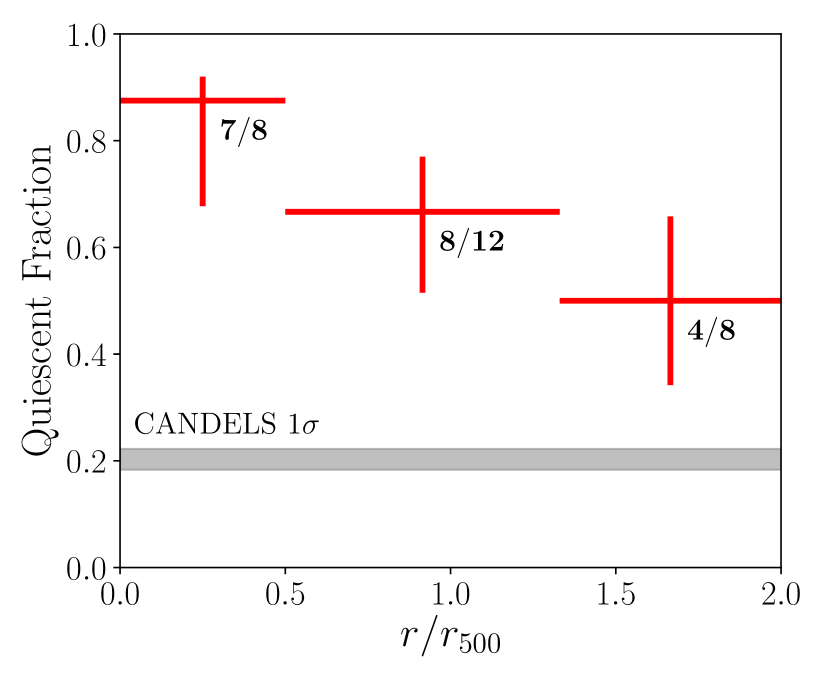
We show in Fig. 4 the cluster quiescent fraction as a function of cluster-centric distance. We find a quiescent fraction of per cent within 0.5, significantly enhanced over the field value of per cent. Clearly, the cluster environment has played a powerful role in quenching its member systems, truncating star formation in its core in a remarkably similar fashion to massive clusters in the local Universe (e.g. von der Linden et al., 2010; Mahajan et al., 2010). Similar quiescent fractions have also been found in the cores of other high- clusters (e.g. Strazzullo et al., 2013; Newman et al., 2014; Strazzullo et al., 2019). However, all such clusters at were selected through the IR color of their galaxy populations, which can be biased towards selecting clusters with higher quiescent fractions.333Apart from XLSSC 122, the highest redshift ICM selected cluster discovered to date is SPT-CLJ0459-4947 at (Strazzullo et al., 2019) For the first time, we are now observing the same behaviour in an ICM selected cluster at , corresponding to a lookback time of more than 10 Gyrs.
XLSSC 122 is very unlikely to have assembled earlier than 1 Gyr prior to the epoch of observation (Willis et al., 2020), yet we observe a remarkably clear red sequence and a dramatically enhanced quiescent fraction in the cluster core (see Figs. 1 and 4). This suggests that if environmental processes that operate on the halo mass scale of the cluster are responsible for quenching star formation, they must be relatively fast acting. Alternatively, processes that operate on smaller halo mass scales (e.g. in proto-cluster and group environments) and longer timescales, such as the pre-processing of cluster member galaxies through mergers, could be driving the truncation of star formation.
The continuous increase of the passive fraction from to the core (Fig. 4) suggests ram pressure stripping or pre-processing by mergers may be the dominant transformation mechanisms acting on XLSSC 122 member galaxies (Abadi et al., 1999; Fujita, 1998; Mihos, 1995). Processes such as “strangulation”, “starvation”, and “harassment” operate on the cluster mass scale over 2 Gyr timescales (McGee et al., 2009; Larson et al., 1980; Moore et al., 1999) and are therefore less likely. This is contrary to the conclusions of Treu et al. (2003) in their study of Cl 0024+16, a cluster, where they suggest harassment and starvation as the main drivers of the mild radial trend. They argue for a longer timescale due to the remarkable homogeneity of the red-sequence galaxy population in the cluster, which is also a characteristic of XLSSC 122. However, Treu et al. (2003) notes that there is much scatter in the morphology-density relation in CL 0024+16 beyond the core and that many systems appear to retain a connection to their local substructures. As such, merging systems in pre-processed groups could be a common quenching mechanism in both systems.
3.2 Galaxy morphologies

We investigate the morphological properties of the cluster members through their Sérsic indices as is commonly done in the literature (e.g. Strazzullo et al., 2013; Lani et al., 2013; Matharu et al., 2019). We characterize galaxies with Sérsic indices and as “disk-like” and “bulge-like” respectively.
This morphological separation is illustrated on the cluster CMD in Fig. 1. We find that per cent of quiescent cluster members with are bulge-like, in agreement with the per cent quiescent fraction found by Strazzullo et al. (2013) for the same mass range in an IRAC selected cluster at . This is a significant enhancement relative to the per cent bulge-like fraction found for similarly massive quiescent galaxies in the CANDELS control field. Our results are comparable to those found by cluster studies at low to intermediate redshifts (e.g. Moran et al., 2007; Cooper et al., 2012; Kuchner et al., 2017) where the cluster enhancement is typically attributed to environmental processes that cause a fading of the stellar disc relative to the inner bulge.
If it were environmental processes that were driving this morphological difference between XLSSC 122 and the field, we would expect to see some dependence on cluster-centric radius (since environmental processes may depend strongly on local density and/or tidal forces, e.g. Moran et al., 2007; Treu et al., 2003; Kuchner et al., 2017). However, we find no physical segregation of galaxy morphologies in XLSSC 122, with sources characterized by a range of Sérsic indices existing across all cluster-centric radii. This contrasts with Strazzullo et al. (2013) where it was found that all systems fell within in an IRAC selected cluster.
Additionally, we find that only per cent of cluster star forming galaxies are bulge-like. This correlation between the star-formation and morphological properties of our cluster member galaxies is consistent with observations made in both high and low density environments at high- (e.g. Papovich et al., 2012; Patel et al., 2012).
4 Mass-size relation
We compare the mass-size relation of quiescent XLSSC 122 members to those in the control field by fitting a relation of the form,
| (4) |
to both samples. Following van der Wel et al. (2014), we use a mass pivot of in Eq. 4 and we restrict our analysis to sources with . Sizes for both samples are measured in the F140W band as described in Section 2.5. Our final sample consists of 13 quiescent cluster members and 68 field sources.
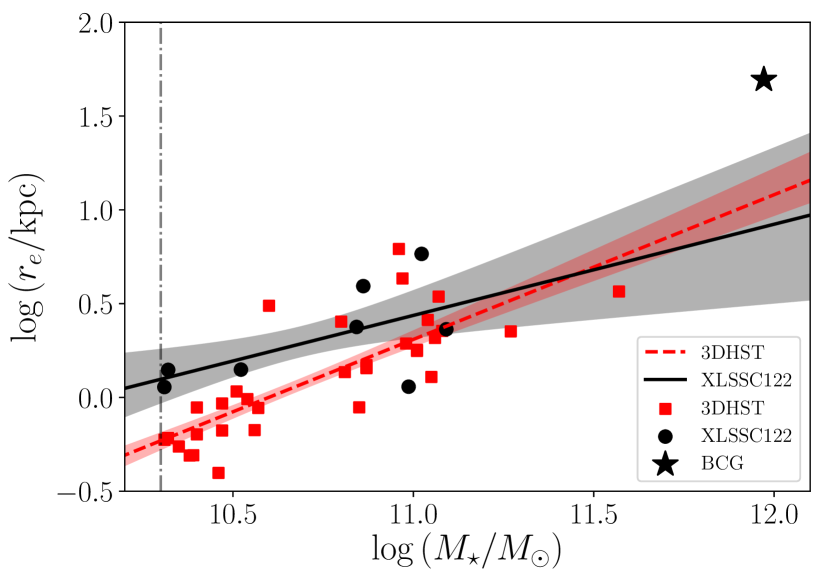
We determine the best fitting model parameters and their uncertainties by performing a simple least-squares linear regression on 1000 bootstrapped samples of the cluster and field. The resultant mass-size relations are shown in the left panel of Fig. 5. We find no statistically significant difference between the two relations in these samples. Note that we exclude the BCG from the cluster fit as it has likely evolved through different processes than the general cluster galaxy population; however, our results do not significantly change with its inclusion.
4.1 Morphological dependence
We perform the same mass-size fits as above on the bulge-like, , population in the cluster and the field. The results are shown in the right panel of Fig. 5. There are 8 such cluster galaxies and 29 field galaxies. Here we also exclude the BCG from the cluster fit but our results are independent of its inclusion.
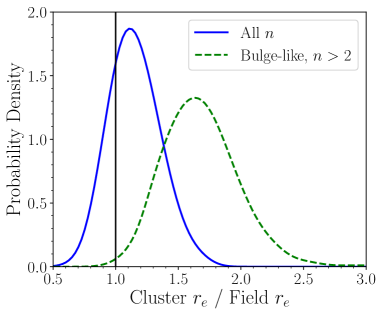
The posteriors in Fig. 6 show the ratio between the cluster effective radius at a fixed mass of (corresponding to in Eq. 4) and that of the field. They are shown for all galaxy morphologies and only bulge-like morphologies. These distributions were derived by computing the ratio of for the cluster and field fits across 1000 bootstrapped samples.
While there is no significant difference between galaxy sizes in the cluster and field when considering all morphologies, the result is different when looking at only bulge-like galaxies. These galaxies are found to be larger than their field counterparts at 99.6 per cent confidence, being on average per cent larger.
Our observations are broadly consistent with the limited number of previous studies performed at , where quiescent cluster galaxies have also been found to be larger than their field counterparts (Bassett et al., 2013; Zirm et al., 2012; Strazzullo et al., 2013; Papovich et al., 2012). However, many of these studies look at proto-cluster environments and/or rely heavily on photometric redshifts. In none of these studies is the cluster ICM selected, which is crucial for galaxy population studies; this paper presents the first such data. Furthermore, due to small sample sizes and photometric redshift limitations, prior observations have only been able to claim larger sizes relative to the field at modest () significance (see Matharu et al., 2019, for a detailed comparison between the results of studies).
At first glance our results may appear to contrast with those of Newman et al. (2014), where no difference was found between quiescent galaxy sizes in the JKCS 041 cluster versus the field, even when selecting based on spheroid-dominated morphologies. At , with 15 spectroscopically identified quiescent cluster members and diffuse ICM emission observed by Chandra, JKCS 041 is the most similar cluster to XLSSC 122 that has been studied. However, with a mass completeness limit of , Newman et al. (2014) focus on higher mass galaxies than we do here. In particular, at a fixed mass of , we find our bulge-like cluster galaxies to be larger than the field only at the level, bringing our findings into agreement with those of Newman et al. (2014).444Newman et al. (2014) characterizes the morphology of galaxies using the axis-ratio, , of single Sérsic profile fits rather than the Sérsic index, , used here. We test our results by applying an additional selection of and on our bulge-like sample and find no statistically significant difference in our fits. Conversely, the difference becomes more significant for galaxies with . This same trend, where the difference between cluster and field galaxy sizes becomes more pronounced at smaller masses, was also found by Papovich et al. (2012) in a protocluster.
4.2 Minor merger driven size growth
Observations of quiescent galaxies in the field have almost unanimously observed galaxies growing larger in size over cosmic time, at fixed stellar mass (e.g Newman et al., 2012; van der Wel et al., 2014). While the physical mechanisms behind this disproportionate growth in size relative to mass are only partially understood, minor mergers are commonly invoked as a plausible explanation (e.g. Trujillo et al., 2011; Ferreras et al., 2014; Matharu et al., 2019).
In this study we observe a statistically significant enhancement of bulge-like quiescent cluster member sizes relative to the field. The morphological dependence of the mass-size relation that we observe can be understood in the context of minor merger driven size growth. Galaxies that have indeed been subject to enhanced merger histories are less likely to have maintained their fragile stellar disks and are expected to have more bulge-dominant light profiles (e.g. Hopkins et al., 2009; Kormendy et al., 2009).
At , comparative studies between quiescent galaxies in cluster/proto-cluster versus field environments have typically found larger size galaxies to be preferentially located in denser environments (e.g. Papovich et al., 2012; Strazzullo et al., 2013; Delaye et al., 2014; Andreon, 2018). The physical driver of these observations has also typically been attributed to merger driven size growth. Cluster member galaxies at have likely experienced more mergers than co-eval field galaxies over their lifetime, driven by enhanced galaxy interaction rates during the formation of clusters when velocity dispersions are low and galaxy densities are high (e.g. Delaye et al., 2014). If it is these interactions that are driving the disproportionate growth of galaxy sizes relative to mass, we would expect to see the enhanced cluster member sizes relative to the field that are observed.
Observations of the local universe () find no dependence of the quiescent mass-size relation on local density (e.g. Weinmann et al., 2009; Maltby et al., 2010; Cappellari, 2013). Therefore, there must be in place a mechanism for the field galaxies to catch-up in size with cluster members, or, conversely, for the growth of cluster galaxies to slow down relative to the field from to the present. This is precisely what happens in the high-velocity dispersion environments associated with high-mass, virialized clusters, which greatly suppress the rate of interactions between cluster members (e.g. McIntosh et al., 2008; Mamon, 1992). Thus, while initially subject to enhanced interaction rates in the proto-cluster/group environments preceding cluster formation (e.g. Papovich et al., 2012; Bassett et al., 2013; Lotz et al., 2013), once accreted into a massive, virialized cluster, the future size-growth of cluster members is inhibited (e.g. Matharu et al., 2019).
5 Summary and conclusions
This study has analyzed the galaxy population in XLSSC 122, an ICM selected, virialized cluster at . The relationship between star formation activity, stellar mass, and galaxy struture has been investigated for 28 spectroscopically confirmed cluster members with F140W and . We compare these galaxies to a similarly selected control field from CANDELS with and F140W . Our primary findings are as follows:
-
1.
The cluster environment has dramatically quenched its member galaxies with a quiescent fraction of per cent within 0.5, significantly enhanced relative to the field value of per cent at .
-
2.
We find an excess of “bulge-like” quiescent cluster members with Sérsic index relative to the field but see no evidence for any physical segregation of these members within the cluster itself.
-
3.
At a fixed mass of , bulge-like, quiescent galaxies in the cluster are larger than their field counterparts at 99.6 per cent confidence. This suggests that these cluster member galaxies have experienced an accelerated size evolution relative to the field at .
XLSSC 122 is the first and only ICM selected cluster observed at and current observations only cover out to the cluster virial radius (). Extending observations of XLSSC 122 out to larger radii will allow for more detailed comparisons with the environmental quenching present in low- clusters, which has been observed to operate out to (e.g. Boselli & Gavazzi, 2006; von der Linden et al., 2010). Additionally, new X-ray and SZ surveys, such as eROSITA, SPT-3G, and Advanced-ACT, to be followed in the mid/late 2020s by CMB-S4 and Athena, will find potentially hundreds of comparably massive, ICM selected clusters at . Combined with HST and JWST observations, these clusters will provide powerful statistical insight into the physical mechanisms behind the quenching and size evolution of cluster member galaxies in the early universe.
Acknowledgements
This work is based on observations made with the NASA/ESA Hubble Space Telescope (GO 15267, 12177, and 12328), which is operated by the Association of Universities for Research in Astronomy, Inc., under NASA contract NAS5-26555. E.N., R.E.A.C., S.W.A., and A.M. acknowledge support from NASA grant number HST-GO-15267.002-A. E.N. and J.P.W. acknowledge support from the Natural Sciences and Engineering Research Council of Canada. This work was supported in part by the U.S. Department of Energy under contract number DE-AC02-76SF00515. The Cosmic Dawn Center is funded by the Danish National Research Foundation. This research made use of Astropy,555http://www.astropy.org a community-developed core Python package for Astronomy (Astropy Collaboration et al., 2013; Price-Whelan et al., 2018).
Data Availability
The data underlying this article are available in the article and in its online supplementary material.
References
- Abadi et al. (1999) Abadi M. G., Moore B., Bower R. G., 1999, MNRAS, 308, 947
- Andreon (2013) Andreon S., 2013, A&A, 554, A79
- Andreon (2018) Andreon S., 2018, Astronomy and Astrophysics, 617
- Astropy Collaboration et al. (2013) Astropy Collaboration et al., 2013, A&A, 558, A33
- Baldry et al. (2006) Baldry I. K., Balogh M. L., Bower R. G., Glazebrook K., Nichol R. C., Bamford S. P., Budavari T., 2006, Monthly Notices of the Royal Astronomical Society, 373, 469
- Bassett et al. (2013) Bassett R., et al., 2013, Astrophysical Journal, 770
- Bekki (1998) Bekki K., 1998, ApJ, 502, L133
- Bekki et al. (2002) Bekki K., Couch W. J., Shioya Y., 2002, ApJ, 577, 651
- Bertin & Arnouts (1996) Bertin E., Arnouts S., 1996, A&AS, 117, 393
- Boselli & Gavazzi (2006) Boselli A., Gavazzi G., 2006, PASP, 118, 517
- Brammer (2019) Brammer G., 2019, Grizli: Grism redshift and line analysis software (ascl:1905.001)
- Brammer et al. (2012) Brammer G. B., et al., 2012, ApJS, 200, 13
- Brodwin et al. (2013) Brodwin M., et al., 2013, ApJ, 779, 138
- Bruzual & Charlot (2003) Bruzual G., Charlot S., 2003, MNRAS, 344, 1000
- Butcher & Oemler (1978) Butcher H., Oemler A., 1978, The Astrophysical Journal, 219, 18
- Cameron (2011) Cameron E., 2011, Publications of the Astronomical Society of Australia, 28, 128
- Cappellari (2013) Cappellari M., 2013, ApJ, 778, L2
- Cooper et al. (2012) Cooper M. C., et al., 2012, Monthly Notices of the Royal Astronomical Society, 419, 3018
- Delaye et al. (2014) Delaye L., et al., 2014, Monthly Notices of the Royal Astronomical Society, 441, 203
- Dressler (1980) Dressler A., 1980, The Astrophysical Journal, 236, 351
- Ebeling et al. (2014) Ebeling H., Stephenson L. N., Edge A. C., 2014, ApJ, 781, L40
- Ehlert et al. (2014) Ehlert S., et al., 2014, MNRAS, 437, 1942
- Farouki & Shapiro (1981) Farouki R., Shapiro S. L., 1981, ApJ, 243, 32
- Ferreras et al. (2014) Ferreras I., et al., 2014, MNRAS, 444, 906
- Fujita (1998) Fujita Y., 1998, ApJ, 509, 587
- Gobat et al. (2011) Gobat R., et al., 2011, A&A, 526, A133
- Gunn & Gott (1972) Gunn J. E., Gott J. Richard I., 1972, ApJ, 176, 1
- Hogg et al. (2003) Hogg D. W., et al., 2003, ApJ, 585, L5
- Hopkins et al. (2009) Hopkins P. F., Cox T. J., Younger J. D., Hernquist L., 2009, Astrophysical Journal, 691, 1168
- Kampczyk et al. (2013) Kampczyk P., et al., 2013, ApJ, 762, 43
- Kodama & Arimoto (1997) Kodama T., Arimoto N., 1997, A&A, 320, 41
- Koekemoer et al. (2011) Koekemoer A. M., et al., 2011, Astrophysical Journal, Supplement Series, 197
- Kormendy et al. (2009) Kormendy J., Fisher D. B., Cornell M. E., Bender R., 2009, Astrophysical Journal, Supplement Series, 182, 216
- Kriek et al. (2009) Kriek M., Van Dokkum P. G., Labbé I., Franx M., Illingworth G. D., Marchesini D., Quadri R. F., 2009, Astrophysical Journal, 700, 221
- Kuchner et al. (2017) Kuchner U., Ziegler B., Verdugo M., Bamford S., Häußler B., 2017, Astronomy and Astrophysics, 604, 1
- Lani et al. (2013) Lani C., et al., 2013, MNRAS, 435, 207
- Larson et al. (1980) Larson R. B., Tinsley B. M., Caldwell C. N., 1980, ApJ, 237, 692
- Lidman et al. (2008) Lidman C., et al., 2008, A&A, 489, 981
- Lin et al. (2010) Lin L., et al., 2010, ApJ, 718, 1158
- Lotz et al. (2013) Lotz J. M., et al., 2013, ApJ, 773, 154
- Mahajan et al. (2010) Mahajan S., Haines C. P., Raychaudhury S., 2010, MNRAS, 404, 1745
- Maltby et al. (2010) Maltby D. T., et al., 2010, MNRAS, 402, 282
- Mamon (1992) Mamon G. A., 1992, ApJ, 401, L3
- Mantz et al. (2014) Mantz A. B., et al., 2014, ApJ, 794, 157
- Mantz et al. (2018) Mantz A. B., et al., 2018, A&A, 620, A2
- Matharu et al. (2019) Matharu J., et al., 2019, Monthly Notices of the Royal Astronomical Society, 484, 595
- McGee et al. (2009) McGee S. L., Balogh M. L., Bower R. G., Font A. S., McCarthy I. G., 2009, Monthly Notices of the Royal Astronomical Society, 400, 937
- McIntosh et al. (2008) McIntosh D. H., Guo Y., Hertzberg J., Katz N., Mo H. J., van den Bosch F. C., Yang X., 2008, MNRAS, 388, 1537
- Mei et al. (2009) Mei S., et al., 2009, ApJ, 690, 42
- Mihos (1995) Mihos J. C., 1995, ApJ, 438, L75
- Momcheva et al. (2016) Momcheva I. G., et al., 2016, The Astrophysical Journal Supplement Series, 225, 27
- Moore et al. (1996) Moore B., Katz N., Lake G., Dressler A., Oemler A., 1996, Nature, 379, 613
- Moore et al. (1999) Moore B., Lake G., Quinn T., Stadel J., 1999, MNRAS, 304, 465
- Moran et al. (2007) Moran S. M., Ellis R. S., Treu T., Smith G. P., Rich R. M., Smail I., 2007, The Astrophysical Journal, 671, 1503
- Newman et al. (2012) Newman A. B., Ellis R. S., Bundy K., Treu T., 2012, ApJ, 746, 162
- Newman et al. (2014) Newman A. B., Ellis R. S., Andreon S., Treu T., Raichoor A., Trinchieri G., 2014, Astrophysical Journal, 788, 51
- Noordeh et al. (2020) Noordeh E., et al., 2020, MNRAS, 498, 4095
- Papovich et al. (2012) Papovich C., et al., 2012, Astrophysical Journal, 750
- Patel et al. (2012) Patel S. G., Holden B. P., Kelson D. D., Franx M., van der Wel A., Illingworth G. D., 2012, ApJ, 748, L27
- Peng et al. (2002) Peng C. Y., Ho L. C., Impey C. D., Rix H.-W., 2002, AJ, 124, 266
- Pierre et al. (2006) Pierre M., et al., 2006, MNRAS, 372, 591
- Price-Whelan et al. (2018) Price-Whelan A. M., et al., 2018, AJ, 156, 123
- STScI Development Team (2013) STScI Development Team 2013, pysynphot: Synthetic photometry software package (ascl:1303.023)
- Skelton et al. (2014) Skelton R. E., et al., 2014, Astrophysical Journal, Supplement Series, 214
- Strazzullo et al. (2006) Strazzullo V., et al., 2006, A&A, 450, 909
- Strazzullo et al. (2013) Strazzullo V., et al., 2013, Astrophysical Journal, 772
- Strazzullo et al. (2019) Strazzullo V., et al., 2019, A&A, 622, A117
- Treu et al. (2003) Treu T., Ellis R., Kneib J.-P., Dressler A., Smail I., Czoske O., Oemler A., Natarajan P., 2003, ApJ, 591, 53
- Trujillo et al. (2011) Trujillo I., Ferreras I., de La Rosa I. G., 2011, MNRAS, 415, 3903
- Van Der Wel et al. (2012) Van Der Wel A., et al., 2012, Astrophysical Journal, Supplement Series, 203
- Weinmann et al. (2009) Weinmann S. M., Kauffmann G., van den Bosch F. C., Pasquali A., McIntosh D. H., Mo H., Yang X., Guo Y., 2009, MNRAS, 394, 1213
- Whitaker et al. (2014) Whitaker K. E., et al., 2014, ApJ, 795, 104
- Willis et al. (2013) Willis J. P., et al., 2013, MNRAS, 430, 134
- Willis et al. (2020) Willis J. P., et al., 2020, Nature, 577, 39
- Zirm et al. (2012) Zirm A. W., Toft S., Tanaka M., 2012, Astrophysical Journal, 744
- van der Wel et al. (2014) van der Wel A., et al., 2014, The Astrophysical Journal, 788, 28
- von der Linden et al. (2010) von der Linden A., Wild V., Kauffmann G., White S. D. M., Weinmann S., 2010, MNRAS, 404, 1231
Appendix A Robustness of size measurements
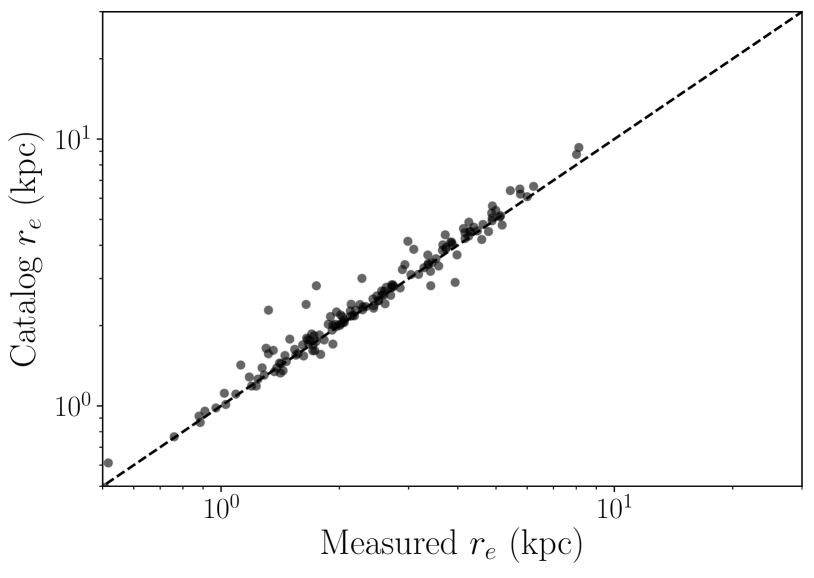
We test the efficacy of our GALFIT pipeline in determining accurate half-light radii by refitting a subset of COSMOS galaxies analysed in Van Der Wel
et al. (2012) and comparing to the cataloged radii. We select galaxies with , F140W, and in order to best match those in our analysis. We perform the measurements in the F125W band as it is the closest band to F140W that has published structural parameters. Fitting is performed in an identical fashion to that described in Section 2.5 with the only difference being that we utilize the published F125W PSF from the Van Der Wel
et al. (2012) study.
The results of this test are shown in Fig. 7. We find an average offset between our measurements and those cataloged in Van Der Wel et al. (2012) of 2.4 per cent. Our measurements are on average smaller by this amount. This level of disagreement is well within expectations for the high-redshift, low signal-to-noise sources that we are focused on and is negligible for the purposes of our study. The mean cataloged error on the sizes of these sources in Van Der Wel et al. (2012) is 6.4 per cent. The fitting region and convolution box-sizes described in Section 2.5 have been tuned to maximize the agreement of our measured radii to the cataloged radii in this test.
Appendix B XLSSC 122 cluster members
| ID | RA (deg) | Dec (deg) | Type | Colour | F140W | (kpc) | (kpc) | ||||
|---|---|---|---|---|---|---|---|---|---|---|---|
| 529 | 34.4342 | -3.7588 | Q | 1.44 | 20.636 | 7.56 | 0.82 | 0.01 | |||
| 455 | 34.4223 | -3.7635 | Q | 1.29 | 21.950 | 2.94 | 0.94 | 1.31 | |||
| 661 | 34.4341 | -3.7577 | Q | 1.49 | 21.668 | 3.07 | 0.90 | 0.11 | |||
| 1036 | 34.4324 | -3.7499 | Q | 1.33 | 22.385 | 5.03 | 0.51 | 0.92 | |||
| 300 | 34.4350 | -3.7679 | Q | 1.56 | 22.503 | 2.57 | 0.74 | 0.95 | |||
| 920 | 34.4356 | -3.7531 | S | 0.43 | 22.725 | - | 6.39 | 0.85 | 0.60 | ||
| 305 | 34.4472 | -3.7680 | Q | 1.42 | 22.525 | 7.30 | 0.41 | 1.64 | |||
| 1057 | 34.4369 | -3.7502 | Q | 1.37 | 22.848 | 1.63 | 0.51 | 0.93 | |||
| 1065 | 34.4359 | -3.7495 | Q | 1.35 | 22.341 | 0.94 | 0.37 | 0.96 | |||
| 608 | 34.4385 | -3.7607 | Q | 1.28 | 22.991 | 1.21 | 0.74 | 0.49 | |||
| 243 | 34.4224 | -3.7700 | Q | 1.20 | 22.617 | 2.17 | 0.60 | 1.67 | |||
| 847 | 34.4347 | -3.7549 | Q | 1.38 | 23.382 | 1.94 | 0.84 | 0.40 | |||
| 375 | 34.4441 | -3.7657 | S | 0.66 | 23.082 | - | 2.89 | 0.85 | 1.25 | ||
| 735 | 34.4250 | -3.7580 | Q | 1.43 | 23.390 | 2.60 | 0.48 | 0.94 | |||
| 1223 | 34.4433 | -3.7450 | Q | 1.31 | 23.494 | 2.19 | 0.78 | 1.70 | |||
| 347 | 34.4418 | -3.7667 | Q | 1.27 | 23.561 | 2.06 | 0.66 | 1.14 | |||
| 146 | 34.4448 | -3.7729 | S | 0.48 | 22.902 | - | 0.90 | 0.49 | 1.82 | ||
| 497 | 34.4330 | -3.7632 | Q | 1.38 | 23.579 | 2.44 | 0.98 | 0.47 | |||
| 604 | 34.4394 | -3.7603 | S | 0.46 | 23.375 | - | 0.37 | 0.24 | 0.56 | ||
| 1147 | 34.4336 | -3.7477 | S | 0.47 | 23.847 | - | 0.86 | 0.61 | 1.13 | ||
| 407 | 34.4464 | -3.7653 | S | 0.66 | 23.046 | - | 2.75 | 0.49 | 1.43 | ||
| 731 | 34.4398 | -3.7583 | Q | 1.61 | 23.974 | 1.93 | 0.69 | 0.58 | |||
| 653 | 34.4340 | -3.7593 | Q | 1.54 | 22.444 | 4.15 | 0.71 | 0.06 | |||
| 726 | 34.4306 | -3.7576 | Q | 1.28 | 23.464 | 1.00 | 0.71 | 0.38 | |||
| 454 | 34.4190 | -3.7639 | S | 0.45 | 23.689 | - | 0.45 | 0.60 | 1.65 | ||
| 808 | 34.4477 | -3.7561 | S | 1.02 | 23.783 | - | 0.75 | 0.38 | 1.42 | ||
| 554 | 34.4353 | -3.7625 | S | 0.28 | 23.960 | - | 0.36 | 0.26 | 0.40 | ||
| 434 | 34.4466 | -3.7645 | Q | 1.38 | 23.887 | 2.61 | 0.40 | 1.41 |