Radio polarization measurements from RRAT J18191458
Abstract
We present the first polarization measurements of the radio emission from RRAT J18191458. Our observations, conducted in parallel to regular timing sessions, have yielded a small number of bright and polarized pulses. The polarization characteristics and integrated profile resemble those of normal pulsars with average spin-down energy : moderate to low linear polarization in the integrated profile despite relatively high polarization in the individual pulses. On average, a small degree of circular polarization is also observed. The polarization position angle executes a remarkably smooth, steep S-shaped curve, interrupted by two orthogonal jumps. Based on the shape of the PA swing, we place some constraints on the emission geometry. We compare these polarization properties to those of other radio emitting neutron star populations, including young pulsars, pulsars with a high surface magnetic field and radio emitting magnetars. From the polarization measurements, the Faraday rotation measure of this RRAT is derived.
keywords:
pulsars: individual: J18191458 – polarization.1 Introduction
In the last few years, the family of radio emitting neutron stars has been extended by the discovery of radio emission from magnetars (Camilo et al. 2006), intermittent pulsars (Kramer et al. 2006), and extremely sporadic but periodic pulses from Rotating Radio Transients (RRATs, McLaughlin et al. 2006). The physical processes that lead to the observed properties of these new types of astrophysical objects are not well understood despite their classification as neutron stars. This is not surprising given the open problem of radio emission in normal pulsars. Detailed studies of the radio emission properties, however, not only reveal the links between these extreme objects and normal pulsars, but also provide additional clues regarding the mechanism of pulsar radio emission.
RRAT J18191458 has a rotational period of 4.26 s, and a relatively high frequency of events compared to the other RRATs. McLaughlin et al. (2006) report a rate of roughly 1 pulse detection every 3 minutes, while Esamdin et al. (2008) report a detection of 162 bright () pulses in a total of 94 hours of observation. The period and period derivative place this RRAT in a sparsely populated region of the - diagram, between the main pulsar population and magnetars. Given and , the estimated surface magnetic field is Gauss, the characteristic age is a relatively young kyr and the rate of rotational energy loss is a relatively average erg s-1. Clearly RRAT J18191458 is not a typical pulsar. In addition to the sporadic emission properties, the literature reveals that sources with a relatively young characteristic age usually feature high values. It can therefore be used to test whether rather than age determines the degree of polarization as shown by various studies (e.g. von Hoensbroech et al. 1998; Johnston et al. 2006; Weltevrede & Johnston 2008). Observational evidence and theoretical considerations suggest that the degree of linear polarization is regulated by the relative intensity of competing modes of propagation in the pulsar magnetosphere, orthogonal in polarization (e.g. Stinebring et al. 1984, Karastergiou et al. 2002). In many young and highly energetic pulsars, only a single mode is observed. The age and of pulsars have also been associated with the characteristics of any observed high energy emission. More specifically, young pulsars show a more pronounced non-thermal component in their X-ray spectra than older pulsars, whereas high pulsars are very often -ray emitters (Thompson 2004). RRAT J18191458 shows thermal X-ray emission, entirely in-line with what is observed in other pulsars of this characteristic age (McLaughlin et al. 2007).
On the other hand, it is interesting to seek comparisons in the polarization characteristics between RRAT J18191458 and other sources with a high inferred surface magnetic field, the most extreme being the two known radio-emitting magnetars. Unfortunately, there are to date no polarization measurements of the highest pulsars so only a limited comparison is possible with slightly lower pulsars, which we carry out in Section 3 of this paper. Polarization measurements of the two radio-emitting magnetars exist and show very high linear polarization. Both XTE J1810197 (Camilo et al. 2007; Kramer et al. 2007) and 1E 1547.05408 (Camilo et al. 2008) show almost 100% linear polarization in their profiles, the latter being the case at frequencies above 3 GHz. At 1.4 GHz, the polarization of 1E 1547.05408 drops to around 25%, although the reasons appear more likely related to interstellar scattering than intrinsic, which would lead to depolarization toward higher rather than lower frequencies (e.g. Karastergiou et al. 2002). The polarization position angle (PA) tentatively traces a dipolar magnetic field, resulting in the well known S-shaped curve of the single rotating vector model (hereafter RVM) of Radhakrishnan & Cooke (1969), but there is also evidence that the PA swing is variable with time. The radio emission mechanism of these sources is not well understood and it exhibits an unconventional flat spectrum across a very broad range of frequencies.
Weltevrede et al. (2006) identified common elements of RRAT J18191458 to the anomalous amplitude distribution of the unusual pulsar B0656+14. This pulsar sits quite central in the bulk of normal, middle aged pulsars on the - diagram, and is a source of pulsed, high-energy emission. Similar to highly energetic pulsars (for PSR B0656+14, erg s-1) the polarization of this pulsar is very high (Gould & Lyne 1998) at 1.4 GHz. The PA also shows smooth variation in accordance with the RVM (Lyne & Manchester 1988). Interestingly, an observation at 4.85 GHz (von Hoensbroech 1999) shows reduced linear polarization and orthogonal PA jumps in the profile, whereas Johnston et al. (2006) show a total absence of polarization at 8.4 GHz, and discuss the peculiar and abrupt depolarization of this young pulsar towards high frequencies.
In the following we show the first results from polarization measurements of RRAT J18191458, in an attempt to identify similarities with the objects mentioned above and to understand the emission geometry of this RRAT. The observations are described and the results of our analysis are put forward. A brief discussion based on the results and possible interpretations ensues, followed by concluding remarks.
2 Observations and data analysis
Data were obtained at the Parkes radio telescope on 13 epochs from May 2007 to September 2008, using the central beam of the Parkes 21cm multi-beam receiver and the Caltech Parkes Swinburne Recorder Mk II (CPSR2); (Bailes 2003). Two 64 MHz-wide dual-polarisation bands centred on 1341 and 1405 MHz were sampled at the Nyquist rate with 2-bit precision and the raw data recorded to disk for off-line processing. Techniques similar to those described by Knight et al. (2005) were used to search roughly 0.5 h of data per epoch for individual, high signal-to-noise pulses. Dedispersion, calibration and further processing were performed using standard pulsar software packages, DSPSR and PSRCHIVE (Hotan et al. 2004). The data were smoothed to 8192 bins across the profile, achieving a temporal resolution of roughly 0.52 ms. Each of the 64-MHz sidebands was split into 32 frequency channels.
The two CPSR2 sidebands were calibrated independently, and inspected closely for individual pulses. The automatic flagging yielded roughly 20 pulse candidates per epoch, at the 4.26 s period. These were then carefully examined by eye, to reject spurious signals of interference and only pulses of significant S/N after dedispersion that appeared in both CPSR2 sidebands at the highest temporal resolution were considered. As a consequence, an average of 6 pulses were kept per epoch. This extremely cautious procedure resulted in a rate of approximately 10 pulses per hour, which lies between the reported McLaughlin et al. (2006) and Esamdin et al.(2008) rates. It also ensured the total 72 pulses used in this analysis to be bright and contain reliable polarization information. A coherent timing solution was built using these very narrow pulses, in order to obtain the phase connection between the epochs. The small total number of pulses does not permit a statistical analysis on the variability of the polarization, but forms an excellent sample to address the first order polarization issues.
3 Results
3.1 Faraday Rotation Measure
With a dispersion measure (DM) of 196 cm-3pc, it is expected that Faraday rotation will effectively reduce the degree of polarization. The Rotation Measure (RM) was estimated in two ways. The first was to trace the PA of highly polarized pulses across each of the two CPSR2 sidebands, and fit the PA for the well-known dependence on the wavelength squared (). The second was to apply a range of RM values to each pulse, then collapse the data in frequency and trace how the degree of linear polarization changes with RM. The correct RM recovers the maximum linear polarization. With the small number of pulses, the error in the RM measurement is non-negligible, however both methods result in similar values of 33030 rad/m2. This value corresponds to an average parallel magnetic field component of 2Gauss, which is somewhat larger than expected at the nominal distance of roughly 3.5 kpc (according to the NE2001 model of Galactic free electron density of Cordes & Lazio, 2002), although of the expected sign for this rather poorly sampled line of sight. This RM was used to correct the data and regain the maximum polarization.
3.2 Integrated pulse profile
Polarization is an invaluable diagnostic of the radio emission, and even without complete knowledge of the physical processes involved, the polarization can help answer a number of questions. The first question relates to the emission geometry. According to the rotating vector model for pulsar polarization, the observed PA is tied to the magnetic field lines, changing smoothly as the line-of-sight intersects different field lines at different angles, as:
| (1) |
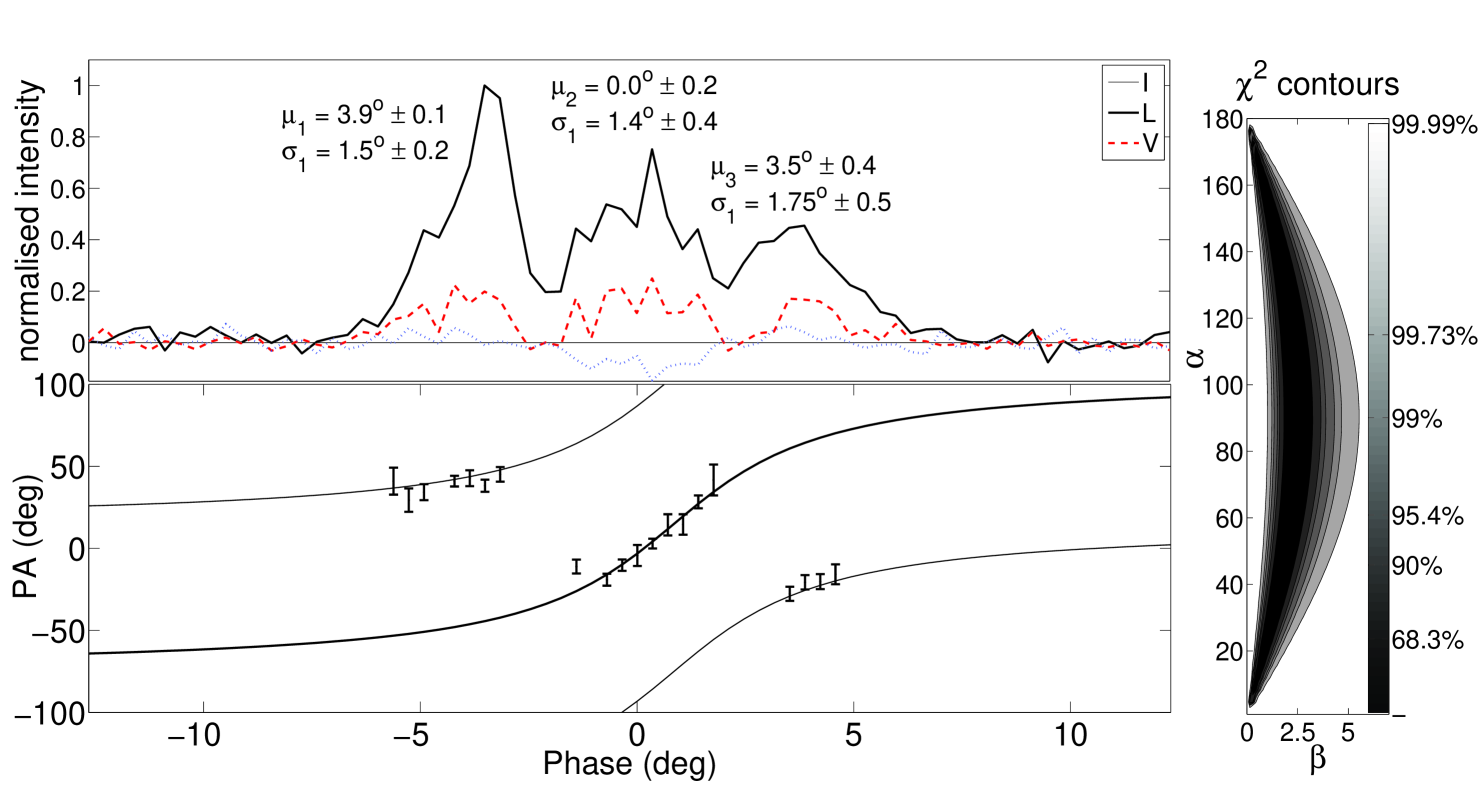
PA0 and are constant offsets in PA and phase, the pulse phase, the inclination angle between magnetic and rotation axis, and the sum of and the impact parameter , which is the nearest angle of approach of the line of sight to the magnetic axis. This equation is derived with the convention that the position angle increases clockwise on the sky. Figure 1 shows the integrated polarization profile from 72 pulses of RRAT J18191458, binned to a temporal resolution of 4.16 ms (1024 bins across the profile), with the total power (solid), linear (dashed) and circular polarization (dotted) in the top panel. The bottom panel shows the measured PAs where the linear polarization is greater than 2.5 . The line represents a fit to Eq. 1, taking into consideration possible orthogonal jumps. The parameters of the fit shown are (at the frequency of observation), , and . Fitting of and was performed via a “brute-force” method of scanning across the 2-D parameter space. The reduced probability contour map of , pairs, shown on the right, indicates a very high probability that the solution lies within the shaded, banana-shaped region; the solution for is well constrained, while quite the opposite is true for .
Fig. 1 paints a familiar picture reminiscent of many normal pulsars, with a 3-component structure of the integrated pulse. As an integration of only 72 pulses, it is merely indicative of the average profile. This imposes limitations on the interpretation of the profile components and widths, which we obtained by fitting (3) Gaussian components, the mean and standard deviation of which are indicated on Fig. 1. These measurements provide two additional, model-dependent, methods to cautiously constrain the geometry, which are outlined in Section 1.3 of Everett & Weisberg (2001) and both make use of the value of the steepest PA gradient, here 24/degree. The first originates from the patchy beam model of Lyne & Manchester (1988) and also relies on a measurement of the profile width at 10% maximum, assuming emission from both sides of a circular beam. Solving Eqs. 5, 6 and 7 of Everett & Weisberg for a 10% width of results in , . The second originates from Rankin (1990), which assumes the central component represents “core” emission and depends on the period and as Eq. 9 of Everett and Weisberg. This yields a solution of , , assuming a half maximum width of the central component of 3.3. Both calculations are in agreement with the contour map in Fig. 1.
The 72 individual pulses, mostly consist of a single, very narrow pulse that falls under one or the other component each carrying its own polarization signature. The three component profile is then consistent with the S-shaped PA swing across the entire profile. The timing solution used here is independent of the polarization. The fact that it yields an integrated PA swing which very closely follows the RVM curve lends significant weight to this solution and hence to the integrated profile presented here. Furthermore, this clearly answers the question regarding the reported 2 bands of timing residuals in Esamdin et al. The bands are in fact 3, owing to the 3 components of the profile and the single Gaussian pulse used for the timing template matching.
Focusing on the polarization, at least 2 clear orthogonal jumps are present in the integrated PA swing, around pulse phase -3.5 and +3 from the designated origin. It is no surprise then that the total degree of linear polarization is relatively low (20-30% under each component), as a result of competing orthogonal modes of polarization. The circular polarization (V) is very low, there is however a tentative sense reversal at a pulse phase of 1. The pulse phase of the steepest PA gradient is poorly defined, as the gradient is approximately constant in the middle component, but it appears to slightly lag the component mean, as would be the case due to kinematic effects of the pulsar rotation (e.g. Blaskiewicz et al. 1991). More exact pulse phase locations for the mean of the central component, the steepest PA gradient and the sense reversal in will provide an estimate of the emission height when a true average profile becomes available.
3.3 Individual pulses
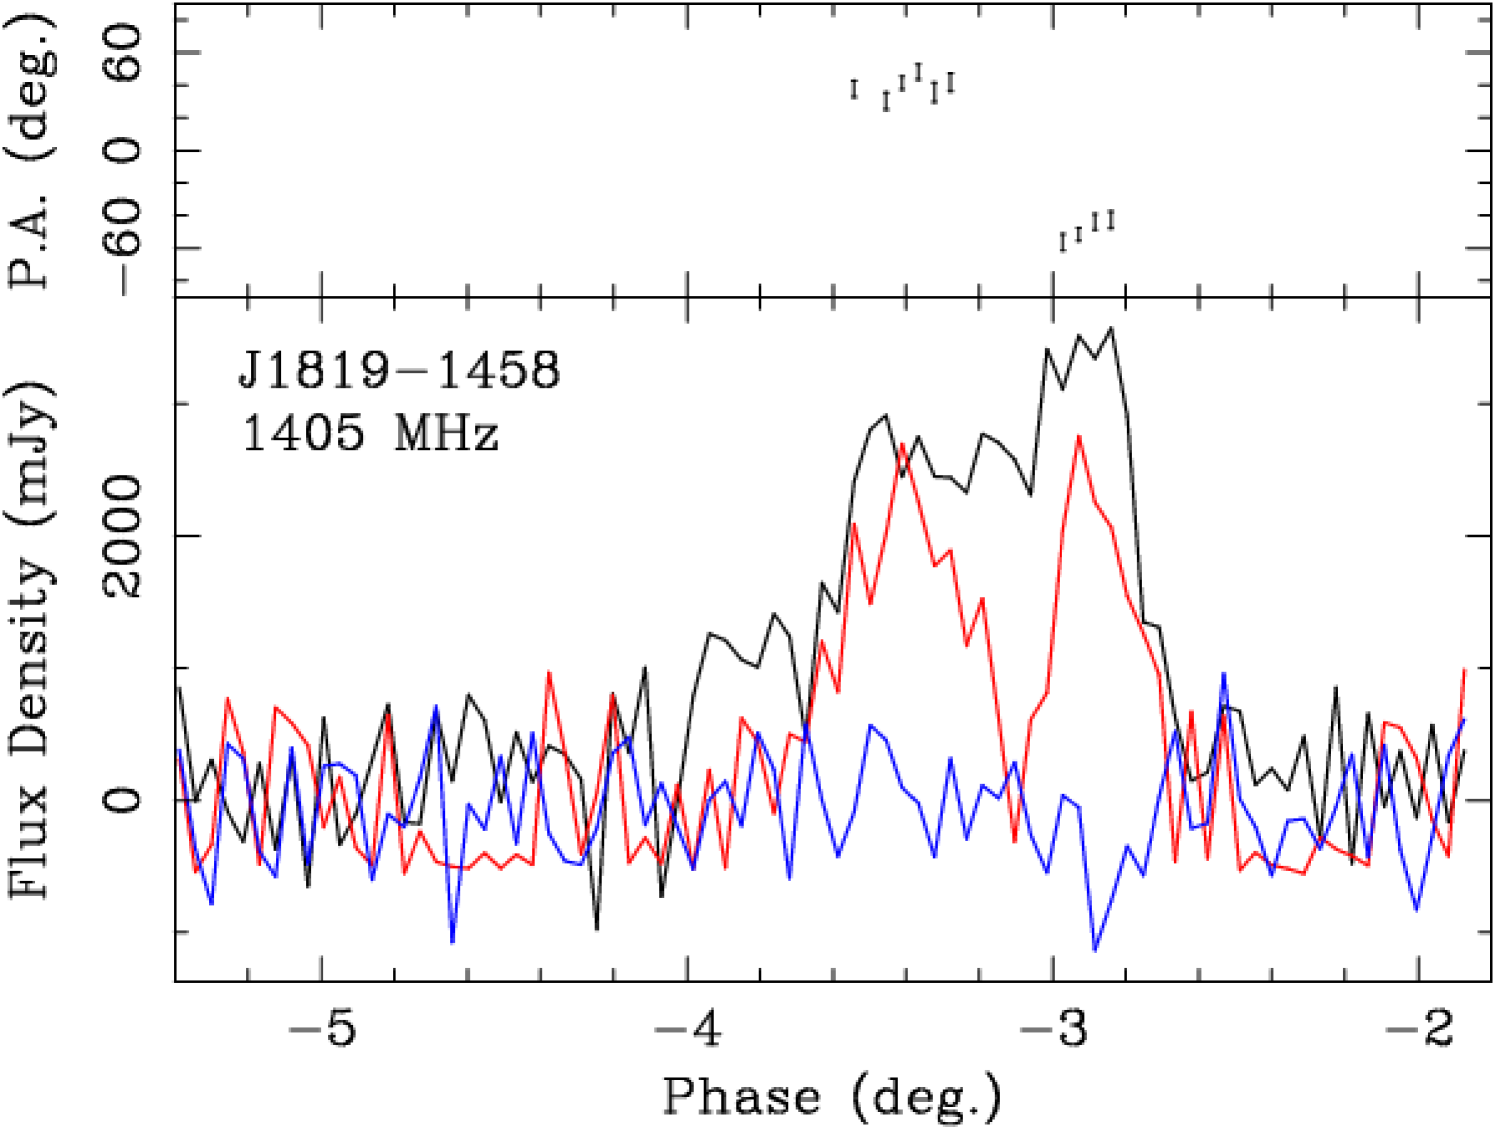
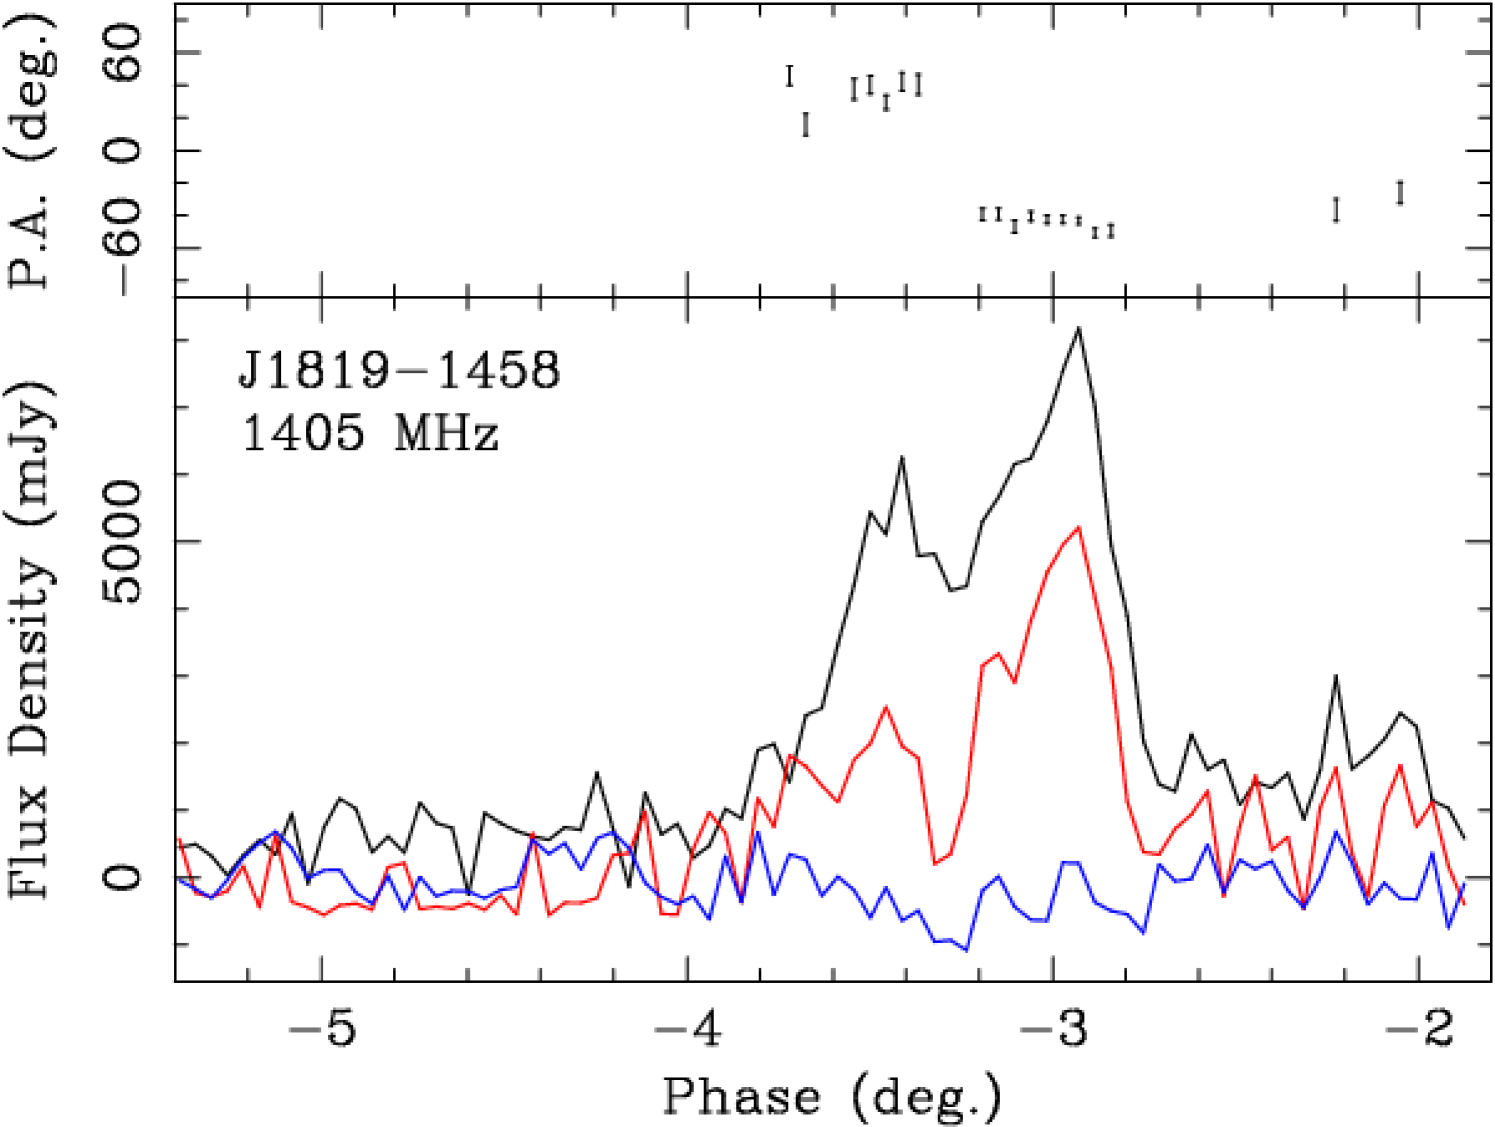
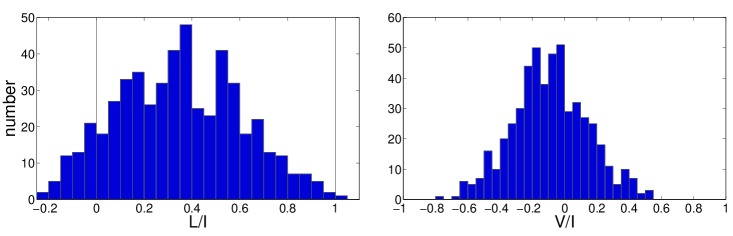
A closer look at the individual pulses that make up the profile of RRAT J18191458 reveals narrow pulses often comprising of a small number of sub-pulses, a few ms in width, with variable degrees of linear and circular polarization, as seen in normal pulsars. Figure 2 (left) shows a histogram of the degree of linear polarization in individual bright data bins (in total power) with S/N5. The degree of linear polarization ranges from 0 to 100% (the values on either side of these limits are due to instrumental noise), with a mean of 37%. This is higher than the linear polarization in the integrated pulse profile, where the addition of pulses in both orthogonal modes reduces the polarization. Figure 2 (right) shows the histogram of the degree of circular polarization, for the same high S/N data bins. The histogram is slightly asymmetric and centred on 6%. In a small number of bins, the degree of circular polarization exceeds 50% in either direction. In the pulses that show clear evidence of 90 PA jumps, the linear polarization drops to a sudden minimum at the pulse phase of the jump, as expected by the superposition of orthogonal polarization modes of equal intensity. Two examples are shown in Figure 3, where the pulse phase reference is the same as Figure 1.
4 Discussion
The polarization observations presented here, albeit from a small sample of pulses, are very revealing as to the nature of the radio emission from RRAT J18191458. With low linear polarization and an average value of , RRAT J18191458 clearly follows the observational paradigm of normal pulsars, also providing further evidence of the link between and the degree of polarization. Furthermore, as RRAT J18191458 is a relatively young pulsar, this work again demonstrates that rather than age is the critical parameter as concerns the degree of linear polarization. The orthogonal PA jumps seen at this frequency are also more typical of pulsars with average than of young pulsars. They also totally distinguish this source from the two radio emitting magnetars, and PSR B0656+14 at this frequency.
At present it is difficult to investigate a possible link between very high surface magnetic field and degree of polarization, owing to a lack of polarization measurements of the highest pulsars. There are, however, some high quality polarization profiles from a number of pulsars with . The parameters and polarization characteristics of these profiles, found in Gould & Lyne (1998), D’Allessandro & McCulloch (1997), Qiao et al. (1995) and Johnston et al. (2008), are summarized in Table 1. Apart from the high , there is nothing exceptional about RRAT J18191458 or any of the listed pulsars in this context. Despite the large values of , there are pulsars with high, moderate or low polarization in this sample. This classification is based on the peak degree of linear polarization in at least one profile component, with the thresholds for high and moderate polarization defined at 75% and 40% respectively. As expected, the highly polarized sources are associated with the highest values of .
| PSR | Gauss | erg s-1 | % polarization |
|---|---|---|---|
| J18191458 | 4.96 | low | |
| B0154+61 | 2.13 | low | |
| B174031 | 1.73 | low | |
| B173730 | 1.70 | high | |
| B1916+14 | 1.60 | moderate | |
| B1849+00 | 1.47 | low | |
| B2002+31 | 1.27 | low | |
| B0525+21 | 1.24 | moderate | |
| B172747 | 1.18 | low | |
| B161050 | 1.08 | high | |
| B184519 | 1.01 | low |
The radio emitting magnetar XTE J1810197 makes for an intriguing counter-example to the high polarization - high link. It is 100% polarized, with an value of only erg s-1(Camilo et al. 2006), indicating a dependence of the degree of polarization on some other parameter, to which may also be linked (e.g. the emission height, Karastergiou & Johnston 2007). This provides an interesting context for a proposition regarding the nature of RRAT J18191458, originally put forward by McLaughlin et al. (2007). By scrutinizing the X-ray spectrum of the source, the authors noticed the comparable temperature of the soft X-ray spectrum to the quiescent state of the magnetar XTE J1810197. They therefore considered the possibility that RRAT J18191458 represents a transitional class of object, between the pulsar and magnetar populations. The polarization data presented here does not strengthen or weaken this scenario, but points towards an observational test. As XTE 1810197 is gradually returning to quiescence, it will be as interesting to look for orthogonal PA jumps and a decrease in the linear polarization, as for intermittent emission typical of RRATs (tentative evidence of the latter can be found in observations in Hotan et al. 2007).
5 Conclusions
We have shown the first polarization measurements of the RRAT J18191458. The integrated linear polarization is moderate to low, owing to the presence of competing orthogonal modes of polarization, although highly polarized individual pulses are observed. The polarization PA traces an S-shaped curve, interrupted by 2 orthogonal jumps, in agreement with the . This confirms both the dipolar structure of the magnetic field at the region where the polarization is set, and the three component pulse profile which leads to the observed bands in the timing residuals. The degree of polarization is low, in accordance with the measured and despite the young age, strengthening the observational link between and the degree of polarization. Polarization observations at higher and lower frequencies should lead to a more complete comparison with the emission properties of PSR B0656+14. If the polarization of RRAT J18191458 behaves like normal pulsars, it should appear more polarized at low frequencies, and probably completely unpolarized at higher frequencies. Finally, it will be interesting to monitor the polarization properties of the radio emitting magnetars to search for orthogonal PA transitions as these sources return to their quiescent state, thereby testing the possibility that RRAT J18191458 represents a transition between pulsars and magnetars.
Acknowledgments
We thank John Sarkissian and John Reynolds, for assistance with the observations and Joanna Rankin for a constructive referee’s report. We are also grateful to all the astronomers present at the telescope who were kind enough to lend a hand in recording our data. The Australia Telescope is funded by the Commonwealth of Australia for operation as a National Facility managed by the CSIRO. AK is indebted to the Leverhulme Trust for financial support. MAM is supported by a WV EPSCOR Research Challenge Grant.
References
- Bailes (2003) Bailes M., 2003, in Bailes M., Nice D. J., Thorsett S., eds, Radio Pulsars Radio pulsars. Astronomical Society of the Pacific, San Francisco, pp 57–64
- Blaskiewicz et al. (1991) Blaskiewicz M., Cordes J. M., Wasserman I., 1991, ApJ, 370, 643
- Camilo et al. (2006) Camilo F., Ransom S. M., Halpern J. P., Reynolds J., Helfand D. J., Zimmerman N., Sarkissian J., 2006, Nature, 442, 892
- Camilo et al. (2008) Camilo F., Reynolds J., Johnston S., Halpern J. P., Ransom S. M., 2008, The Astrophysical Journal, 679, 681
- Camilo et al. (2007) Camilo F., Reynolds J., Johnston S., Halpern J. P., Ransom S. M., van Straten W., 2007, ApJ, 659, L37
- Cordes & Lazio (2002) Cordes J. M., Lazio T. J. W., 2002, preprint (arXiv:astro-ph/0207156)
- D’Alessandro & McCulloch (1997) D’Alessandro F., McCulloch P. M., 1997, MNRAS, 292, 879
- Esamdin et al. (2008) Esamdin A., Zhao C. S., Yan Y., Wang N., Nizamidin H., Liu Z. Y., 2008, Monthly Notices of the Royal Astronomical Society, 389, 1399
- Everett & Weisberg (2001) Everett J. E., Weisberg J. M., 2001, ApJ, 553, 341
- Gould & Lyne (1998) Gould D. M., Lyne A. G., 1998, MNRAS, 301, 235
- Hotan et al. (2007) Hotan A. W., Long S. R., Dickey J. M., Dolley T. J., 2007, The Astrophysical Journal, 668, 449
- Hotan et al. (2004) Hotan A. W., van Straten W., Manchester R. N., 2004, PASA, 21, 302
- Johnston et al. (2008) Johnston S., Karastergiou A., Mitra D., Gupta Y., 2008, MNRAS, 388, 261
- Johnston et al. (2006) Johnston S., Karastergiou A., Willett K., 2006, MNRAS, 369, 1916
- Karastergiou & Johnston (2007) Karastergiou A., Johnston S., 2007, MNRAS, 380, 1678
- Karastergiou et al. (2002) Karastergiou A., Kramer M., Johnston S., Lyne A. G., Bhat N. D. R., Gupta Y., 2002, A&A, 391, 247
- Knight et al. (2005) Knight H. S., Bailes M., Manchester R. N., Ord S. M., 2005, ApJ, 625, 951
- Kramer et al. (2006) Kramer M., Lyne A. G., O’Brien J. T., Jordan C. A., Lorimer D. R., 2006, Science, 312, 549
- Kramer et al. (2007) Kramer M., Stappers B. W., Jessner A., Lyne A. G., Jordan C. A., 2007, MNRAS, 377, 107
- Lyne & Manchester (1988) Lyne A. G., Manchester R. N., 1988, MNRAS, 234, 477
- McLaughlin et al. (2006) McLaughlin M. A., Lyne A. G., Lorimer D. R., Kramer M., Faulkner A. J., Manchester R. N., Cordes J. M., Camilo F., Possenti A., Stairs I. H., Hobbs G., D’Amico N., Burgay M., O’Brien J. T., 2006, Nature, 439, 817
- McLaughlin et al. (2007) McLaughlin M. A., Rea N., Gaensler B. M., Chatterjee S., Camilo F., Kramer M., Lorimer D. R., Lyne A. G., Israel G. L., Possenti A., 2007, ApJ, 670, 1307
- Qiao et al. (1995) Qiao G. J., Manchester R. N., Lyne A. G., Gould D. M., 1995, MNRAS, 274, 572
- Rankin (1990) Rankin J. M., 1990, ApJ, 352, 247
- Richards & Comella (1969) Richards D. W., Comella J. M., 1969, Nature, 222, 551
- Stinebring et al. (1984) Stinebring D. R., Cordes J. M., Rankin J. M., Weisberg J. M., Boriakoff V., 1984, ApJS, 55, 247
- Thompson (2004) Thompson D., 2004, in Camilo F., Gaensler B. M., eds, Young Neutron Stars and Their Environments, IAU Symposium 218 Future Facilities for Gamma Ray Pulsar Studies. Astronomical Society of the Pacific, San Francisco
- von Hoensbroech (1999) von Hoensbroech A., 1999, PhD thesis, University of Bonn
- von Hoensbroech et al. (1998) von Hoensbroech A., Kijak J., Krawczyk A., 1998, A&A, 334, 571
- Weltevrede & Johnston (2008) Weltevrede P., Johnston S., 2008, MNRAS, 391, 1210
- Weltevrede et al. (2006) Weltevrede P., Stappers B. W., Rankin J. M., Wright G. A. E., 2006, ApJ, 645, L149