Radio Properties of Brightest Cluster Members
Abstract:
We searched the literature for radio continuum images and flux densities of the brightest cluster members (BCMs) in 1169 Abell clusters. The clusters were selected on the basis of their morphological type (Bautz-Morgan or Rood-Sastry) or on textual notes in the Abell catalog indicating the presence of dominant galaxies. We inspected the images of existing radio surveys (NVSS, SUMSS, FIRST, WENSS, etc.) and used the CATS and VizieR catalog browsers, as well as additional literature, to collect radio fluxes and radio morphologies for 1423 BCMs in these clusters. We found 578 (41 %) of these BCMs with detected radio emission, of which 223 are detected at only a single frequency, usually at 1.4 GHz (NVSS or FIRST) or 843 MHz (SUMSS). Using the survey images and additional published high-resolution images, we estimated the best available position angle for the innermost radio structure and for the largest angular size of each source. Digitized Sky Survey images were used to obtain the orientation of the optical major axis of the outer envelope of the BCMs, and the acute difference angle between major optical and radio axes was derived for 102 objects. Its distribution shows a similar bimodality as reported previously for a larger BCM sample, although KS tests on both do not distinguish them from uniform ones. The shape of the distribution is independent of optical ellipticity, optical morphological type and largest linear radio size of the objects. In order to find further clusters with dominant central galaxies, the above-mentioned criteria need to be relaxed. From the present study there is at most marginal evidence for a relation between powerful high-redshift radio galaxies and dominant galaxies of low- clusters when comparing their radio-optical alignment angle. We plan to derive radio spectra, radio luminosities and search for possible relations between these parameters and the radio-optical alignment, as well as to quantify the radio morphology and search for relations with the peculiar velocity of the BCMs in their host cluster.
1 Introduction
Powerful radio galaxies at high redshifts () tend to show a strong alignment of their radio and optical major axes, and observations support two models for the origin of this effect [10]: jetinduced star formation and scattering by dust of the light of a central AGN. If these objects were the precursors of dominant cDlike galaxies in low- clusters, as suggested by [8, 10], these latter galaxies should also show signs of a radiooptical alignment [13]. Even though the general population of nearby elliptical radio galaxies favors a radio axis closer to the optical minor axis (cf. [3] for references), a small population of aligned radio galaxies was found among cluster-dominant galaxies [3]. This suggests that environment may influence the relative orientation of optical and radio axes. Here we describe an attempt to increase previous samples based on a systematic search for available radio data of a large sample of optically selected Abell clusters.
2 Methodology
The sample of brightest cluster members (BCMs) was taken from [7] with very minor changes, and consists of 1423 galaxies in 1221 redshift components (i.e. clusters along the line of sight) towards 1169 different Abell clusters. The latter include the supplementary S-clusters and were selected by their morphological type (Bautz & Morgan (BM) I or III, Rood & Sastry (RS) cD), and by comments in the Abell catalog [1] that suggest the presence of a cD galaxy or a “corona” around the BCM.
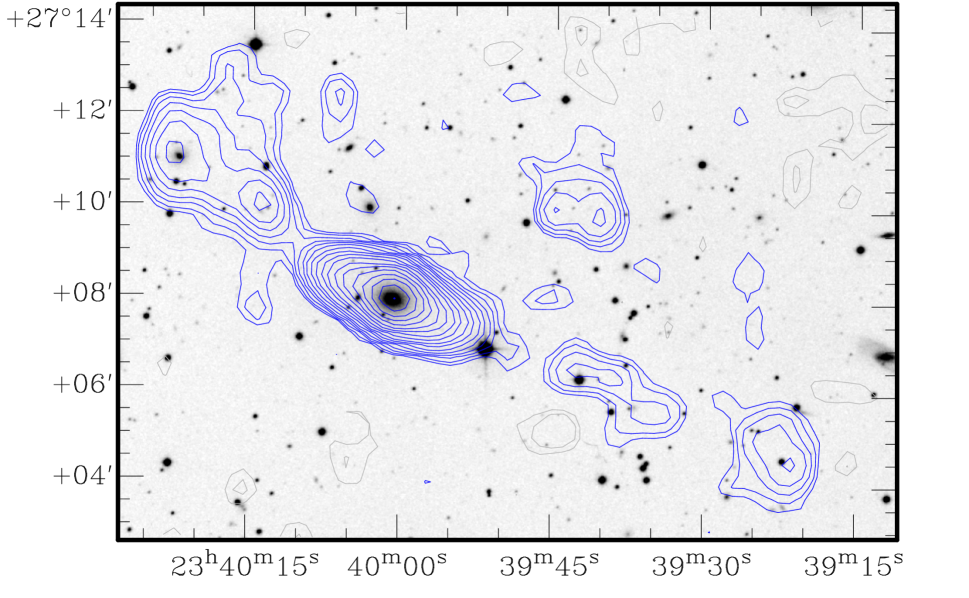
From the major radio surveys currently available (NVSS, SUMSS, FIRST, VLSS, WENSS and WISH), we extracted images of 15′ on a side around each BCM. For FIRST we used an image size of 3′, given its higher angular resolution and lower sensititivy for extended structure. Only four nearby sources turned out to be larger than 15′ and required larger images (see e.g. Fig. 1). By visual inspection of 3000 survey maps, with the BCM marked by a cross, we assessed the identification, extent and, where possible, the morphology of radio sources associated with these BCMs. Radio-optical overlays were prepared for 270 images in order to check whether neighboring radio components pertained to the BCM or were more likely associated with unrelated optical objects on the red 2nd-epoch Digitized Sky Survey (DSS2, archive.stsci.edu/dss). Upper limits to the flux density were assigned to undetected BCMs. For complex extended sources (150 cases), as well as detectable sources below the threshold of the corresponding radio source catalogs (115 cases), flux densities were integrated with the help of the AIPS package (www.aips.nrao.edu).
Using the two major catalog browsers (CATS at cats.sao.ru and VizieR at vizier.u-strasbg.fr), the following information was extracted for each BCM radio source (if detected): position, observing frequency and angular resolution, flux density and its error, deconvolved angular size, radio position angle (RPA), and reference. Additional flux densities were extracted from the catalog collection of the first author (see [4]).
For the sufficiently resolved sources we used the above survey images as well as published highresolution images to estimate the best available RPA and largest angular size (LAS) of each source. Occasionally, these highresolution images revealed that the apparent association with the BCM in the low-resolution radio surveys disappeared in favor of a fainter optical object (e.g. MRC 1103244 in A1165, MRC 0001233 in A2719, FIRST J115518.6+232422 in A1413).
3 Results
We compiled the radio data in a table with one record for each reference and observing frequency, often with several records for the same frequency. From 289 different references we collected a total of 5293 records of which 292 were discarded for various reasons (e.g. too large beam size, overresolution in VLBI observations, duplication of other original catalog fluxes, etc.). Of the remaining 5001 entries, 2627 are detections and 2374 upper limits. Of the 1423 BCMs, we found 578 (41 %) in 544 different Abell clusters with detected radio emission. However, 223 of these 578 are detected at only one frequency, mostly 1.4 GHz (NVSS or FIRST) or 843 MHz (SUMSS), and are thus usually faint and unresolved, not allowing one to estimate their RPA or radio morphology.
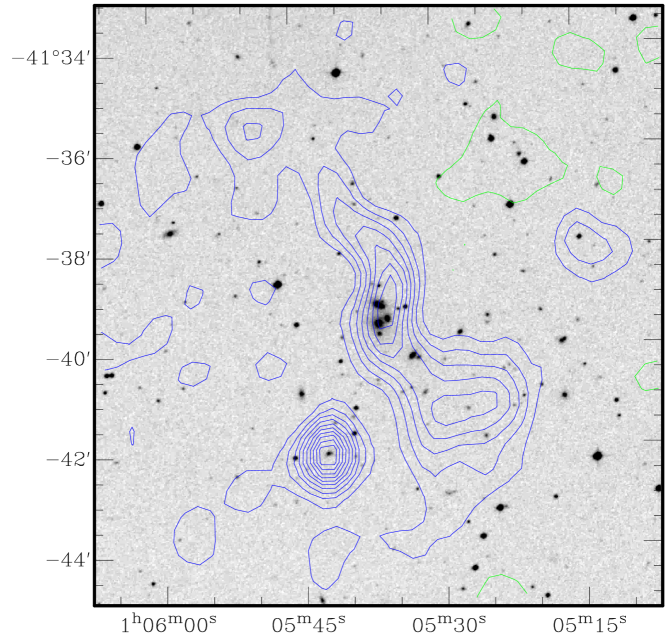
Using the BCM redshift (spectroscopic, or else photometric) from [7] we converted LAS to largest linear size (LLS). The median LLS of 209 BCMs with available LAS is 160 kpc ( = 75 km s-1 Mpc-1). We found 29 BCMs with LLS500 kpc, including several examples of very large sources (LLS700 kpc) in A 555, A2372, S 122 (cf. Fig. 2.), S 527, and S 239, some of them not previously reported. Several new candidate wide-angle tailed sources were found, e.g. in the BCMs of A 555, A 734, A 941, S 250, S 646, and S 793. Although we did not yet derive radio continuum spectra for all objects, we noted new examples of very steep-spectrum sources (1.4, ) in the BCMs of A 122, A 733, A1650, A2110, A2533, A2554, A3497, and S 651, as well as very flat-spectrum sources (0) in the BCMs of A1644, A2292, A2631, A2660, and A3407.
Looking for stringent upper limits to the 1.4-GHz flux in the nearest clusters, we found the most radioquiet sources in giant ellipticals (21) with a spectral radio power in A 779, S 836, and S 900. Cross-correlating our BCM sample with the compilation of [9], we found the BCMs in A3537, A3581, S 549, and S 780, to coincide with blazars.
We could measure the RPA for 183 BCMs, classified into three categories of reliability: good, medium and poor, corresponding to errors of (106), (41), and (37).
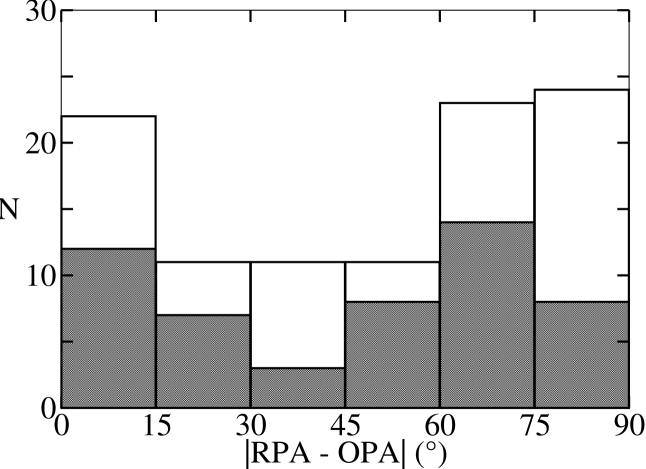
For the majority of BCMs with not too complex optical structure we obtained the ellipticity () and the major axis position angle (OPA) of the outermost envelope of the optical galaxy, using the task ellipse in the IRAF package (iraf.noao.edu) on red DSS2 images. These were mostly from [2], but for 181 BCMs (13%) these were determined in the present work. For 178 BCMs with both RPA and OPA we derived the acute difference angle, dPA, between RPA and OPA. Fig. 3 shows the distribution of dPA’s for 102 BCMs with errors of for both RPA and OPA, and for 50 of these for which the data were of even better quality. Fig. 3 shows marginal evidence for a bimodal distribution, with a majority of BCMs showing a perpendicular alignment (dPA) and a smaller fraction (20%) a parallel alignment (dPA). However, a KolmogorovSmirnov (KS) test does not reject the null hypotesis of a uniform distribution ( for the good data, and for all data). We also separated our sample by optical morphology of the BCMs (E- versus D/cD types, taken from [7]), by their optical ellipticity (), and the LLS of the radio sources (larger or smaller than 200 kpc, as suggested by [11]), and found that none of these parameters has any influence on the distribution of the radio-optical misalignment angle dPA.
4 Conclusions and Outlook
Despite the fact that the current study was based on the largest sample of BCMs in Abell clusters ever compiled [7], the number of 102 BCMs with available radio-optical misalignment angle obtained here, is lower than in the previous sample [3], which was derived by cross-identifying extended radio sources with brightest cluster galaxies in ANY type of Abell cluster, i.e. without the restrictions used by [7]. Given their large overlap, the shape of the distribution of radio-optical alignment angles in these two samples is very similar, and suggests a bimodality with a small fraction of aligned sources and a larger fraction of sources with radio axes roughly along their optical minor axis. However, KS tests show that the distributions of dPA in both the present sample and the larger one of [3] are indistinguishable from a uniform one.
Thus, at least based on the present study of radio-optical alignments of brightest cluster members in low-redshift clusters, there is little or no evidence for the anisotropic merger scenario proposed in [13]. Moreover, a selection of Abell clusters with dominant galaxies, based on Bautz-Morgan or Rood-Sastry type of the clusters alone, seems too restrictive. In fact, during the visual inspection of DSS images by [7] it became clear that not all clusters with “early” BM types (I and I-II) really have a dominant galaxy, while an inspection of DSS images of 869 Abell clusters of type BM II [12] revealed that two thirds of them still have a reasonably dominant galaxy.
We also note that the definition of the BM type is not entirely consistent in the literature. Even the original definition of the BM I type [5] varies from “Clusters containing a supergiant D galaxy” in their abstract, to clusters “containing a centrally located cD galaxy” in their Table 1a. In a sequel paper, Bautz [6] insisted that “For the cluster to be assigned as type I, the cD galaxy must stand out in optical appearance from the rest of the cluster to the degree shown by the brightest members of A2199, A2029, and A2670.” Abell et al. [1] who visually classified all clusters on the BM system, stated that “The BM system was used in its original form where the magnitude difference between the first and second brightest galaxies in the cluster is the major classification criterion.” It turns out that 80% of the present sample of 1169 clusters are in the south (), while only 59% are expected if BM types were independent of sky position, given that there are 2167 and 1909 A-clusters with and , plus 1174 S-clusters with . This, and the fact that the present cluster sample has 36% S-clusters compared to 22% in the entire Abell catalog, shows a significant bias towards earlier BM classes in the southern extension of the Abell catalog as compared to its earlier northern part.
Clearly, for a significant enlargement of the present sample, a much larger fraction of Abell clusters needs to be examined for dominant galaxies, preferably with additional use of photometric magnitudes of the BCM candidates to assess quantitatively their dominance in the cluster.
Nevertheless, the current compilation provides the basis for a number of future studies, like e.g. the determination of the radio spectral index and shape, and its relation with the density of the intracluster medium (from data on Xray emission), the determination of the spectral and total radio luminosity of BCMs, and a comparison with field elliptical galaxies. It will also be possible to study relations between optical ellipticity and radio power or luminosity, as well as between the peculiar velocity of the BCMs within their clusters (already derived by [7]) and the distortion of their radio morphology, using references from the present compilation.
Acknowledgments.
We benefitted from grant 50921-F of Mexican CONACyT, and from the hospitality at AIfA Bonn, Germany, where part of this research was done. HA is grateful for additional support from CONACyT grant 81356, as well as from German DFG through grants RE1462/2 and TRR33.References
- [1] Abell G. O., Corwin H. G., Olowin R. P., 1989, ApJS, 70, 1
- [2] Álamo-Martínez, K. A., 2007, BSc thesis, Univ. Guanajuato, Mexico
- [3] Andernach H., 1995, ASP Conf. Ser., 86, 69
- [4] Andernach H., 2009, Data Science Journal, 8, 41 (arXiv:0901.2805)
- [5] Bautz L. P. & Morgan W. W., 1970, ApJ, 162, 149
- [6] Bautz L. P., 1972, AJ, 77, 1
- [7] Coziol R., Andernach H., Caretta C. A., Álamo-Martínez K. A., Tago E., 2009, AJ, 137, 4795
- [8] Djorgovski S. G., 1987, in Nearly Normal Galaxies: From the Planck time to the present, ed. S. Faber, Springer, p. 227
- [9] Massaro E., Giommi P., Leto C., Marchegiani P., et al., 2009, A&A, 495, 691
- [10] Miley G., De Breuck C., 2008, A&ARv, 15, 67
- [11] Palimaka J. J., Bridle A. H., Fomalont E. B., Brandie G. W., 1979, ApJ, 231, L7
- [12] Ramos-Ceja M. E., Andernach H., 2006, Proc. XII Verano de Investigación, CDROM, Univ. Guanajuato, Mexico
- [13] West M. J., 1994, MNRAS, 268, 79
- [14] Wielebinski R., Haslam C. G. T., Baker J. R., Kronberg P. P., 2009, A&A, 67, 293