Rank discriminants for predicting phenotypes from RNA expression
Abstract
Statistical methods for analyzing large-scale biomolecular data are commonplace in computational biology. A notable example is phenotype prediction from gene expression data, for instance, detecting human cancers, differentiating subtypes and predicting clinical outcomes. Still, clinical applications remain scarce. One reason is that the complexity of the decision rules that emerge from standard statistical learning impedes biological understanding, in particular, any mechanistic interpretation. Here we explore decision rules for binary classification utilizing only the ordering of expression among several genes; the basic building blocks are then two-gene expression comparisons. The simplest example, just one comparison, is the TSP classifier, which has appeared in a variety of cancer-related discovery studies. Decision rules based on multiple comparisons can better accommodate class heterogeneity, and thereby increase accuracy, and might provide a link with biological mechanism. We consider a general framework (“rank-in-context”) for designing discriminant functions, including a data-driven selection of the number and identity of the genes in the support (“context”). We then specialize to two examples: voting among several pairs and comparing the median expression in two groups of genes. Comprehensive experiments assess accuracy relative to other, more complex, methods, and reinforce earlier observations that simple classifiers are competitive.
doi:
10.1214/14-AOAS738keywords:
, and T1Supported by NIH-NCRR Grant UL1 RR 025005. T2Supported by the National Science Foundation through award CCF-0845407.
1 Introduction
Statistical methods for analyzing high-dimensional biomolecular data generated with high-throughput technologies permeate the literature in computational biology. Such analyses have uncovered a great deal of information about biological processes, such as important mutations and lists of “marker genes” associated with common diseases [Jones et al. (2008), Thomas et al. (2007)] and key interactions in transcriptional regulation [Auffray (2007), Lee et al. (2008)]. Our interest here is learning classifiers that can distinguish between cellular phenotypes from mRNA transcript levels collected from cells in assayed tissue, with a primary focus on the structure of the prediction rules. Our work is motivated by applications to genetic diseases such as cancer, where malignant phenotypes arise from the net effect of interactions among multiple genes and other molecular agents within biological networks. Statistical methods can enhance our understanding by detecting the presence of disease (e.g., “tumor” vs “normal”), discriminating among cancer subtypes (e.g., “GIST” vs “LMS” or “BRCA1 mutation” vs “no BRCA1 mutation”) and predicting clinical outcomes (e.g., “poor prognosis” vs “good prognosis”).
Whereas the need for statistical methods in biomedicine continues to grow, the effects on clinical practice of existing classifiers based on gene expression are widely acknowledged to remain limited; see Altman et al. (2011), Marshall (2011), Evans et al. (2011) and the discussion in Winslow et al. (2012). One barrier is the study-to-study diversity in reported prediction accuracies and “signatures” (lists of discriminating genes). Some of this variation can be attributed to the overfitting that results from the unfavorable ratio of the sample size to the number of potential biomarkers, that is, the infamous “small , large ” dilemma. Typically, the number of samples (chips, profiles, patients) per class is 10–1000, whereas the number of features (exons, transcripts, genes) is usually 1000–50,000; Table 1 displays the sample sizes and the numbers of features for twenty-one publicly available data sets involving two phenotypes.
| Study | Class 0 (size) | Class 1 (size) | Probes | Reference | |
|---|---|---|---|---|---|
| D1 | Colon | Normal (22) | Tumor (40) | Alon et al. (1999) | |
| D2 | BRCA1 | Non-BRCA1 (93) | BRCA1 (25) | Lin et al. (2009) | |
| D3 | CNS | Classic (25) | Desmoplastic (9) | Pomeroy et al. (2002) | |
| D4 | DLBCL | DLBCL (58) | FL (19) | Shipp et al. (2002) | |
| D5 | Lung | Mesothelioma (150) | ADCS (31) | Gordon et al. (2002) | |
| D6 | Marfan | Normal (41) | Marfan (60) | Yao et al. (2007) | |
| D7 | Crohn’s | Normal (42) | Crohn’s (59) | Burczynski et al. (2006) | |
| D8 | Sarcoma | GIST (37) | LMS (31) | Price et al. (2007) | |
| D9 | Squamous | Normal (22) | Head–neck (22) | Kuriakose, Chen et al. (2004) | |
| D10 | GCM | Normal (90) | Tumor (190) | Ramaswamy et al. (2001) | |
| D11 | Leukemia 1 | ALL (25) | AML (47) | Golub et al. (1999) | |
| D12 | Leukemia 2 | AML1 (24) | AML2 (24) | Armstrong et al. (2002) | |
| D13 | Leukemia 3 | ALL(710) | AML (501) | Kohlmann et al. (2008) | |
| D14 | Leukemia 4 | Normal (138) | AML (403) | Mills et al. (2009) | |
| D15 | Prostate 1 | Normal (50) | Tumor (52) | Singh et al. (2002) | |
| D16 | Prostate 2 | Normal (38) | Tumor (50) | Stuart et al. (2004) | |
| D17 | Prostate 3 | Normal (9) | Tumor (24) | Welsh et al. (2001) | |
| D18 | Prostate 4 | Normal (25) | Primary (65) | Yao et al. (2004) | |
| D19 | Prostate 5 | Primary (25) | Metastatic (65) | Yao et al. (2004) | |
| D20 | Breast 1 | ER-positive (61) | ER-negative(36) | Enerly et al. (2011) | |
| D21 | Breast 2 | ER-positive (127) | ER-negative (80) | Buffa et al. (2011) |
Complex decision rules are obstacles to mature applications. The classification methods applied to biological data were usually designed for other purposes, such as improving statistical learning or applications to vision and speech, with little emphasis on transparency. Specifically, the rules generated by nearly all standard, off-the-shelf techniques applied to genomics data, such as neural networks [Bicciato et al. (2003), Bloom et al. (2004), Khan et al. (2001)], multiple decision trees [Boulesteix, Tutz and Strimmer (2003), Zhang, Yu and Singer (2003)], support vector machines [Peng et al. (2003), Yeang et al. (2001)], boosting [Qu et al. (2002), Dettling and Buhlmann (2003)] and linear discriminant analysis [Guo, Hastie and Tibshirani (2007), Tibshirani et al. (2002)], usually involve nonlinear functions of hundreds or thousands of genes, a great many parameters, and are therefore too complex to characterize mechanistically.
In contrast, follow-up studies, for instance, independent validation or therapeutic development, are usually based on a relatively small number of biomarkers and usually require an understanding of the role of the genes and gene products in the context of molecular pathways. Ideally, the decision rules could be interpreted mechanistically, for instance, in terms of transcriptional regulation, and be robust with respect to parameter settings. Consequently, what is notably missing from the large body of work applying classification methodology to computational genomics is a solid link with potential mechanisms, which seem to be a necessary condition for “translational medicine” [Winslow et al. (2012)], that is, drug development and clinical diagnosis.
These translational objectives, and small-sample issues, argue for limiting the number of parameters and introducing strong constraints. The two principal objectives for the family of classifiers described here are as follows:
-
•
Use elementary and parameter-free building blocks to assemble a classifier which is determined by its support.
-
•
Demonstrate that such classifiers can be as discriminating as those that emerge from the most powerful methods in statistical learning.
The building blocks we choose are two-gene comparisons, which we view as “biological switches” which can be directly related to regulatory “motifs” or other properties of transcriptional networks. The decision rules are then determined by expression orderings. However, explicitly connecting statistical classification and molecular mechanism for particular diseases is a major challenge and is well beyond the scope of this paper; by our construction we are anticipating our longer-term goal of incorporating mechanism by delineating candidate motifs using prior biological knowledge. Some comments on the relationship between comparisons and regulation appear in the concluding section.
To meet our second objective, we measure the performance of ourcomparison-based classifiers relative to two popular alternatives, namely, support vector machines and PAM [Tibshirani et al. (2002)], a variant of linear discriminant analysis. The “metric” chosen is the estimated error in multiple runs of tenfold cross-validation for each of the twenty-one real data sets in Table 1. (Computational cost is not considered; applying any of our comparison-based decision rules to a new sample is virtually instantaneous.) Whereas a comprehensive simulation study could be conducted, for example, along the lines of those in Guo, Hastie and Tibshirani (2005), Zhang et al. (2006) and Fan and Fan (2008) based on Gaussian models of microarray data, rather our intention is different: show that even when the number of parameters is small, in fact, the decision rule is determined by the support, the accuracy measured by cross-validation on real data is no worse than with currently available classifiers.
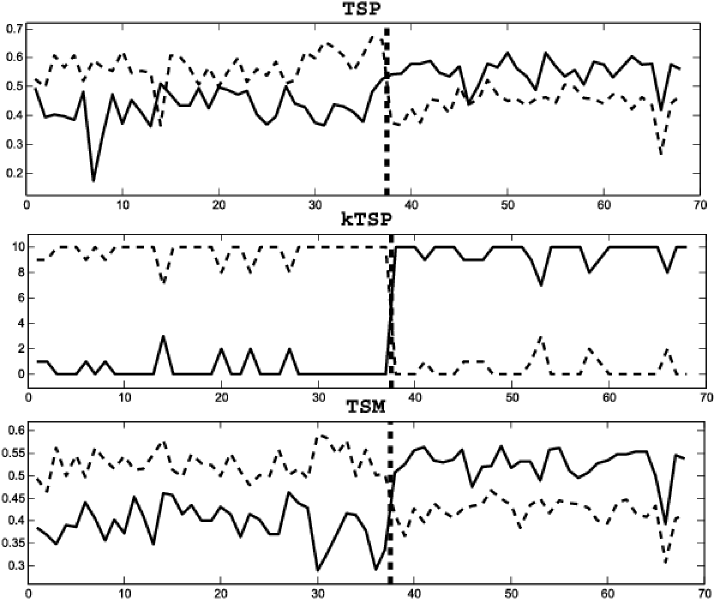
More precisely, all the classifiers studied in this paper are based on a general rank discriminant , a real-valued function on the ranks of over a (possibly ordered) subset of genes , called the context of the classifier. We are searching for characteristic perturbations in this ordering from one phenotype to another. The TSP classifier is the simplest example (see Section 2), and the decision rule is illustrated in Figure 1. This data set has expression profiles for two kinds of gastrointestinal cancer (gastrointestinal stromal-GIST, leiomyosarcoma-LMS) which are difficult to distinguish clinically but require very different treatments [Price et al. (2007)]. Each point on the -axis corresponds to a sample, and the vertical dashed line separates the two phenotypes. The -axis represents expression; as seen, the “reversal” of the ordering of the expressions of the two genes identifies the phenotype except in two samples.
Evidently, a great deal of information may be lost by converting to ranks, particularly if the expression values are high resolution. But there are technical advantages to basing prediction on ranks, including reducing study-to-study variations due to data normalization and preprocessing. Rank-based methods are evidently invariant to general monotone transformations of the original expression values, such as the widely-used quantile normalization [Bloated, Irizarry and Speed (2004)]. Thus, methods based on ranks can combine inter-study microarray data without the need to perform data normalization, thereby increasing sample size.
However, our principal motivation is complexity reduction: severely limiting the number of variables and parameters, and in fact introducing what we call rank-in-context (RIC) discriminants which depend on the training data only through the context. The classifier is then defined by thresholding . This implies that, given a context , the RIC classifier corresponds to a fixed decision boundary, in the sense that it does not depend on the training data. This sufficiency property helps to reduce variance by rendering the classifiers relatively insensitive to small disturbances to the ranks of the training data and is therefore especially suitable to small-sample settings. Naturally, the performance critically depends on the appropriate choice of . We propose a simple yet powerful procedure to select from the training data, partly inspired by the principle of analysis of variance and involving the sample means and sample variances of the empirical distribution of under the two classes. In particular, we do not base the choice directly on minimizing error.
We consider two examples of the general framework. The first is a new method for learning the context of KTSP, a previous extension of TSP to a variable number of pairs. The decision rule of the KTSP classifier is the majority vote among the top pairs of genes, illustrated in Figure 1 for for the same data set as above. In previous statistical and applied work [Tan et al. (2005)], the parameter (the number of comparisons) was determined by an inner loop of cross-validation, which is subject to overfitting with small samples. We also propose comparing the median of expression between two sets of genes; this Top-Scoring Median (TSM) rule is also illustrated in Figure 1. As can be seen, the difference of the medians generally has a larger “margin” than in the special case of singleton sets, that is, TSP. A summary of all the methods is given in Table 2.
==0pt Parameters Discriminant Parameter selection General Examples TSP KTSP TSM : rank of gene in
After reviewing related work in the following section, in Section 3 we present the classification scenario, propose our general statistical framework and focus on two examples: KTSP and TSM. The experimental results are in Section 4, where comparisons are drawn, and we conclude with some discussion about the underlying biology in Section 5.
2 Previous and related work
Our work builds on previous studies analyzing transcriptomic data solely based on the relative expression among a small number of transcripts. The simplest example, the Top-Scoring Pair (TSP) classifier, was introduced in Geman et al. (2004) and is based on two genes. Various extensions and illustrations appeared in Xu et al. (2005), Lin et al. (2009) and Tan et al. (2005). Applications to phenotype classification include differentiating between stomach cancers [Price et al. (2007)], predicting treatment response in breast cancer [Weichselbaum et al. (2008)] and acute myeloid leukemia [Raponi et al. (2008)], detecting BRCA1 mutations [Lin et al. (2009)], grading prostate cancers [Zhao, Logothetis and Gorlov (2010)] and separating diverse human pathologies assayed through blood-borne leukocytes [Edelman et al. (2009)].
In Geman et al. (2004) and subsequent papers about TSP, the discriminating power of each pair of genes was measured by the absolute difference between the probabilities of the event that gene is expressed more than gene in the two classes. These probabilities were estimated from training data and (binary) classification resulted from voting among all top-scoring pairs. In Xu et al. (2005) a secondary score was introduced which provides a unique top-scoring pair. In addition, voting was extended to the highest-scoring pairs of genes. The motivation for this KTSP classifier and other extensions [Tan et al. (2005), Anderson et al. (2007), Xu, Geman and Winslow (2007)] is that more genes may be needed to detect cancer pathogenesis, especially if the principle objective is to characterize as well as recognize the process. Finally, in a precursor to the work here [Xu, Geman and Winslow (2007)], the two genes in TSP were replaced by two equally-sized sets of genes and the average ranks were compared. Since the direct extension of TSP score maximization was computationally impossible, and likely to badly overfit the data, the sets were selected by splitting top-scoring pairs and repeated random sampling. Although ad hoc, this process further demonstrated the discriminating power of rank statistics for microarray data.
Finally, there is some related work about ratios of concentrations (which are natural in chemical terms) for diagnosis and prognosis. That work is not rank-based but retains invariance to scaling. Golub et al. (1999) distinguished between malignant pleural mesothelioma (MPM) and adenocarcinoma (ADCA) of the lung by combining multiple ratios into a single diagnostic tool, and Ma et al. (2004) found that a two-gene expression ratio derived from a genome-wide, oligonucleotide microarray analysis of estrogen receptor (ER)-positive, invasive breast cancers predicts tumor relapse and survival in patients treated with tamoxifen, which is crucial for early-stage breast cancer management.
3 Rank-in-context classification
In this section we introduce a general framework for rank-based classifiers using comparisons among a limited number of gene expressions, called the context. In addition, we describe a general method to select the context, which is inspired by the analysis of variance paradigm of classical statistics. These classifiers have the RIC property that they depend on the sample training data solely through the context selection; in other words, given the context, the classifiers have a fixed decision boundary and do not depend on any further learning from the training data. For example, as will be seen in later sections, the Top-Scoring Pair (TSP) classifier is RIC. Once a pair of genes (i.e., the context) is specified, the TSP decision boundary is fixed and corresponds to a 45-degree line going through the origin in the feature space defined by the two genes. This property confers to RIC classifiers a minimal-training property, which makes them insensitive to small disturbances to the ranks of the training data, reducing variance and overfitting, and rendering them especially suitable to the settings illustrated in Table 1. We will demonstrate the general RIC framework with two specific examples, namely, the previously introduced KTSP classifier based on majority voting among comparisons [Tan et al. (2005)], as well as a new classifier based on the comparison of the medians, the Top-Scoring Medians (TSM) classifier.
3.1 RIC discriminant
Let denote the expression values of genes on an expression microarray. Our objective is to use to distinguish between two conditions or phenotypes for the cells in the assayed tissue, denoted and . A classifier associates a label with a given expression vector . Practical classifiers are inferred from training data, consisting of i.i.d. pairs .
The classifiers we consider in this paper are all defined in terms of a general rank-in-context discriminant , which is defined as a real-valued function on the ranks of over a subset of genes , which is determined by the training data and is called the context of the classifier (the order of indices in the context may matter). The corresponding RIC classifier is defined by
| (1) |
where denotes the indicator variable of event . The threshold parameter can be adjusted to achieve a desired specificity and sensitivity (see Section 3.4 below); otherwise, one usually sets . For simplicity we will write instead of , with the implicit understanding that in RIC classification is selected from the training data .
We will consider two families of RIC classifiers. The first example is the -Top Scoring Pairs (KTSP) classifier, which is a majority-voting rule among pairs of genes [Tan et al. (2005)]; KTSP was the winning entry of the International Conference in Machine Learning and Applications (ICMLA) 2008 challenge for micro-array classification [Geman et al. (2008)]. Here, the context is partitioned into a set of gene pairs , where is a positive odd integer, in such a way that all pairs are disjoint, that is, all genes are distinct. The RIC discriminant is given by
| (2) |
This KTSP RIC discriminant simply counts positive and negative “votes” in favor of ascending or descending ranks, respectively. The KTSP classifier is given by (1), with , which yields
| (3) |
The KTSP classifier is thus a majority-voting rule: it assigns label 1 to the expression profile if the number of ascending ranks exceeds the number of descending ranks in the context. The choice of odd avoids the possibility of a tie in the vote. If , then the KTSP classifier reduces to , the Top-Scoring Pair (TSP) classifier [Geman et al. (2004)].
The second example of an RIC classifier we propose is the Top Scoring Median (TSM) classifier, which compares the median rank of two sets of genes. The median rank has the advantage that for any individual sample the median is the value of one of the genes. Hence, in this sense, a comparison of medians for a given sample is equivalent to the comparison of two-gene expressions, as in the TSP decision rule. Here, the context is partitioned into two sets of genes, , such that , where is again a positive odd integer, and and are disjoint, that is, all genes are distinct. Let be the rank of in the context , such that if is the th smallest value among the gene expression values indexed by . The RIC discriminant is given by
| (4) |
where “” denotes the median operator. The TSM classifier is then given by (1), with , which yields
| (5) |
Therefore, the TSM classifier outputs 1 if the median of ranks in exceeds the median of ranks in , and 0 otherwise. Notice that this is equivalent to comparing the medians of the raw expression values directly. We remark that an obvious variation would be to compare the average rank rather than the median rank, which corresponds to the “TSPG” approach defined in Xu, Geman and Winslow (2007), except that in that study, the context for TSPG was selected by splitting a fixed number of TSPs. We observed that the performances of the mean-rank and median-rank classifiers are similar, with a slight superiority of the median-rank (data not shown).
3.2 Criterion for context selection
The performance of RIC classifiers critically depends on the appropriate choice of the context . We propose a simple yet powerful procedure to select from the training data . To motivate the proposed criterion, first note that a necessary condition for the context to yield a good classifier is that the discriminant has sufficiently distinct distributions under and . This can be expressed by requiring that the difference between the expected values of between the populations, namely,
| (6) |
be maximized. Notice that this maximization is with respect to alone; is fixed and chosen a priori. In practice, one employs the maximum-likelihood empirical criterion
| (7) |
where
| (8) |
for .
In the case of KTSP, the criterion in (6) becomes
| (9) |
where the pairwise score for the pair of genes is defined as
| (10) |
Notice that if the pair of random variables has a continuous distribution, so that , then . In this case can be replaced by in in (10).
The empirical criterion [cf. equation (7)] is obtained by substituting in (9) the empirical pairwise scores
| (11) |
Here the empirical probabilities are defined by , for , where the operator is defined in (8).
For TSM, the criterion in (6) is given by
| (12) | |||
Proposition S1 in Supplement A [Afsari, Braga-Neto and Geman (2014a)] shows that, under some assumptions,
| (13) |
where is defined in (10).
The difference between the two criteria (9) for KTSP and (13) for TSM for selecting the context is that the former involves scores for expression comparisons and the latter involves comparisons since each gene is paired with each gene . Moreover, using the estimated solution to maximizing (9) (see below) to construct and by putting the first gene from each pair into one and the second gene from each pair into the other does not work as well in maximizing (13) as the algorithms described below.
3.3 Maximization of the criterion
Maximization of (6) or (7) works well as long as the size of the context , that is, the number of context genes, is kept fixed, because the criterion tends to be monotonically increasing with , which complicates selection. We address this problem by proposing a modified criterion, which is partly inspired by the principle of analysis of variance in classical statistics. This modified criterion penalizes the addition of more genes to the context by requiring that the variance of within the populations be minimized. The latter is given by
| (14) |
where is the maximum-likelihood estimator of the variance,
for . The modified criterion to be maximized is
| (15) |
The statistic resembles the Welch two-sample -test statistic of classical hypothesis testing [Casella and Berger (2002)].
Direct maximization of (7) or (15) is in general a hard computational problem for the numbers of genes typically encountered in expression data. We propose instead a greedy procedure. Assuming that a predefined range of values for the context size is given, the procedure is as follows: {longlist}[(2)]
For each value of , an optimal context is chosen that maximizes (7) among all contexts containing genes:
An optimal value is chosen that maximizes (15) among all contexts obtained in the previous step:
For KTSP, the maximization in step (1) of the previous context selection procedure becomes
We propose a greedy approach to this maximization problem: initialize the list with the top-scoring pair of genes, then keep adding pairs to the list whose genes have not appeared so far [ties are broken by the secondary score proposed in Xu et al. (2005)]. This process is repeated until pairs are chosen and corresponds essentially to the same method that was proposed, for fixed , in the original paper on KTSP [Tan et al. (2005)]. Thus, the previously proposed heuristic has a justification in terms of maximizing the separation between the rank discriminant (2) across the classes.
To obtain the optimal value , one applies step (2) of the context selection procedure, with a range of values , for odd ( can be added if 1-TSP is considered). Note that here
| (17) | |||
Therefore, the optimal value of is selected by
| (18) |
where
| (19) | |||
Finally, the optimal context is then given by .
For TSM, the maximization in step (1) of the context selection procedure can be written as
| (20) |
Finding the global maximum in (20) is not feasible in general. We consider a suboptimal strategy for accomplishing this task: sequentially construct the context by adding two genes at a time. Start by selecting the TSP pair and setting and . Then select the pair of genes distinct from such that the sum of scores is maximized by and , that is, is maximized over all sets of size two, assuming and . This involves computing three new scores. Proceed in this way until pairs have been selected.
To obtain the optimal value , one applies step (2) of the context selection procedure, with a range of values , for odd (the choice of is dictated by the facts that reduces to 1-TSP, whereas Proposition S1 does not hold for even ):
where
| (21) | |||
Notice that is defined directly by replacing (4) into (7) and (14), and then using (15). In particular, it does not use the approximation in (13). Finally, the optimal context is given by .
For both KTSP and TSM classifiers, the step-wise process to perform the maximization of the criterion [cf. equations (3.3) and (20)] does not need to be restarted as increases, since the suboptimal contexts are nested [by contrast, the method in Tan et al. (2005) employed cross-validation to choose ]. The detailed context selection procedure for KTSP and TSM classifiers is given in Algorithms S1 and S2 in Supplement C [Afsari, Braga-Neto and Geman (2014c)].
3.4 Error rates
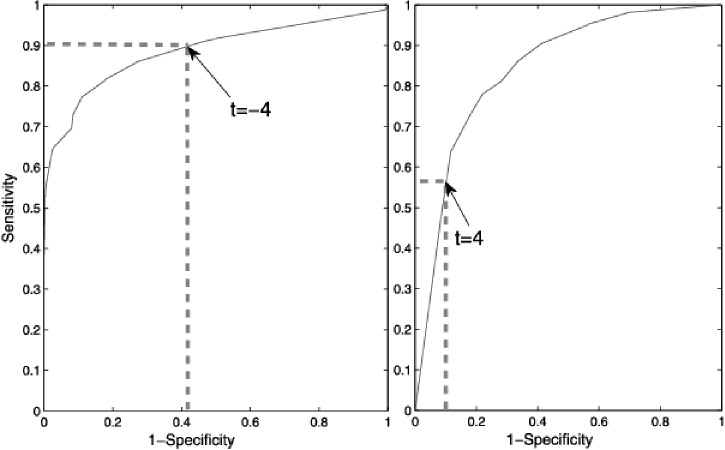
In this section we discuss the choice of the threshold used in (1). The sensitivity is defined as and the specificity is defined as . We are interested in controlling both, but trade-offs are inevitable. The choice of which phenotype to designate as is application-dependent; often sensitivity is relative to the more malignant one and this is the way we have assigned labels to the phenotypes. A given application may call for emphasizing sensitivity at the expense of specificity or vice versa. For example, in detecting BRCA1 mutations or with aggressive diseases such as pancreatic cancer, high sensitivity is important, whereas for more common and less aggressive cancers, such as prostate, it may be preferable to limit the number of false alarms and achieve high specificity. In principle, selecting the appropriate threshold in (1) allows one to achieve a desired trade-off. (A disadvantage of TSP is the lack of a discriminant, and thus a procedure to adjust sensitivity and specificity.) It should be noted, however, that in practice estimating the threshold on the training data can be difficult; moreover, introducing a nonzero threshold makes the decision rule somewhat more difficult to interpret. As an example, Figure 2 displays the ROC curve of the TSM classifier for the BRCA1 and Prostate 4 studies, together with thresholds achieving hypothetically desired scenarios.
4 Experimental results
A summary of the rank-based discriminants developed in the preceding sections is given in Table 2. We learned each discriminant for each of the data sets listed in Table 1. Among an abundance of proposed methods for high-dimensional data classification [e.g., Bradley and Mangasarian (1998), Zhang et al. (2006), Marron, Todd and Ahn (2007)], we chose two of the most effective and popular choices for predicting phenotypes from expression data: PAM [Tibshirani et al. (2002)], which is a form of LDA, and SVM-RFE [Guyon et al. (2002)], which is a form of linear SVM.
Generalization errors are estimated with cross-validation, specifically averaging the results of ten repetitions of 10-fold CV, as recommended in Braga-Neto and Dougherty (2004) and Hastie, Tibshirani and Friedman (2001). Despite the inaccuracy of small-sample cross-validation estimates [Braga-Neto and Dougherty (2004)], 10-fold CV suffices to obtain the broad perspective on relative performance across many different data sets.
The protocols for training (including parameter selection) are given below. To reduce computation, we filter the whole gene pool without using the class labels before selecting the context for rank discriminants (TSP, KTSP and TSM). Although a variety of filtering methods exist in the literature, such as PAM [Tibshirani et al. (2002)], SIS [Fan and Lv (2008)], Dantzig selector [Candes and Tao (2007)] and the Wilcoxon-rank test [Wilcoxon (1945)], we simply use an average signal filter: select the 4000 genes with highest mean rank (across both classes). In particular, there is no effort to detect “differentially expressed” genes. In this way we minimize the influence of the filtering method in assessing the performance of rank discriminants:
-
•
TSP: The single pair maximizing over all pairs in the filtered genes, breaking scoring ties if necessary with the secondary score proposed in Xu et al. (2005).
-
•
KTSP: The disjoint pairs maximizing over all pairs in the filtered genes with the same tie-breaking method. The number of pairs is determined via Algorithm S1, within the range , avoiding ties in voting. Notice that is excluded so that KTSP cannot reduce to TSP. We tried also and the cross-validated accuracies changed insignificantly.
-
•
TSM: The context is chosen from the top genes by the greedy selection procedure described in Algorithm S2. The size of the two sets for computing the median rank is selected in the range (providing a unique median and thereby rendering Proposition S1 applicable). We also tried and again the changes in the cross-validated accuracies were insignificant.
-
•
SVM-RFE: We learned two linear SVMs using SVM-RFE: one with ten genes and one with a hundred genes. No filtering was applied, since SVM-RFE itself does that. Since we found that the choice of the slack variable barely changes the results, we fix . (In fact, the data are linearly separable in nearly all loops.) Only the results for SVM-RFE with a hundred genes are shown since it was almost 3% better than with ten genes.
-
•
PAM: We use the automatic filtering mechanism provided by Tibshirani (2011). The prior class likelihoods were set to 0.5 and all other parameters were set to default values. The most important parameter is the threshold; the automatic one chosen by the program results in relatively lower accuracy than the other methods (84.00%) on average. Fixing the threshold and choosing the best one over all data sets only increases the accuracy by one percent. Instead, for each data set and each threshold, we estimated the cross-validated accuracy for PAM and report the accuracy of the best threshold for that data set.
| Data set | TSP | TSM | KTSP | SVM | PAM |
|---|---|---|---|---|---|
| Colon | 8888 | 8688 | 8786 | 8773 | 8381 |
| BRCA 1 | 7175 | 9075 | 8877 | 6888 | 3982 |
| CNS | 4179 | 8188 | 6793 | 5286 | 7779 |
| DLBCL | 9897 | 9695 | 9688 | 9791 | 72100 |
| Lung | 9297 | 9799 | 94100 | 95100 | 97100 |
| Marfan | 8293 | 8990 | 8896 | 9993 | 8887 |
| Crohn’s | 8990 | 9291 | 9296 | 100100 | 9398 |
| Sarcoma | 8378 | 8889 | 9391 | 9794 | 93100 |
| Squamous | 8988 | 8885 | 9992 | 9495 | 9495 |
| GCM | 8173 | 8877 | 9075 | 9480 | 9594 |
| Leukemia 1 | 9085 | 9794 | 9793 | 9897 | 9589 |
| Leukemia 2 | 9696 | 10093 | 10096 | 10096 | 7388 |
| Leukemia 3 | 9898 | 9799 | 9798 | 100100 | 9699 |
| Leukemia 4 | 9294 | 9598 | 9697 | 9997 | 7792 |
| Prostate 1 | 9593 | 8996 | 9095 | 9195 | 8991 |
| Prostate 2 | 6868 | 7679 | 7683 | 6879 | 7774 |
| Prostate 3 | 9779 | 9990 | 9983 | 99100 | 98100 |
| Prostate 4 | 7761 | 8770 | 8679 | 9262 | 6685 |
| Prostate 5 | 9799 | 9798 | 9599 | 10099 | 99100 |
| Breast 1 | 8290 | 8291 | 8591 | 7788 | 9598 |
| Breast 2 | 8382 | 7389 | 7587 | 7186 | 8688 |
Table 3 shows the performance estimates of the classifiers across 21 data sets. In addition, Figures S1 and S2 in Supplement B [Afsari, Braga-Neto and Geman (2014b)] display the results in box plot format. The averages are as follows: TSP (85.59%), KTSP (90.07%), TSM (88.97%), SVM-RFE (89.92%) and PAM (88.19%). The differences in the averages among methods do not appear substantial, with the possible exception of TSP, which lags behind the others.
There are, however, clearly significant variations in performance within individual data sets. In order to examine these variations at a finer scale, possibly revealing trends to support practical recommendations, recall that for each data set and each method, we did ten repetitions of tenfold cross-validation, resulting in one hundred trained classifiers and estimated rates (on the left-out subsets), which were averaged to provide a single cross-validated classification rate. The notch-boxes for each data set and method are plotted in Figures S1 and S2 (Supplement B [Afsari, Braga-Neto and Geman (2014b)]). As is commonly done, any two methods will be declared to be “tied” on a given data set if the notches overlap; otherwise, that is, if the notches are disjoint, the “winner” is taken to be the one with the larger median.
First, using the “notch test” to compare the three RIC classifiers, KTSP slightly outperforms TSM, which in turn outperforms TSP. More specifically, KTSP has accuracy superior to both others on ten data sets. In terms of KTSP vs TSM, KTSP outperforms on three data sets, vice versa on one data set and they tie on all others. Moreover, TSM outperforms TSP on nine data sets and vice versa on two data sets. As a result, if accuracy is the dominant concern, we recommend KTSP among the RIC classifiers, whereas if simplicity, transparency and links to biological mechanisms are important, one might prefer TSP. Comparisons with non-RIC methods (see below) are based on KTSP, although substituting TSM does not lead to appreciably different conclusions.
Second, SVM performs better than PAM on six data sets and PAM on three data sets. Hence, in the remainder of this section we will compare KTSP with SVM. We emphasize that the comparison between PAM and SVM is on our particular data sets, using our particular measures of performance, namely, cross-validation to estimate accuracy and the notch test for pairwise comparisons. Results on other data sets or in other conditions may differ.
Third, whereas the overall performance statistics for KTSP and SVM are almost identical, trends do emerge based on sample size, which is obviously an important parameter and especially useful here because it varies considerably among our data sets (Table 1). To avoid fine-tuning, we only consider a coarse and somewhat arbitrary quantization into three categories: “small,” “medium” and “large” data sets, defined, respectively, by fewer than 100 (total) samples (twelve data sets), 100–200 samples (five data sets) and more than 200 samples (four data sets). On small data sets, KTSP outperforms SVM on four data sets and never vice versa; for medium data sets, each outperforms the other on one of the five data sets; and SVM outperforms KTSP on three out of four large data sets and never vice versa.
Another criterion is sparsity: the number of genes used by TSP is always two and by SVM-RFE is always one hundred. Averaged across all data sets and loops of cross-validation, KTSP uses 12.5 genes, TSM uses 10.16 genes, and PAM uses 5771 genes.
Finally, we performed an experiment to roughly gauge the variability in selecting the genes in the support of the various classifiers. Taking advantage of the fact that we train 100 different classifiers for each method and data set, each time with approximately the same number of examples, we define a “consistency” measure for a pair of classifiers as the average support overlap over all distinct pairs of runs. That is, for any given data set and method, and any two loops of cross-validation, let and be the supports (set of selected genes) and define the overlap as . This fraction is then averaged over all pairs of loops, and obviously ranges from zero (no consistency) to one (consistency in all loops). Whereas in 16 of the 21 data sets KTSP had a higher consistency score than SVM, the more important point is that in both cases the scores are low in absolute terms, which coheres with other observations about the enormous variations in learned genes signatures.
5 Discussion and conclusions
What might be a “mechanistic interpretation” of the TSP classifier, where the context consists of only two genes? In Price et al. (2007), a reversal between the two genes Prune2 and Obscurin is shown to be an accurate test for separating GIST and LMS. Providing an explanation, a hypothesized mechanism, is not straightforward, although it has been recently shown that both modulate RhoA activity (which controls many signaling events): a splice variant of Prune2 is reported to decrease RhoA activity when over-expressed and Obscurin contains a Rho-GEF binding domain which helps to activate RhoA [Funk (2012)].
Generically, one of the most elementary regulatory motifs is simply inhibits (denoted ). For example, may be constitutively “on” and constitutively “off” after development. Perhaps is a transcription factor or involved in methylation of . In the normal phenotype we see expressed, but perhaps becomes inactivated in the cancer phenotype, resulting in the expression of , and hence an expression reversal from normal to cancer. Still more generally, a variety of regulatory feedback loops have been identified in mammals. For instance, an example of a bi-stable loop is shown below.
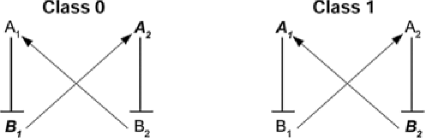
Due to the activation and suppression patterns depicted in Figure 3, we might expect and . Thus, there are two expression reversals, one between the two miRNAs and one, in the opposite direction, between the two mRNAs. Given both miRNA and mRNA data, we might then build a classifier based on these two switches. For example, the rank discriminant might simply be 2-TSP, the number of reversals observed. Accordingly, we have argued that expression comparisons may provide an elementary building block for a connection between rank-based decision rules and potential mechanisms.
We have reported extensive experiments with classifiers based on expression comparisons with different diseases and microarray platforms and compared the results with other methods which usually use significantly more genes. No one classifier, whether within the rank-based collection or between them and other methods such as SVM and PAM, uniformly dominates. The most appropriate one to use is likely to be problem-dependent. Moreover, until much larger data sets become available, it will be difficult to obtain highly accurate estimates of generalization errors. What does seem apparent is that our results support the conclusions reached in earlier studies [Dudoit, Fridlyand and Speed (2002), Braga-Neto (2007), Wang (2012), Simon et al. (2003)] that simple classifiers are usually competitive with more complex ones with microarray data and limited samples. This has important consequences for future developments in functional genomics since one key thrust of “personalized medicine” is an attempt to learn appropriate treatments for disease subtypes, which means sample sizes will not necessarily get larger and might even get smaller. Moreover, as attention turns increasingly toward treatment, potentially mechanistic characterizations of statistical decisions will become of paramount importance for translational medicine.
Proposition S1 \slink[doi]10.1214/14-AOAS738SUPPA \sdatatype.pdf \sfilenameAOAS738_suppA.pdf \sdescriptionWe provide the statement and proof of Proposition S1 as well as statistical tests for the assumptions made in Proposition S1.
Notch-plots for classification accuracies \slink[doi]10.1214/14-AOAS738SUPPB \sdatatype.pdf \sfilenameAOAS738_suppB.pdf \sdescriptionWe provide notch-plots of the estimates of classification accuracy for every method and every data set based on ten runs of tenfold cross-validation.
Algorithms for KTSP and TSM \slink[doi]10.1214/14-AOAS738SUPPC \sdatatype.pdf \sfilenameAOAS738_suppC.pdf \sdescriptionWe provide a summary of the algorithms for learning the KTSP and TSM classifiers.
References
- Afsari, Braga-Neto and Geman (2014a) {bmisc}[author] \bauthor\bsnmAfsari, \bfnmBahman\binitsB., \bauthor\bsnmBraga-Neto, \bfnmUlisses M.\binitsU. M. and \bauthor\bsnmGeman, \bfnmDonald\binitsD. (\byear2014a). \bhowpublishedSupplement to “Rank discriminants for predicting phenotypes from RNA expression.” DOI:\doiurl10.1214/14-AOAS738SUPPA. \bptokimsref\endbibitem
- Afsari, Braga-Neto and Geman (2014b) {bmisc}[author] \bauthor\bsnmAfsari, \bfnmBahman\binitsB., \bauthor\bsnmBraga-Neto, \bfnmUlisses M.\binitsU. M. and \bauthor\bsnmGeman, \bfnmDonald\binitsD. (\byear2014b). \bhowpublishedSupplement to “Rank discriminants for predicting phenotypes from RNA expression.” DOI:\doiurl10.1214/14-AOAS738SUPPB. \bptokimsref\endbibitem
- Afsari, Braga-Neto and Geman (2014c) {bmisc}[author] \bauthor\bsnmAfsari, \bfnmBahman\binitsB., \bauthor\bsnmBraga-Neto, \bfnmUlisses M.\binitsU. M. and \bauthor\bsnmGeman, \bfnmDonald\binitsD. (\byear2014c). \bhowpublishedSupplement to “Rank discriminants for predicting phenotypes from RNA expression.” DOI:\doiurl10.1214/14-AOAS738SUPPC. \bptokimsref\endbibitem
- Alon et al. (1999) {barticle}[author] \bauthor\bsnmAlon, \bfnmUa\binitsU., \bauthor\bsnmBarkai, \bfnmNaomi\binitsN., \bauthor\bsnmNotterman, \bfnmDavid\binitsD. \betalet al. (\byear1999). \btitleBroad patterns of gene expression revealed by clustering analysis of tumor and normal colon tissues probed by oligonucleotide arrays. \bjournalProc. Natl. Acad. Sci. USA \bvolume96 \bpages6745–6750. \bptokimsref\endbibitem
- Altman et al. (2011) {barticle}[author] \bauthor\bsnmAltman, \bfnmRo B.\binitsR. B., \bauthor\bsnmKroemer, \bfnmHo K.\binitsH. K., \bauthor\bsnmMcCarty, \bfnmCo A. \binitsC. A. (\byear2011). \btitlePharmacogenomics: Will the promise be fulfilled. \bjournalNat. Rev. \bvolume12 \bpages69–73. \bptokimsref\endbibitem
- Anderson et al. (2007) {barticle}[author] \bauthor\bsnmAnderson, \bfnmTroy\binitsT., \bauthor\bsnmTchernyshyov, \bfnmIrina\binitsI., \bauthor\bsnmDiez, \bfnmRoberto\binitsR. \betalet al. (\byear2007). \btitleDiscovering robust protein biomarkers for disease from relative expression reversals in 2-D DIGE data. \bjournalProteomics \bvolume7 \bpages1197–1208. \bptokimsref\endbibitem
- Armstrong et al. (2002) {barticle}[author] \bauthor\bsnmArmstrong, \bfnmS. A.\binitsS. A., \bauthor\bsnmStaunton, \bfnmJ. E.\binitsJ. E., \bauthor\bsnmSilverman, \bfnmL. B.\binitsL. B. \betalet al. (\byear2002). \btitleMLL translocations specify a distinct gene expression profile that distinguishes a unique leukemia. \bjournalNat. Genet. \bvolume30 \bpages41–47. \bptokimsref\endbibitem
- Auffray (2007) {barticle}[author] \bauthor\bsnmAuffray, \bfnmCa\binitsC. (\byear2007). \btitleProtein subnetwork markers improve prediction of cancer outcome. \bjournalMol. Syst. Biol. \bvolume3 \bpages1–2. \bptokimsref\endbibitem
- Bicciato et al. (2003) {barticle}[author] \bauthor\bsnmBicciato, \bfnmSam\binitsS., \bauthor\bsnmPandin, \bfnmMichael\binitsM., \bauthor\bsnmDidonè, \bfnmGiovanni\binitsG. and \bauthor\bsnmBello, \bfnmCaro Di\binitsC. D. (\byear2003). \btitlePattern identification and classification in gene expression data using an autoassociative neural network model. \bjournalBiotechnol. Bioeng. \bvolume81 \bpages594–606. \bptokimsref\endbibitem
- Bloated, Irizarry and Speed (2004) {barticle}[author] \bauthor\bsnmBloated, \bfnmB.\binitsB., \bauthor\bsnmIrizarry, \bfnmR.\binitsR. and \bauthor\bsnmSpeed, \bfnmT.\binitsT. (\byear2004). \btitleA comparison of normalization methods for high density oligonucleotide array data based on variance and bias. \bjournalBioinformatics \bvolume19 \bpages185–193. \bptokimsref\endbibitem
- Bloom et al. (2004) {barticle}[author] \bauthor\bsnmBloom, \bfnmGeorge\binitsG., \bauthor\bsnmYang, \bfnmIan\binitsI., \bauthor\bsnmBoulware, \bfnmDavid\binitsD. \betalet al. (\byear2004). \btitleMulti-platform, multisite, microarray-based human tumor classification. \bjournalAm. J. Pathol. \bvolume164 \bpages9–16. \bptokimsref\endbibitem
- Boulesteix, Tutz and Strimmer (2003) {barticle}[author] \bauthor\bsnmBoulesteix, \bfnmAbraham L.\binitsA. L., \bauthor\bsnmTutz, \bfnmGeorge.\binitsGeorge. and \bauthor\bsnmStrimmer, \bfnmKate\binitsK. (\byear2003). \btitleA CART-based approach to discover emerging patterns in microarray data. \bjournalBioinformatics \bvolume19 \bpages2465–2472. \bptokimsref\endbibitem
- Bradley and Mangasarian (1998) {binproceedings}[author] \bauthor\bsnmBradley, \bfnmPaul S.\binitsP. S. and \bauthor\bsnmMangasarian, \bfnmOlvi L.\binitsO. L. (\byear1998). \btitleFeature selection via voncave minimization and support vector machines. In \bbooktitleICML \bpages82–90. \bpublisherMorgan Kaufmann, \blocationMadison, WI. \bptokimsref\endbibitem
- Braga-Neto (2007) {barticle}[author] \bauthor\bsnmBraga-Neto, \bfnmUlisses M.\binitsU. M. (\byear2007). \btitleFads and fallacies in the name of small-sample microarray classification—a highlight of misunderstanding and erroneous usage in the applications of genomic signal processing. \bjournalIEEE Signal Process. Mag. \bvolume24 \bpages91–99. \bptokimsref\endbibitem
- Braga-Neto and Dougherty (2004) {barticle}[pbm] \bauthor\bsnmBraga-Neto, \bfnmUlisses M.\binitsU. M. and \bauthor\bsnmDougherty, \bfnmEdward R.\binitsE. R. (\byear2004). \btitleIs cross-validation valid for small-sample microarray classification? \bjournalBioinformatics \bvolume20 \bpages374–380. \biddoi=10.1093/bioinformatics/btg419, issn=1367-4803, pii=20/3/374, pmid=14960464 \bptokimsref\endbibitem
- Buffa et al. (2011) {barticle}[author] \bauthor\bsnmBuffa, \bfnmFrancesca\binitsF., \bauthor\bsnmCamps, \bfnmCarme\binitsC., \bauthor\bsnmWinchester, \bfnmLaura\binitsL., \bauthor\bsnmSnell, \bfnmCameron\binitsC., \bauthor\bsnmGee, \bfnmHarriet\binitsH., \bauthor\bsnmSheldon, \bfnmHelen\binitsH., \bauthor\bsnmTaylor, \bfnmMarian\binitsM., \bauthor\bsnmHarris, \bfnmAdrian\binitsA. and \bauthor\bsnmRagoussis, \bfnmJiannis\binitsJ. (\byear2011). \btitlemicroRNA-associated progression pathways and potential therapeutic targets identified by integrated mRNA and microRNA expression profiling in breast cancer. \bjournalCancer Res. \bvolume71 \bpages5635–5645. \bptokimsref\endbibitem
- Burczynski et al. (2006) {barticle}[author] \bauthor\bsnmBurczynski, \bfnmMe\binitsM., \bauthor\bsnmPeterson, \bfnmRe\binitsR., \bauthor\bsnmTwine, \bfnmNe\binitsN. \betalet al. (\byear2006). \btitleMolecular classification of Crohn’s disease and ulcerative colitis patients using transcriptional profiles in peripheral blood mononuclear cells. \bjournalCancer Res. \bvolume8 \bpages51–61. \bptokimsref\endbibitem
- Candes and Tao (2007) {barticle}[mr] \bauthor\bsnmCandes, \bfnmEmmanuel\binitsE. and \bauthor\bsnmTao, \bfnmTerence\binitsT. (\byear2007). \btitleThe Dantzig selector: Statistical estimation when is much larger than . \bjournalAnn. Statist. \bvolume35 \bpages2313–2351. \biddoi=10.1214/009053606000001523, issn=0090-5364, mr=2382644 \bptokimsref\endbibitem
- Casella and Berger (2002) {bbook}[author] \bauthor\bsnmCasella, \bfnmG.\binitsG. and \bauthor\bsnmBerger, \bfnmR. L.\binitsR. L. (\byear2002). \btitleStatistical Inference, \bedition2nd ed. \bpublisherDuxbury, \blocationPacific Grove, CA. \bptokimsref\endbibitem
- Dettling and Buhlmann (2003) {barticle}[author] \bauthor\bsnmDettling, \bfnmMichael\binitsM. and \bauthor\bsnmBuhlmann, \bfnmPeter\binitsP. (\byear2003). \btitleBoosting for tumor classification with gene expression data. \bjournalBioinformatics \bvolume19 \bpages1061–1069. \bptokimsref\endbibitem
- Dudoit, Fridlyand and Speed (2002) {barticle}[mr] \bauthor\bsnmDudoit, \bfnmSandrine\binitsS., \bauthor\bsnmFridlyand, \bfnmJane\binitsJ. and \bauthor\bsnmSpeed, \bfnmTerence P.\binitsT. P. (\byear2002). \btitleComparison of discrimination methods for the classification of tumors using gene expression data. \bjournalJ. Amer. Statist. Assoc. \bvolume97 \bpages77–87. \biddoi=10.1198/016214502753479248, issn=0162-1459, mr=1963389 \bptokimsref\endbibitem
- Edelman et al. (2009) {barticle}[author] \bauthor\bsnmEdelman, \bfnmLucas\binitsL., \bauthor\bsnmToia, \bfnmGiuseppe\binitsG., \bauthor\bsnmGeman, \bfnmDonald\binitsD. \betalet al. (\byear2009). \btitleTwo-transcript gene expression classifiers in the diagnosis and prognosis of human diseases. \bjournalBMC Genomics \bvolume10 \bpages583. \bptokimsref\endbibitem
- Enerly et al. (2011) {barticle}[author] \bauthor\bsnmEnerly, \bfnmEspen\binitsE., \bauthor\bsnmSteinfeld, \bfnmIsrael\binitsI., \bauthor\bsnmKleivi, \bfnmKristine\binitsK., \bauthor\bsnmLeivonen, \bfnmSuvi-Katri\binitsS.-K. \betalet al. (\byear2011). \btitlemiRNA–mRNA integrated analysis reveals roles for miRNAs in primary breast tumors. \bjournalPLoS ONE \bvolume6 \bpages0016915. \bptokimsref\endbibitem
- Evans et al. (2011) {barticle}[author] \bauthor\bsnmEvans, \bfnmJames P.\binitsJ. P., \bauthor\bsnmMeslin, \bfnmEd M.\binitsE. M., \bauthor\bsnmMarteau, \bfnmTe M.\binitsT. M. and \bauthor\bsnmCaulfield, \bfnmTe\binitsT. (\byear2011). \btitleDeflating the genomic bubble. \bjournalScience \bvolume331 \bpages861–862. \bptokimsref\endbibitem
- Fan and Fan (2008) {barticle}[mr] \bauthor\bsnmFan, \bfnmJianqing\binitsJ. and \bauthor\bsnmFan, \bfnmYingying\binitsY. (\byear2008). \btitleHigh-dimensional classification using features annealed independence rules. \bjournalAnn. Statist. \bvolume36 \bpages2605–2637. \biddoi=10.1214/07-AOS504, issn=0090-5364, mr=2485009 \bptokimsref\endbibitem
- Fan and Lv (2008) {barticle}[mr] \bauthor\bsnmFan, \bfnmJianqing\binitsJ. and \bauthor\bsnmLv, \bfnmJinchi\binitsJ. (\byear2008). \btitleSure independence screening for ultrahigh dimensional feature space. \bjournalJ. R. Stat. Soc. Ser. B Stat. Methodol. \bvolume70 \bpages849–911. \biddoi=10.1111/j.1467-9868.2008.00674.x, issn=1369-7412, mr=2530322 \bptokimsref\endbibitem
- Funk (2012) {bmisc}[author] \bauthor\bsnmFunk, \bfnmCory\binitsC. (\byear2012). \bhowpublishedPersonal communication. Institute for Systems Biology, Seattle, WA. \bptokimsref\endbibitem
- Geman et al. (2004) {barticle}[mr] \bauthor\bsnmGeman, \bfnmDonald\binitsD., \bauthor\bsnmd’Avignon, \bfnmChristian\binitsC., \bauthor\bsnmNaiman, \bfnmDaniel Q.\binitsD. Q. and \bauthor\bsnmWinslow, \bfnmRaimond L.\binitsR. L. (\byear2004). \btitleClassifying gene expression profiles from pairwise mRNA comparisons. \bjournalStat. Appl. Genet. Mol. Biol. \bvolume3 \bpagesArt. 19, 21 pp. (electronic). \biddoi=10.2202/1544-6115.1071, issn=1544-6115, mr=2101468 \bptokimsref\endbibitem
- Geman et al. (2008) {binproceedings}[author] \bauthor\bsnmGeman, \bfnmDonald\binitsD., \bauthor\bsnmAfsari, \bfnmBahman\binitsB., \bauthor\bsnmTan, \bfnmAik Choon\binitsA. C. and \bauthor\bsnmNaiman, \bfnmDaniel Q.\binitsD. Q. (\byear2008). \btitleMicroarray classification from several two-gene expression comparisons. In \bbooktitleMachine Learning and Applications, 2008. ICMLA’08. Seventh International Conference \bpages583–585. \bpublisherIEEE, \blocationSan Diego, CA. \bptokimsref\endbibitem
- Golub et al. (1999) {barticle}[author] \bauthor\bsnmGolub, \bfnmTom R.\binitsT. R., \bauthor\bsnmSlonim, \bfnmDavid K.\binitsD. K., \bauthor\bsnmTamayo, \bfnmPeter\binitsP. \betalet al. (\byear1999). \btitleMolecular classification of cancer: Class discovery and class prediction by gene expression monitoring. \bjournalScience \bvolume286 \bpages531–537. \bptokimsref\endbibitem
- Gordon et al. (2002) {barticle}[pbm] \bauthor\bsnmGordon, \bfnmGavin J.\binitsG. J., \bauthor\bsnmJensen, \bfnmRoderick V.\binitsR. V., \bauthor\bsnmHsiao, \bfnmLi-Li\binitsL.-L., \bauthor\bsnmGullans, \bfnmSteven R.\binitsS. R., \bauthor\bsnmBlumenstock, \bfnmJoshua E.\binitsJ. E., \bauthor\bsnmRamaswamy, \bfnmSridhar\binitsS., \bauthor\bsnmRichards, \bfnmWilliam G.\binitsW. G., \bauthor\bsnmSugarbaker, \bfnmDavid J.\binitsD. J. and \bauthor\bsnmBueno, \bfnmRaphael\binitsR. (\byear2002). \btitleTranslation of microarray data into clinically relevant cancer diagnostic tests using gene expression ratios in lung cancer and mesothelioma. \bjournalCancer Res. \bvolume62 \bpages4963–4967. \bidissn=0008-5472, pmid=12208747 \bptokimsref\endbibitem
- Guo, Hastie and Tibshirani (2005) {barticle}[author] \bauthor\bsnmGuo, \bfnmYaqian\binitsY., \bauthor\bsnmHastie, \bfnmTrevor\binitsT. and \bauthor\bsnmTibshirani, \bfnmRobert\binitsR. (\byear2005). \btitleRegularized discriminant analysis and its application in microarrays. \bjournalBiostatistics \bvolume1 \bpages1–18. \bptokimsref\endbibitem
- Guo, Hastie and Tibshirani (2007) {barticle}[pbm] \bauthor\bsnmGuo, \bfnmYaqian\binitsY., \bauthor\bsnmHastie, \bfnmTrevor\binitsT. and \bauthor\bsnmTibshirani, \bfnmRobert\binitsR. (\byear2007). \btitleRegularized linear discriminant analysis and its application in microarrays. \bjournalBiostatistics \bvolume8 \bpages86–100. \biddoi=10.1093/biostatistics/kxj035, issn=1465-4644, pii=kxj035, pmid=16603682 \bptokimsref\endbibitem
- Guyon et al. (2002) {barticle}[author] \bauthor\bsnmGuyon, \bfnmIsabelle\binitsI., \bauthor\bsnmWeston, \bfnmJason\binitsJ., \bauthor\bsnmBarnhill, \bfnmStephen\binitsS. and \bauthor\bsnmVapnik, \bfnmVladimir\binitsV. (\byear2002). \btitleGene selection for cancer classification using support vector machines. \bjournalMach. Learn. \bvolume46 \bpages389–422. \bptokimsref\endbibitem
- Hastie, Tibshirani and Friedman (2001) {bbook}[mr] \bauthor\bsnmHastie, \bfnmTrevor\binitsT., \bauthor\bsnmTibshirani, \bfnmRobert\binitsR. and \bauthor\bsnmFriedman, \bfnmJerome\binitsJ. (\byear2001). \btitleThe Elements of Statistical Learning: Data Mining, Inference, and Prediction. \bseriesSpringer Series in Statistics. \bpublisherSpringer, \blocationNew York. \biddoi=10.1007/978-0-387-21606-5, mr=1851606 \bptokimsref\endbibitem
- Jones et al. (2008) {barticle}[author] \bauthor\bsnmJones, \bfnmSiân\binitsS., \bauthor\bsnmZhang, \bfnmXiaosong\binitsX., \bauthor\bsnmParsons, \bfnmD. Williams\binitsD. W. \betalet al. (\byear2008). \btitleCore signaling pathways in human pancreatic cancers revealed by global genomic analyses. \bjournalScience \bvolume321 \bpages1801–1806. \bptokimsref\endbibitem
- Khan et al. (2001) {barticle}[author] \bauthor\bsnmKhan, \bfnmJavad\binitsJ., \bauthor\bsnmWei, \bfnmJason S.\binitsJ. S., \bauthor\bsnmRingnér, \bfnmMichael\binitsM. \betalet al. (\byear2001). \btitleClassification and diagnostic prediction of cancers using gene expression profiling and artificial neural networks. \bjournalNat. Med. \bvolume7 \bpages673–679. \bptokimsref\endbibitem
- Kohlmann et al. (2008) {barticle}[author] \bauthor\bsnmKohlmann, \bfnmAlexander\binitsA., \bauthor\bsnmKipps, \bfnmThomas J.\binitsT. J., \bauthor\bsnmRassenti, \bfnmLaura Z.\binitsL. Z. and \bauthor\bsnmDowning, \bfnmJames R.\binitsJ. R. (\byear2008). \btitleAn international standardization programme towards the application of gene expression profiling in routine leukaemia diagnostics: The microarray innovations in leukemia study prephase. \bjournalBr. J. Haematol. \bvolume142 \bpages802–807. \bptokimsref\endbibitem
- Kuriakose, Chen et al. (2004) {barticle}[author] \bauthor\bsnmKuriakose, \bfnmMo A.\binitsM. A., \bauthor\bsnmChen, \bfnmWo T.\binitsW. T. \betalet al. (\byear2004). \btitleSelection and validation of differentially expressed genes in head and neck cancer. \bjournalCell. Mol. Life Sci. \bvolume61 \bpages1372–1383. \bptokimsref\endbibitem
- Lee et al. (2008) {barticle}[author] \bauthor\bsnmLee, \bfnmEd\binitsE., \bauthor\bsnmChuang, \bfnmH. Y.\binitsH. Y., \bauthor\bsnmKim, \bfnmJ. W.\binitsJ. W. \betalet al. (\byear2008). \btitleInferring pathway activity toward precise disease classification. \bjournalPLoS Comput. Biol. \bvolume4 \bpagese1000217. \bptokimsref\endbibitem
- Lin et al. (2009) {barticle}[author] \bauthor\bsnmLin, \bfnmXue\binitsX., \bauthor\bsnmAfsari, \bfnmBahman\binitsB., \bauthor\bsnmMarchionni, \bfnmLuigi\binitsL. \betalet al. (\byear2009). \btitleThe ordering of expression among a few genes can provide simple cancer biomarkers and signal BRCA1 mutations. \bjournalBMC Bioinformatics \bvolume10 \bpages256. \bptokimsref\endbibitem
- Ma et al. (2004) {barticle}[author] \bauthor\bsnmMa, \bfnmXiao Jun\binitsX. J., \bauthor\bsnmWang, \bfnmZuncai\binitsZ., \bauthor\bsnmRyan, \bfnmPaula D.\binitsP. D. \betalet al. (\byear2004). \btitleA two-gene expression ratio predicts clinical outcome in breast cancer patients treated with tamoxifen. \bjournalCancer Cell \bvolume5 \bpages607–616. \bptokimsref\endbibitem
- Marron, Todd and Ahn (2007) {barticle}[mr] \bauthor\bsnmMarron, \bfnmJ. S.\binitsJ. S., \bauthor\bsnmTodd, \bfnmMichael J.\binitsM. J. and \bauthor\bsnmAhn, \bfnmJeongyoun\binitsJ. (\byear2007). \btitleDistance-weighted discrimination. \bjournalJ. Amer. Statist. Assoc. \bvolume102 \bpages1267–1271. \biddoi=10.1198/016214507000001120, issn=0162-1459, mr=2412548 \bptokimsref\endbibitem
- Marshall (2011) {barticle}[author] \bauthor\bsnmMarshall, \bfnmEd\binitsE. (\byear2011). \btitleWaiting for the revolution. \bjournalScience \bvolume331 \bpages526–529. \bptokimsref\endbibitem
- Mills et al. (2009) {barticle}[author] \bauthor\bsnmMills, \bfnmK. I.\binitsK. I., \bauthor\bsnmKohlmann, \bfnmA.\binitsA., \bauthor\bsnmWilliams, \bfnmP. M.\binitsP. M., \bauthor\bsnmWieczorek, \bfnmL.\binitsL. \betalet al. (\byear2009). \btitleMicroarray-based classifiers and prognosis models identify subgroups with distinct clinical outcomes and high risk of AML transformation of myelodysplastic syndrome. \bjournalBlood \bvolume114 \bpages1063–1072. \bptokimsref\endbibitem
- Peng et al. (2003) {barticle}[author] \bauthor\bsnmPeng, \bfnmSe\binitsS., \bauthor\bsnmXu, \bfnmQe\binitsQ., \bauthor\bsnmLing, \bfnmXe\binitsX. \betalet al. (\byear2003). \btitleMolecular classification of cancer types from microarray data using the combination of genetic algorithms and support vector machines. \bjournalFEBS Lett. \bvolume555 \bpages358–362. \bptokimsref\endbibitem
- Pomeroy et al. (2002) {barticle}[author] \bauthor\bsnmPomeroy, \bfnmCott\binitsC., \bauthor\bsnmTamayo, \bfnmPablo\binitsP., \bauthor\bsnmGaasenbeek, \bfnmMichelle\binitsM. \betalet al. (\byear2002). \btitlePrediction of central nervous system embryonal tumour outcome based on gene expression. \bjournalNature \bvolume415 \bpages436–442. \bptokimsref\endbibitem
- Price et al. (2007) {barticle}[author] \bauthor\bsnmPrice, \bfnmNathan\binitsN., \bauthor\bsnmTrent, \bfnmJonathan\binitsJ., \bauthor\bsnmEl-Naggar, \bfnmAdel\binitsA. \betalet al. (\byear2007). \btitleHighly accurate two-gene classifier for differentiating gastrointestinal stromal tumors and leimyosarcomas. \bjournalProc. Natl. Acad. Sci. USA \bvolume43 \bpages3414–3419. \bptokimsref\endbibitem
- Qu et al. (2002) {barticle}[author] \bauthor\bsnmQu, \bfnmYo\binitsY., \bauthor\bsnmAdam, \bfnmBo\binitsB., \bauthor\bsnmYasui, \bfnmYo\binitsY. \betalet al. (\byear2002). \btitleBoosted decision tree analysis of surface-enhanced laser desorption/ionization mass spectral serum profiles discriminates prostate cancer from noncancer patients. \bjournalClin. Chem. \bvolume48 \bpages1835–1843. \bptokimsref\endbibitem
- Ramaswamy et al. (2001) {barticle}[author] \bauthor\bsnmRamaswamy, \bfnmSe\binitsS., \bauthor\bsnmTamayo, \bfnmPe\binitsP., \bauthor\bsnmRifkin, \bfnmRe\binitsR. \betalet al. (\byear2001). \btitleMulticlass cancer diagnosis using tumor gene expression signatures. \bjournalProc. Natl. Acad. Sci. USA \bvolume98 \bpages15149–15154. \bptokimsref\endbibitem
- Raponi et al. (2008) {barticle}[author] \bauthor\bsnmRaponi, \bfnmMitch\binitsM., \bauthor\bsnmLancet, \bfnmJeffrey E.\binitsJ. E., \bauthor\bsnmFan, \bfnmHongtao\binitsH. \betalet al. (\byear2008). \btitleA 2-gene classifier for predicting response to the farnesyltransferase inhibitor tipifarnib in acute myeloid leukemia. \bjournalBlood \bvolume111 \bpages2589–2596. \bptokimsref\endbibitem
- Shipp et al. (2002) {barticle}[author] \bauthor\bsnmShipp, \bfnmMa\binitsM., \bauthor\bsnmRoss, \bfnmKn\binitsK., \bauthor\bsnmTamayo, \bfnmPo\binitsP. \betalet al. (\byear2002). \btitleDiffuse large B-cell lymphoma outcome prediction by gene-expression profiling and supervised machine learning. \bjournalNat. Med. \bvolume8 \bpages68–74. \bptokimsref\endbibitem
- Simon et al. (2003) {barticle}[pbm] \bauthor\bsnmSimon, \bfnmRichard\binitsR., \bauthor\bsnmRadmacher, \bfnmMichael D.\binitsM. D., \bauthor\bsnmDobbin, \bfnmKevin\binitsK. and \bauthor\bsnmMcShane, \bfnmLisa M.\binitsL. M. (\byear2003). \btitlePitfalls in the use of DNA microarray data for diagnostic and prognostic classification. \bjournalJ. Natl. Cancer Inst. \bvolume95 \bpages14–18. \bidissn=0027-8874, pmid=12509396 \bptokimsref\endbibitem
- Singh et al. (2002) {barticle}[author] \bauthor\bsnmSingh, \bfnmDheeraj\binitsD., \bauthor\bsnmFebbo, \bfnmPablo\binitsP., \bauthor\bsnmRoss, \bfnmKeith\binitsK. \betalet al. (\byear2002). \btitleGene expression correlates of clinical prostate cancer behavior. \bjournalCancer Cell \bvolume1 \bpages203–209. \bptokimsref\endbibitem
- Stuart et al. (2004) {barticle}[author] \bauthor\bsnmStuart, \bfnmRo\binitsR., \bauthor\bsnmWachsman, \bfnmWo\binitsW., \bauthor\bsnmBerry, \bfnmCo\binitsC. \betalet al. (\byear2004). \btitleIn silico dissection of cell-type-associated patterns of gene expression in prostate cancer. \bjournalProc. Natl. Acad. Sci. USA \bvolume101 \bpages615–620. \bptokimsref\endbibitem
- Tan et al. (2005) {barticle}[author] \bauthor\bsnmTan, \bfnmAik Choon\binitsA. C., \bauthor\bsnmNaiman, \bfnmDaniel Q.\binitsD. Q., \bauthor\bsnmXu, \bfnmLei\binitsL. \betalet al. (\byear2005). \btitleSimple decision rules for classifying human cancers from gene expression profiles. \bjournalBioinformatics \bvolume21 \bpages3896–3904. \bptokimsref\endbibitem
- Thomas et al. (2007) {barticle}[author] \bauthor\bsnmThomas, \bfnmRoman K.\binitsR. K., \bauthor\bsnmBaker, \bfnmAlissa C.\binitsA. C., \bauthor\bsnmDeBiasi, \bfnmRalph M.\binitsR. M. \betalet al. (\byear2007). \btitleHigh-throughput oncogene mutation profiling in human cancer. \bjournalNature Genetics \bvolume39 \bpages347–351. \bptokimsref\endbibitem
- Tibshirani (2011) {bmisc}[author] \bauthor\bsnmTibshirani, \bfnmRobert\binitsR. (\byear2011). \bhowpublishedPAM R Package. Available at %****␣aoas738.tex␣Line␣2725␣****http://www-stat.stanford.edu/~tibs/PAM/Rdist/index.html. \bptokimsref\endbibitem
- Tibshirani et al. (2002) {barticle}[author] \bauthor\bsnmTibshirani, \bfnmRobert\binitsR., \bauthor\bsnmHastie, \bfnmTrevor\binitsT., \bauthor\bsnmNarasimhan, \bfnmBalasubramanian\binitsB. and \bauthor\bsnmChu, \bfnmGilbert\binitsG. (\byear2002). \btitleDiagnosis of multiple cancer types by shrunken centroids of gene expression. \bjournalProc. Natl. Acad. Sci. USA \bvolume99 \bpages6567–6572. \bptokimsref\endbibitem
- Wang (2012) {barticle}[pbm] \bauthor\bsnmWang, \bfnmXiaosheng\binitsX. (\byear2012). \btitleRobust two-gene classifiers for cancer prediction. \bjournalGenomics \bvolume99 \bpages90–95. \biddoi=10.1016/j.ygeno.2011.11.003, issn=1089-8646, mid=NIHMS340704, pii=S0888-7543(11)00260-6, pmcid=3273650, pmid=22138042 \bptokimsref\endbibitem
- Weichselbaum et al. (2008) {barticle}[author] \bauthor\bsnmWeichselbaum, \bfnmRalph R.\binitsR. R., \bauthor\bsnmIshwaranc, \bfnmHemant\binitsH., \bauthor\bsnmYoona, \bfnmTaewon\binitsT. \betalet al. (\byear2008). \btitleAn interferon-related gene signature for DNA damage resistance is a predictive marker for chemotherapy and radiation for breast cancer. \bjournalProc. Natl. Acad. Sci. USA \bvolume105 \bpages18490–18495. \bptokimsref\endbibitem
- Welsh et al. (2001) {barticle}[author] \bauthor\bsnmWelsh, \bfnmJo\binitsJ., \bauthor\bsnmSapinoso, \bfnmLo\binitsL., \bauthor\bsnmSu, \bfnmAo\binitsA. \betalet al. (\byear2001). \btitleAnalysis of gene expression identifies candidate markers and pharmacological targets inprostate cancer. \bjournalCancer Res. \bvolume61 \bpages5974–5978. \bptokimsref\endbibitem
- Wilcoxon (1945) {barticle}[author] \bauthor\bsnmWilcoxon, \bfnmF.\binitsF. (\byear1945). \btitleIndividual comparisons by ranking methods. \bjournalBiometrics \bpages80–83. \bptokimsref\endbibitem
- Winslow et al. (2012) {barticle}[author] \bauthor\bsnmWinslow, \bfnmRaymond\binitsR., \bauthor\bsnmTrayanova, \bfnmNataliya\binitsN., \bauthor\bsnmGeman, \bfnmDonald\binitsD. and \bauthor\bsnmMiller, \bfnmMichael\binitsM. (\byear2012). \btitleThe emerging discipline of computational medicine. \bjournalSci. Transl. Med. \bvolume4 \bpages158rv11. \bptokimsref\endbibitem
- Xu, Geman and Winslow (2007) {barticle}[pbm] \bauthor\bsnmXu, \bfnmLei\binitsL., \bauthor\bsnmGeman, \bfnmDonald\binitsD. and \bauthor\bsnmWinslow, \bfnmRaimond L.\binitsR. L. (\byear2007). \btitleLarge-scale integration of cancer microarray data identifies a robust common cancer signature. \bjournalBMC Bioinformatics \bvolume8 \bpages275. \biddoi=10.1186/1471-2105-8-275, issn=1471-2105, pii=1471-2105-8-275, pmcid=1950528, pmid=17663766 \bptokimsref\endbibitem
- Xu et al. (2005) {barticle}[author] \bauthor\bsnmXu, \bfnmLei\binitsL., \bauthor\bsnmTan, \bfnmAik Choon\binitsA. C., \bauthor\bsnmNaiman, \bfnmDaniel Q.\binitsD. Q. \betalet al. (\byear2005). \btitleRobust prostate cancer marker genes emerge from direct integration of inter-study microarray data. \bjournalBMC Bioinformatics \bvolume21 \bpages3905–3911. \bptokimsref\endbibitem
- Yao et al. (2004) {barticle}[author] \bauthor\bsnmYao, \bfnmZa\binitsZ., \bauthor\bsnmJaeger, \bfnmJo\binitsJ., \bauthor\bsnmRuzzo, \bfnmWo L.\binitsW. L. \betalet al. (\byear2004). \btitleGene expression alterations in prostate cancer predicting tumor aggression and preceding development of malignancy. \bjournalJ. Cli. Oncol. \bvolume22 \bpages2790–2799. \bptokimsref\endbibitem
- Yao et al. (2007) {barticle}[author] \bauthor\bsnmYao, \bfnmZo\binitsZ., \bauthor\bsnmJaeger, \bfnmJo\binitsJ., \bauthor\bsnmRuzzo, \bfnmWo\binitsW. \betalet al. (\byear2007). \btitleA Marfan syndrome gene expression phenotype in cultured skin fibroblasts. \bjournalBMC Genomics \bvolume8 \bpages319. \bptokimsref\endbibitem
- Yeang et al. (2001) {barticle}[author] \bauthor\bsnmYeang, \bfnmCe\binitsC., \bauthor\bsnmRamaswamy, \bfnmSe\binitsS., \bauthor\bsnmTamayo, \bfnmPeter\binitsP. \betalet al. (\byear2001). \btitleMolecular classification of multiple tumor types. \bjournalBioinformatics \bvolume17 \bpagesS316–S322. \bptokimsref\endbibitem
- Zhang, Yu and Singer (2003) {barticle}[author] \bauthor\bsnmZhang, \bfnmHu\binitsH., \bauthor\bsnmYu, \bfnmCo Y.\binitsC. Y. and \bauthor\bsnmSinger, \bfnmBo\binitsB. (\byear2003). \btitleCell and tumor classification using. \bjournalProc. Natl. Acad. Sci. USA \bvolume100 \bpages4168–4172. \bptokimsref\endbibitem
- Zhang et al. (2006) {barticle}[pbm] \bauthor\bsnmZhang, \bfnmHao Helen\binitsH. H., \bauthor\bsnmAhn, \bfnmJeongyoun\binitsJ., \bauthor\bsnmLin, \bfnmXiaodong\binitsX. and \bauthor\bsnmPark, \bfnmCheolwoo\binitsC. (\byear2006). \btitleGene selection using support vector machines with nonconvex penalty. \bjournalBioinformatics \bvolume22 \bpages88–95. \biddoi=10.1093/bioinformatics/bti736, issn=1367-4803, pii=bti736, pmid=16249260 \bptokimsref\endbibitem
- Zhao, Logothetis and Gorlov (2010) {barticle}[author] \bauthor\bsnmZhao, \bfnmHu\binitsH., \bauthor\bsnmLogothetis, \bfnmCo J.\binitsC. J. and \bauthor\bsnmGorlov, \bfnmIan P.\binitsI. P. (\byear2010). \btitleUsefulness of the top-scoring pairs of genes for prediction of prostate cancer progression. \bjournalProstate Cancer Prostatic Dis. \bvolume13 \bpages252–259. \bptokimsref\endbibitem