Reconstruction of latetime cosmology using Principal Component Analysis
Abstract
We reconstruct late-time cosmology using the technique of Principal Component Analysis (PCA). In particular, we focus on the reconstruction of the dark energy equation of state from two different observational data-sets, Supernovae type Ia data, and Hubble parameter data. The analysis is carried out in two different approaches. The first one is a derived approach, where we reconstruct the observable quantity using PCA and subsequently construct the equation of state parameter. The other approach is the direct reconstruction of the equation of state from the data. A combination of PCA algorithm and calculation of correlation coefficients are used as prime tools of reconstruction. We carry out the analysis with simulated data as well as with real data. The derived approach is found to be statistically preferable over the direct approach. The reconstructed equation of state indicates a slowly varying equation of state of dark energy.
pacs:
Cosmology, dark energy equation of state reconstruction, Principal Component Analysis, correlation coefficient.1 Introduction
Cosmological parameters are now constrained to much better precision than before Aghanim:2018eyx . This has been facilitated with significant improvements in observational techniques and the accessibility of various observational data. Data in the last two decades has confirmed that the dynamics of the Universe is dominated by a negative pressure component, known as dark energy. Dark energy is understood to be the component driving the observed accelerated expansion of the present Universe. One of the prime endeavors of modern cosmological research is to reveal the fundamental identity of dark energy, its exact nature and evolution.
It is not clear from the present observations whether dark energy is a cosmological constant Carroll1992 ; Carroll:2000fy ; Turner:1998ex ; Padmanabhan:2002ji or a time-evolving entity Peebles:2002gy ; Copeland:2006wr . The dark energy can be described by equation of state parameter , where is the energy density and is its pressure contribution. The form of the equation of state parameter of dark energy depends on the theoretical scenario being considered. A constant value corresponds to the CDM (cosmological constant with cold dark matter) model, whereas in case of time-evolving dark energy, the equation of state parameter can have different values Carroll1992 ; Padmanabhan:2002ji ; Peebles:2002gy ; Weinberg1989 ; Coble1997 ; Caldwell1998 ; Sahni2000 ; Ellis2003 ; Linder2008 ; Frieman2008 ; Albrecht2006 ; licia2008 ; nesseris2020 . We have little theoretical insight into these models, except for the CDM model, which has a strong theoretical motivation. However, the standard (CDM) model faces the problem of fine-tuning Carroll1992 ; Padmanabhan:2002ji ; Weinberg1989 ; Coble1997 . The observed value of the cosmological constant is found to be many orders of magnitude smaller than the value calculated in quantum field theories. Various alternative models have been proposed, which are based on fluids, canonical and non-canonical scalar fields. These models have the fine-tuning problem of their own, for instance, scalar fields require potentials which are specifically tailored to match observations Ratra:1987rm ; Linder:2006sv ; Caldwell:2005tm ; Linder:2007wa ; Huterer:2006mv ; Zlatev:1998tr ; Copeland:1997et ; PhysRevD.66.021301 ; Singh:2019bfd ; Singh:2018izf ; Bagla:2003prd ; Tsujikawa:2013 ; Rajvanshi:2019wmw ; Chevallier:2000qy .
Since the approach to understanding dark energy is primarily phenomenological, it is necessary to determine the model parameters to constrain and rule out models that are not consistent with data. Likelihood analysis is the most commonly used technique in cosmological parameter estimation and model fitting Singh:2019bfd ; Singh:2018izf ; Jassal:2009ya ; Nesseris:2004prd ; Nesseris:2005prd ; Nesseris:2007 ; Archana:2018 ; Sangwan:2018zpz . It is based on Bayesian statistical inference, where the posterior probability distribution of a parameter is determined with a uniform or variant prior function and the likelihood function. A combination of different data-sets, with likelihood regions complementary to each other allows a very narrow range for cosmological parameters. Thus the combination of various data-sets tightens the constraints on the parameters. This parametric reconstruction Chevallier:2000qy ; Linder:2002et ; Jassal:2004ej ; Gong:2006gs ; Mukherjee:2016eqj ; 2018PhRvD..98h3501V ; DiValentino:2017zyq ; licia2020_1 ; licia2020_2 ; licia:2013 assumes a functional form of the equation of state parameter of dark energy. However, it induces the possibility of bias in the parameter values due to the assumption of the parametric form. One elegant way to constrain the equation of state parameter is by the differential age method of cosmic chronometer technique, which can be used to find out the evolution of the Universe without any inference from a particular cosmological model licia2008 ; Jimenez:2001gg ; Moresco:2018ApJ ; Valent:2018 .
An alternative method is to reconstruct the evolution of cosmological quantities in a non-parametric fashion. Various statistical techniques have been adopted for non-parametric reconstruction of cosmological quantities Montiel2014 ; Gonz2016 ; Taylor2019 ; Porqueres2017 ; Diaz2019 ; Arjona2019prd . One of the promising techniques in non-parametric approaches is the Gaussian Process(GP) Valent:2018 ; Sahlen:2005zw ; Holsclaw2010am ; Shafieloo:2012ht ; Francesca:2019jcap ; Rasmussen:2005 ; Bonilla2020 , where we can create a multivariate Gaussian function with a determined mean and corresponding covariance function from any finite number of collections of random variables.
To accomplish the reconstruction of cosmological quantities, we use the Principal Component Analysis (PCA). A comparative study of different model-independent methods can be found in Nesseris:2013PhRvD . PCA is a multivariate analysis and is usually employed to predict the form of cosmological quantities in a model-independent, non-parametric manner Huterer2003prl ; clarkson2010prl ; Huterer2005 ; Zheng:2017ulu ; Ishida2011is . In Qin:2015eda and Liu:2015yha , different variants of PCA techniques have been adopted. Reference Qin:2015eda uses an error model and then creates different set of simulated Hubble data to construct the covariance matrix while Liu:2015yha use the weighted least square method and combines it with PCA.
From the viewpoint of the application of PCA, there exist two distinct methodologies. These methods differ mainly in the way the covariance matrix is calculated, which is the first step of any PCA technique. One way to implement PCA is through the computation of Fisher matrix, Nesseris:2013PhRvD ; Huterer2003prl ; clarkson2010prl ; Huterer2005 ; Zheng:2017ulu ; Ishida2011is ; Crittenden:2005wj ; Miranda:2018 ; Hart:2019 ; Hojjati:2012prd ; 2013JCAP…02..049N ; Hart:2021kad . One can bin the redshift range and assume a constant value for the quantity to be reconstructed in that redshift bin. These constant values are the initial parameters of the PCA. Fisher Matrix quantifies the correlation and uncertainties of these parameters. Therefore, by deriving these constants in different bins using PCA, we can reproduce our targeted quantity in terms of redshift Ishida2011is . Alternatively, a polynomial expression for the dynamical quantity can be assumed. In this case, the coefficients of the polynomial are the initial parameters for PCA, and the analysis gives the final values of these coefficients, which eventually gives the dynamical quantity clarkson2010prl .
PCA is independent of any prior biases and it is also helpful in comparing the quality of different data-sets Crittenden:2005wj ; yu2013prd . It is an application of linear algebra, which makes the linearly correlated data points uncorrelated. The correlated data points of the data-set used in PCA are transformed by rotating the axes, where the angle of rotation of these axes is such that linear-correlations between data-points are the smallest compared to any other orientation. The new axes are the principal component(PC)s of the data points, and these PCs are orthogonal to each other. In terms of information in the data-set, PCA creates a hierarchy of priority between these PCs. The first PC contains information of the signal the most and hence has the smallest dispersion of data-points about it. The second PC contains less information than the first PC and therefore provides a higher dispersion of the data-points as compared to the first PC. Higher-order PCs have the least priority as these correspond to noise and we can drop them. The reduction of dimensions is a distinctive feature of PCA. Therefore the final reconstructed curve in the lower dimension corresponds predominantly to the signal of the data-set. The PCA method also differs from the regression algorithms, which can not distinguish between signal and the noise. PCA can omit the features coming from the noise part and can pick the actual trend of the data-points licia2010lnip ; Sivia2006 ; Steinhardt2018 . In our case, the data-points on which we apply PCA are created in the process of reconstruction, see sect(2).
We assume polynomial expressions for the observational quantities, namely the Hubble parameter , and the distance modulus (). The polynomial form is then modified and predicted solely by PCA reconstruction algorithm. The only assumption we make is that it is possible to expand the reconstructed quantity in a polynomial. The dark energy equation of state is constructed in the subsequent steps after the reconstruction of the Hubble parameter and distance modulus.
The two-step process of reconstruction is termed as the derived approach. Further, in a direct approach, we apply the PCA technique to the polynomial expression of the equation of state parameter . For the application of our methodology, we require a tabulated dataset of the observational quantity, which can schematically be represented as, (independent variable)–(dependent variable)–(error bar of dependent variable). In the direct approach, described below, we do not have the tabulated data-set of and we derive the functional form of from the tabulated data-set of and . In the case of the derived approach, PCA first reconstructs the functional form of and from the Hubble parameter and Supernovae data-set respectively without any cosmological model. In the absence of cosmological model, and have no any parameter dependencies. However to construct the final form of equation of state of dark energy, we need as input. Application of PCA on polynomial expressions to reconstruct cosmological quantities have been employed earlier in Ishida2011is ; Qin:2015eda ; Liu:2015yha .
For a further check on the robustness of our results; we compute the correlations of the coefficients, present in the polynomial expressions of the reconstructed quantities. We apply PCA in the coefficient space, which is created by the polynomial. The PCA rearranges the correlation of these coefficients. Calculation of correlation-coefficients help to identify the linear and non-linear correlations of the components in the reconstructed quantities. We show that using the correlation coefficients calculation, we can restrict the allowed terms in the polynomial.
This paper is structured as follows. In sect(2) we describe the reconstruction algorithm and the use of correlation tests in those reconstructions. In sect(3), we describe the two approaches of reconstruction we follow. We present our results in sect(4). In sect(5), we conclude by summarizing the results.
2 Methodology
We begin with an initial basis, , where through which we can express the quantity to be reconstructed as,
| (1) |
The initial basis can be written in matrix form as, . Coefficients create a coefficient space of dimension . Each point in the coefficient space gives a realization of , including a constant . PCA modifies the coefficient space and chooses a single realization. One can consider different kinds of functions as well as different combinations of polynomials as initial bases. Choosing one initial basis function over the other is done by correlation coefficient calculation described below.
The Pearson correlation coefficient for two parameters and is given by,
| (2) |
where . For linearly uncorrelated variables, the correlation coefficient, . An exact correlation is identified by or . The Spearman rank coefficient is, in turn, the Pearson correlation coefficient of the ranks of the parameters; rank being the value assigned to a set of objects and it determines the relation of every object in the set with the rest of them. We mark the highest numeric value of a variable as ranked 1, the second-highest numeric value of the variable as ranked 2 and so on. A similar ranking is done for the ranks of the parameter .
To obtain the coefficients for the correlation analysis, we divide the parameter space into patches. We therefore have values associated with one coefficient of the polynomial; this is the number of columns of the coefficients matrix , (eq(5)). After ranking all the values of and , we obtain the table for the ranks of and . We then proceed to compute the Spearman correlation coefficient(), which is the Pearson Correlation coefficient of rank of and . Like in the case of the Pearson Correlation coefficients, . Computing Kendall correlation coefficient() gives a prescription to calculate the total number of concordant and dis-concordant pairs from the values of the variables and M_G_Kendall_1938 .
If we pick two pairs of points from the table of and , say and , for if when or if when ; then that pair of points are said to be in concordance with each other. On the other hand, for , when or if when , then these two pairs are called to be in dis-concordance with each other. Every concordant pair is scored and every dis-concordant pair is scored . The Kendall correlation coefficients are defined as,
| (3) |
Again, if is the number of concordance pair and is the number of dis-concordance pair
Hence the expression of is,
| (4) |
where, .
We perform the correlation coefficients calculation twice. The first time is to select the number of terms in the initial polynomial (eq(1)), and second time to select the number of terms in the final polynomial, (eq(8)). We select that value of for which the Pearson Correlation Coefficient is higher than the Spearman and Kendall Correlation coefficients. We use the R-package for statistical computing to calculate the correlation coefficients R:manual .
Values of linear and non-linear correlations depend on the quantity we want to reconstruct. They are also sensitive towards the data-set that we use in reconstruction. For instance, reconstruction of a fast varying function, which has non-zero higher order derivatives will introduce more non-linear contributions to the correlation of than linear contributions, and we need a greater set of initial basis, which means a higher value of . We take different values of and check the linear and non-linear correlation coefficients to fix the value of . Though a large value would help, we can not, however, fix to any arbitrarily significant number as it makes the analysis computationally expensive.
To compute the covariance matrix, we define the coefficient matrix () by selecting different patches from the coefficient space,
| (5) |
where is the number of patches that we have taken into account and is the total number of initial basis defined in eq(1); therefore, Y is a matrix of dimension and being the value of Nth coefficient in th patch.
In the present analysis, we have taken to be the order of . We estimate the best-fit values of the coefficients at each patch by minimization, where is defined as
| (6) |
is the total number of points in the data-sets. If the observational data-set have significant non-diagonal elements in the data covariance matrix(), we have to incorporate in eq(6), as , where and , vary for each data-points. Calculation of in all the patches gives us the variation of the coefficients and finally gives number of points in the coefficient space, over which we apply PCA. We calculate the covariance matrix and correlations of the coefficients for these points. In this analysis, each patch contains the origin of the multi-dimensional coefficient space.
The covariance matrix of the coefficients, is written as,
Eigenvector matrix, of this covariance matrix will rotate the initial basis of the coefficient space to a position where the patch-points will be uncorrelated. We organize the eigenvectors in the eigenvector matrix in the increasing order of eigenvalues. Eigenvalues of the Covariance matrix quantifies the error associated with each principal component Huterer2003prl ; Ishida2011is ; 2019Gortler ; Louis1953 .
If the final basis is given by,
| (7) |
The final reconstructed form of is,
| (8) |
where and the s are the uncorrelated coefficients associated with the final basis. The coefficients are re-calculated by using minimization, for the same patches considered earlier to create initial coefficient matrix (5). The value of can be determined by correlation coefficient calculation discussed above. As PCA only breaks the linear correlation, we select for which PCA is able to break Pearson correlation coefficient to the largest extent. Eigenvalues of the covariance matrix () indicate how well PCA can pick the best patch-point in the coefficient space. We look for the lowest number of final basis which can break the linear correlation to the greatest extent. We can start with smaller value of which eventually influence the value of , but it will pose the risk of losing essential features from PCA data-set.
3 Reconstruction of dark energy equation of state
The Hubble parameter () for a spatially flat Universe, composed of dark energy and non-relativistic matter is given by,
| (9) |
Here we have assumed that the contributions to the energy density is only due to the non-relativistic dark matter and dark energy. The density parameters for non-relativistic matter and dark energy are given by and . The quantity denotes the present-day value of the Hubble parameter, namely the Hubble constant and is the dark energy equation of state parameter ().
We assume no interaction between matter and dark energy in the present analysis. In the following subsections, we discuss the derived and direct approach to reconstruct using PCA.
3.1 Derived Approach
The derived approach is a two-step process in the reconstruction of dark energy Equation of State(EoS). In the first step, we reconstruct the observable, namely the Hubble parameter using the data and the distance modulus using the type Ia supernova data. Subsequently, we reconstruct as a derived quantity from these two different physical quantities. Similar sequence of reconstructions have already been discussed in Huterer2003prl ; Huterer2005 ; Ishida2011is ; yu2013prd . We follow the approach mentioned in sect(2) to reconstruct the curve of and . Differentiating eq(9) with redshift as the argument and rearranging the terms we can express as,
| (10) |
Here, is the derivative of Hubble parameter with respect to redshift . Since is related to through eq(10) by the zeroth and the first order differentiation of , the small difference in the actual and the reconstructed curve of is amplified by the term. This process of amplification of the deviation from actual nature becomes more severe with subsequent higher-order differentiation of the reconstructed quantity.
The luminosity distance is given by,
| (11) |
where , in terms of eq(9) is,
| (12) |
and is related to the distance modulus as
| (13) |
which is the dependent-variable in the type Ia supernovae data. From PCA, we determine the form of directly from data and then from eq(11) and eq(12) find the expression of . From eq(13), we trace back to eq(12) and find an expression which gives the in terms of the distance modulus.
Since , the equation of state parameter is given by
| (14) |
The second order derivative in eq(14) makes the reconstruction of through that of distance modulus unstable. For instance, if the reconstruction fails to pick some of the minute difference in the observational curve, then that difference will be amplified twice in the final calculation of the EoS. Therefore, the reconstruction of should be more accurate in picking up approximately all the features of which may be hidden within the supernovae data Jimenez:2001gg ; clarkson2010prl ; Ma_and_Zhang_2011rs ; pan_and_alam_2010pa .
In the reconstruction of and , we begin with polynomial expansions in terms of the different variables , and where is the red-shift and is the scale factor. The analysis is carried out with seven terms in initial basis, which means creating a coefficient space of dimensions (eq(1)). We test our algorithm on a simulated data-set of CDM cosmology. We generate the data-points of and for and the values of cosmological parameters and are fixed at Planck 2018 values Aghanim:2018eyx . Fig(2) and table 1 show that our algorithm can predict the simulated data.
3.2 Direct Approach
For the direct reconstruction approach, we begin with a polynomial form of itself. In eq(9), the quantity is in the exponent, and considering a polynomial form for implies addition of some non-linear components to our linear analysis in coefficient space. Again we fix the dimension of the initial basis by computing the correlation coefficients. Here we need to balance available computational power as well as the non-linearity we introduce, with the accuracy we demand to choose the value of .
In this case too the independent variables are taken to be , and . Here we introduce non-linear terms in the initial coefficients of PCA; here correlation coefficients calculation is not of assistance as in the case of derived approach 3.1 to select . Due to the risk of compromising different features of the data-set and also due to the complex dynamics of correlation coefficients, we do not reduce any terms in the final basis () of the direct approach.
To test the effectiveness of both the approaches described above, we first work with simulated data-sets for specific models. We create simulated data-points for (CDM) and Qin:2015eda where the values of and are fixed at Planck 2018 values Aghanim:2018eyx . We use eq(9) to calculate at the same redshift value as in the real Hubble parameter vs redshift data-set ohd1 ; ohd2 ; ohd3 ; ohd4 ; ohd5 . Similarly, the distance modulus data points are simulated using equations (11),(12) and (13). Here we evaluate distance modulus at the same redshift values as are there in type Ia supernovae (SNe) Pantheon data-set panth_snIa . We later utilize the observational measurements of Hubble parameter at different redshift ohd1 ; ohd2 ; ohd3 ; ohd4 ; ohd5 and the distance modulus measurement of type Ia supernovae (SNe) data panth_snIa .
4 Results
4.1 Derived approach
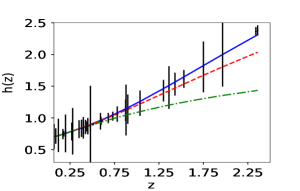
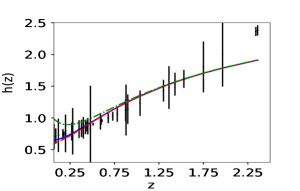
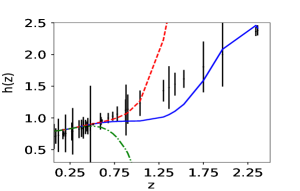
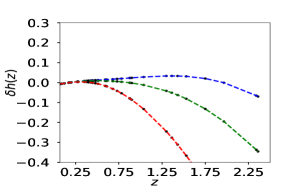
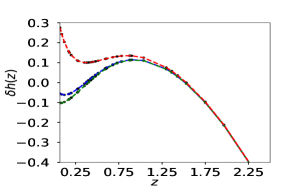
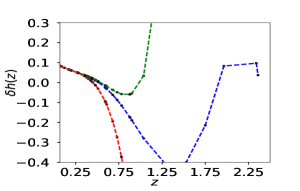
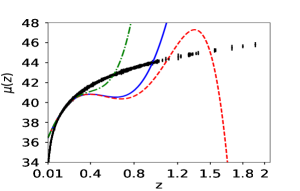
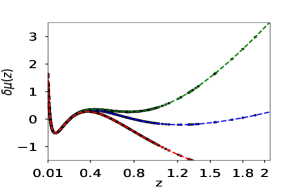
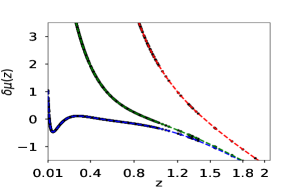
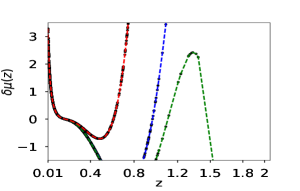
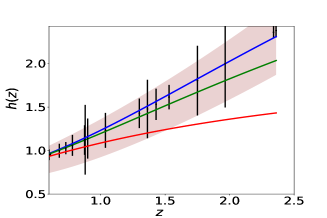
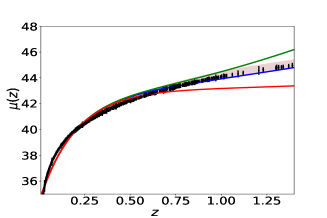
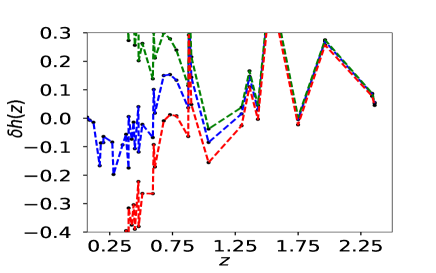
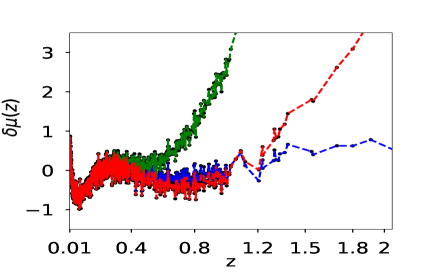
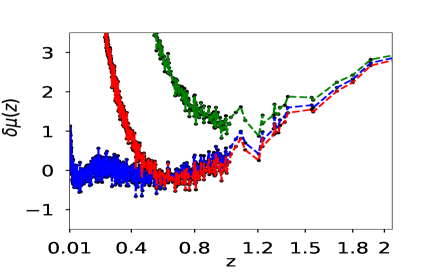
We first reconstruct and using simulated dataset. The reconstruction with simulated data is a check on the viability of the method. Fig (1) shows the reconstructed curves of the reduced Hubble parameter and distance modulus obtained for the simulated data. The reconstructed curves are for three different reconstruction variables , the scale factor and the redshift . It is clear from the plot 1 that the PCA reconstruction produces a consistent result when is chosen as the independent variable. We also plot the difference between the fiducial model and the reconstructed curves along for a comparison. The plots of the residues clearly show that the reconstruction of both and validates the reconstruction appraoch. The number of terms on the initial basis is fixed at . We also check our results for and , and find that the results do not vary significantly. Here, we present the reconstruction curves from the variable only for the simulated data-set. Since in this case, we do not achieve a viable reconstruction, we do not analyse this further for real data.
From table 1 we see that both and variables are able to predict the value of closer to the assumed value of in simulated data. We calculate the error in the prediction of from the Covariance matrix of the PCA data-set, where we give a cut off value, to mask out some patch points which lead to under-fitting Huterer2003prl ; Vazirnia2021PhRvD ; Huterer:1998qv .
Further, the correlation coefficient calculation suggests that the best choice of number of terms for variable in the final polynomial(8) is , reduction of one term from the initial polynomial expression(1). For variable and , it is , hence there is no reduction of terms. See (Appendices A).
| Reduced Hubble constant | ||
|---|---|---|
| Variable | Simulated | Observed |
| Variable | PCA | wCDM | Planck() | |
|---|---|---|---|---|
| (1-a) | ||||
| (Plank+WP+SDSS+SNLS) | (Plank+WP+JLA) | (EE+lowE) | ||
| a | ||||
| (Plank+WP+JLA) | (WMAP9+JLA+BAO) | (TT,TE,EE+lowE+lensing) |
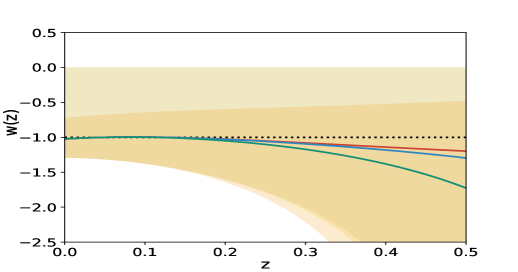
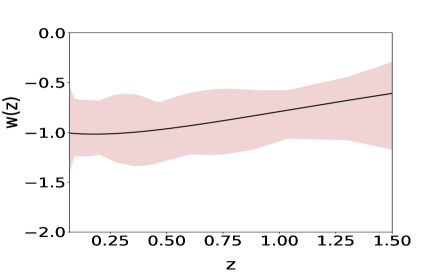
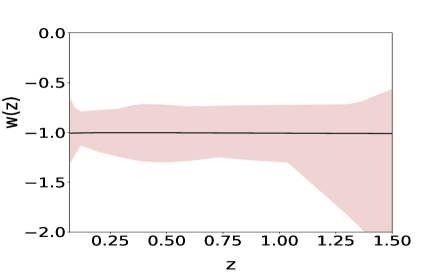
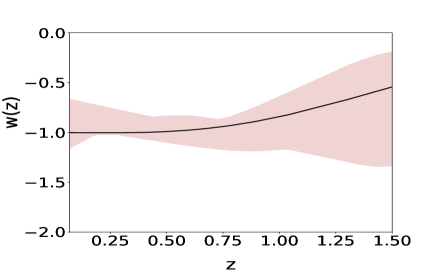
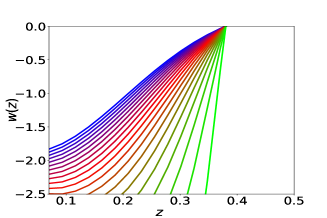
Fig(2) shows that the variable reproduces behaviour when the simulated data is used. Shaded region of fig(2) represents all possible vs curves produced by PCA for simulated data with a variation of from to . is one of the free parameters in our methodology, and the methodology does not pick any one curve over another. The polynomial expression of in is effectively an infinite series in terms of . As the independent variable of the data-sets is , therefore, and can capture more features than the initial basis . When the observational data-set is used in this polynomial expression, it indicates a time evolving , fig 7. The other two variables, namely and , could not successfully reproduce the nature while using the simulated data. In the case of simulated supernovae data-set we see that all the reconstructions for and varying from to follows a similar trend after we choose a specific basis function. For all the three reconstruction variable vs curves fluctuate between phantom and non-phantom regime.
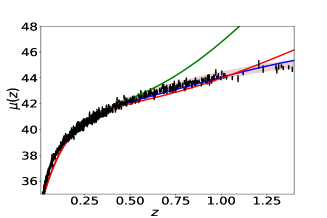
We now construct the equation of state parameter from the reconstructed and . It is clear from fig(2) that the reconstruction by derived approach for the variable successfully reproduces the assumed earlier. On the other hand, the reconstruction variable and do not reproduce the which has been assumed to simulate the data.
Using the reconstructed analytic form of from derived approach, we estimate the present day value of the Hubble parameter . The EoS parameter calculated by the derived approach has the free parameter , which we vary in the reconstructed curves, fig 7. We present the estimated values of , scaled by , for the analysis with simulated and the observational data in table 1. We also calculate the present day value of .
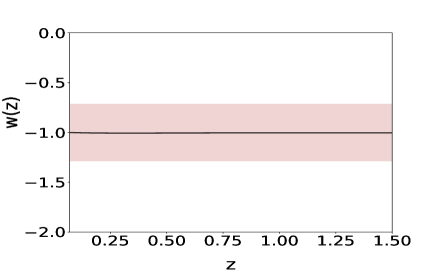
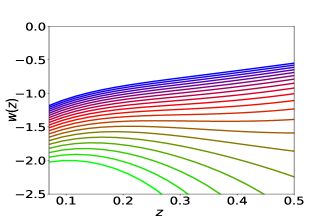
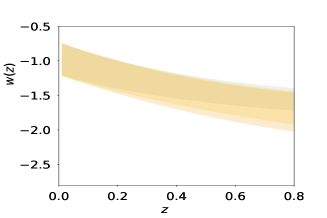
We calculate the range of from eqn(9). We assume to be constant () and find out the allowed range of for the range of determined by PCA. This range of is dependent on and we do the analysis for , as shown in fig(8). The allowed range of for are , and respectively. We do the analysis for as it is the selected variable by correlation test calculation. For supernovae data-set we find out the allowed range of , which lies within the error bar of the data-set by considering a polynomial with variable . Range of for are , and respectively.
Fig(3) indicates that the PCA reconstructions of is well within the range of CDM paramters for the simulated data. We vary and equation of state parameter in cosmology () in the range [] and [] respectively. The ability of our methodology to reconstruct and reflects in the reconstruction of for the simulated data.
To quantify the efficiency of our algorithm in picking up the underlying theory, we create an error function by the method of interpolation with the errors of observational data and use with a data-set constructed from the final reconstruction curve of PCA. For this testing purpose we assume and as parameters, therefore constants for a particular data-set produced from PCA reconstruction. We find out that PCA reconstruction for both simulated and observed data-set, if we take as our model, the value and lies well within the range.
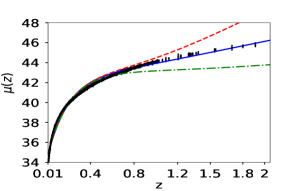
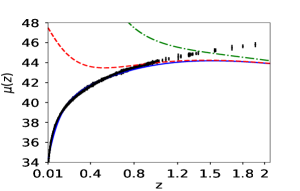
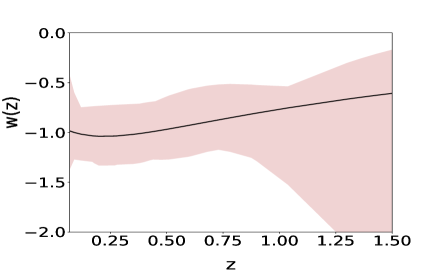
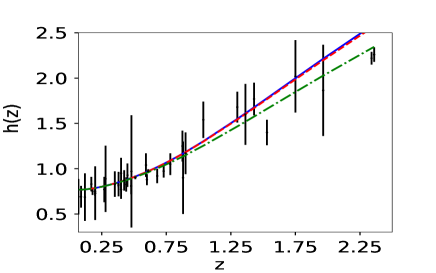
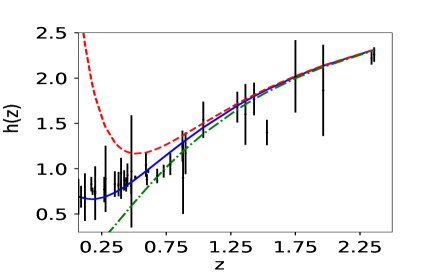
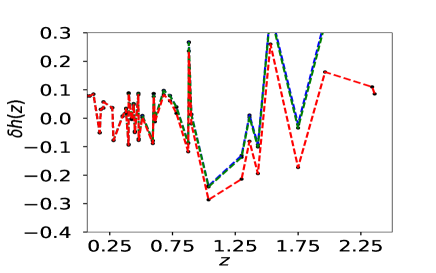
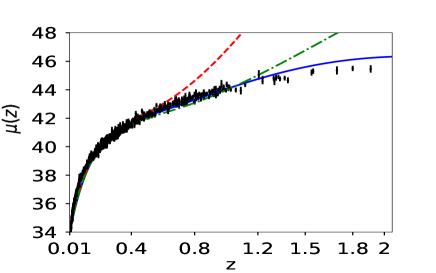
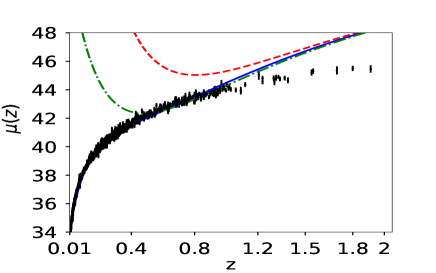
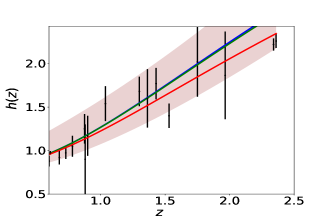
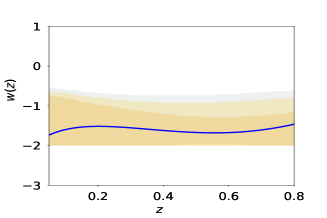
We now do the same analysis using observed data. Fig(5) shows the reconstructed curves of reduced Hubble parameter and obtained for the real Hubble parameter and supernovae data-sets. It is evident from the plot that PCA reconstruction with variable produces consistent results for observational data-set also. Fig(7) shows the final reconstruction of from the observed Hubble parameter data-set with the reduced Hubble constant fixed at the value predicted by PCA. Reconstruction of the functional form of by choosing a point from coefficient space (eq 8) is the first step of derived approach, which eventually gives us the value of from the same point. We do not vary the value of in the reconstruction curves to ensure that both and are from the same point of coefficient space. The values obtained from the observational data-set are higher as compared to the other model-dependent estimations. Table 2 presents the values of , obtained, along with model-dependent estimations of from other studies Aghanim:2018eyx ; Mukherjee:2018oll ; Haridasu:2018gqm for a comparison.
4.2 Direct approach
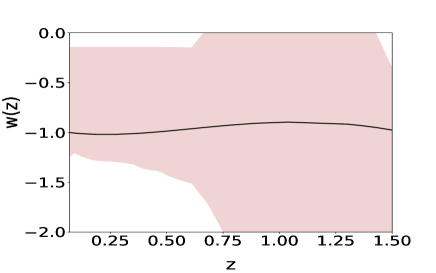
For the direct approach, we have considered only the Hubble parameter data-set. Reconstruction is carried out for all the three independent variables , and . As in the case of derived approach, we first use simulated data-set. The results obtained for the simulated data-sets are shown in fig(4). In this case, all three independent variables reproduce the nature of the equation of state parameter. In the direct approach, using the correlation test calculation, we find to be the best choice for the number of terms in the initial polynomial eq(1). As the number of terms on initial basis is comparatively low and we assume as our final basis number, the uncertainties which PCA poses in predicting the best patch-point is relatively low. The tiny non-linearity we introduced in the by considering a polynomial form of will be amplified in the case of supernovae data-set. Hence it makes the reconstruction much more unstable in the case of reconstruction of through distance modulus calculation.
For the observed Hubble parameter data-set too we reproduce the curves using the same algorithm. In the case of direct approach, PCA cannot predict the value of and ; therefore, these two parameters have to be fixed prior to the analysis.
For real data-set, all the plots for the variation of from to after fixing reduced Hubble constant at have the similar trend. We also check the plot for the variation of from to after fixing at . Direct approach is more susceptible to model biasing as in the case of direct approach we have to select the value of and . Correlation coefficient calculation also indicates that derived approach have more potential of breaking the correlations of the coefficients of the polynomial than the direct approach.
In the direct approach, though the reconstruction of the fiducial is consistent (fig(4)), the correlation test calculation for the direct approach shows that the algorithm is not able to break the Pearson Correlation as it breaks down in the case of the derived approach. In the case of direct approach, for reconstruction, the magnitude of Pearson correlation coefficients decreases after applying PCA but changes signs for the first two principal components, whereas Kendall and Spearman correlation coefficient of for these two principal components assume higher negative value. Again, for reconstruction by the variable , the Pearson Correlation decreases, though both Spearman and Kendall Correlation coefficients decrease in magnitude, it changes sign for the first two principal components. For the variable , up to the first two principal components, Pearson correlation coefficients decrease, but Spearman and Kendall correlation coefficients assume large negative value. From the correlation coefficient calculation the derived approach is selected over the direct approach and selects the reconstruction by the independent variable as compared to variables and .
5 Summary and Conclusion
In this paper, we reconstruct late-time cosmology using the Principal Component Analysis. There are very few prior assumptions about nature and distribution of different components contributing to the energy of the Universe. Observational Hubble parameter and distance modulus measurements of type Ia supernovae are the observable quantities that are taken into account in the present analysis. We proceed in two different ways to do the reconstruction. The first one is a derived approach where the observable quantities are reconstructed from the data using PCA, and then is obtained from the reconstructed quantities using Friedman equation. The other approach is a direct one. In this case, is reconstructed directly from the observational data using PCA without any intermediate reconstruction. Based on the efficiency of the method to break the correlation among the coefficients we can select one reconstruction curve over the other. We achieve a better reconstruction in the derived approach as compared to the direct approach, even though the direct approach has lesser uncertainties than the derived approach in predicting the patch of the best coefficient point from the dimensional coefficient space due to the lower number of initial and final bases. In the derived approach, though, we need no cosmological theory or model to determine the functional form of and ; however for the calculation of , we need to input a cosmological model. On the other hand, the direct approach starts with using a polynomial form of in Friedman equation. Therefore, in the case of direct approach, the dependencies of on the cosmological parameters are greater.
We have adopted the simulated as well as observed data-sets for our analysis. Simulated data-sets are used to check the efficiency. For the reconstruction of the analysis produces consistent result only for the Hubble parameter data. Though the reconstruction of through the derived approach is consistent and reconstruction of is within the error bars of the data-set, the result for the reconstructed deviates drastically from the physically acceptable range. The increase in the order of differentiation to connect with is a possible reason for this inconsistency. Here we are focusing on the reconstruction only from data-set. The reconstructed by the variable , obtained in the derived approach for data-set shows a phantom like nature, that is at present and a non-phantom nature in the past for most of the values of . In the case of direct approach, curves show oscillations in the phantom and non-phantom regime. The calculation of the correlation coefficients clearly shows a preference for the derived approach. PCA lacks the efficiency of breaking the correlation in the initial basis in case of the direct approach. This probably causes the inconsistency between the results obtained in the derived and direct approaches.
The other important factor is the variable of reconstruction. In the present analysis, we have adopted three different reconstruction variables, namely , and , in both direct and derived approaches. Values of correlation coefficients after PCA select the reconstruction variable over the other two. We should emphasize the result obtained for variable by derived approach. Since we have a finite number of terms in the initial polynomial, due to the constraints set by computational power, to some extent the results depends on the assumption of polynomial expression of the observables. One of our future plans is to develop an algorithm which can inclusively select the most suitable initial basis form for a fix computational power and a given observational data-set. The reconstructed curves, obtained for , show that shows a phantom nature at present epoch and it was in non-phantom nature in the past. PCA reconstruction indicates an evolution of the dark energy equation of state parameter.
Appendices A
The correlation coefficients of the first three coefficients of the polynomial expression eq(1) and eq(8) of the reconstructed quantity is shown in table 3. PCA breaks the linear correlation of the coefficients, which is evident from table[3]. Presence of the non-linear correlation in the initial coefficients complicates the process. As the first three terms of the ultimate expression of the reconstructed quantity contains the dominant trend of the data-points, we only mention the correlation coefficients only for the first three parameters. The reconstruction which can break Pearson Correlation to a greater extent as well as have lesser Spearman and Kendall Correlation coefficients is selected. We can see from table 3 that the reconstruction by , breaks the correlation to a greater extent than in the case of and . Variation of correlation coefficients before and after the application of PCA is similar for both the simulated as well as the real data-set. Difference of Pearson correlation coefficients for simulated and real data-set in case of and is of the order of or less. For the variable , the difference of Pearson correlation coefficients for real and simulated data is of the order of or less.
| Variable | State | Pearson | Spearman | Kendall |
| (1-a) | pre-PCA | |||
| post PCA | ||||
| a | pre-PCA | |||
| post PCA | ||||
| z | pre-PCA | |||
| post PCA |
Acknowledgements
The authors acknowledge the use of High-Performance-Computing facility at IISER Mohali. AM acknowledges the financial support from the Science and Engineering Research Board (SERB), Department of Science and Technology, Government of India as a National Post-Doctoral Fellow (NPDF, File no. PDF/2018/001859). The authors would like to thank J S Bagla for useful suggestions and discussions.
Data Availability
The observational data-sets used in the analysis are publicly available and duly referred in the text. The simulated data-sets can be provided on request with appropriate justification.
References
- (1) Planck Collaboration, N. Aghanim, Y. Akrami, M. Ashdown, J. Aumont, C. Baccigalupi, M. Ballardini, A.J. Banday, R.B. Barreiro, N. Bartolo et al., arXiv e-prints arXiv:1807.06209 (2018), 1807.06209
- (2) S.M. Carroll, W.H. Press, E.L. Turner, Annual Review of Astronomy and Astrophysics 30, 499 (1992)
- (3) S.M. Carroll, Living Rev. Rel. 4, 1 (2001), astro-ph/0004075
- (4) M.S. Turner, M. White, prd 56, R4439 (1997), astro-ph/9701138
- (5) T. Padmanabhan, Phys. Rept. 380, 235 (2003), hep-th/0212290
- (6) P.J.E. Peebles, B. Ratra, Rev. Mod. Phys. 75, 559 (2003), [,592(2002)], astro-ph/0207347
- (7) E.J. Copeland, M. Sami, S. Tsujikawa, Int. J. Mod. Phys. D15, 1753 (2006), hep-th/0603057
- (8) S. Weinberg, Rev. Mod. Phys. 61, 1 (1989)
- (9) K. Coble, S. Dodelson, J.A. Frieman, Phys. Rev. D 55, 1851 (1997)
- (10) R.R. Caldwell, R. Dave, P.J. Steinhardt, Phys. Rev. Lett. 80, 1582 (1998)
- (11) V. Sahni, A. Starobinsky, International Journal of Modern Physics D 9, 373 (2000), astro-ph/9904398
- (12) J. Ellis, Philosophical Transactions of the Royal Society of London A: Mathematical, Physical and Engineering Sciences 361, 2607 (2003)
- (13) E.V. Linder, Reports on Progress in Physics 71, 056901 (2008), 0801.2968
- (14) J.A. Frieman, M.S. Turner, D. Huterer, Annual Review of Astronomy and Astrophysics 46, 385 (2008)
- (15) A. Albrecht, G. Bernstein, R. Cahn, W.L. Freedman, J. Hewitt, W. Hu, J. Huth, M. Kamionkowski, E.W. Kolb, L. Knox et al., arXiv e-prints astro-ph/0609591 (2006), astro-ph/0609591
- (16) D. Stern, R. Jimenez, L. Verde, M. Kamionkowski, S.A. Stanford, J. Cosmology Astropart. Phys2010, 008 (2010), 0907.3149
- (17) R. Arjona, S. Nesseris, arXiv e-prints arXiv:2012.12202 (2020), 2012.12202
- (18) B. Ratra, P.J.E. Peebles, Phys. Rev. D37, 3406 (1988)
- (19) E.V. Linder, Phys. Rev. D73, 063010 (2006), astro-ph/0601052
- (20) R.R. Caldwell, E.V. Linder, Phys. Rev. Lett. 95, 141301 (2005), astro-ph/0505494
- (21) E.V. Linder, Gen. Rel. Grav. 40, 329 (2008), 0704.2064
- (22) D. Huterer, H.V. Peiris, Phys. Rev. D75, 083503 (2007), astro-ph/0610427
- (23) I. Zlatev, L.M. Wang, P.J. Steinhardt, Phys. Rev. Lett. 82, 896 (1999), astro-ph/9807002
- (24) E.J. Copeland, A.R. Liddle, D. Wands, Phys. Rev. D57, 4686 (1998), gr-qc/9711068
- (25) T. Padmanabhan, Phys. Rev. D 66, 021301 (2002)
- (26) A. Singh, H.K. Jassal, M. Sharma (2019), 1907.13309
- (27) A. Singh, A. Sangwan, H.K. Jassal, JCAP 1904, 047 (2019), 1811.07513
- (28) J.S. Bagla, H.K. Jassal, T. Padmanabhan, Phys. Rev. D 67, 063504 (2003)
- (29) S. Tsujikawa, Classical and Quantum Gravity 30, 214003 (2013), 1304.1961
- (30) M.P. Rajvanshi, J.S. Bagla, Journal of Astrophysics and Astronomy 40, 44 (2019), 1905.01103
- (31) M. Chevallier, D. Polarski, Int. J. Mod. Phys. D10, 213 (2001), gr-qc0009008
- (32) H.K. Jassal, Phys. Rev. D79, 127301 (2009), 0903.5370
- (33) S. Nesseris, L. Perivolaropoulos, Phys. Rev. D70, 043531 (2004), astro-ph/0401556
- (34) S. Nesseris, L. Perivolaropoulos, Phys. Rev. D72, 123519 (2005), astro-ph/0511040
- (35) S. Nesseris, L. Perivolaropoulos, J. Cosmology Astropart. Phys2007, 018 (2007), astro-ph/0610092
- (36) A. Sangwan, A. Tripathi, H.K. Jassal, arXiv e-prints arXiv:1804.09350 (2018), 1804.09350
- (37) A. Sangwan, A. Tripathi, H.K. Jassal, arXiv e-prints arXiv:1804.09350 (2018), 1804.09350
- (38) E.V. Linder, Phys. Rev. Lett. 90, 091301 (2003), astro-ph/0208512
- (39) H.K. Jassal, J.S. Bagla, T. Padmanabhan, Mon. Not. Roy. Astron. Soc. 356, L11 (2005), astro-ph/0404378
- (40) Y.G. Gong, A. Wang, Phys. Rev. D75, 043520 (2007), astro-ph/0612196
- (41) A. Mukherjee, Mon. Not. Roy. Astron. Soc. 460, 273 (2016), 1605.08184
- (42) S. Vagnozzi, S. Dhawan, M. Gerbino, K. Freese, A. Goobar, O. Mena, Phys. Rev. D98, 083501 (2018), 1801.08553
- (43) E. Di Valentino, A. Melchiorri, E.V. Linder, J. Silk, Phys. Rev. D96, 023523 (2017), 1704.00762
- (44) N. Bellomo, J.L. Bernal, G. Scelfo, A. Raccanelli, L. Verde, J. Cosmology Astropart. Phys2020, 016 (2020), 2005.10384
- (45) J.L. Bernal, N. Bellomo, A. Raccanelli, L. Verde, J. Cosmology Astropart. Phys2020, 017 (2020), 2005.09666
- (46) L. Verde, P. Protopapas, R. Jimenez, Physics of the Dark Universe 2, 166 (2013), 1306.6766
- (47) R. Jimenez, A. Loeb, ApJ573, 37 (2002), astro-ph/0106145
- (48) M. Moresco, R. Jimenez, L. Verde, L. Pozzetti, A. Cimatti, A. Citro, ApJ868, 84 (2018), 1804.05864
- (49) A. Gómez-Valent, L. Amendola, J. Cosmology Astropart. Phys2018, 051 (2018), 1802.01505
- (50) A. Montiel, R. Lazkoz, I. Sendra, C. Escamilla-Rivera, V. Salzano, Phys. Rev. D89, 043007 (2014), 1401.4188
- (51) J.E. González, J.S. Alcaniz, J.C. Carvalho, J. Cosmology Astropart. Phys2016, 016 (2016), 1602.01015
- (52) P.L. Taylor, T.D. Kitching, J.D. McEwen, Phys. Rev. D99, 043532 (2019), 1810.10552
- (53) N. Porqueres, T.A. Enßlin, M. Greiner, V. Böhm, S. Dorn, P. Ruiz-Lapuente, A. Manrique, A&A599, A92 (2017), 1608.04007
- (54) A. Diaz Rivero, V. Miranda, C. Dvorkin, Phys. Rev. D100, 063504 (2019), 1903.03125
- (55) R. Arjona, S. Nesseris, Phys. Rev. D101, 123525 (2020), 1910.01529
- (56) M. Sahlen, A.R. Liddle, D. Parkinson, Phys. Rev. D72, 083511 (2005), astro-ph/0506696
- (57) T. Holsclaw, U. Alam, B. Sansó, H. Lee, K. Heitmann, S. Habib, D. Higdon, prl 105, 241302 (2010), 1011.3079
- (58) A. Shafieloo, A.G. Kim, E.V. Linder, prd 85, 123530 (2012), 1204.2272
- (59) F. Gerardi, M. Martinelli, A. Silvestri, J. Cosmology Astropart. Phys2019, 042 (2019), 1902.09423
- (60) C.E. Rasmussen, C.K.I. Williams, Gaussian Processes for Machine Learning (Adaptive Computation and Machine Learning) (The MIT Press, 2005), ISBN 026218253X
- (61) A. Bonilla, S. Kumar, R.C. Nunes, arXiv e-prints arXiv:2011.07140 (2020), 2011.07140
- (62) S. Nesseris, J. García-Bellido, Phys. Rev. D88, 063521 (2013), 1306.4885
- (63) D. Huterer, G. Starkman, Phys. Rev. Lett.90, 031301 (2003), astro-ph/0207517
- (64) C. Clarkson, C. Zunckel, Phys. Rev. Lett.104, 211301 (2010), 1002.5004
- (65) D. Huterer, A. Cooray, Phys. Rev. D71, 023506 (2005), astro-ph/0404062
- (66) W. Zheng, H. Li, Astropart. Phys. 86, 1 (2017)
- (67) E.E.O. Ishida, R.S. de Souza, A&A527, A49 (2011), 1012.5335
- (68) H.F. Qin, X.B. Li, H.Y. Wan, T.J. Zhang (2015), 1501.02971
- (69) Z.E. Liu, H.R. Yu, T.J. Zhang, Y.K. Tang, Phys. Dark Univ. 14, 21 (2016), 1501.04176
- (70) R.G. Crittenden, L. Pogosian, G.B. Zhao, JCAP 0912, 025 (2009), astro-ph/0510293
- (71) V. Miranda, C. Dvorkin, Phys. Rev. D98, 043537 (2018), 1712.04289
- (72) L. Hart, J. Chluba, arXiv e-prints arXiv:1912.04682 (2019), 1912.04682
- (73) A. Hojjati, G.B. Zhao, L. Pogosian, A. Silvestri, R. Crittenden, K. Koyama, Phys. Rev. D85, 043508 (2012), 1111.3960
- (74) R. Nair, S. Jhingan, J. Cosmology Astropart. Phys2013, 049 (2013), 1212.6644
- (75) L. Hart, J. Chluba (2021), 2107.12465
- (76) H.R. Yu, S. Yuan, T.J. Zhang, Phys. Rev. D88, 103528 (2013), 1310.0870
- (77) L. Verde, Statistical Methods in Cosmology (2010), Vol. 800, pp. 147–177
- (78) D.S. Sivia, J. Skilling, Data Analysis - A Bayesian Tutorial, Oxford Science Publications, 2nd edn. (Oxford University Press, 2006)
- (79) C.L. Steinhardt, A.S. Jermyn, PASP130, 023001 (2018), 1801.06545
- (80) Kendall, Biometrika 30, 81 (1938), https://academic.oup.com/biomet/article-pdf/30/1-2/81/423380/30-1-2-81.pdf
- (81) R Core Team, R: A Language and Environment for Statistical Computing, R Foundation for Statistical Computing, Vienna, Austria (2013), http://www.R-project.org/
- (82) J. Görtler, T. Spinner, D. Streeb, D. Weiskopf, O. Deussen, arXiv e-prints arXiv:1905.01127 (2019), 1905.01127
- (83) L. Guttman, Educational and Psychological Measurement 13, 505 (1953), https://doi.org/10.1177/001316445301300315
- (84) C. Ma, T.J. Zhang, ApJ730, 74 (2011), 1007.3787
- (85) A.V. Pan, U. Alam, arXiv e-prints arXiv:1012.1591 (2010), 1012.1591
- (86) C. Zhang, H. Zhang, S. Yuan, S. Liu, T.J. Zhang, Y.C. Sun, Research in Astronomy and Astrophysics 14, 1221-1233 (2014), 1207.4541
- (87) J. Simon, L. Verde, R. Jimenez, Phys. Rev. D71, 123001 (2005), astro-ph/0412269
- (88) M. Moresco, L. Verde, L. Pozzetti, R. Jimenez, A. Cimatti, JCAP 1207, 053 (2012), 1201.6658
- (89) A.L. Ratsimbazafy, S.I. Loubser, S. Crawford, C.M. Cress, B.A. Bassett, P. Nichol, R. C.and Väisänen, Mon. Not. Roy. Astron. Soc. 467, 3239 (2017), 1702.00418
- (90) M. Moresco, Mon. Not. Roy. Astron. Soc. 450, L16 (2015), 1503.01116
- (91) D.M. Scolnic, D.O. Jones, A. Rest, Y.C. Pan, R. Chornock, R.J. Foley, M.E. Huber, R. Kessler, G. Narayan, A.G. Riess et al., ApJ859, 101 (2018), 1710.00845
- (92) M. Vazirnia, A. Mehrabi, Phys. Rev. D104, 123530 (2021), 2107.11539
- (93) D. Huterer, M.S. Turner, Phys. Rev. D60, 081301 (1999), astro-ph/9808133
- (94) A. Mukherjee, N. Paul, H.K. Jassal, Journal of Cosmology and Astro-Particle Physics 2019, 005 (2019), 1809.08849
- (95) B.S. Haridasu, V.V. Luković, M. Moresco, N. Vittorio, Journal of Cosmology and Astro-Particle Physics 2018, 015 (2018), 1805.03595