Reflectance spectral studies of spark plasma sintered tungsten carbide pellet
Abstract
We report the first spectral reflectance of tungsten carbide (WC) as potential solar selective absorber. We developed an optical measurement system for visible to mid-infrared spectroscopy, covering the range of 0.1 to 2.5 eV, to evaluate the solar selectivity. A polycrystalline WC was prepared using spark plasma sintering method. The measured spectral reflectance of WC exhibits a low-energy plasma excitation around 0.6 eV corresponding to the cutoff energy of sunlight, consistent with ab initio calculations, thus making it preferable for the solar selective absorber. We also discuss effects of the sample quality on the spectral reflectance.
-
June 2024
Utilization of solar thermal systems is one of the key technologies that contributes to carbon neutrality through an effective use of solar energy [1, 2]. Selective absorption of sunlight is crucial characteristic for maintaining high temperatures of the absorber heated by sunlight, thereby preventing thermal radiation loss [3]. Devices aimed at achieving high performance in this regard are actively under development. The energy range for radiative heat transfer typically is considered from 0.05 eV to 4.0 eV, making a spectrometer for quantitative measurements of optical spectra within this range extremely important. Recent ab initio analysis for TiCN-based cermets, commonly used as cutting tools, has revealed that a tungsten carbide (WC) being a primary component of the cermets exhibits a low-energy plasma excitation around 0.6 eV corresponding to the cutoff energy of sunlight [4]. While WC-based superalloys are widely used in various applications [5, 6], to the best of our knowledge, the spectral reflectance has not been measured, and understanding of their optical properties is still limited [7, 8, 9, 10]. There is a report on an optical measurement of WC using FT-IR [11], but the energy range studied – 0.06 to 0.2 eV – is insufficient to detect the 0.6-eV plasma edge of WC. Experimental verification of the ab initio result is highly desirable; the ab initio calculation is predictive, but it yields results under idealized conditions, such as the absence of impurities and lattice defects. Thus, it is nontrivial that the prediction matches a measured result for real WC. The agreement between theory and experiment is a firm starting point for materials design.
In this study, we present experimental results on spectral reflectance of a sinterd WC pellet. We developed an optical measurement system ranging from visible to mid-infrared regions, covering 0.1 to 2.5 eV. In general, the spectral range of sunlight is 0.6 to 4.0 eV, and the radiation range of materials is 0.12 to 0.6 eV. Then, quantitative measurement within these range is crucial in discussing the solar selective absorption performance of materials. While many spectrometers measure only the infrared or visible regions separately, it is desirable to measure the entire range with a single device from a quantitative perspective [12].
A polycrystalline WC pellet was prepared by sintering powder samples. Typically, sintering powders with high melting points results in low material density, although such low density materials with rough surfaces can significantly degrade spectral reflectance by scattering. Hence, we prepared high density WC without pores using a spark plasma sintering (SPS) method [13, 14, 15, 16]. The resulting spectral reflectance of WC exhibits a clear low-energy plasma edge around 0.6 eV (2.0 m) just corresponding to the cutoff energy wavelength of sunlight, thus proposing WC as a promising solar selective absorber. We found that the experimental spectrum is in good quantitative agreement with ab initio calculations [4]. Additionally, we discuss effects of sample quality on spectral reflectance by comparing samples prepared using different sintering methods.
Figure 1(a) shows our developed optical measurement system: The equipment mainly consists of a light source (visible and infrared), an optical chopper, a parabolic mirror, and a spectrophotometer. The light emitted from the light source is converted into intermittent light by an optical chopper and reaches the sample placed at the focal point of the parabolic mirror. The light reflected by the sample is converted into parallel light via the parabolic mirror and reaches a focal point via the reflection at the opposite-side parabolic mirror. The light reflected by a convex mirror at the focal point is thus transported to the spectrophotometer. The light incident on the spectrophotometer is separated by a filter and a diffraction grating, and converted into voltage by a sensor, allowing the reflection intensity of the sample to be measured. In the measurements, noise is reduced by using an optical chopper and lock-in amplifier.
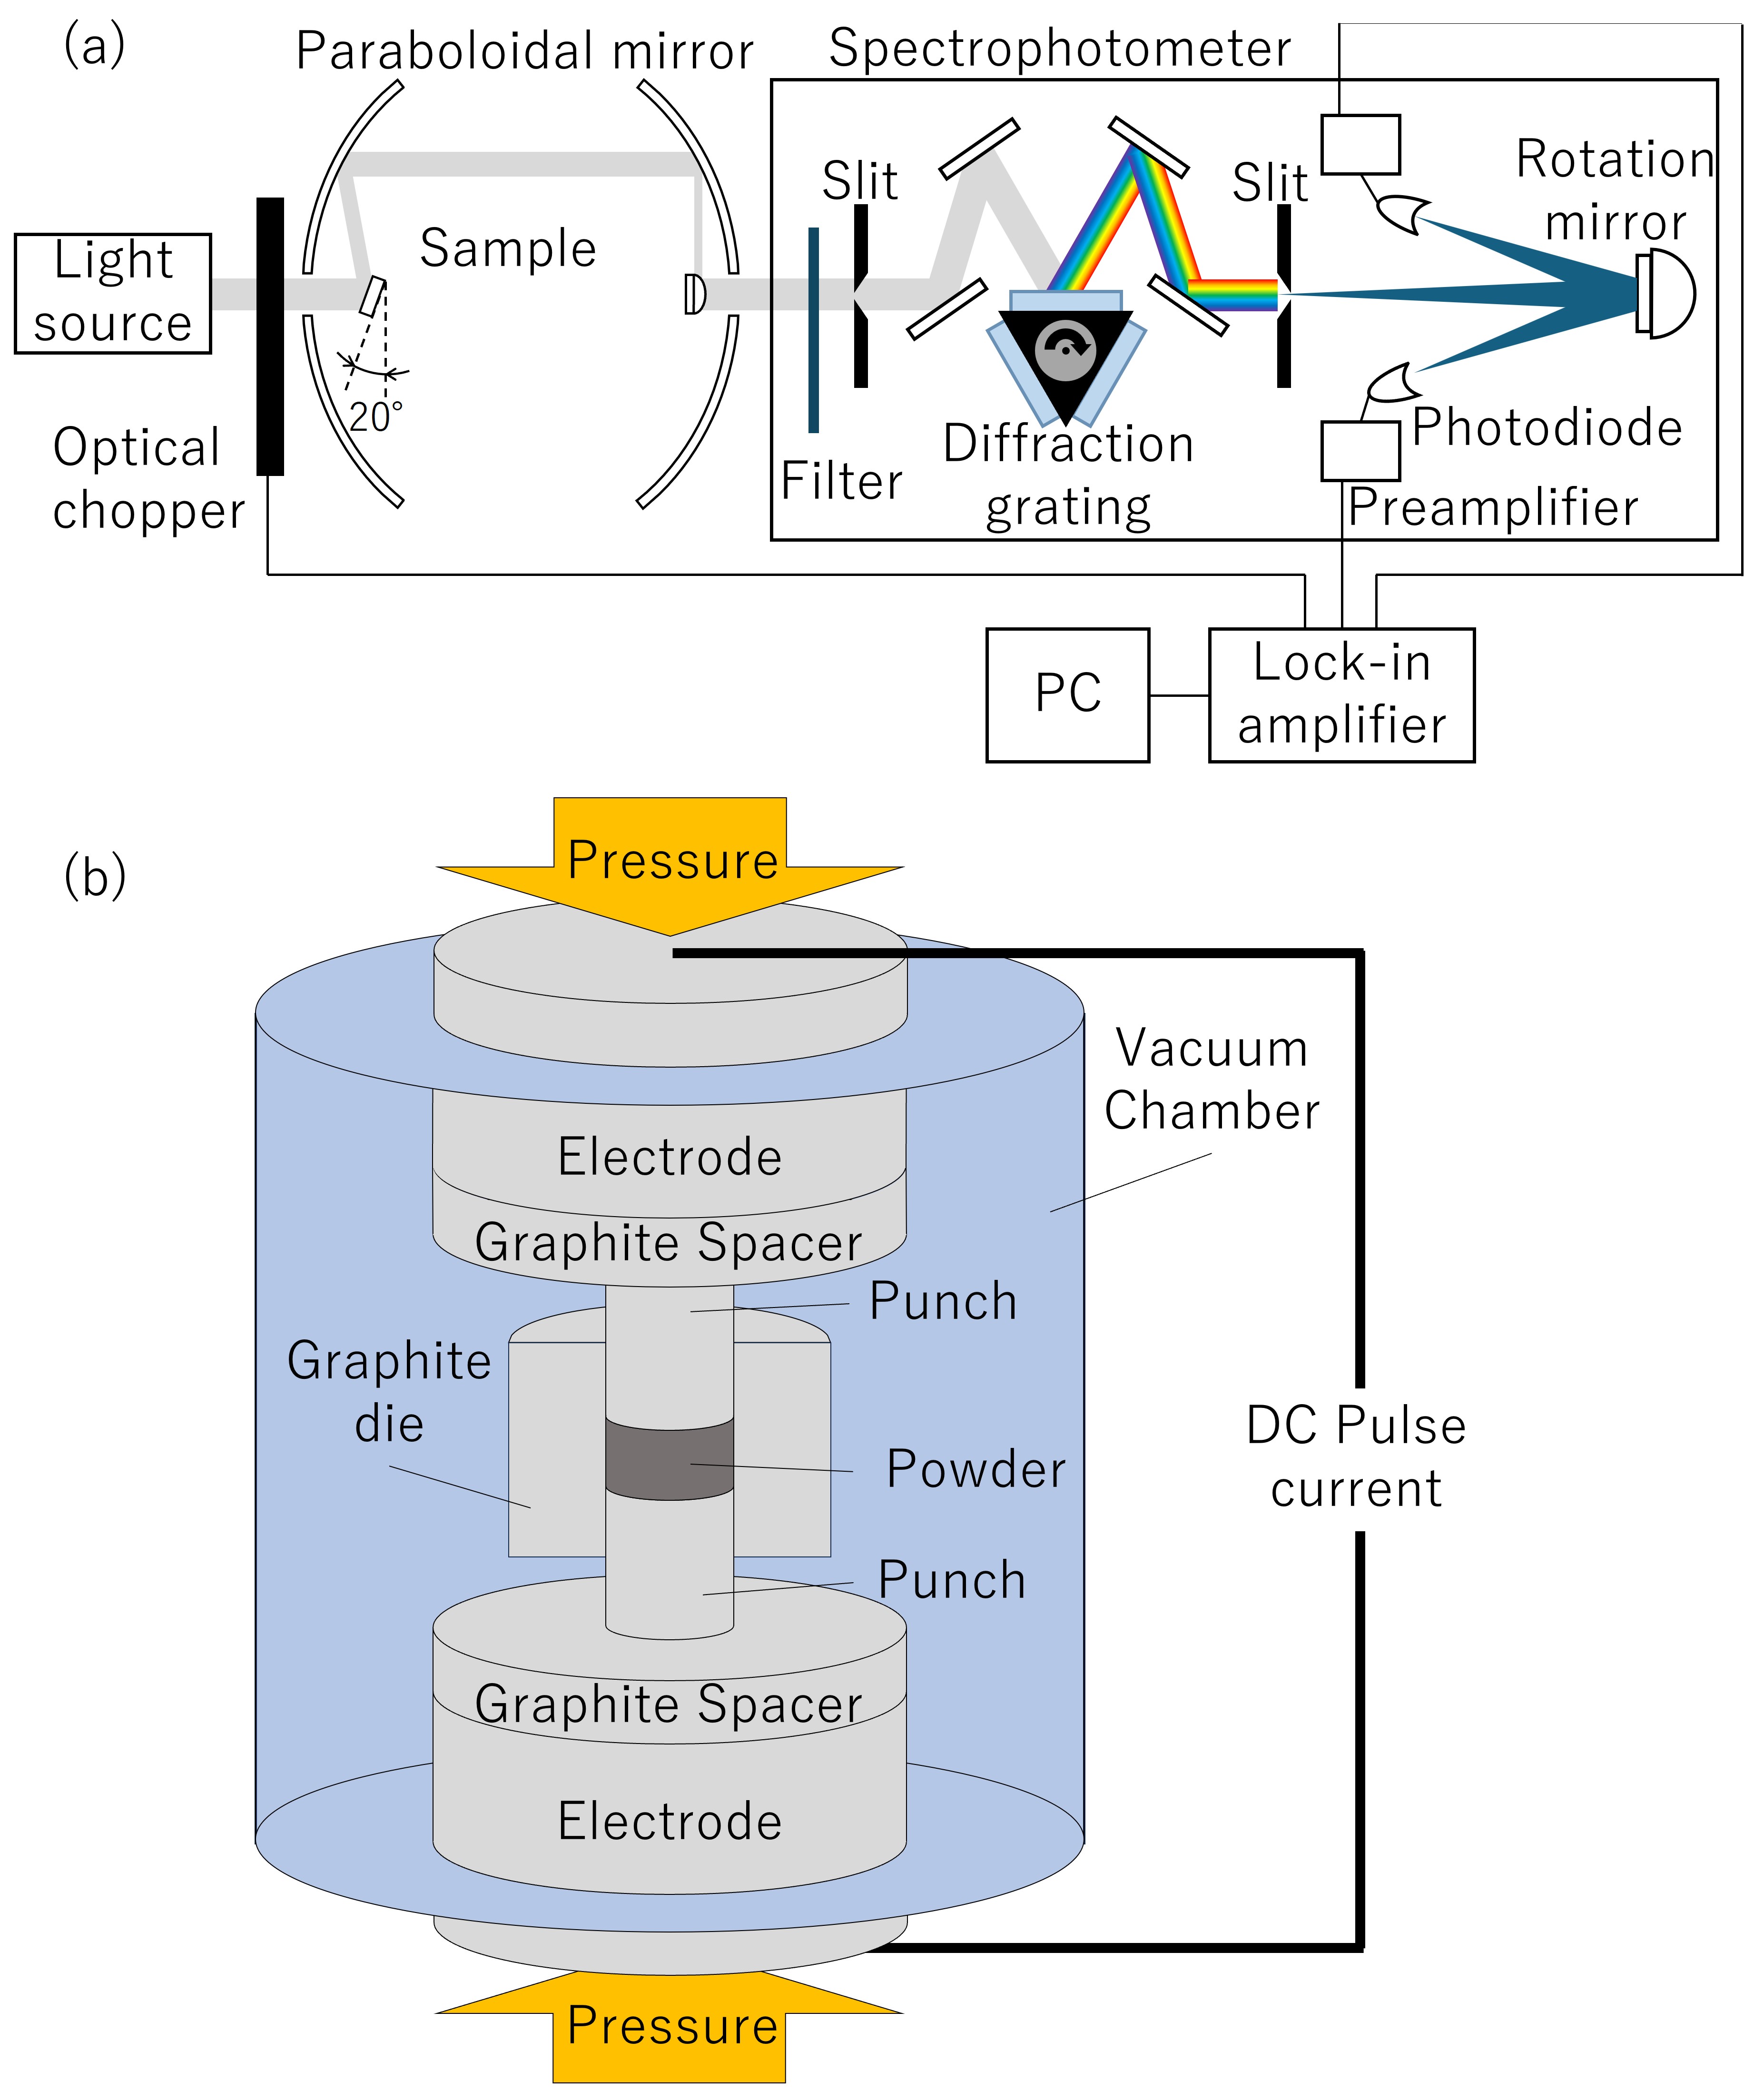
Sintering powder samples of materials with high melting points is generally difficult. The resulting sintered body contains many pores, and such pores are cause of multiple scattering of light, which significantly degrades the quantitative accuracy of the reflection spectrum. Although it is desirable to remove the pores by heating or pressurization [hot press (HP) method], there are limitations for materials with the high melting points. In the present study, we use an SPS method to synthesize samples. In the SPS, since the powder sample is sintered while passing an electric current through it, there is a self-heating effect because of the Joule heat, which is effective in reducing the pores to a certain amount.
Figure 1(b) is a schematic diagram of the SPS device (Fuji Electronic Industrial Co., Ltd.) mainly consisting of a chamber, electrodes, graphite spacers, punches, and graphite dies. By applying pressure and pulsed current heating to the powder samples, a bulk sintered body with the high density can be obtained. Setup of the SPS is as follows: Firstly, WC powders with the grain size of nearly 1.0 m provided by KOJUNDO CHEMICAL LABORATORY CO., LTD. to be sintered are placed in the region surrounded by punches and a graphite die [powder area in Fig. 1(b)]. Next, the chamber is purged with an Ar atmosphere. Finally, sintering is performed at 1700–1900 ∘C and 10 min under a maximum pressure of 50 MPa and pulse current heating and mechanically polishing and grinding are done for the surface on the sintering bodies to obtain measurement samples (polycrystalline) with a surface roughness of Ra 0.001 m or less. Setup of the HP method is as follows: Powders of the materials to be sintered are placed in the container. Then, they are pressurized at 30 MPa and sintered at a temperature of 1500-1800 ∘C. Finally, the surface of the resulting sample (polycrystalline) is polished.
We perform ab initio density functional calculations with Quantum Espresso [17] with the Perdew-Burke-Ernzerhof type [18] for the exchange-correlation functional and norm-conserving pseudopotentioals with the code ONCVPSP (Optimized Norm-Conserving Vanderbilt PSeudopotential [19]) obtained from the PseudoDojo [20]. We use a 323232 Monkhorst–Pack -mesh for the Brillouin zone integration. The kinetic energy cutoff is set to be 96 Ry for the wave functions and 384 Ry for the charge density. The Fermi energy is estimated with the Gaussian smearing techniques with the width of 0.001 Ry [21]. The crystal structures are fully optimized.
Ab initio calculations for reflectance spectra are performed with RESPACK [22, 23, 24]: The energy cutoff for the dielectric function is set to 10 Ry. The total number of bands used in the polarization calculation are set to cover unoccupied states up to 40 eV above the Fermi level. The integral over the Brillouin zone is calculated with the generalized tetrahedron technique [25] with smearing of 0.01 eV. For materials containing heavy elements (Au and WC), we consider the spin-orbit interactions [26]. The reflectance spectra are calculated from
| (1) |
with being a dielectric function in the random phase approximation based on the Lindhard formula [27].
Tests for the developed optical measurement system are performed, given in Supplemental information (SI), where we check spectral reflectances of Al, Au, and Cu in a face-centered cubic (fcc) form. We found that the measured results are in good agreements with previous studies [28] and ab initio calculations.
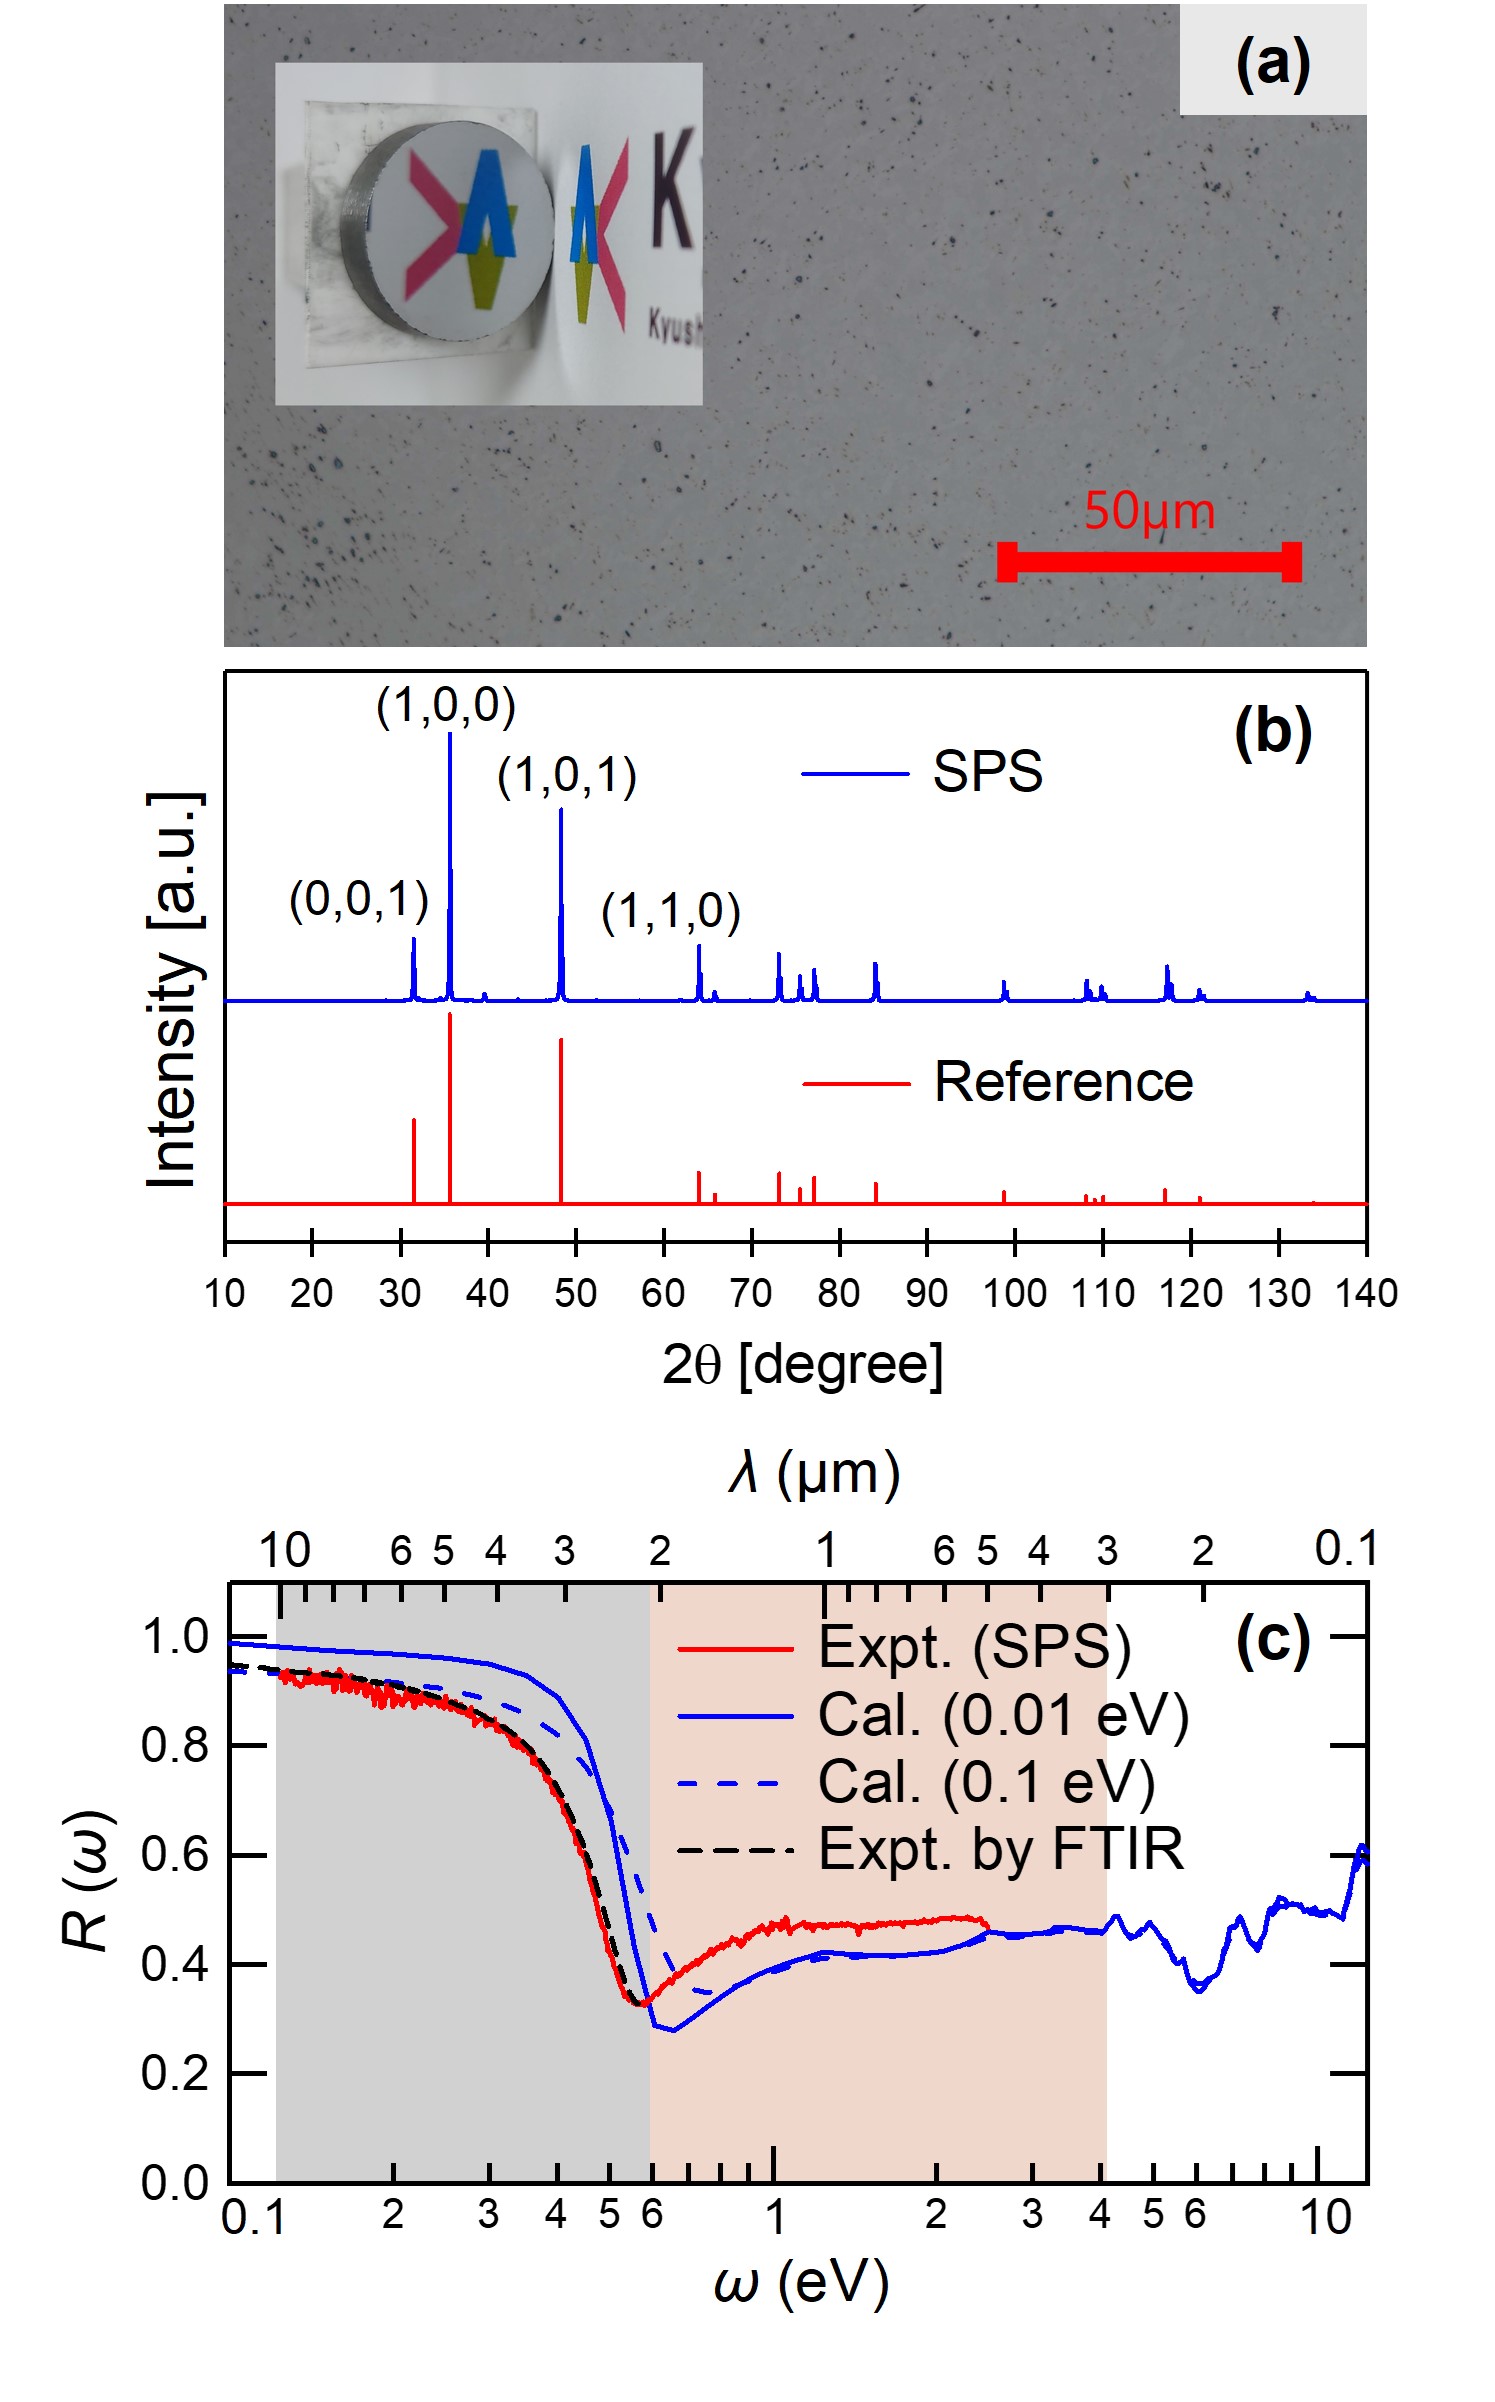
Now we consider sample and spectral properties of WC in a hexagonal closed pack (hcp) structure. Table 1 summarize sample features, where the purity is high enough and the density is 15.51 g/cm3 being close to the theoretical value is 15.63 g/cm3. Figure 2 summarizes our results for the WC; the panel (a) is a microscopic image and photo of the SPS sample after polishing. The tiny black dots are the pores on the sample surface. The panel (b) is the X-ray diffraction (XRD) patterns of the sample, where the blue and red lines are observed data and database [ICSD (Inorganic Crystal Structure Database): 77566], respectively. The panel (c) is measured reflectance spectrum (red-solid line), compared with an ab initio spectrum (blue-solid line) with smearing of 0.01 eV. The measurement range is the solar energy range, so the range of 0.1 to 2.5 eV (the wavelength of 0.5 to 10.0 m) is targeted. In the figure, the bright orange shadow represents the sunlight range (0.6 to 4.0 eV), and the gray shadow represents the principal radiation range (0.12 to 0.6 eV). We see a clear plasma edge around 0.6 eV (2.0 m) corresponding to the cutoff energy (wevelength) of the sunlight. This property is important for suppressing thermal radiation of the absorbed solar energy; the WC has an important advantage as a solar selective absorber. More carefully looking around the low-energy (0.1-0.5 eV), we see a lowering of the measured reflectance compared with the theoretical spectrum, which would be due to the multiple scattering in the pores of the surface.
To investigate this point, we calculated an ab initio reflection spectra with smearing of 0.1 eV, denoted by the blue-dashed line, where the smearing size qualitatively represents the strength of scattering by impurities. As can be seen by comparing the result with the smearing factor of 0.01 eV, increasing the smearing broadens the spectrum. Regarding the behavior in the low-energy region, the result with 0.1 eV seems to be in better agreement with experiment. The spectral reflectance up to 0.6 eV measured by FT-IR (JASCO, FT/IR-4100 with reflectance measurement attachment) is also shown in Fig. 2(c) with black-dashed line. The result is consistent with our device result. Figure of merit for photothermal conversion of WC is estimated as 0.51-0.56 (ab initio) and 0.37-0.40 (SPS). Detailed discussions are given in SI. We note that there are reports on the synthesis of single crystals of WC [7, 8, 9, 10]. This would be important for improving the quantitative accuracy of the spectral property, which is left to be explored.
| WC (hcp) | TiC (fcc) | TiN (fcc) | |||||
|---|---|---|---|---|---|---|---|
| SPS | HP | SPS | HP | SPS | |||
| Purity | 99.996 | 99.650 | 99.651 | 99.554 | 99.898 | ||
| Density | 15.51 | 4.43 | 4.86 | 4.63 | 5.15 | ||
| 3143 [29] | 3203 [30] | 3338 [30] | |||||
We now discuss effects of the sintered-body quality on spectral reflectance. For this purpose, we prepare two samples: One is the SPS sample, and the other is the HP one. We consider TiC and TiN in an fcc structure, which are also main components of the TiCN-based cermet and good solar selective absorvers candidates [31]. Similarly to WC, these have rather high melting points in Table 1. From here, we write TiC and TiN samples synthesized with the SPS method as TiC (SPS) and TiN (SPS), and samples with the HP method as TiC (HP) and TiN (HP). Table 1 summarizes the sample features. The density of TiC (HP) is 89.9% of the theoretical density, and that of TiC (SPS) is 98.6%. Similarly, the density of TiN (HP) is 85.3% of the theoretical density, and that of TiN (SPS) is 94.8%. Thus, it is clear that the SPS method can generate sintered bodies with few pores. XRD data and lattice parameters of the TiC and TiN samples are shown in SI.
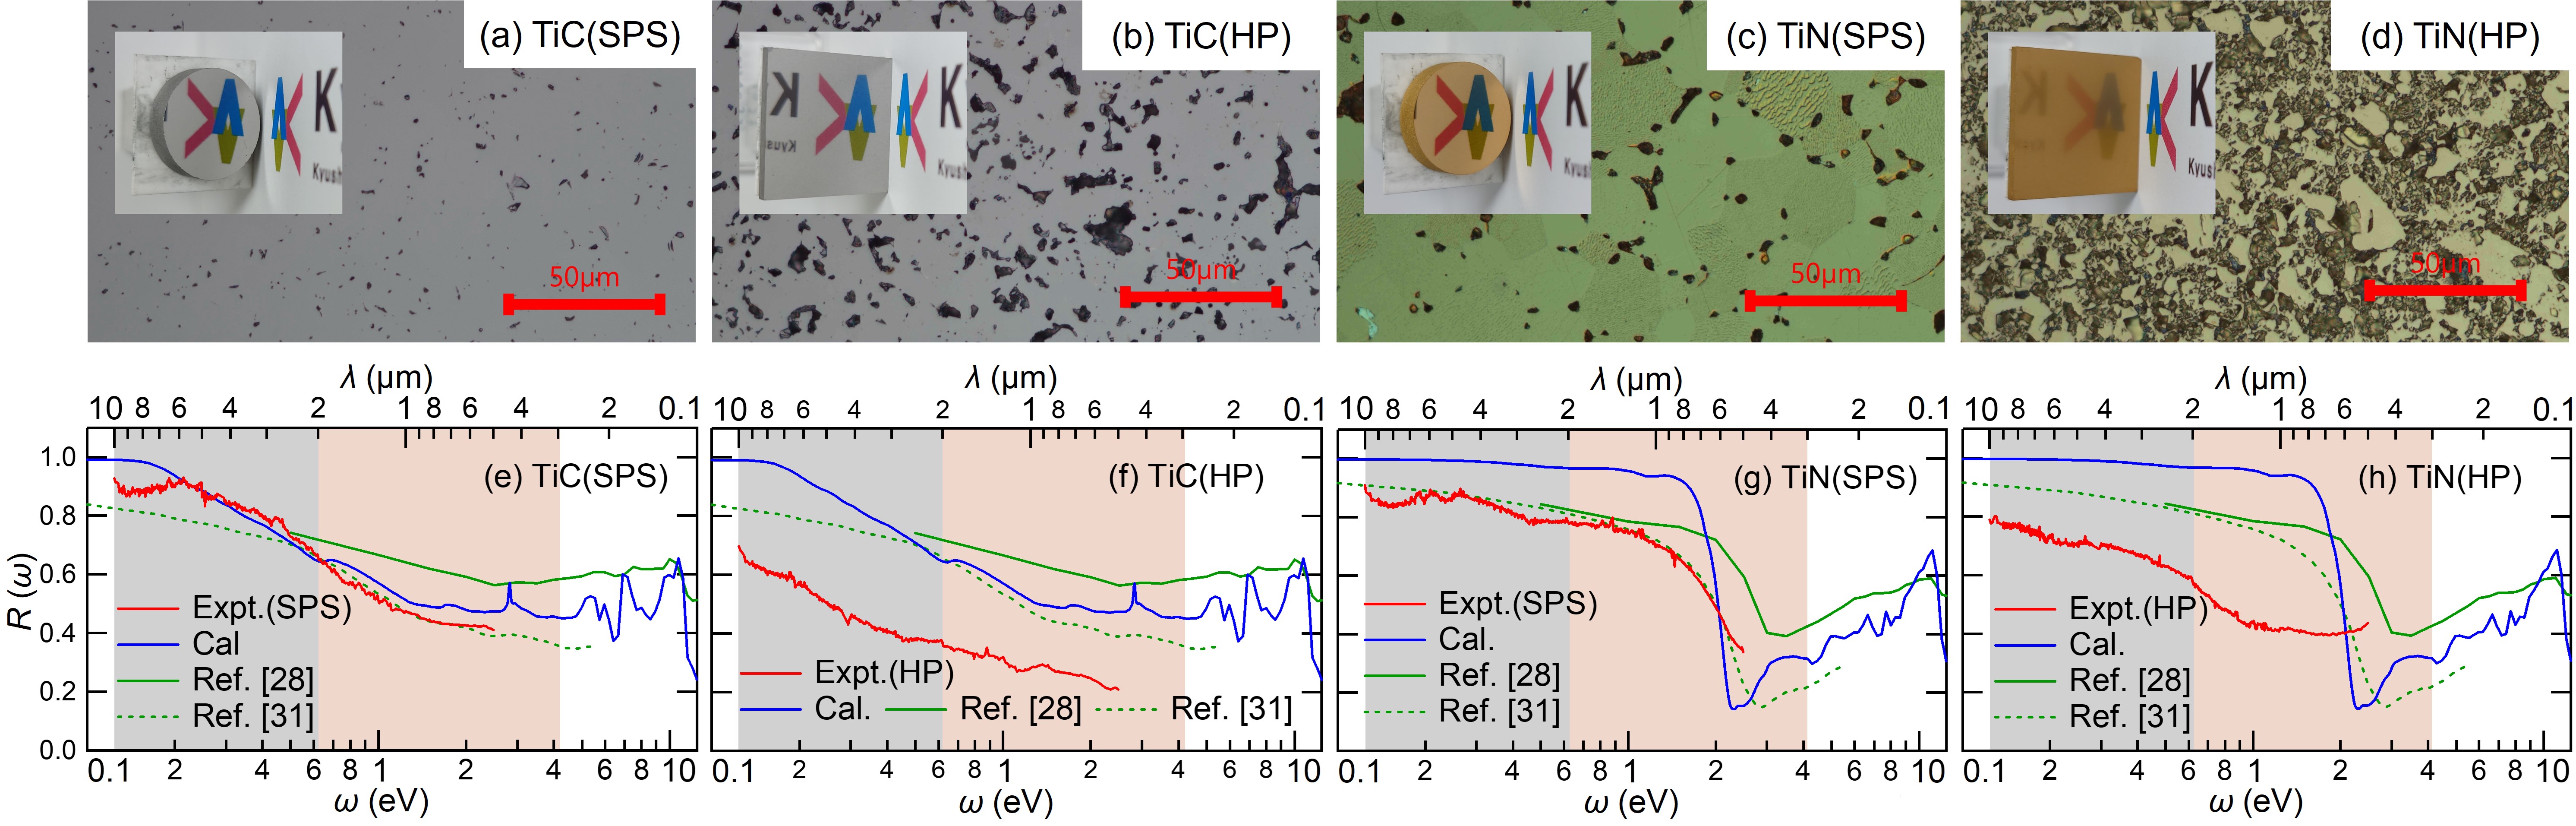
The upper part of Fig. 3 compares microscopic images of the SPS and HP samples, where the panels (a) and (b) are the images of TiC (SPS) and TiC (HP), respectively, and (c) and (d) are the results for TiN (SPS) and TiN (HP), respectively. The SPS samples clearly have smaller pores, being consistent with the density data of Table 1. However, the SPS sample still includes many small pores and therefore the reflection intensity would be quantitatively affected.
The lower part of Fig. 3 compares measured reflectance spectra of (e) TiC (SPS), (f) TiC (HP), (g) TiN (SPS), and (h) TiN (HP). Red lines are our spectra, green solid and dashed lines are other experimental spectra of films [28, 31], and blue lines are ab initio spectra. The agreement between the SPS and theoretical results is reasonable, but, in the low energy region (0.1-2 eV), the experimental reflectance is smaller than the ab initio one. From a comparison between the SPS and HP samples, we see a clear difference. As can be seen from the microscopic images in Fig. 3, the pore size is rather large in the HP sample compared to the SPS sample, resulting in a significant decrease in reflectance due to the multiple scattering in the HP sample. More detailed analyses for the porosity and its effect on the spectral reflectance are given in SI.
In the present study, we have reported on the first experimental reflectance spectrum of tungsten carbide WC. We have developed a measurement system for the reflectance spectrum in visible to mid-infrared region. The microcrystalline WC sample has been prepared by sintering the powders with the SPS technique. The resulting reflection spectrum of WC exhibits a sharp low-energy plasma edge around eV (2.0 m) corresponding to the cutoff energy of the sunlight, thus suppressing the thermal radiation and proving it a highly promising ingredient of the solar selective absorber. The measured spectrum is in good quantitative agreement with ab initio calculations.
In addition, we have examined the effect of the sintered-sample quality on the reflectance spectrum by comparing the samples synthesized by the SPS and HP method. Effectiveness of the SPS method prior to the HP method has been proved; the HP sample exhibits a rather small reflectance intensity, while the SPS can well reduce the pore size and density in the sample, resulting in a reasonable agreement with the previous experimental and ab initio spectra.
Acknowlegements
The authors acknowledge MARUWAGIKEN Co., Ltd. for mechanically polishing of the HP samples. This research was supported by JSPS KAKENHI Grant Numbers JP19K03673, JP22H01183, JP23H01353, and JP23H01126.
References
- [1] L. Shi, X. Wang, Y. Hu, Y. He, and Y. Yan, Applied Thermal Engineering 179, 115691 (2020).
- [2] A. Kohiyama et. al., Applied Physics Express 9, 112302 (2016).
- [3] F. Cao, K. McEnaney, G. Chen, and Z. Ren, Energy Environ. Sci. 7, 1615 (2014).
- [4] S. Hayakawa, T. Chono, K. Watanabe, S. Kawano, K. Nakamura, and K. Miyazaki, Sci. Rep. 13, 9407 (2023).
- [5] A. Shemi, A. Magumise, S. Ndlovu, and N. Sacks, Minerals Engineering 122, 195 (2018).
- [6] J. García, V. Collado Ciprés, A. Blomqvist, and B. Kaplan, International Journal of Refractory Metals and Hard Materials 80, 40 (2019).
- [7] T. Lundstrom, Journal of the Less Common Metals 100, 215 (1984).
- [8] J. B. He, D. Chen, W. L. Zhu, S. Zhang, L. X. Zhao, Z. A. Ren, and G. F. Chen, Phys. Rev. B 95, 195165 (2017).
- [9] J.-Z. Ma et. al., Nature Physics 14, 349 (2018).
- [10] X.-y. Hou et. al., Phys. Rev. B 100, 235109 (2019).
- [11] Hoffmann, P and Galindo, H and Zambrano, G and Rincón, C and Prieto, P, Materials Characterization 50, 255-259 (2003).
- [12] H. Wakabayashi et. al., Measurement Science and Technology 12, 2113 (2001).
- [13] M. Tokita, Materials science forum 308 (Trans Tech Publ, 1999) 83.
- [14] Haibin Zhang et. al., Science and Technology of Advanced Materials 12, 055003 (2011).
- [15] Jiang, DongTao et. al., Journal of the American Ceramic Society 91, 151-154 (2008).
- [16] Roberta Licheri et. al., Acta Astronautica 201, 164-171 (2022).
- [17] P. Giannozzi et. al., J. Chem. Phys. 152, 154105 (2020).
- [18] J. P. Perdew, K. Burke, and M. Ernzerhof, Phys. Rev. Lett. 77, 3865 (1996).
- [19] D. R. Hamann, Phys. Rev. B 88, 085117 (2013).
- [20] M. van Setten, M. Giantomassi, E. Bousquet, M. Verstraete, D. Hamann, X. Gonze, and G.-M. Rignanese, Comput. Phys. Commun. 226, 39 (2018).
- [21] M. Methfessel and A. T. Paxton, Phys. Rev. B 40, 3616 (1989).
- [22] K. Nakamura, Y. Yoshimoto, Y. Nohara, and M. Imada, J. Phys. Soc. Jpn 79, 123708 (2010).
- [23] K. Nakamura, Y. Nohara, Y. Yosimoto, and Y. Nomura, Phys. Rev. B 93, 085124 (2016).
- [24] K. Nakamura, Y. Yoshimoto, Y. Nomura, T. Tadano, M. Kawamura, T. Kosugi, K. Yoshimi, T. Misawa, and Y. Motoyama, Comput. Phys. Commun. 261, 107781 (2021).
- [25] T. Fujiwara, S. Yamamoto, and Y. Ishii, J. Phys. Soc. Jpn 72, 777 (2003).
- [26] M. Charlebois et. al., Phys. Rev. B 104, 075153 (2021).
- [27] C. Ambrosch-Draxl and J. O. Sofo, Comput. Phys. Commun. 175, 1 (2006).
- [28] J. Pfluger and J. Fink, Handbook of Optical Constants of Solids, edited by E. D. Palik (Academic Press, Burlington, 1997)
- [29] Pierson, Hugh O, Handbook of refractory carbides & nitrides: properties, characteristics, processing and applications (William Andrew, 1996).
- [30] I. Sigalas, R. J. Caveney, and M. W. Bailey, Handbook of Ceramic Hard Materials (John Wiley & Sons, Ltd, 2000)
- [31] L. Roux, J. Hanus, J. Francois, and M. Sigrist, Solar Energy Materials 7, 299 (1982).