Revealing temperature evolution of the Dirac band in ZrTe5 via magneto-infrared spectroscopy
Abstract
We report the temperature evolution of the Dirac band in semiconducting zirconium pentatelluride (ZrTe5) using magneto-infrared spectroscopy. We find that the band gap is temperature independent at low temperatures and increases with temperature at elevated temperatures. Although such an observation seems to support a weak topological insulator phase at all temperatures and defy the previously reported topological phase transition (TPT) at an intermediate temperature in ZrTe5, we show that it is also possible to explain the observation by considering the effect of conduction-valence band mixing and band inversion with a strong topological insulator phase at low temperatures. Our work provides an alternative picture of the band gap evolution across TPT.
ZrTe5 is a van der Waals material with the layer stacking direction along the -axis of the crystal (Figure 1a). The recent interest in ZrTe5 originates from the theoretical prediction of a room-temperature quantum spin Hall insulator phase in its monolayer limit and a three-dimensional topological insulator (TI) phase in its bulk form Weng et al. (2014). The prediction has sparked intensive experimental investigations into both the electronic and topological properties of ZrTe5 Li et al. (2016a); Liang et al. (2018); Liu et al. (2021); Gourgout et al. (2022); Lozano et al. (2022); Tang et al. (2019); Galeski et al. (2021); Wei et al. (2022); Tian et al. (2021); Ehmcke et al. (2021); Chen et al. (2015a); Wu et al. (2016); Li et al. (2016b); Manzoni et al. (2016); Chen et al. (2017); Jiang et al. (2017a); Zheng et al. (2017); Zhang et al. (2021); Zhu et al. (2022). However, different topological phases, i.e., weak/strong TIs (WTI/STI) and Dirac/Weyl semimetals, have all been reported in ZrTe5 from different experiments Li et al. (2016a); Liang et al. (2018); Chen et al. (2015a); Wu et al. (2016); Li et al. (2016b); Manzoni et al. (2016); Chen et al. (2017); Jiang et al. (2017a); Zheng et al. (2017); Zhang et al. (2021); Zhu et al. (2022). Such discrepancy may result from the sensitive dependence of the topological phase on the lattice constants Weng et al. (2014); Fan et al. (2017). In addition, many theoretical calculations have predicted that volume expansion can result in a topological phase transition (TPT) in ZrTe5 Fan et al. (2017); Weng et al. (2014); Vaswani et al. (2020); Zhang et al. (2021), as schematically illustrated in Figure 1b. These results invite controllable measurements across the TPT to reconcile the experimental observations.
While several different techniques exist to manipulate the lattice constants in materials (such as using strain Mutch et al. (2019) or ultrafast laser Vaswani et al. (2020); Konstantinova et al. (2020)), temperature remains the most convenient method, and it has been used to explore the topological phases in ZrTe5 Manzoni et al. (2016); Zhang et al. (2017); Xu et al. (2018). Unfortunately, in these experiments, the band gap behavior across the TPT remains elusive. For example, high-resolution angle-resolved photoemission spectroscopy measurements find that the band gap never closes in the temperature range of K Zhang et al. (2017); Manzoni et al. (2017); Xiong et al. (2017); Song et al. (2022); Zhang et al. (2021), while a zero-field infrared (IR) optical conductivity measurement reveals gap closure at an intermediate temperature Xu et al. (2018). In the latter case, the band gap evolution has been further connected to an anomalous resistance peak in at a critical temperature Okada et al. (1980). However, such a connection is still under debate as it is not consistently reported between different experimental techniques Tian et al. (2019); Zhang et al. (2017). In addition, the presence of resistivity anomaly in ZrTe5 can be eliminated by using the flux growth method, as it can effectively reduce the amount of Te vacancies in the material Shahi et al. (2018). Even though there is a growing interest in flux-grown samples for their better quality and intrinsic behavior Shahi et al. (2018); Mutch et al. (2019); Wang et al. (2022); Sun et al. (2020); Wang et al. (2018), the temperature-dependent band gap study is still lacking.
In this work, we examine the band structure evolution in temperature of the molten Te-flux grown ZrTe5 single crystals using magneto-IR spectroscopy. As discussed earlier, the flux growth method helps eliminate the effect of resistivity anomaly. More importantly, magneto-IR spectroscopy can directly probe the band structures of different carriers with high accuracy by tracing their Landau level (LL) transitions. It helps alleviate the complications caused by Fermi level shifting and other thermally excited carriers. By tracing the Dirac-like band in ZrTe5 up to 175 K, we observe a nonlinear monotonic increase in band gap with increasing temperature. Even though it is possible to explain such a behavior with a no TPT scenario, we also propose a mechanism to reconcile this observation with our prior results that are compatible with the existence of a TPT. We argue that this behavior is caused by the band inversion and the associated orbital mixing effect. Our work sheds light on the importance of the conduction-valence band mixing in describing the TPT.
The Te-flux growth of ZrTe5 single crystals is described in our previous work Jiang et al. (2020). Figure 1d shows the normalized temperature-dependent resistance, , of our sample, where no visible anomalous resistance peak is observed except at very low temperatures as reported in Refs. Shahi et al. (2018); Mutch et al. (2019); Wang et al. (2022); Sun et al. (2020); Wang et al. (2018). X-ray powder diffraction measurements also find that the thermal expansion of the lattice is smooth in the temperature range of K (Figure 1c). No structure change is spotted. For magneto-IR measurements, we repeatedly exfoliate a bulk crystal over an IR-transparent Scotch tape to achieve maximum coverage of the tape. The sample/tape composite is then placed on a metal aperture with a heater wrapped around it and a temperature sensor on the backside. After loading the sample into the magnet (in Faraday geometry), the transmission spectra are taken with a Fourier transform IR spectrometer, where the transmitted IR intensity from a Globar light source is detected by a Si bolometer shortly behind the sample. The temperature range of the sample is varied from 6 K to 175 K.
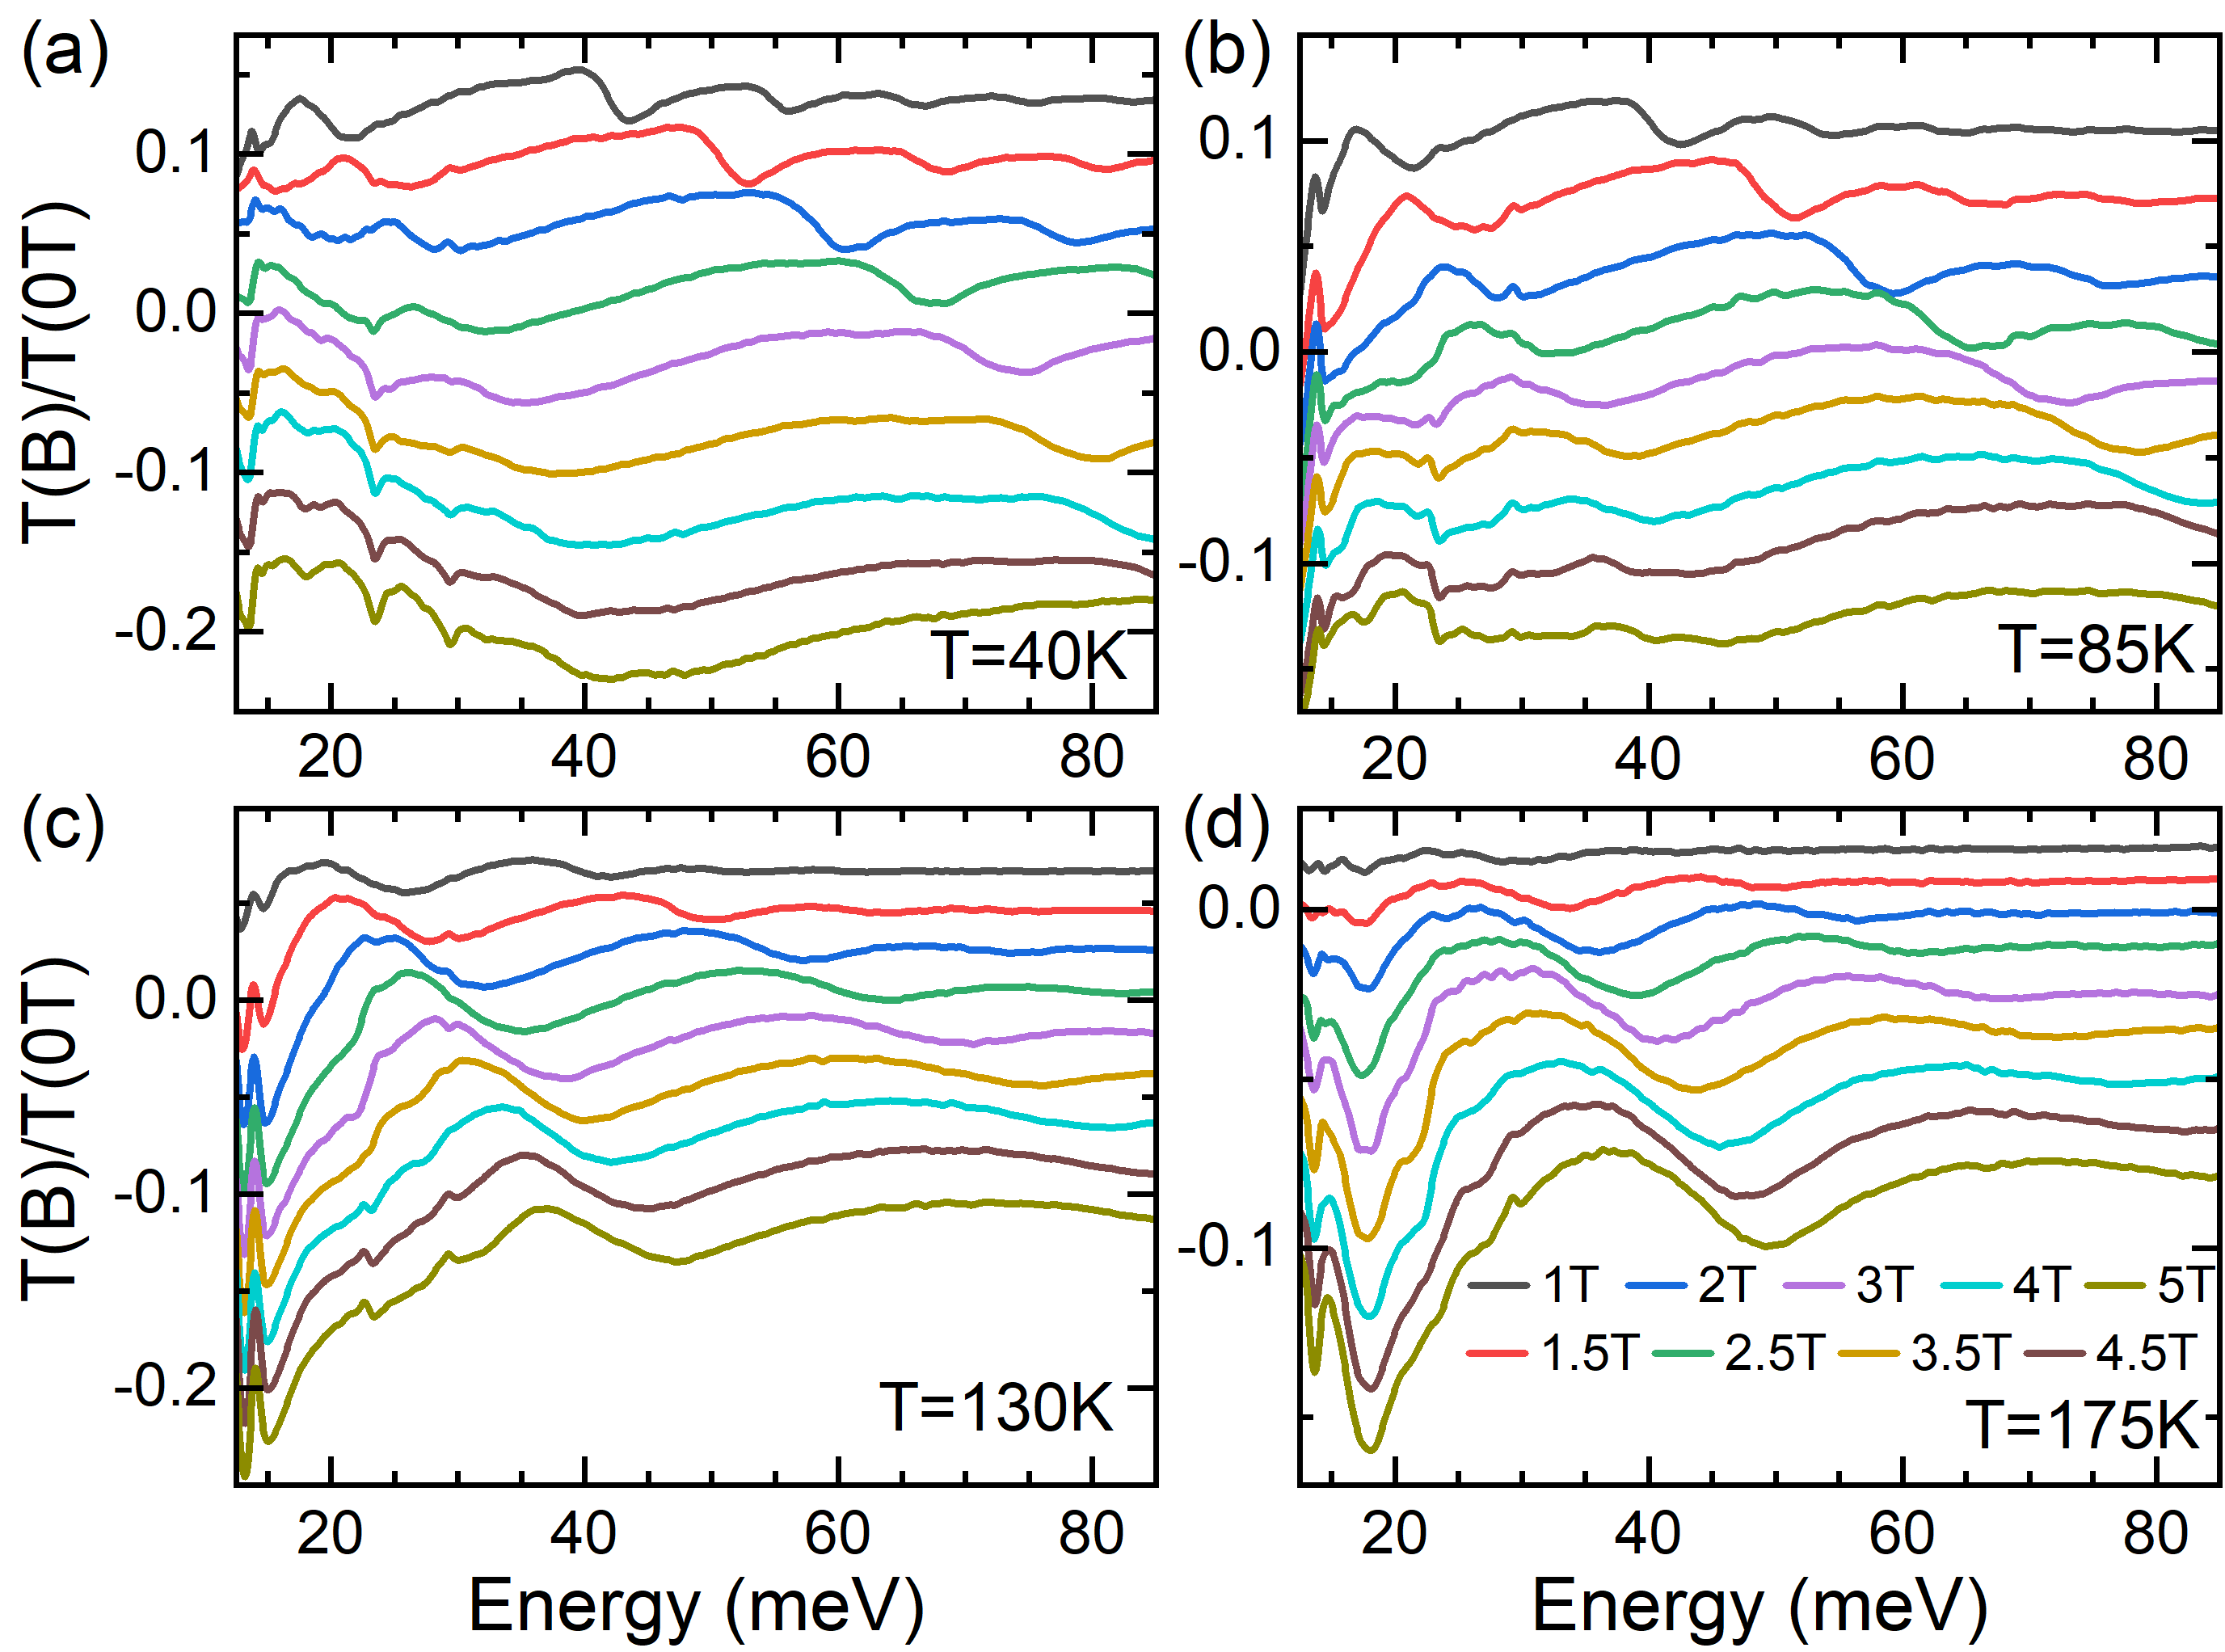
Figure 2a shows the magnetic field dependence of the normalized magneto-transmission spectra (i.e., ) of ZrTe5 at the lowest temperature of 6 K. A series of strong dips can be observed once the magnetic field is applied, which blueshifts with increasing the field. It has been well established that these absorption dips arise from the optical transitions between the LLs in ZrTe5, and one can employ the LL index to label the allowed interband transitions following Refs. [Jiang et al., 2017a, 2020; Chen et al., 2015b, 2017; Martino et al., 2019]. Other prominent features in Figure 2a include a weaker set of LL transitions labeled by the asterisk symbol (, to be discussed later) and sharp dips between 20-40 meV originating from the IR-active phonon modes Chen et al. (2015a); Xu et al. (2018). The energies of the phonon modes do not change as a function of magnetic field, and they do not contribute to the electronic structure of ZrTe5 studied in this work.
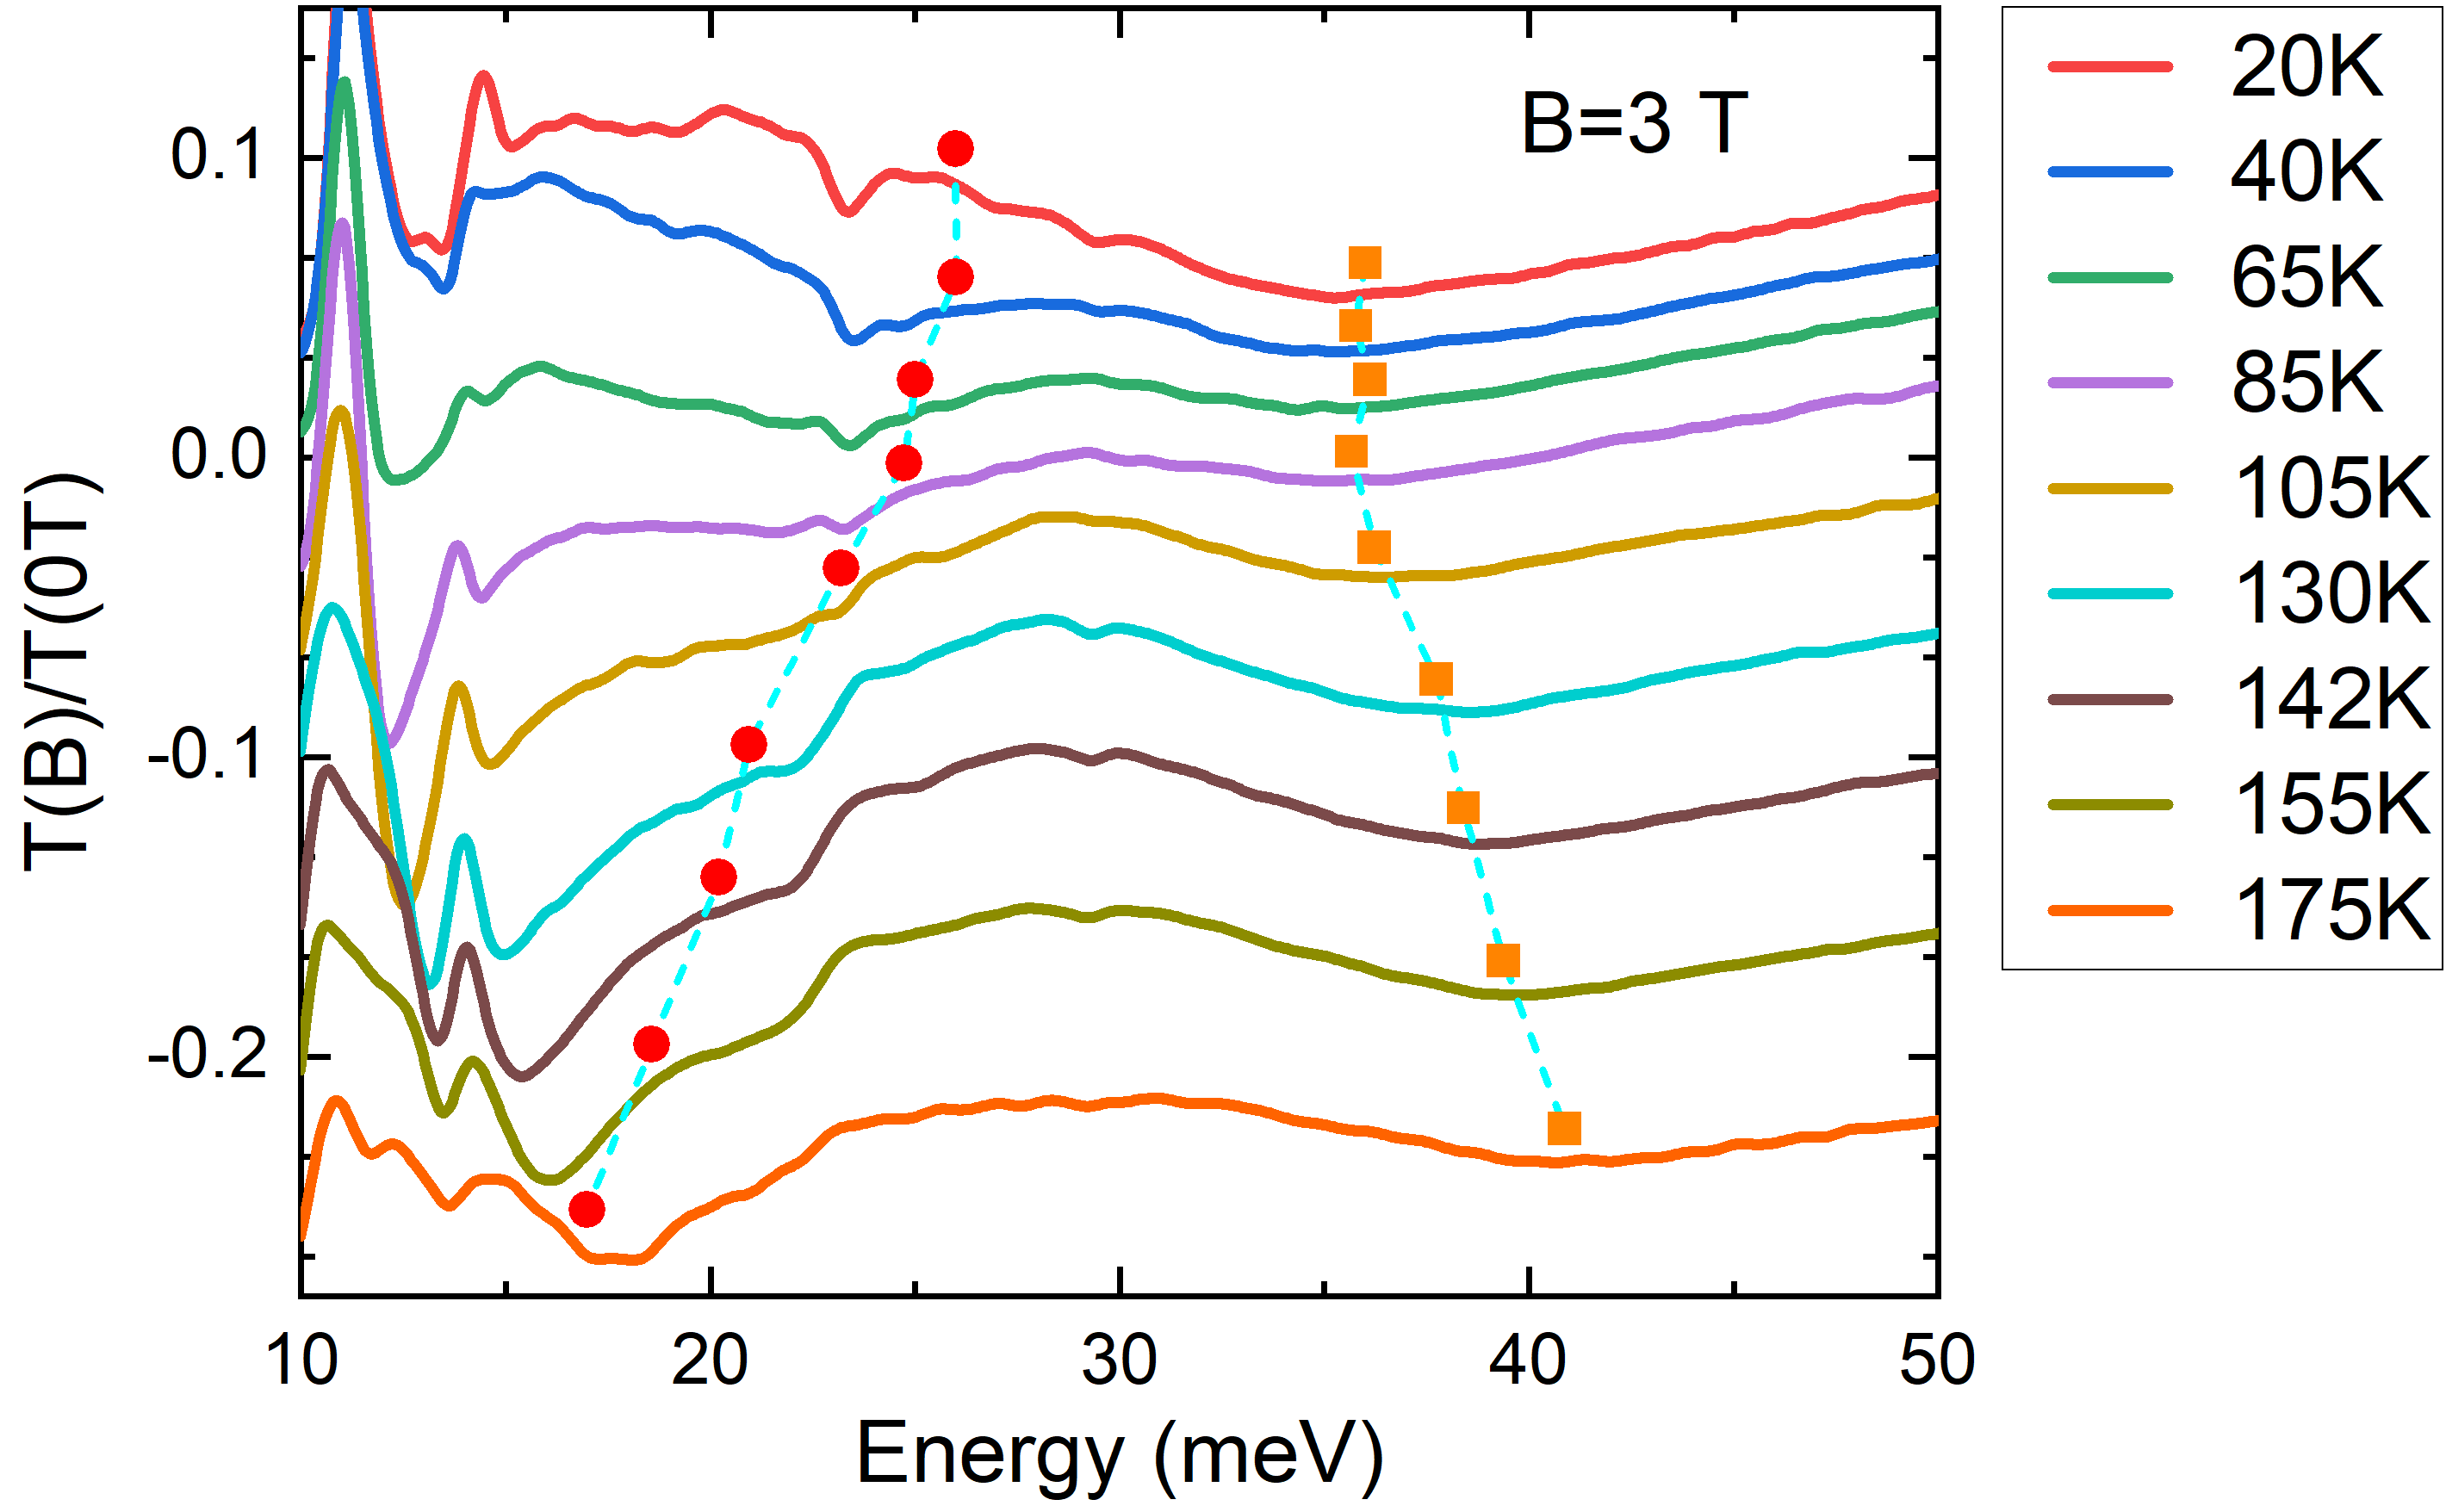
Figure 2b shows a typical temperature evolution of the normalized magneto-transmission spectra, , at 1.5 T and from 6 K to 175 K (more temperature dependence data can be found in Figure 5 in Appendix). Here, the transmission spectra are normalized to the zero-field spectra at each temperature to avoid background complications from the temperature change. As temperature increases, the LL transitions start to smear out or weaken due to the thermal broadening effect. At the highest temperature (175 K), only the LL transitions remain visible. The temperature evolution of the LL transitions exhibits different behavior for different modes. With increasing temperature, the mode shifts toward higher energy, while the modes shift toward lower energy within the measurement range. In addition, a new mode emerges at elevated temperatures and forms a well-defined dip at 17 meV at the highest temperature. Based on the energy of this mode, one can attribute it to the cyclotron resonance (CR) mode , given that the sample is hole-doped in the measurement temperature range Shahi et al. (2018). In Figure 2c, we present the false color map of the temperature dependence of the normalized transmission at 3 T, where the CR and modes are more prominent (the corresponding raw spectra are presented in Figure 6 in Appendix). One can clearly see that these two modes separate from each other at around 60 K.
From the magneto-IR spectroscopy data (Figure 2), one can also extract information about the mobility () and carrier density in our samples. The formation of distinct LLs requires the semiclassical condition to be satisfied, which sets the lower bound in mobility estimation Poumirol et al. (2013). For all the temperatures studied in this work, the LL transitions can be identified at as low as 1 T. Hence, cm2V-1s-1 up to K. Furthermore, even though the emergence of the CR mode implies an increase in carrier density at elevated temperatures, the observation of the transition in Figure 2 suggests that our samples enter the quantum limits at T for the entire temperature range and sets the upper limit for the carrier density. Therefore, we can deduce that the Dirac band in our sample remains a very low carrier density within the measurement temperature range. Our observation is in contrast to the density extracted from the reported temperature-dependent Hall measurements, which increases about two orders of magnitudes with increasing temperature Shahi et al. (2018). To reconcile these facts, we emphasize that electronic transport measurement probes the contributions from all bands crossing the Fermi level whereas magneto-IR measurement focuses on a specific band. The discrepancy in carrier density suggests that the dominant contribution in thermally activated carriers in the Hall measurements is from other trivial bands in ZrTe5, while the Dirac electrons retain its high mobility and low density up to 175 K. We note that our work is the first to show a clear LL formation at such elevated temperatures in ZrTe5 using magneto-optics. As a comparison, magneto-transport measurement can only probe LLs up to around 20 K Yu et al. (2016); Wang et al. (2021). These results suggest that ZrTe5 holds great promise in optoelectronics applications with Dirac electrons and could be further manipulated by magnetic fields.
Next, we turn to a quantitative analysis of the band structure evolution in ZrTe5 as a function of temperature. We first investigate the strong interband LL transitions labeled by integer in Figure 2a,b. It has been well established that at low temperatures, these transitions can be described by a simple massive Dirac fermion model Jiang et al. (2017a, 2020); Martino et al. (2019); Chen et al. (2015b), and the LL energies read
| (1) |
with is the band index, the electron charge, the reduced Planck’s constant, and the Dirac mass. The allowed LL transitions satisfy the conventional selection rule , and their transition energies can be calculated accordingly. From eq. (1), one can see that the change in band gap () mostly impacts the energy of the LL transition, and the effect quickly becomes unnoticeable for a higher as the dominant energy scale for higher LL transitions is determined by . For ZrTe5, we have meV and meV at T and K. Therefore, we will consider the temperature dependence of both and to understand the different temperature evolution observed in Figure 2b,c for different modes. Specifically, we reveal that the blueshift of the mode with increasing temperature is dominated by , while the redshift of the modes is due to . The temperature dependence of the mode reflects the competition between the two effects.
We then extract the energies of interband LL transitions at selected magnetic fields and plot the magnetic field dependence of each mode at specific temperatures. Figure 3a-c shows the extracted data (symbols) at three different temperatures as well as the fits (solid lines) using eq. (1). Excellent agreement between the experiment and model calculation is achieved throughout the measured temperature range, verifying the assignment of LL transitions. Figure 3d illustrates the calculated Landau fan diagram at K and the corresponding LL transitions following the color code in Figure 3a-c.
Figure 4a summarizes the temperature dependence of the extracted band gaps and Fermi velocities. We find that remains almost unchanged up to around 60 K, and further increase in temperature leads to an increase in and an almost concurrent decrease in . Using these parameters, we can confirm that the origin of the additional energy mode labeled by “CR” in Figure 2b is indeed the cyclotron resonance mode . From eq. (1), the energy difference between the interband transition and the CR should be equal to the band gap. At low temperatures, the band gap is small, and the CR and interband transitions merge together. As the band gap increases at elevated temperatures, the distance between the two modes starts to increase, and therefore the CR mode is observed. We note that although it is difficult to accurately extract the CR energy due to the lineshape distortion caused by nearby phonon modes, one can instead calculate the CR and transition energies at T, using the extracted band parameters from the model fitting of the interband LL transitions. The calculation results are shown as symbols in Figure 2c (and also in Figure 6 in Appendix). As one can see, the calculated energy positions correctly capture the trend of the optical weight change as a function of temperature, further confirming the origin of the CR mode and the temperature evolution of the band gap and Fermi velocity.
Having firmly established the temperature dependence of the band parameters in ZrTe5, we can now discuss its implication in TPT. For the band gap, theory predicts that as temperature increases, the volume expansion may lead to two possible scenarios, depending on the topological phase at the base temperature Fan et al. (2017). For scenario 1, if ZrTe5 is a WTI at the base temperature, is expected to increase monotonically with temperature, and no TPT exists in ZrTe5 (Figure 4b). For scenario 2, if ZrTe5 is a STI at the base temperature, is expected to first decrease with increasing temperature to zero gap and then increase when it crosses the TPT from the STI to the WTI phase.
Based on the theoretical prediction, scenario 1 (i.e., no TPT) seems to offer a possible explanation of our experimental data as the band gap evolution in temperature shows a monotonic increase with no sign of closure. Consequently, one can assign a WTI phase to ZrTe5 throughout the entire temperature range and even up to room temperature, as further increasing the temperature will continue to expand the volume. Such an interpretation is consistent with the literature reporting a WTI phase at low temperatures Zhang et al. (2021); Xiong et al. (2017); Zhu et al. (2022)
However, we should also emphasize that there are other works reporting a STI phase in ZrTe5 Manzoni et al. (2016); Chen et al. (2017); Manzoni et al. (2017); Xu et al. (2018); Mutch et al. (2019), and scenario 2 remains possible if one can reconcile the discrepancy between the temperature-independent at low temperatures with the theoretical prediction. Here, we propose a possible mechanism based on our recent discovery of a second band gap in the vicinity of point in the STI phase of ZrTe5 Jiang et al. (2020); Wang et al. (2021). In Figure 4c, we schematically depict the temperature evolution of the band structure across the TPT. At the elevated temperature above the TPT, the system is in the WTI phase, and the band structure takes the form of a conventional massive Dirac electron with only one extremum at point Mutch et al. (2019); Fan et al. (2017); Vaswani et al. (2020). The incident IR light thus probes the band gap at point. Once the temperature drops to the TPT temperature, the conduction and valence bands come close enough so that the orbital mixing effect starts to play a role and leads to an anticrossing gap of finite size Krizman et al. (2018); Wojek et al. (2014). When the temperature is further reduced, the system is in the STI phase. Due to the competition between the band inversion and the linear dispersion component, the band structure develops a second band gap in the vicinity of point along the layer stacking direction ( direction) Jiang et al. (2020); Wang et al. (2021); Morice et al. (2020); Weng et al. (2014). Such a band structure resembles that in a gapped Weyl node system, and the size of the second band gap is determined by the strength of hybridization between the conduction and valence bands in an inverted band structure Jiang et al. (2017b). Our previous calculation shows that the joint density of states across the second band gap could dominate that at point Jiang et al. (2020). Therefore, the incident IR light no longer probes the band gap at point but the hybridization gap at its vicinity. In this situation, the temperature-independent observed in our experiment reflects the size of the hybridization gap, which remains a constant below the TPT. Our result does not violate the theoretical prediction about the increasing gap at point as lowering the temperature, and hence scenario 2 is still possible.
In fact, in our previous work Jiang et al. (2020), samples grown by the same flux method are shown to be in the STI phase at low temperatures based on the observation of two sets of Dirac band LL transitions with similar magnetic field dependence. We attribute the additional set of transitions to those across the second band gap in the vicinity of point and consider it a unique indicator of the STI phase. Such a connection is consistent with the prior ab initio calculations Weng et al. (2014); Morice et al. (2020); Zhu et al. (2022) and has further been confirmed by a unique four-fold splitting in quantum oscillations Wang et al. (2021), which excludes defect/impurities as a possible origin def . For the ZrTe5 sample studied in this work, between the strong transitions labeled by LL index in Figure 2a,b, we also find a series of weak transitions indicated by the asterisk symbol () in close resemblance with our previous work Jiang et al. (2020). Hence, these asterisk modes suggest the STI phase in ZrTe5 at low temperatures. Consequently, a TPT possibly occurs between 30 K and 60 K as these modes start to lose their visibility and the band parameters start to fluctuate.
In conclusion, we have performed a magneto-IR spectroscopy study of the LL transitions in Te-flux grown ZrTe5 samples in the temperature range of 6 K to 175 K and observed distinct temperature dependence for different low-energy modes. Using a massive Dirac fermion model, we extract the band gaps and Fermi velocities from the observed LL transitions and find that as temperature decreases, the band gap (Fermi velocity) first decreases (increases) and then saturates at low temperatures. We show that such a temperature dependence not only can be explained with a no TPT scenario but also is compatible with a TPT scenario if the formation of the second band gap (due to band inversion) and the associated orbital mixing effect are considered. We note that given the different topological phases reported for ZrTe5 at low temperatures, both scenarios are not exclusive and may also be sensitive to sample details. Nevertheless, our work presents a new possibility for the band gap evolution across the TPT, which may be easily dismissed.
We thank David Singh for insightful discussions. This work was primarily supported by the DOE (Grant No. DE-FG02-07ER46451), while crystal growth at UTK was supported by Grant No. DE-SC0020254. Y. J. acknowledges the support by the National Natural Science Foundation of China (Grant No. 12274001) and the Nature Science Foundation of Anhui Province (Grant No. 2208085MA09). The crystal characterization was performed in part at the GT Institute for Electronics and Nanotechnology, a member of the National Nanotechnology Coordinated Infrastructure, which is supported by the NSF (Grant No. ECCS-1542174). The IR measurements were performed at NHMFL, which is supported by the NSF Cooperative Agreement No. DMR-1644779 and the State of Florida.
Note added. After the initial submission of this work, we became aware of a similar work Mohelsky et al. (2023), presenting consistent experimental results with the no-TPT interpretation.
I Appendix: Additional experimental data
For completeness, in Figure 5, we include additional data describing the magnetic field evolution of the normalized magneto-transmission spectra at different temperatures. In Figure 6, we present the raw spectra of the false color plot of Figure 2c.
References
- Weng et al. (2014) H. Weng, X. Dai, and Z. Fang, Transition-Metal Pentatelluride ZrTe5 and HfTe5: A Paradigm for Large-Gap Quantum Spin Hall Insulators, Phys. Rev. X 4, 011002 (2014).
- Li et al. (2016a) Q. Li, D. E. Kharzeev, C. Zhang, Y. Huang, I. Pletikosic, A. V. Fedorov, R. D. Zhong, J. A. Schneeloch, G. D. Gu, and T. Valla, Chiral magnetic effect in ZrTe5, Nat. Phys. 12, 550 (2016a).
- Liang et al. (2018) T. Liang, J. Lin, Q. Gibson, S. Kushwaha, M. Liu, W. Wang, H. Xiong, J. A. Sobota, M. Hashimoto, P. S. Kirchmann, Z.-X. Shen, R. J. Cava, and N. P. Ong, Anomalous Hall effect in ZrTe5, Nat. Phys. 14, 451 (2018).
- Liu et al. (2021) Y. Liu, H. Wang, H. Fu, J. Ge, Y. Li, C. Xi, J. Zhang, J. Yan, D. Mandrus, B. Yan, et al., Induced anomalous hall effect of massive dirac fermions in zr te 5 and hf te 5 thin flakes, Physical Review B 103, L201110 (2021).
- Gourgout et al. (2022) A. Gourgout, M. Leroux, J.-L. Smirr, M. Massoudzadegan, R. P. Lobo, D. Vignolles, C. Proust, H. Berger, Q. Li, G. Gu, et al., Magnetic freeze-out and anomalous hall effect in zrte5, npj Quantum Materials 7, 71 (2022).
- Lozano et al. (2022) P. M. Lozano, G. Cardoso, N. Aryal, D. Nevola, G. Gu, A. Tsvelik, W. Yin, and Q. Li, Anomalous hall effect at the lifshitz transition in zr te 5, Physical Review B 106, L081124 (2022).
- Tang et al. (2019) F. Tang, Y. Ren, P. Wang, R. Zhong, J. Schneeloch, S. A. Yang, K. Yang, P. A. Lee, G. Gu, Z. Qiao, and L. Zhang, Three-dimensional quantum Hall effect and metal-insulator transition in ZrTe5, Nature 569, 537 (2019).
- Galeski et al. (2021) S. Galeski, T. Ehmcke, R. Wawrzyńczak, P. M. Lozano, K. Cho, A. Sharma, S. Das, F. Küster, P. Sessi, M. Brando, et al., Origin of the quasi-quantized hall effect in zrte5, Nature communications 12, 1 (2021).
- Wei et al. (2022) Z. Wei, S. Zhang, Y. Su, L. Cheng, H. Zhou, Z. Jiang, H. Weng, and J. Qi, Extremely low-energy collective modes in a quasi-one-dimensional topological system, Science China Physics, Mechanics & Astronomy 65, 1 (2022).
- Tian et al. (2021) Y. Tian, N. Ghassemi, and J. H. Ross Jr, Gap-opening transition in dirac semimetal zrte 5, Physical Review Letters 126, 236401 (2021).
- Ehmcke et al. (2021) T. Ehmcke, S. Galeski, D. Gorbunov, S. Zherlitsyn, J. Wosnitza, J. Gooth, and T. Meng, Propagation of longitudinal acoustic phonons in zrte5 exposed to a quantizing magnetic field, Physical Review B 104, 245117 (2021).
- Chen et al. (2015a) R. Y. Chen, S. J. Zhang, J. A. Schneeloch, C. Zhang, Q. Li, G. D. Gu, and N. L. Wang, Optical spectroscopy study of the three-dimensional Dirac semimetal ZrTe5, Phys. Rev. B 92, 075107 (2015a).
- Wu et al. (2016) R. Wu, J. Z. Ma, S. M. Nie, L. X. Zhao, X. Huang, J. X. Yin, B. B. Fu, P. Richard, G. F. Chen, Z. Fang, X. Dai, H. M. Weng, T. Qian, H. Ding, and S. H. Pan, Evidence for Topological Edge States in a Large Energy Gap near the Step Edges on the Surface of ZrTe5, Phys. Rev. X 6, 021017 (2016).
- Li et al. (2016b) X.-B. Li, W.-K. Huang, Y.-Y. Lv, K.-W. Zhang, C.-L. Yang, B.-B. Zhang, Y. B. Chen, S.-H. Yao, J. Zhou, M.-H. Lu, L. Sheng, S.-C. Li, J.-F. Jia, Q.-K. Xue, Y.-F. Chen, and D.-Y. Xing, Experimental Observation of Topological Edge States at the Surface Step Edge of the Topological Insulator ZrTe5, Phys. Rev. Lett. 116, 176803 (2016b).
- Manzoni et al. (2016) G. Manzoni, L. Gragnaniello, G. Autes, T. Kuhn, A. Sterzi, F. Cilento, M. Zacchigna, V. Enenkel, I. Vobornik, L. Barba, F. Bisti, P. Bugnon, A. Magrez, V. N. Strocov, H. Berger, O. V. Yazyev, M. Fonin, F. Parmigiani, and A. Crepaldi, Evidence for a Strong Topological Insulator Phase in ZrTe5, Phys. Rev. Lett. 117, 237601 (2016).
- Chen et al. (2017) Z.-G. Chen, R. Y. Chen, R. D. Zhong, J. Schneeloch, C. Zhang, Y. Huang, F. Qu, R. Yu, Q. Li, G. D. Gu, and N. L. Wang, Spectroscopic evidence for bulk-band inversion and three-dimensional massive dirac fermions in zrte5, Proc. Natl. Acad. Sci. U.S.A. 114, 816 (2017).
- Jiang et al. (2017a) Y. Jiang, Z. L. Dun, H. D. Zhou, Z. Lu, K.-W. Chen, S. Moon, T. Besara, T. M. Siegrist, R. E. Baumbach, D. Smirnov, and Z. Jiang, Landau-level spectroscopy of massive Dirac fermions in single-crystalline ZrTe5 thin flakes, Phys. Rev. B 96, 041101(R) (2017a).
- Zheng et al. (2017) G. Zheng, X. Zhu, Y. Liu, J. Lu, W. Ning, H. Zhang, W. Gao, Y. Han, J. Yang, H. Du, K. Yang, Y. Zhang, and M. Tian, Field-induced topological phase transition from a three-dimensional weyl semimetal to a two-dimensional massive dirac metal in , Phys. Rev. B 96, 121401(R) (2017).
- Zhang et al. (2021) P. Zhang, R. Noguchi, K. Kuroda, C. Lin, K. Kawaguchi, K. Yaji, A. Harasawa, M. Lippmaa, S. Nie, H. Weng, et al., Observation and control of the weak topological insulator state in zrte5, Nature communications 12, 1 (2021).
- Zhu et al. (2022) J. Zhu, C. Lee, F. Mahmood, T. Suzuki, S. Fang, N. Gedik, and J. G. Checkelsky, Comprehensive study of band structure driven thermoelectric response of zrte5, Physical Review B 106, 115105 (2022).
- Fan et al. (2017) Z. Fan, Q.-F. Liang, Y. B. Chen, S.-H. Yao, and J. Zhou, Transition between strong and weak topological insulator in ZrTe5 and HfTe5, Sci. Rep. 7, 45667 (2017).
- Vaswani et al. (2020) C. Vaswani, L.-L. Wang, D. H. Mudiyanselage, Q. Li, P. M. Lozano, G. D. Gu, D. Cheng, B. Song, L. Luo, R. H. J. Kim, C. Huang, Z. Liu, M. Mootz, I. E. Perakis, Y. Yao, K. M. Ho, and J. Wang, Light-driven raman coherence as a nonthermal route to ultrafast topology switching in a dirac semimetal, Phys. Rev. X 10, 021013 (2020).
- Mutch et al. (2019) J. Mutch, W.-C. Chen, P. Went, T. Qian, I. Z. Wilson, A. Andreev, C.-C. Chen, and J.-H. Chu, Evidence for a strain-tuned topological phase transition in ZrTe5, Sci. Adv. 5, eaav9771 (2019).
- Konstantinova et al. (2020) T. Konstantinova, L. Wu, W.-G. Yin, J. Tao, G. Gu, X. Wang, J. Yang, I. Zaliznyak, and Y. Zhu, Photoinduced dirac semimetal in zrte5, npj Quantum Materials 5, 1 (2020).
- Zhang et al. (2017) Y. Zhang, C. Wang, L. Yu, G. Liu, A. Liang, J. Huang, S. Nie, X. Sun, Y. Zhang, B. Shen, J. Liu, H. Weng, L. Zhao, G. Chen, X. Jia, C. Hu, Y. Ding, W. Zhao, Q. Gao, C. Li, S. He, L. Zhao, F. Zhang, S. Zhang, F. Yang, Z. Wang, Q. Peng, X. Dai, Z. Fang, Z. Xu, C. Chen, and X. J. Zhou, Electronic evidence of temperature-induced Lifshitz transition and topological nature in ZrTe5, Nat. Commun. 8, 15512 (2017).
- Xu et al. (2018) B. Xu, L. X. Zhao, P. Marsik, E. Sheveleva, F. Lyzwa, Y. M. Dai, G. F. Chen, X. G. Qiu, and C. Bernhard, Temperature-Driven Topological Phase Transition and Intermediate Dirac Semimetal Phase in ZrTe5, Phys. Rev. Lett. 121, 187401 (2018).
- Manzoni et al. (2017) G. Manzoni, A. Crepaldi, G. Autès, A. Sterzi, F. Cilento, A. Akrap, I. Vobornik, L. Gragnaniello, P. Bugnon, M. Fonin, H. Berger, M. Zacchigna, O. Yazyev, and F. Parmigiani, Temperature dependent non-monotonic bands shift in zrte5, Journal of Electron Spectroscopy and Related Phenomena 219, 9 (2017).
- Xiong et al. (2017) H. Xiong, J. A. Sobota, S.-L. Yang, H. Soifer, A. Gauthier, M.-H. Lu, Y.-Y. Lv, S.-H. Yao, D. Lu, M. Hashimoto, P. S. Kirchmann, Y.-F. Chen, and Z.-X. Shen, Three-dimensional nature of the band structure of measured by high-momentum-resolution photoemission spectroscopy, Phys. Rev. B 95, 195119 (2017).
- Song et al. (2022) W. Song, L. Zhao, X. Wu, Z. Wang, Q. Liu, M. Li, H. Ma, P. Ding, G.-D. Gu, G.-F. Chen, et al., Temperature dependence of band shifts induced by impurity ionization in zrte5, Physical Review B 106, 115124 (2022).
- Okada et al. (1980) S. Okada, T. Sambongi, and M. Ido, Giant resistivity anomaly in zrte5, Journal of the Physical Society of Japan 49, 839 (1980).
- Tian et al. (2019) Y. Tian, N. Ghassemi, and J. H. Ross, Jr., Dirac electron behavior and NMR evidence for topological band inversion in ZrTe5, Phys. Rev. B 100, 165149 (2019).
- Shahi et al. (2018) P. Shahi, D. J. Singh, J. P. Sun, L. X. Zhao, G. F. Chen, Y. Y. Lv, J. Li, J. Q. Yan, D. G. Mandrus, and J. G. Cheng, Bipolar Conduction as the Possible Origin of the Electronic Transition in Pentatellurides: Metallic vs Semiconducting Behavior, Phys. Rev. X 8, 021055 (2018).
- Wang et al. (2022) Y. Wang, H. F. Legg, T. Bömerich, J. Park, S. Biesenkamp, A. Taskin, M. Braden, A. Rosch, and Y. Ando, Gigantic magnetochiral anisotropy in the topological semimetal zrte5, Physical Review Letters 128, 176602 (2022).
- Sun et al. (2020) Z. Sun, Z. Cao, J. Cui, C. Zhu, D. Ma, H. Wang, W. Zhuo, Z. Cheng, Z. Wang, X. Wan, et al., Large zeeman splitting induced anomalous hall effect in zrte5, npj Quantum Materials 5, 36 (2020).
- Wang et al. (2018) H. Wang, H. Liu, Y. Li, Y. Liu, J. Wang, J. Liu, J.-Y. Dai, Y. Wang, L. Li, J. Yan, et al., Discovery of log-periodic oscillations in ultraquantum topological materials, Science advances 4, eaau5096 (2018).
- Jiang et al. (2020) Y. Jiang, J. Wang, T. Zhao, Z. L. Dun, Q. Huang, X. S. Wu, M. Mourigal, H. D. Zhou, W. Pan, M. Ozerov, D. Smirnov, and Z. Jiang, Unraveling the topological phase of via magnetoinfrared spectroscopy, Phys. Rev. Lett. 125, 046403 (2020).
- Chen et al. (2015b) R. Y. Chen, Z. G. Chen, X. Y. Song, J. A. Schneeloch, G. D. Gu, F. Wang, and N. L. Wang, Magnetoinfrared Spectroscopy of Landau Levels and Zeeman Splitting of Three-Dimensional Massless Dirac Fermions in ZrTe5, Phys. Rev. Lett. 115, 176404 (2015b).
- Martino et al. (2019) E. Martino, I. Crassee, G. Eguchi, D. Santos-Cottin, R. D. Zhong, G. D. Gu, H. Berger, Z. Rukelj, M. Orlita, C. C. Homes, and A. Akrap, Two-Dimensional Conical Dispersion in ZrTe5 Evidenced by Optical Spectroscopy, Phys. Rev. Lett. 122, 217402 (2019).
- Poumirol et al. (2013) J. M. Poumirol, W. Yu, X. Chen, C. Berger, W. A. de Heer, M. L. Smith, T. Ohta, W. Pan, M. O. Goerbig, D. Smirnov, and Z. Jiang, Magnetoplasmons in quasineutral epitaxial graphene nanoribbons, Phys. Rev. Lett. 110, 246803 (2013).
- Yu et al. (2016) W. Yu, Y. Jiang, J. Yang, Z. L. Dun, H. D. Zhou, Z. Jiang, P. Lu, and W. Pan, Quantum Oscillations at Integer and Fractional Landau Level Indices in Single-Crystalline ZrTe5, Sci. Rep. 6 (2016), 10.1038/srep35357.
- Wang et al. (2021) J. Wang, Y. Jiang, T. Zhao, Z. Dun, A. L. Miettinen, X. Wu, M. Mourigal, H. Zhou, W. Pan, D. Smirnov, and Z. Jiang, Magneto-transport evidence for strong topological insulator phase in zrte5, Nature Communications 12, 6758 (2021).
- Krizman et al. (2018) G. Krizman, B. A. Assaf, M. Orlita, T. Phuphachong, G. Bauer, G. Springholz, G. Bastard, R. Ferreira, L. A. de Vaulchier, and Y. Guldner, Avoided level crossing at the magnetic field induced topological phase transition due to spin-orbital mixing, Phys. Rev. B 98, 161202 (2018).
- Wojek et al. (2014) B. M. Wojek, P. Dziawa, B. J. Kowalski, A. Szczerbakow, A. M. Black-Schaffer, M. H. Berntsen, T. Balasubramanian, T. Story, and O. Tjernberg, Band inversion and the topological phase transition in (pb,sn)se, Phys. Rev. B 90, 161202 (2014).
- Morice et al. (2020) C. Morice, E. Lettl, T. Kopp, and A. P. Kampf, Optical conductivity and resistivity in a four-band model for zrte5 from ab initio calculations, Physical Review B 102, 155138 (2020).
- Jiang et al. (2017b) Y. Jiang, S. Thapa, G. D. Sanders, C. J. Stanton, Q. Zhang, J. Kono, W. K. Lou, K. Chang, S. D. Hawkins, J. F. Klem, W. Pan, D. Smirnov, and Z. Jiang, Probing the semiconductor to semimetal transition in InAs/GaSb double quantum wells by magneto-infrared spectroscopy, Phys. Rev. B 95, 045116 (2017b).
- (46) In addition, the energies of these weak modes do not fit well with other selection rules, such as , induced by defects/impurities. Quantitative analysis of the optical weight and energy dependence of the weak modes can be found in Ref. [36].
- Mohelsky et al. (2023) I. Mohelsky, J. Wyzula, B. Piot, G. Gu, Q. Li, A. Akrap, and M. Orlita, Temperature dependence of the energy band gap in zrte5: Implications for the topological phase, Physical Review B 107, L041202 (2023).