Role of Duty Cycle in Burst-modulated Synthetic Jet Flow Control
Abstract
This paper presents an experimental study on flow reattachment over a stalled airfoil using an array of microblowers operating as synthetic jet actuators (SJAs). The effects of burst duty cycle (DC) and blowing ratio, alongside power requirements, are examined in relation to SJA-induced vortical structures and aerodynamic performance. Results show that increasing the DC or blowing ratio can achieve the threshold momentum coefficient required for flow reattachment. While both DC and blowing ratios impact control efficacy, achieving a specific momentum coefficient generally corresponds to a consistent lift coefficient, regardless of the individual parameter values. Substantial lift improvements are observed at DCs as low as , indicating that brief, high-momentum perturbations to the flow are sufficient for reattachment, resulting in significant power savings. However, analysis of the flow dynamics reveals that low-DC control strategies result in unsteady, phase-dependent flow behavior due to the induced vortices’ rapid dissipation and inconsistent evolution. Higher DCs produce stronger, more persistent vortices that remain closer to the airfoil surface, leading to a more stable and effective control strategy. Additionally, a strong correlation between the lift coefficient and the suction peak pressure coefficient is observed, indicating that single-point measurements suffice for rapid assessment of control effectiveness.
Nomenclature
| = | Projected control area [\unit\squared] |
| = | Wing span [\unit\milli] |
| = | Airfoil chord length [\unit\milli] |
| = | Blowing ratio |
| = | Lift coefficient |
| = | Baseline lift coefficient |
| = | Pressure coefficient |
| = | Momentum coefficient |
| = | Carrier frequency [\unit] |
| = | Modulation frequency [\unit] |
| = | Reduced SJA frequency |
| = | Time-averaged jet momentum [\unit] |
| = | Power consumption [W] |
| = | Second invariant of the velocity gradient tensor |
| = | Resistance [] |
| = | Chord-based Reynolds number |
| = | Strain-rate tensor |
| = | Actuation period [\unit] |
| = | Instantaneous velocity in the streamwise and transverse direction, [\unit[per-mode=symbol]\per] |
| , = | Time-averaged velocity in the streamwise and transverse direction [\unit[per-mode=symbol]\per] |
| = | Phase-averaged velocity in the streamwise and transverse direction, [\unit[per-mode=symbol]\per] |
| = | Velocity fluctuation in the streamwise and transverse direction, [\unit[per-mode=symbol]\per] |
| = | Freestream velocity [\unit[per-mode=symbol]\per] |
| = | Time-averaged jet velocity during expulsion [\unit[per-mode=symbol]\per] |
| = | Voltage [V] |
| = | Time-averaged velocity magnitude [\unit[per-mode=symbol]\per] |
| , , = | Chordwise, transverse, and spanwise coordinate [\unit\milli] |
| = | Angle of attack [\unit] |
| = | Lift to power efficiency |
| = | Freestream fluid density [\unit[per-mode=symbol]\kilo\per\cubed] |
| = | Pearson correlation coefficient |
| = | Burst signal active duration [s] |
| = | Phase angle of modulated actuation cycle [\unit] |
| = | Out-of-plane vorticity [\unit\per] |
| Acronyms | |
| AFC = | Active Flow Control |
| DC = | Duty Cycle |
| FOV = | Field of View |
| NACA = | National Advisory Committee for Aeronautics |
| NREL = | National Renewable Energy Laboratory |
| PIV = | Particle Image Velocimetry |
| SJA = | Synthetic Jet Actuator |
1 Introduction
Flow control plays a critical role in enhancing the performance and efficiency of aircraft, especially those operating at low Reynolds numbers. Aerodynamic stall due to flow separation results in a drastic loss of lift and an increase in drag, constraining the performance of airfoils. These challenges typically arise in low-speed, high-altitude aircraft used for surveying and stealth, gliders, electric aircraft, and wind turbine blades. Flow control techniques can modify the flow around an airfoil, reattaching separated flows during post-stall conditions, thereby expanding the airfoil’s operational envelope.
Flow control techniques can be broadly classified into passive and active methods. Passive techniques involve modifying the flow without adding energy, for example, modifying the wing shape, adding vortex generators [1], or incorporating roughness elements [2]. While passive flow control can enhance aerodynamic performance, these methods often incur parasitic drag in the portion of the operational envelope when they are not needed [3]. In contrast, active flow control (AFC) techniques can be selectively employed under specific conditions, minimizing adverse effects when inactive. Despite their advantages, AFC systems tend to increase the aircraft’s weight, which is especially problematic in the case of nano and micro air vehicles where weight and volume limitations are stringent [4]. Furthermore, AFC systems draw substantial electrical power, a significant concern for electric aircraft [4, 5]. Traditional continuous blowing methods, for instance, require plumbing systems that add weight and complexity [6]. In contrast, AFC using synthetic jet actuators (SJAs) does not require plumbing, making them an ideal choice for aircraft flow control.
Typically utilizing plasma actuators or piezoelectric diaphragms, SJAs are zero-net-mass-flux devices that cyclically ingest and expel fluid, forming a time-averaged jet that adds momentum to the flow [7, 8]. Furthermore, synthetic jets have been shown to outperform continuous jets in fluid entrainment and mixing [9, 10, 11]. The effectiveness of SJAs in flow control is largely due to the generation of coherent vortical structures. These vortices, induced by the cyclic actuation of SJAs, are convected downstream along the suction side of the airfoil, entraining high-momentum fluid from the freestream into the separated shear layer. This process of momentum transfer energizes the shear layer, enabling it to overcome the adverse pressure gradient, thereby facilitating flow reattachment [6, 12, 13, 14]. The ability of SJAs to control flow separation through this mechanism makes them particularly effective for enhancing aerodynamic performance. Recent advancements in SJA technology have led to the development of MEMS-based devices, which are lightweight and reliable, making them ideal for flow control applications [14]. Additionally, SJAs offer a cost-effective alternative to similar AFC devices [3]. Over the past few decades, SJAs have been extensively researched and have achieved a high technology readiness level of 7 due to their successful implementation in real flight tests [15, 4].
Slot-style SJAs have been studied extensively due to their advantages in fluid entrainment [16]. However, their installation requires significant modifications to the wing surface and often involves large cavities, introducing structural concerns and resulting in high power consumption. This has driven research into arrays of small, circular SJAs for flow control, which also have the advantage of low power requirements and minimal noise production compared to large cavity SJAs. For example, a previous study using a large cavity SJA required driving voltages up to 275 [17], while the effects of control fully saturated at only 20 using an array of microblowers under similar experimental conditions [14].
Many parametric studies have been conducted to optimize flow reattachment, reduce drag, enhance lift, and maximize the stability of aerodynamic forces. Research has examined various factors, such as the effect of chordwise actuation location [18, 19, 20], blowing angle [18, 21], and orifice geometry [22, 23]. For practical flight applications, the most easily adjustable parameters that affect control performance are related to the waveform driving the SJAs. For a burst-modulated signal, the three primary waveform parameters that can be adjusted are the modulation frequency, the blowing strength, and the burst duty cycle (DC). Power consumption is significantly impacted by the blowing strength, controlled by varying the applied voltage and the DC, which dictates the fraction of the period during which SJA is activated.
The blowing strength is a critical parameter for SJAs in flow control applications, often quantified by a non-dimensional blowing ratio , where is the time-averaged jet velocity during expulsion and is the freestream velocity. The blowing strength of an SJA is dictated by the amplitude of the SJA’s actuation, which is controlled by the voltage amplitude of the input signal. Experimental studies have demonstrated that increasing the blowing ratio can result in reduced drag and increased lift [9, 18, 17, 20, 24]. However, the effectiveness eventually saturates, with no additional aerodynamic benefits from further increases in the blowing ratio. This saturation point corresponded to the transition from a laminar separation bubble to a fully reattached flow [25]. Prior flow visualizations revealed that an increase in the blowing ratio leads to a thinning of the shear layer, a decrease in wake width, and a downward shift of the wake [17]. These desirable flow characteristics observed at higher blowing ratios are attributed to the postponed dissipation of the coherent vortices induced by the SJA, which enhances momentum transport into the shear layer [26, 24]. It is important to note that the majority of findings in these studies have been based on data collected at the midspan. A recent study revealed that flow over an airfoil controlled by SJAs is highly three-dimensional, with control efficacy degrading significantly even at moderate distances from the midspan, though still within the extent of the SJA array [27]. Furthermore, Feero et al. [25] showed that while control effects may be saturated at midspan, further increases in the blowing ratio can improve the spanwise control authority, highlighting the need for comprehensive three-dimensional flow analysis.
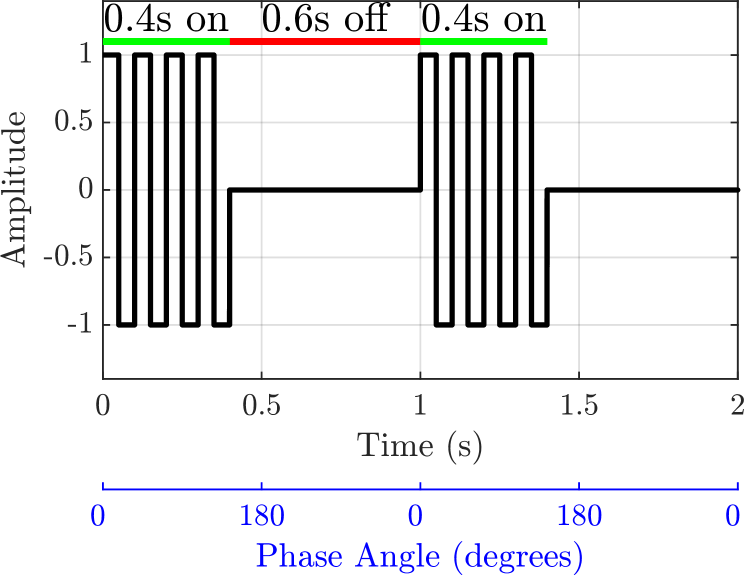
For flow control applications, SJAs are often driven by a burst-modulated signal, allowing the SJA to operate at its optimal frequency while targeting global instabilities in the flow associated with significantly lower frequencies. An example of a burst-modulated waveform is displayed in figure 1. Burst modulation has proven to be an effective technique in flow control, as demonstrated by various experimental studies [28, 29, 30, 25, 20, 31, 32, 13, 33, 24, 34, 14]. Additionally, it offers significant advantages over continuous actuation; for example, Amitay and Glezer [28] showed that burst modulation, when tuned to the airfoil’s natural frequency, increased the lift coefficient by compared to continuous high-frequency actuation while operating at of the momentum coefficient. Similarly, Borghi et al. [31] showed that burst modulation of plasma SJAs was significantly more effective in recovering stall over continuous actuation. An et al. [32] demonstrated successful temporary flow reattachment following a four-pulse burst sequence from an SJA. Additionally, this technique has the benefit of reduced power consumption due to the SJA only being powered for a fraction of the signal’s period.
The DC of the burst-modulated signal is another critical parameter in optimizing SJA performance and power consumption. Low-DCs significantly reduce power input, as the actuator operates for only a fraction of the signal’s period. In a parametric study, Abdolahipour et al. [35] found that high-frequency synthetic jets achieve maximum mean exit velocities at low DCs, which is desirable for flow control applications. The study also revealed that high DCs cause successive vortex rings to converge; at excessively high DCs, they interact and destroy. Additionally, Taylor et al. [3] demonstrated that using and DCs reduced hysteresis in lift compared to continuous actuation for a dynamically pitching airfoil. Similarly, Rice et al. [13] improved many aspects of dynamic stall control by using a low-DC, consuming only of the power required for continuous actuation. Table 2 provides an overview of the discussed experimental studies utilizing burst modulation in synthetic jet flow control.
| Authors | DC | Geometry | ||||
|---|---|---|---|---|---|---|
| Amitay and Glezer [28] | 0.27, 1.1, 3.3 | 3.10 | custom airfoil | |||
| Taylor et al. [3] | , | to | - | pitching | 2.20 | NREL S809 |
| Borghi et al. [31] | - | 0.7 | , | 2.20 | NACA 0015 | |
| Feero et al. [20] | - | 1, 2, 14, 58 | 1.00 | NACA 0025 | ||
| Rice et al. [13, 33] | 25 | , | 3.75 | NREL S817 | ||
| Yang et al. [24] | - | 1, 14 | 1.00 | NACA 0025 | ||
| Kim et al. [34] | 1, 2, 14, 58 | 1.00 | NACA 0025 | |||
| Xu et al. [14] | 1.18, 11.76 | 1.00 | NACA 0025 | |||
| Machado et al. [27, 36] | 1.18, 11.76 | 1.00 | NACA 0025 |
The fluidic performance of SJAs is often evaluated using the momentum coefficient, which quantifies the momentum imparted by the SJA relative to the freestream flow. Various definitions of the momentum coefficient have been proposed by different researchers. The momentum coefficient for burst-modulated SJAs is not only influenced by the peak-to-peak voltage () but also the DC, as highlighted by Margalit et al. [37]. While previous research has often focused on enhancing momentum addition through increased signal amplitude at a constant DC, the blowing ratio () and momentum coefficient () have often been used interchangeably as measures of jet strength. In this study, the momentum coefficient is defined as the ratio of the momentum imparted by the synthetic jet to the incoming flow momentum over the entire actuation cycle, aligning with the definition proposed by Taylor et al. [3]:
| (1) |
where is the freestream fluid density, is the projected control area for a single jet, and is the time-averaged jet momentum given by:
| (2) |
where is the jet orifice area, is the phase-averaged jet velocity, is the cycle period, and is the SJA active duration, which is typically set to . Therefore, the momentum coefficient is commonly scaled proportionally to the DC [18, 38, 39]. To summarize, in burst-modulated SJAs, the momentum coefficient depends on both the blowing ratio and the DC. With these definitions, the blowing ratio measures the jet’s mean velocity relative to the oncoming flow, while the DC is the fraction of the actuation period that the jet is active. While prior studies have demonstrated that a threshold momentum coefficient must be met to fully reattach the separated shear layer [17, 4], it remains uncertain whether altering the momentum coefficient by varying the DC has the same effect as varying it via the blowing ratio. This raises an important question: can short, intense jets achieve the same control efficacy as longer, less intense bursts when the time-averaged momentum imparted is equal?
This paper explores the aerodynamic effects of varying the DC and blowing ratio of an SJA array, with a focus on optimizing control efficiency and power consumption. Section 3.1 investigates how these parameters influence lift performance and power consumption, aiming to identify effective, power-efficient control strategies. The study also examines the effect of varying the DC on flow characteristics and vortical structures responsible for flow reattachment in Section 3.2. Finally, correlations between single-point pressure measurements and lift coefficients are explored in Section 3.3. This approach facilitates rapid evaluation of control parameters for lift characteristics, serving as a preliminary step before performing a detailed pressure study.
2 Experimental Method
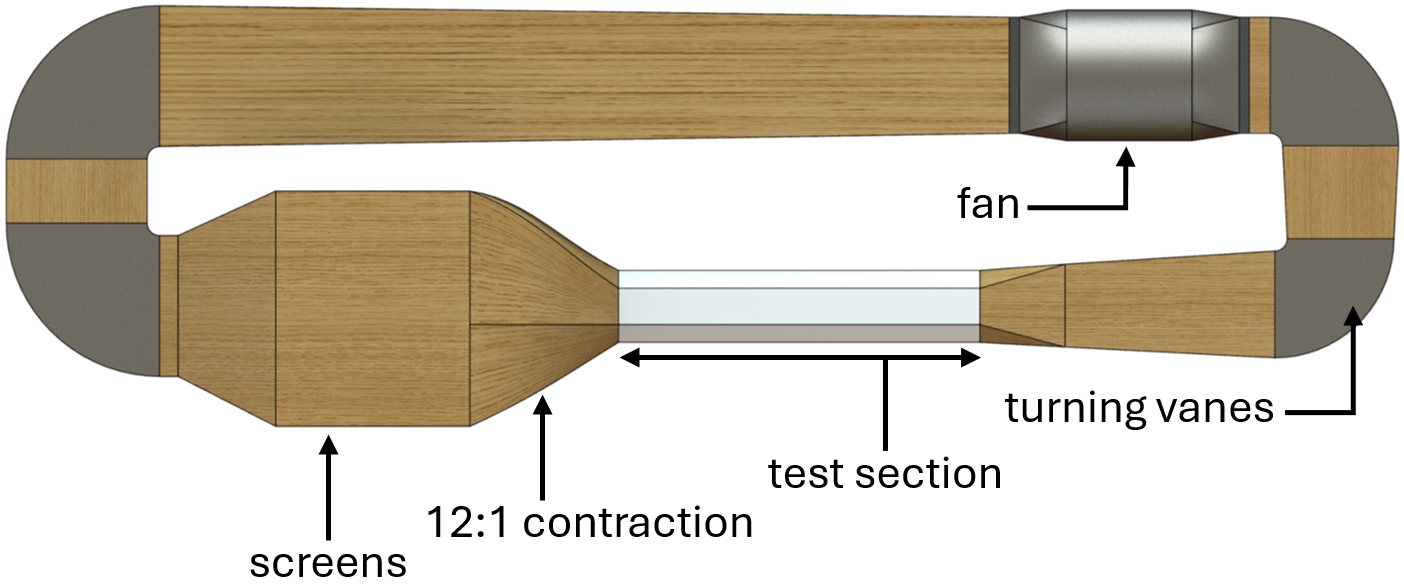
Experiments were conducted in the low-speed recirculating wind tunnel in the Department of Mechanical and Industrial Engineering at the University of Toronto (figure 2). The test section has dimensions of and features acrylic windows on the top and side walls for observation and measurement. The flow passes through seven screens and a 12:1 contraction before entering the test section. The wind tunnel is capable of producing speeds between 3–18 \unit[per-mode = symbol]\per with a turbulence intensity of less than . The freestream velocity was measured with a pitot-static tube at the test section entrance connected to an MKS Baratron 226A differential pressure transducer with a range of . The uncertainty of the freestream velocity is estimated to be less than . For the experiments conducted, the wind tunnel was operated at a freestream velocity of \unit[per-mode = symbol]\per, resulting in a chord-based Reynolds number of .
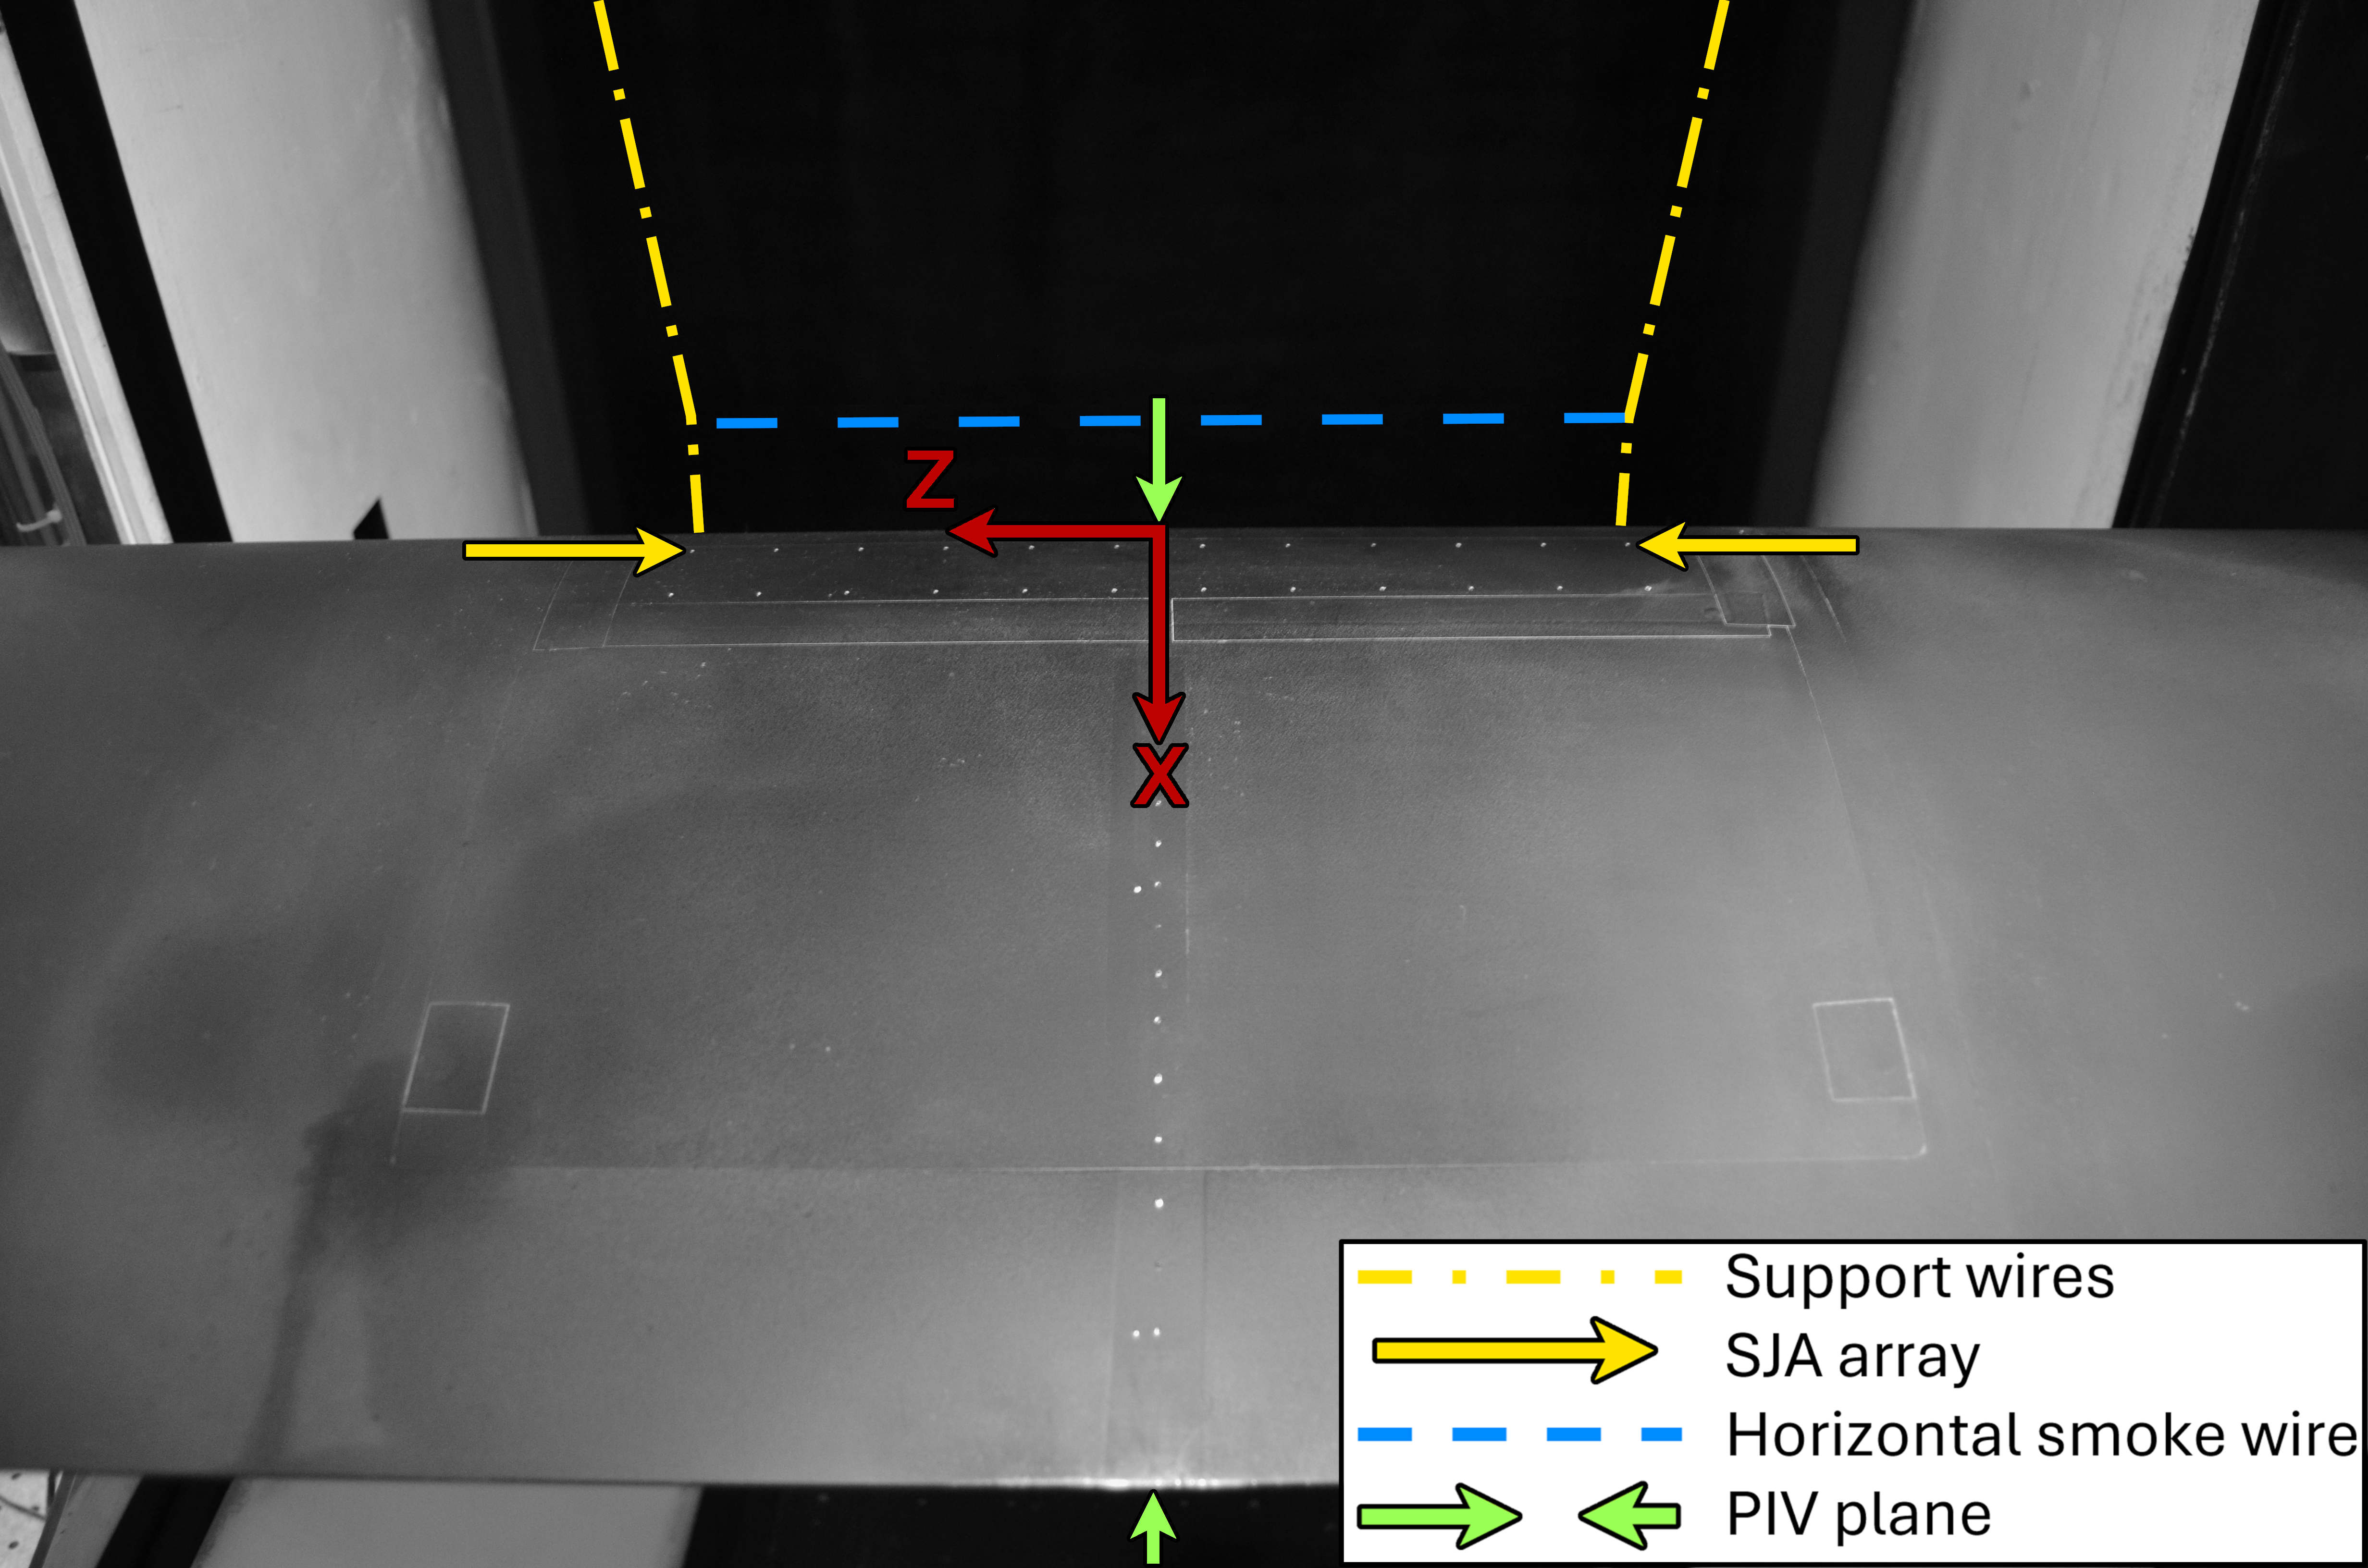
A NACA 0025 airfoil was placed in the wind tunnel with the leading edge approximately from the test section inlet (figure 3). Additionally, the coordinate axes are defined, with corresponding to the midspan. The aluminum wing has an aspect ratio of approximately 3, with a span of \unit\milli, and a chord length of \unit\milli. The wing spans the entire width of the test section and features circular end plates which isolate it from the boundary layer at the wind tunnel walls [20]. The wing comprises three parts, with a hollow center third to house the sensors and actuators. In the center, there is a rectangular cutout where the microblower array is installed, with a flush hole for the nozzle of each SJA. The angle of attack was set to , such that the flow separates at approximately chord with the specified flow parameters. Sixty-four pressure taps along the midspan of the airfoil were connected to a Scanivalve pressure scanner with pneumatic tubing. The surface pressure of the airfoil was measured using an MKS Baratron 226A pressure transducer, featuring a bidirectional range of \unit. For each measurement, 30,000 samples were collected at a sampling rate of , yielding a lift coefficient with an error of less than .
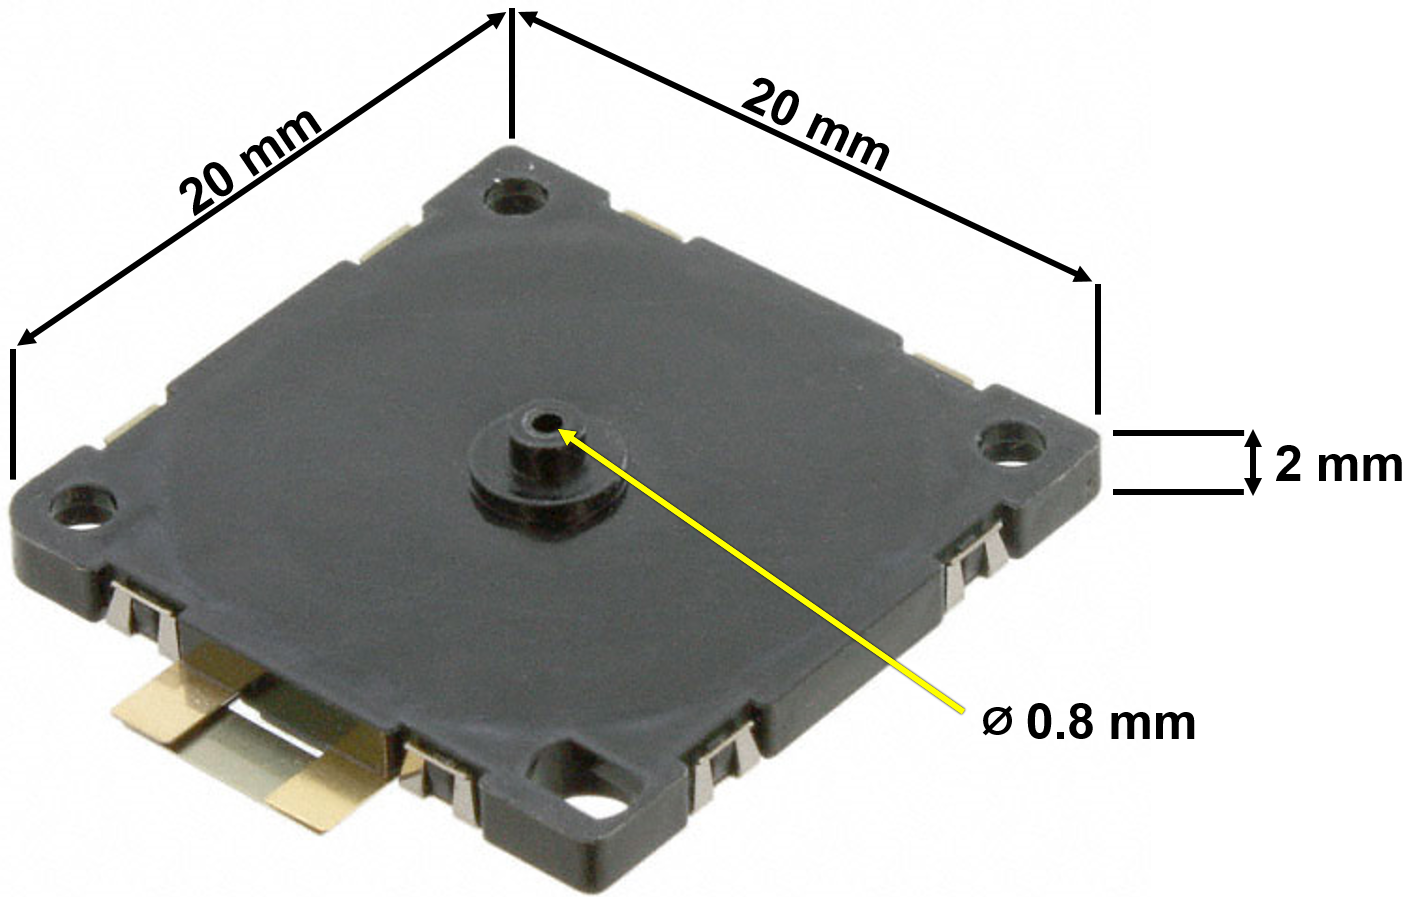
The SJAs used are the commercially available Murata MZB1001T02 microblowers, pictured in figure 4, and are embedded underneath the surface of the airfoil. The SJAs are equally spaced in the spanwise direction by . The array consists of two rows of 12 SJAs located at and chord. However, only the upstream row was activated in these experiments, as indicated by the arrows in figure 3. The SJA operates between 5–30 and has a drive resonant frequency between 24–27 \unit\kilo. The mean centerline velocity of the synthetic jet reached a maximum when driven at a frequency of . However, due to the right-skewed velocity response, the carrier frequency was chosen as \unit\kilo to ensure a stable jet velocity [14]. The SJAs were burst modulated at an excitation frequency of \unit, corresponding to a non-dimensional frequency of . Square waveforms were used for the carrier and modulation frequency. The DC was varied from to and the blowing ratio was varied from to . The time-averaged jet velocities used to calculate the blowing ratio were measured previously by Chovet et al. [40]. These blowing ratios were achieved by varying the input voltage from 10–20 . Prior visualizations showed that at 5 , the flow region controlled by the SJA is highly asymmetric even at high-DCs [41]. This aligns with previous tests [14], which showed large variations in jet centerline velocity between microblowers operating below 8 and increased sensitivity in the velocity response within this low-voltage range. Consequently, this study focuses on operating voltages of 10 and above to ensure the analysis captures fluidic effects while minimizing random variations in the SJAs’ response. By varying the DC and the input voltage, the estimated momentum coefficients achieved range from to . These estimates are derived from linearly scaling the measurements obtained at a DC from Xu et al. [14]. The experimental parameters are summarized in table 3 and the control parameters are summarized in table 4.
| Airfoil profile | NACA 0025 |
|---|---|
| Chord length | |
| Span | \unit\milli |
| Angle of attack | |
| Chord-based Reynolds number | |
| Freestream velocity | \unit[per-mode = symbol]\per |
| SJA nozzle diameter | |
|---|---|
| Chordwise position of activated SJAs | |
| Number of SJAs | 12 |
| Spanwise SJA spacing | |
| Waveform | Square |
| Carrier frequency | |
| Modulation frequency | () |
| Applied voltage | 10 to 20 |
| Blowing ratios | to 5.0 |
| Duty cycles | to |
| Momentum coefficients | to |
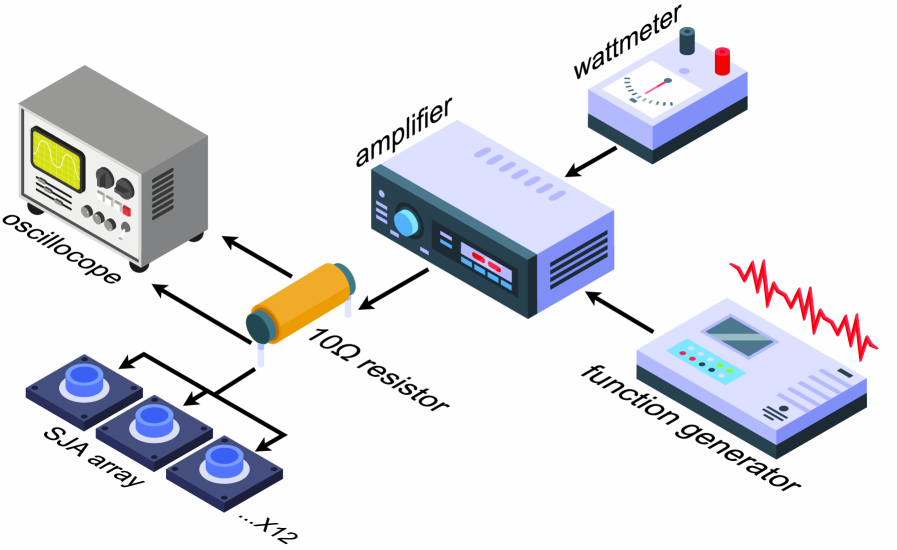
Figure 5 illustrates the setup in which the SJA array receives its input signal from a Rigol DG1022Z function generator, amplified by a YAMAHA HTR5470 amplifier. The signal is then routed through a 10 resistor to prevent overloading before reaching the 12 SJAs wired in parallel. The power consumption of the SJA array was determined by measuring the power consumed by the amplifier while the SJAs were active () and subtracting the idle power consumption of the amplifier () and the power dissipated by the resistor ():
| (3) |
The power consumption of the amplifier was measured using a consumer-grade wattmeter, which has an uncertainty of . A Rigol DS1202Z-E oscilloscope was used to measure the RMS voltage drop across the resistor. The power dissipated by the resistor was then calculated using the equation:
| (4) |
where is the measured RMS voltage drop across the resistor, and is the resistance value. The uncertainty in this calculation was determined to be . Therefore, the total uncertainty in the power consumption of the SJAs was estimated to be .
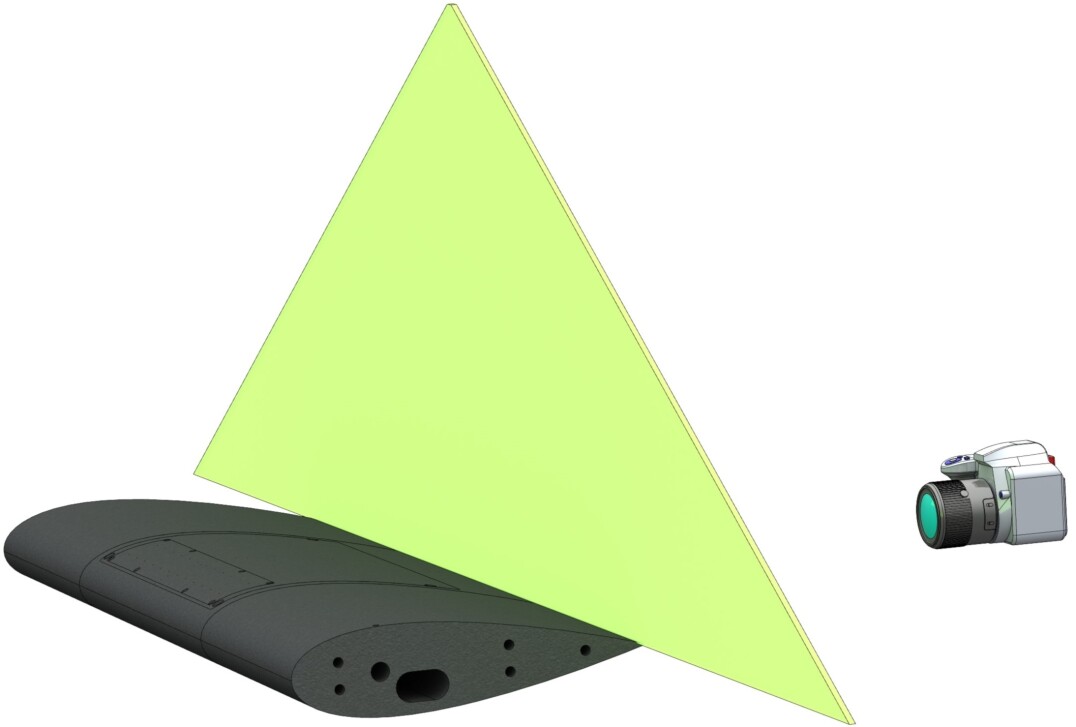
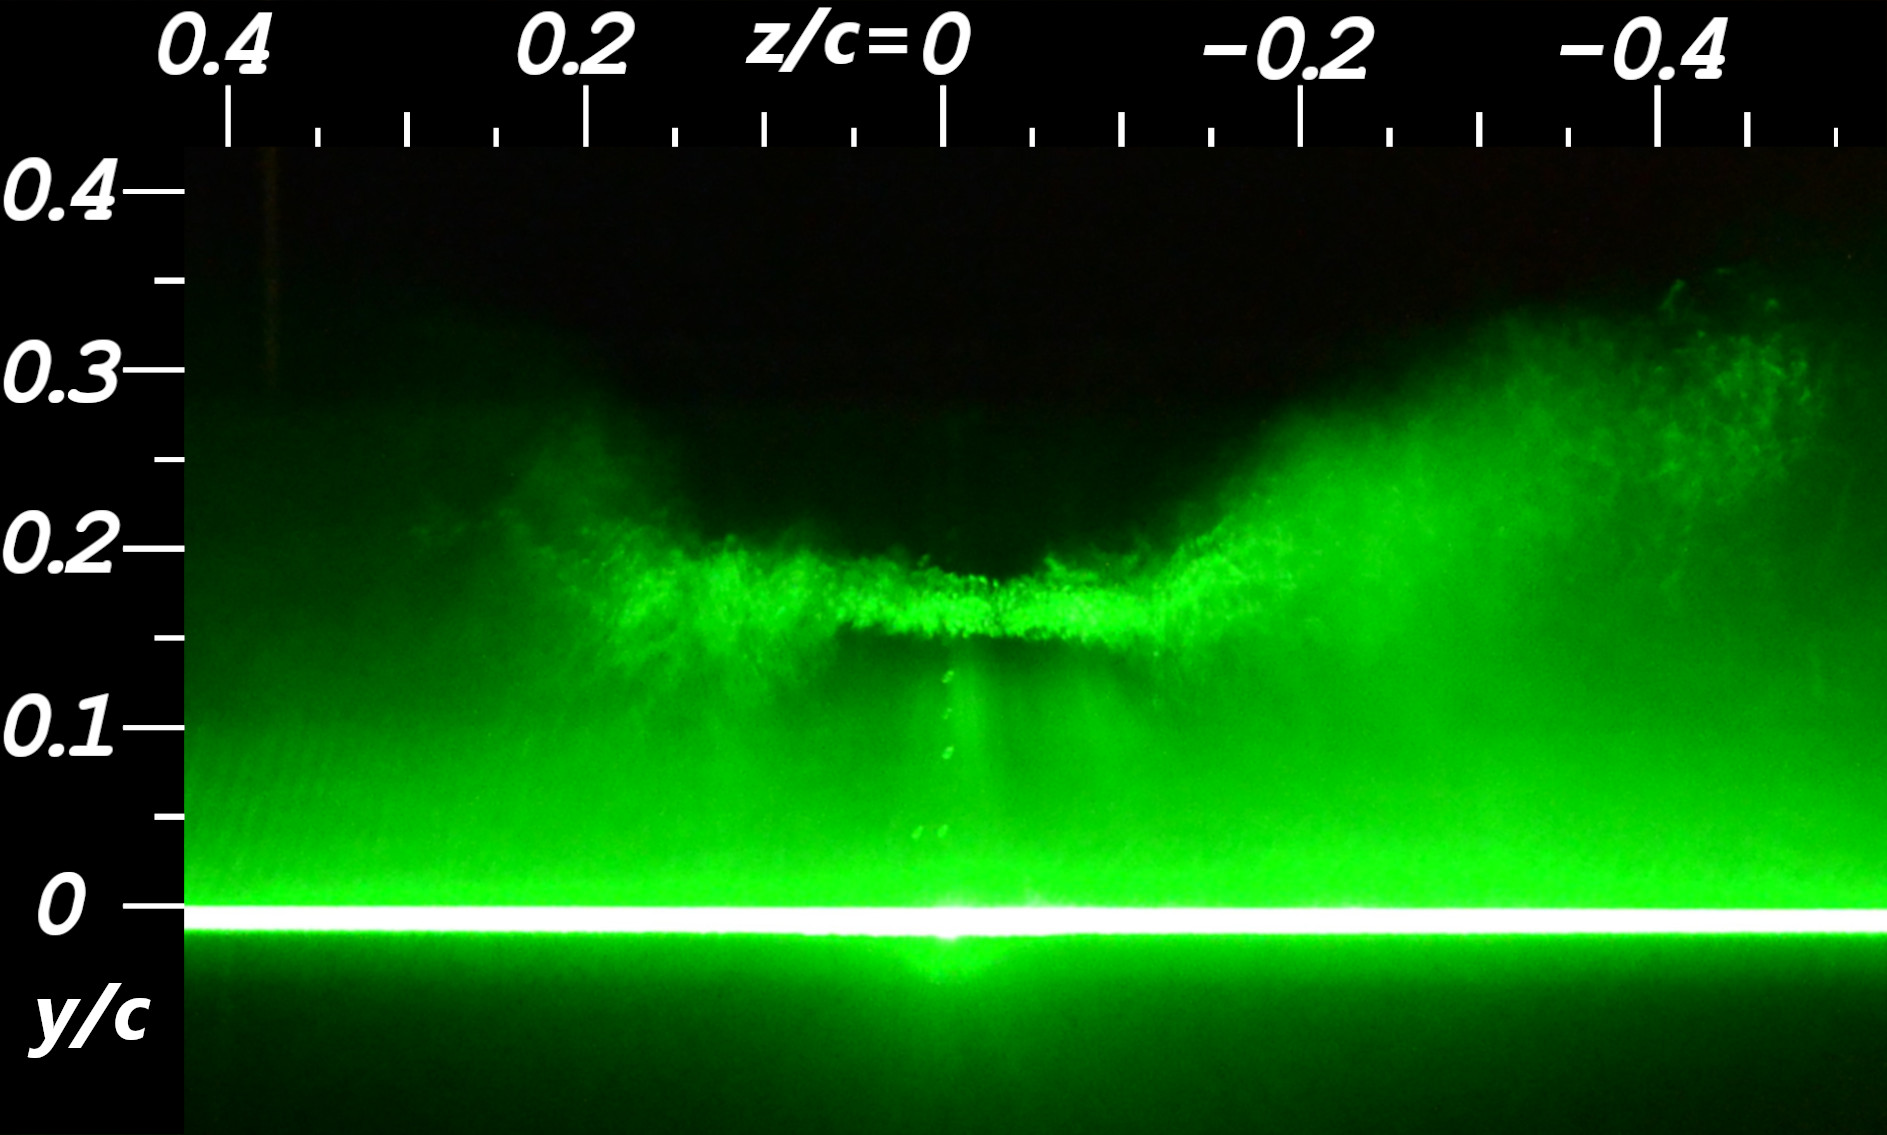
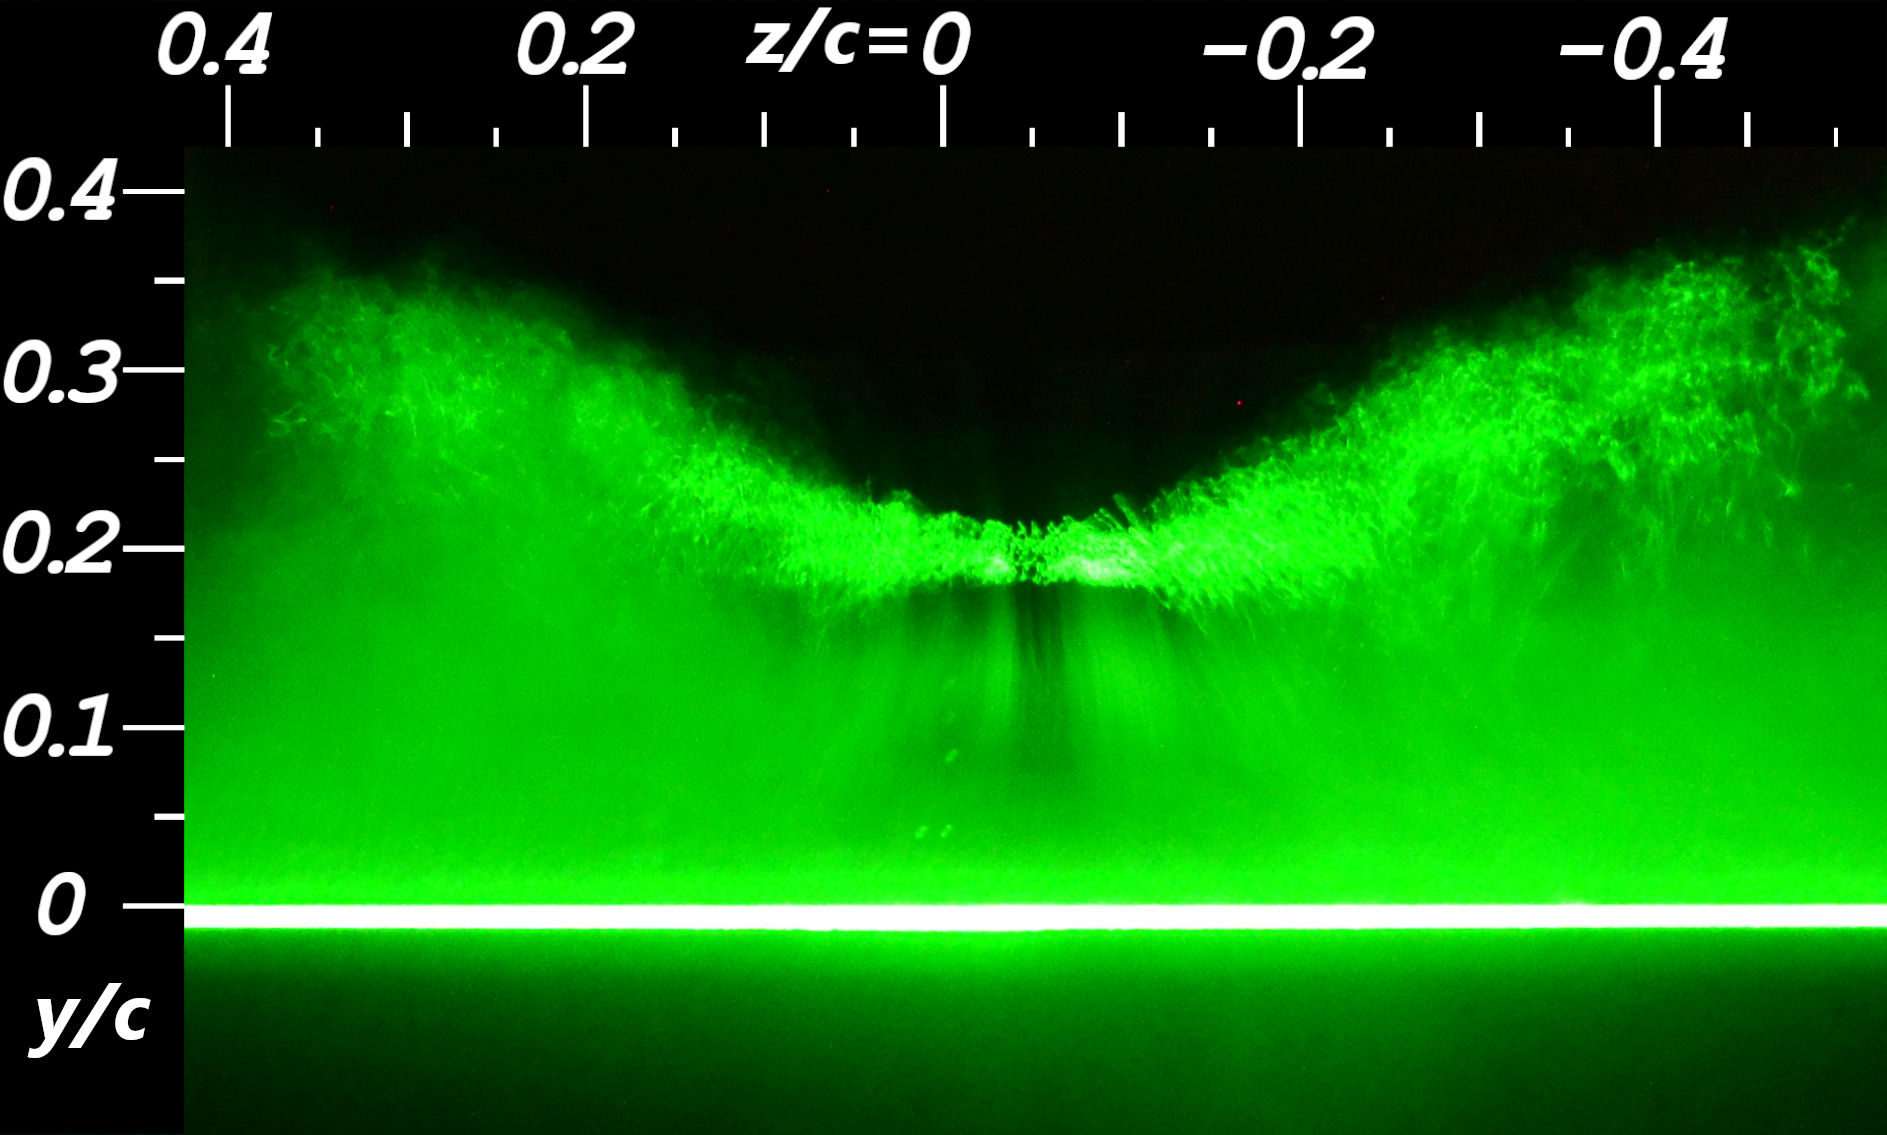
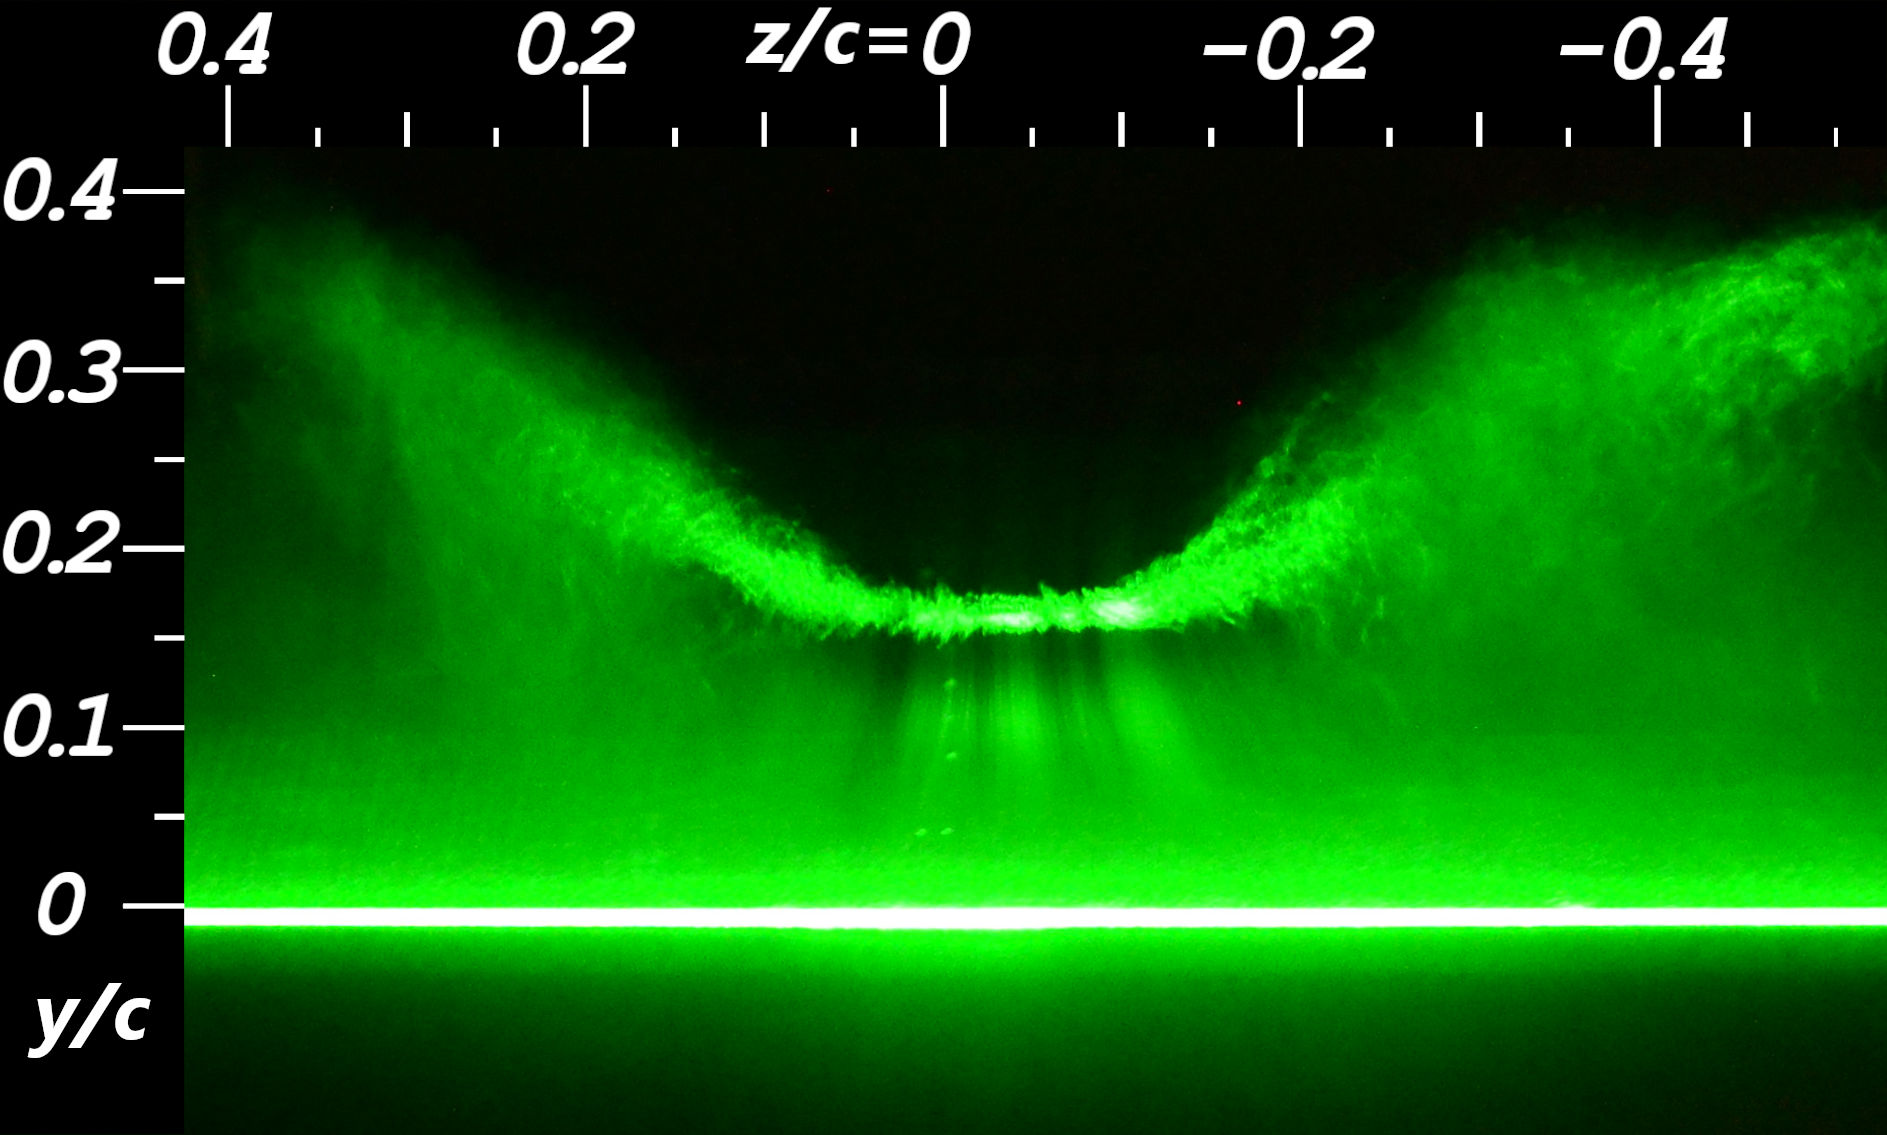
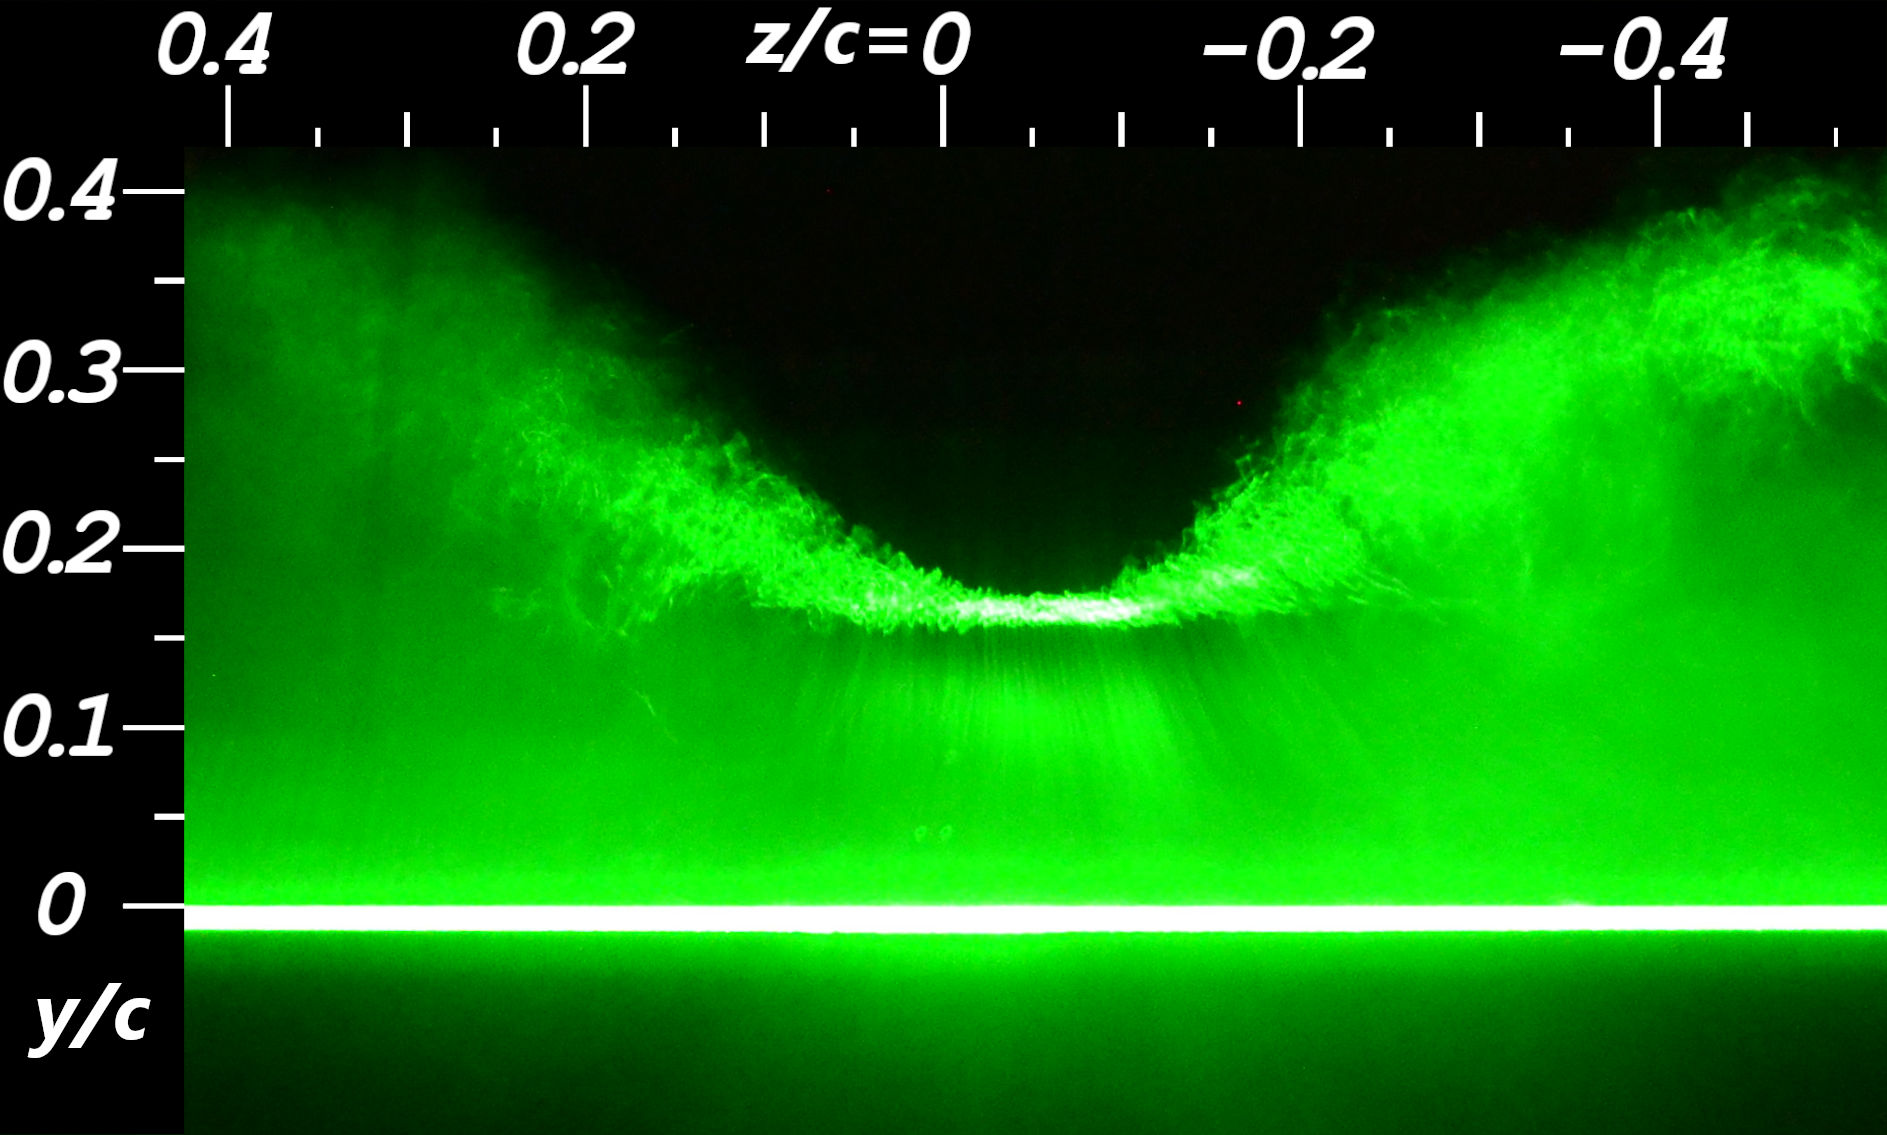
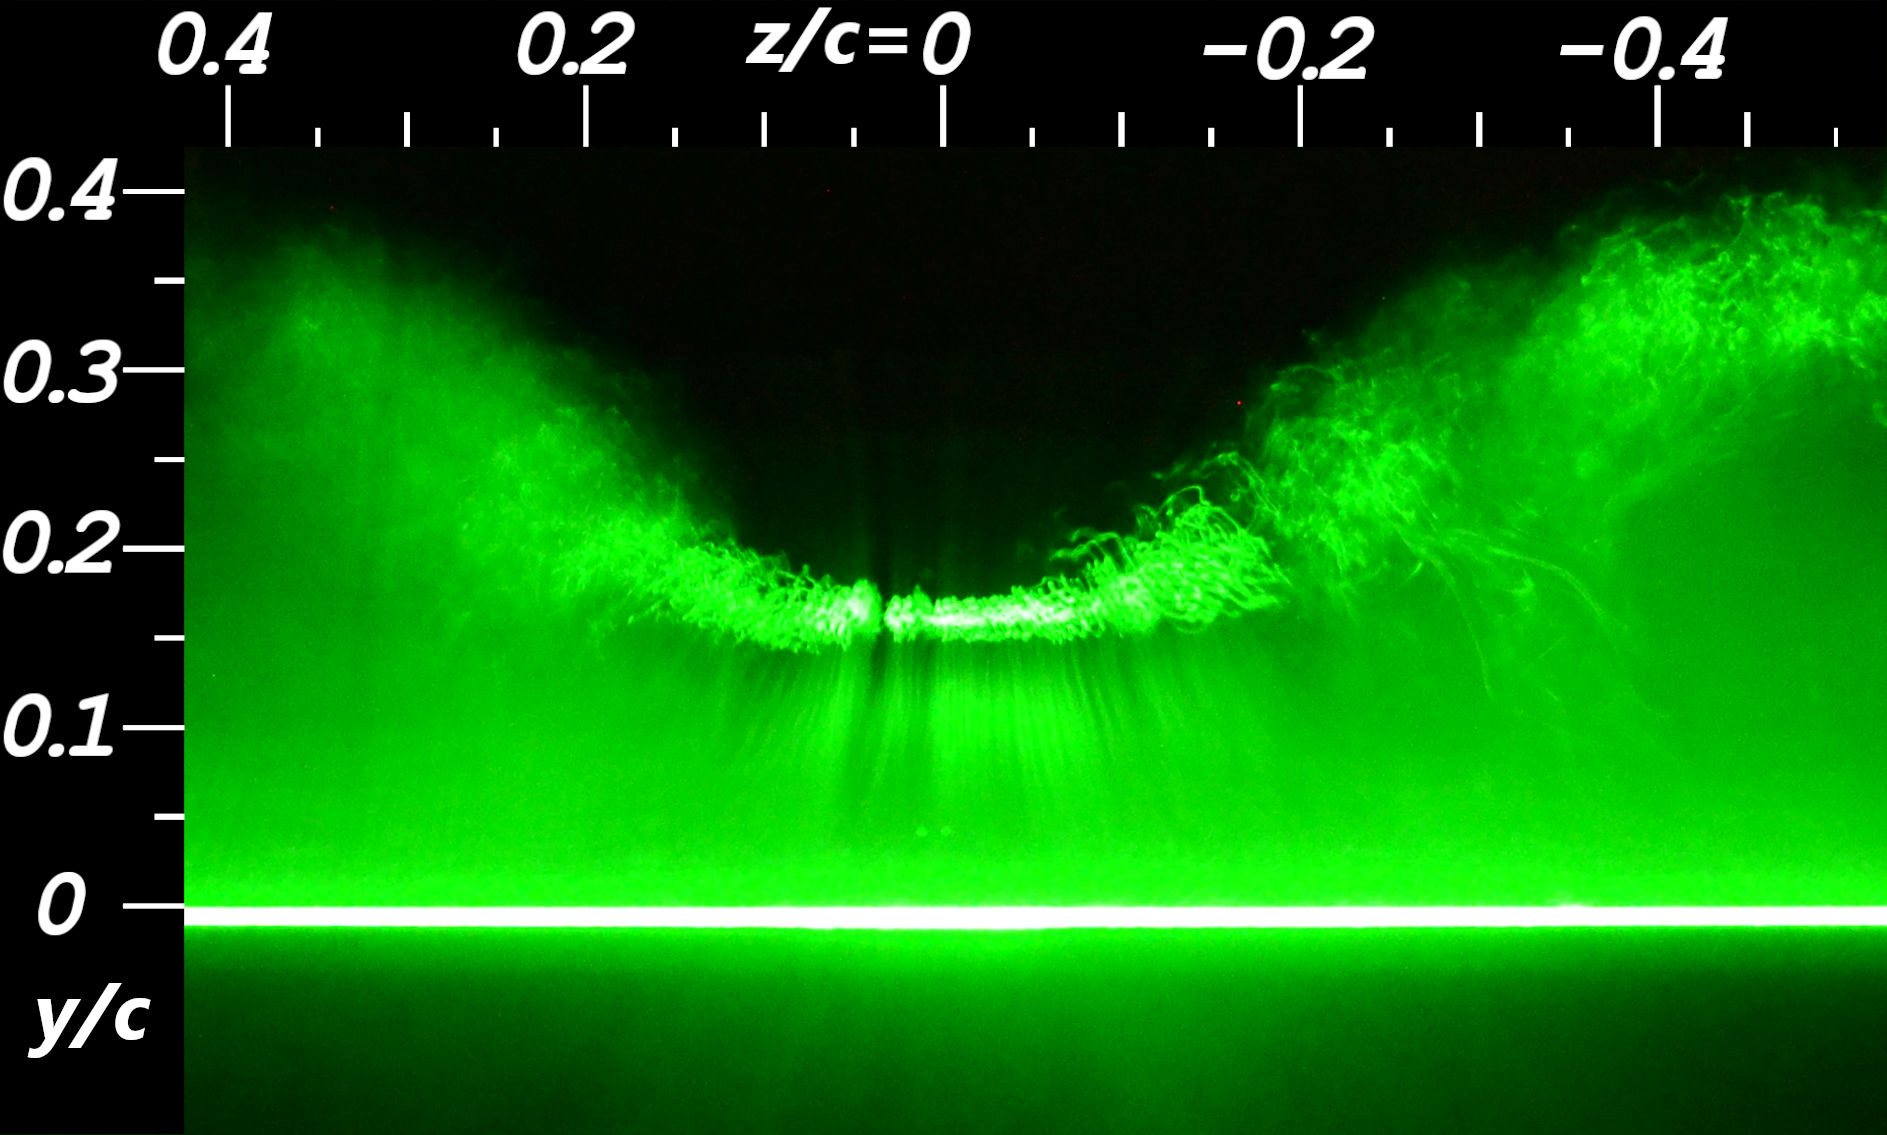
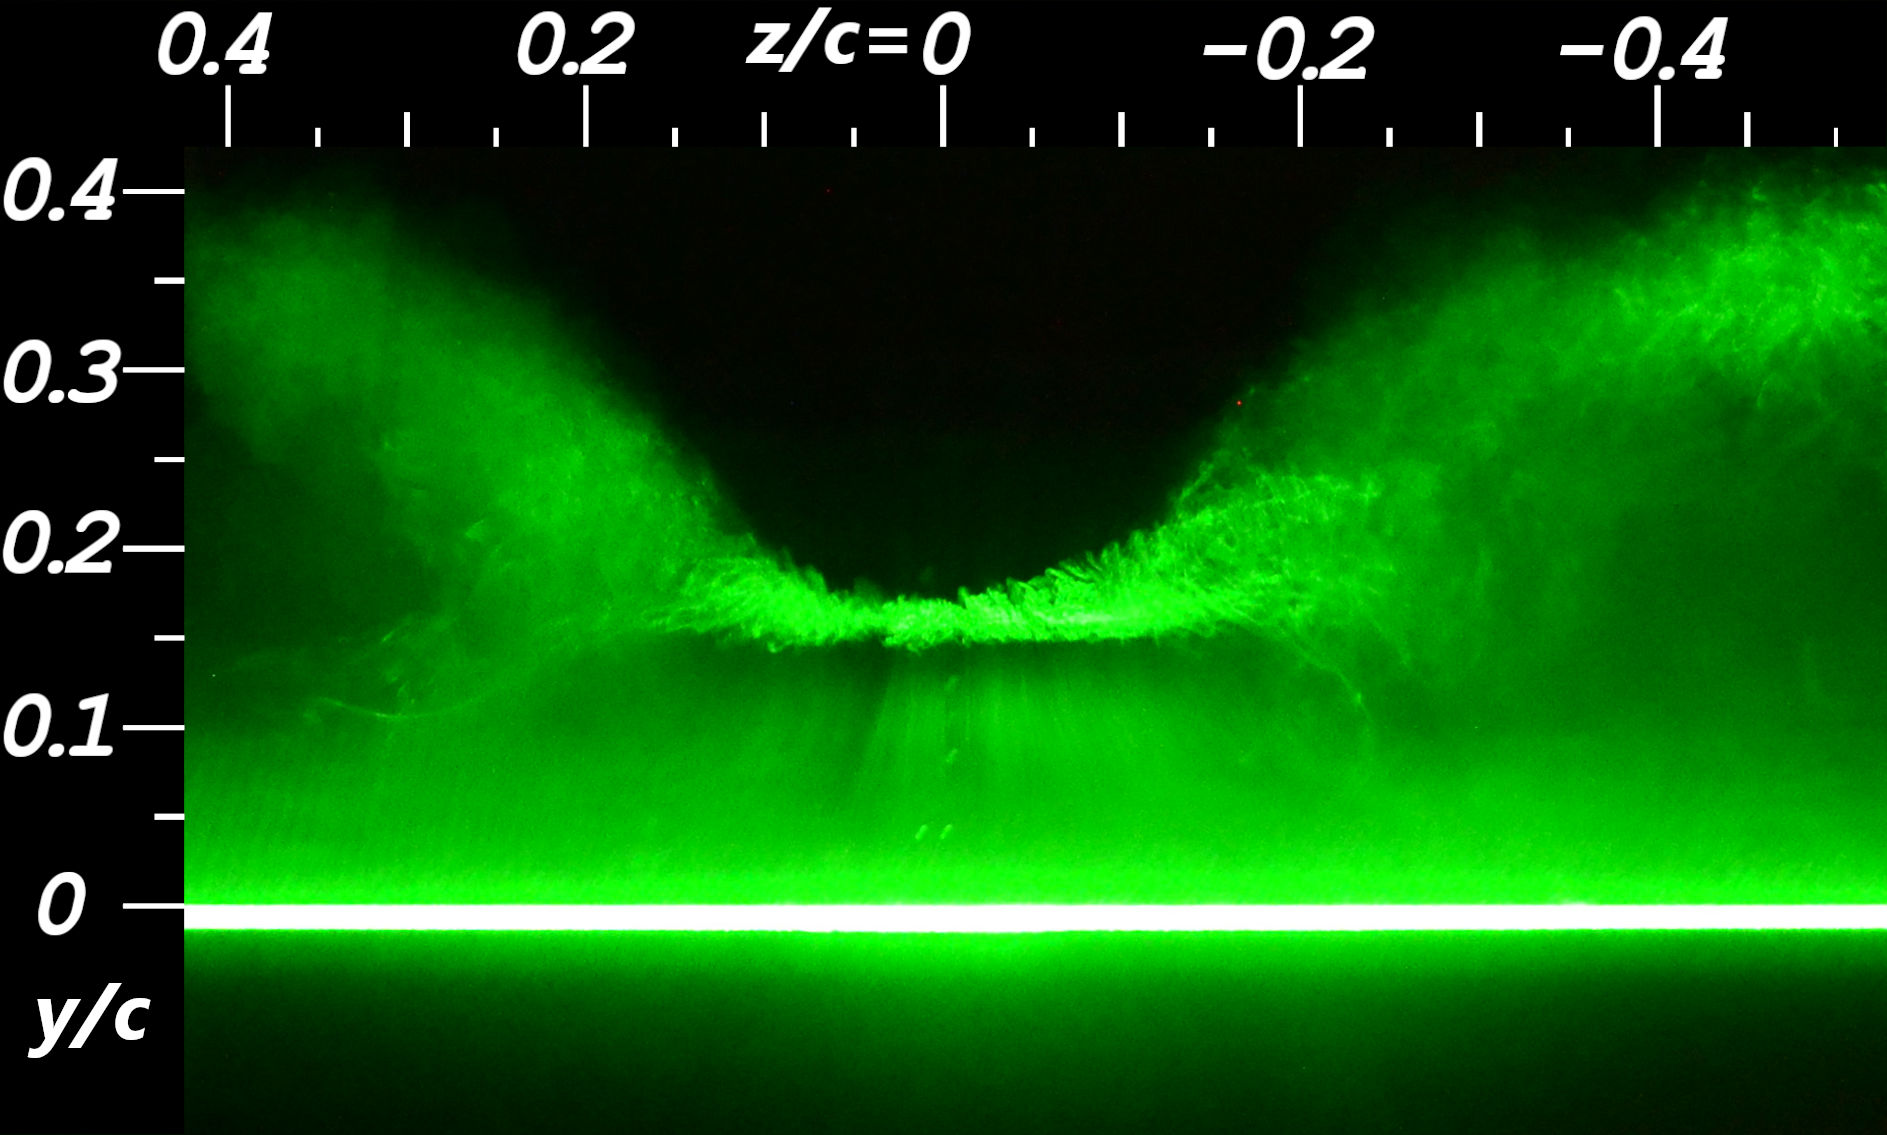
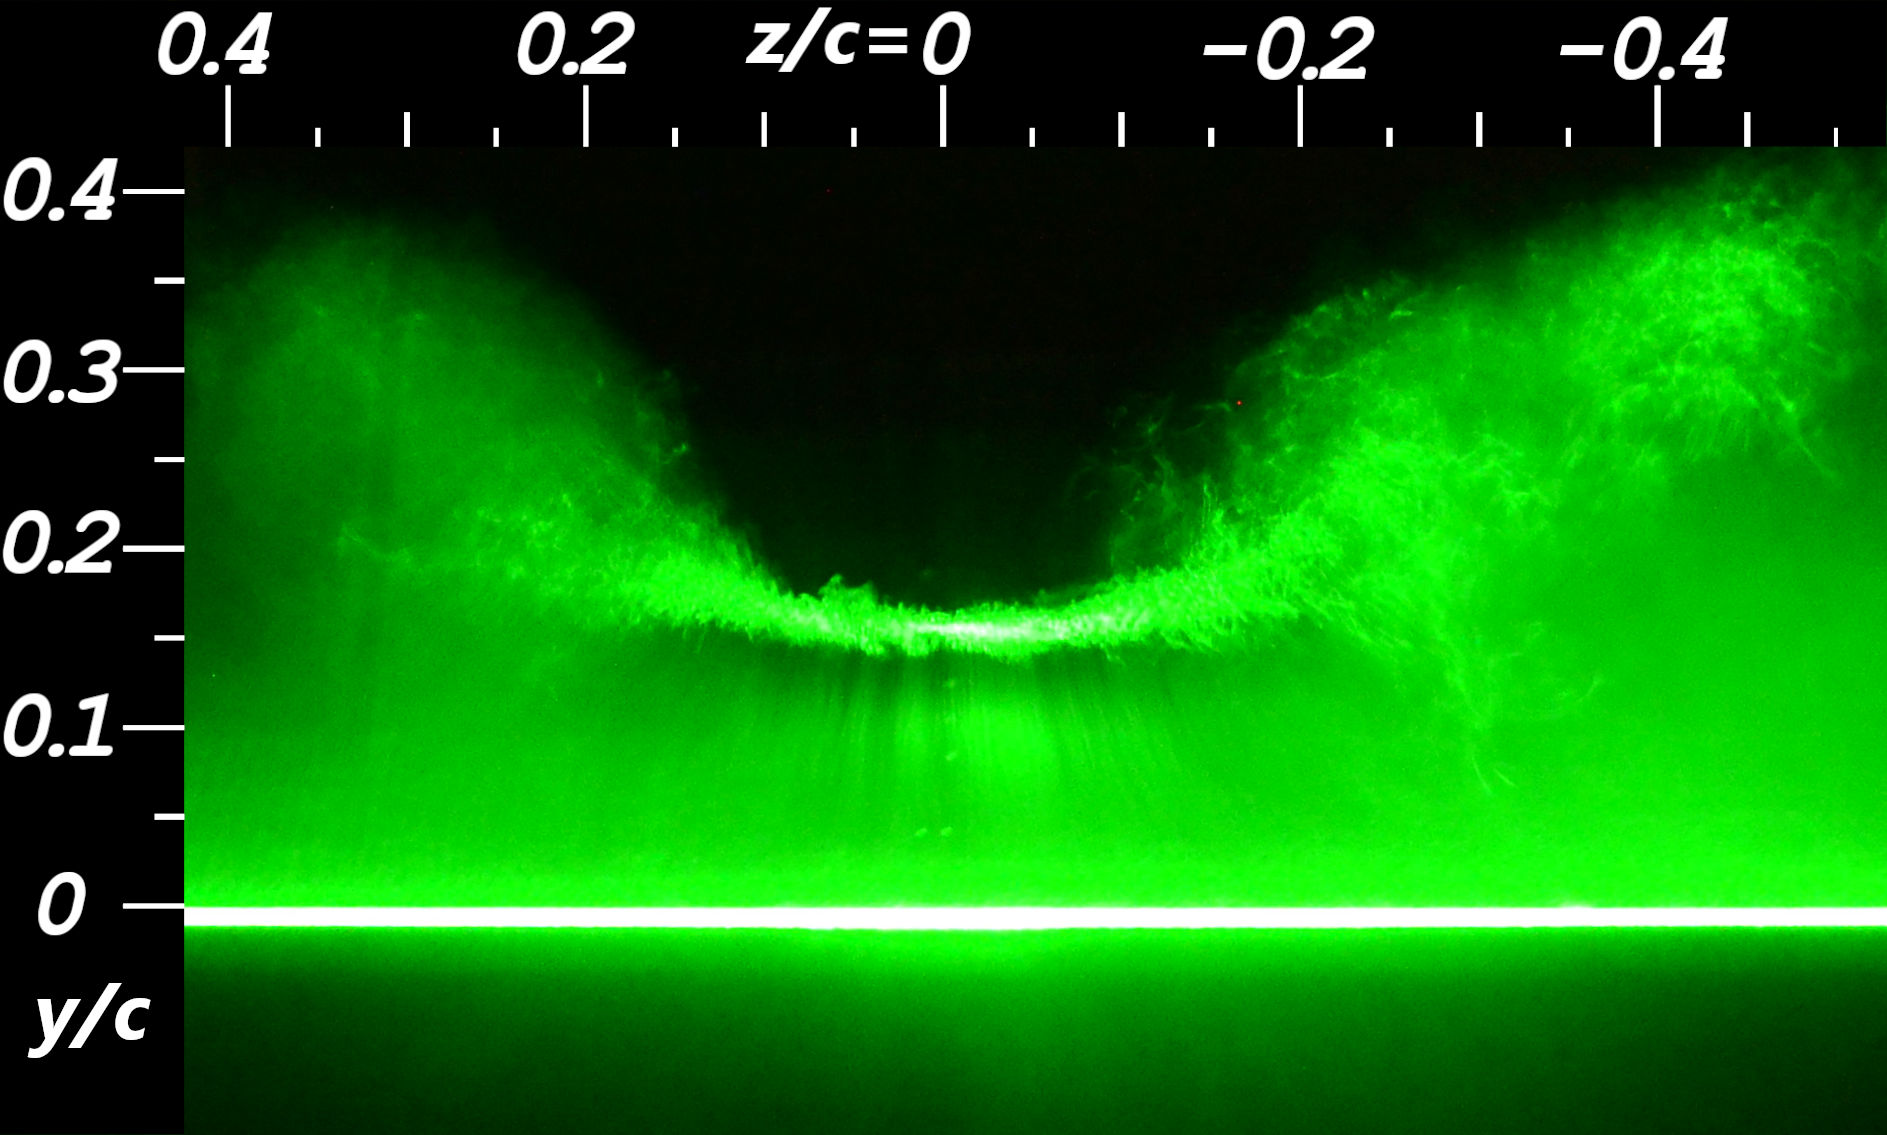
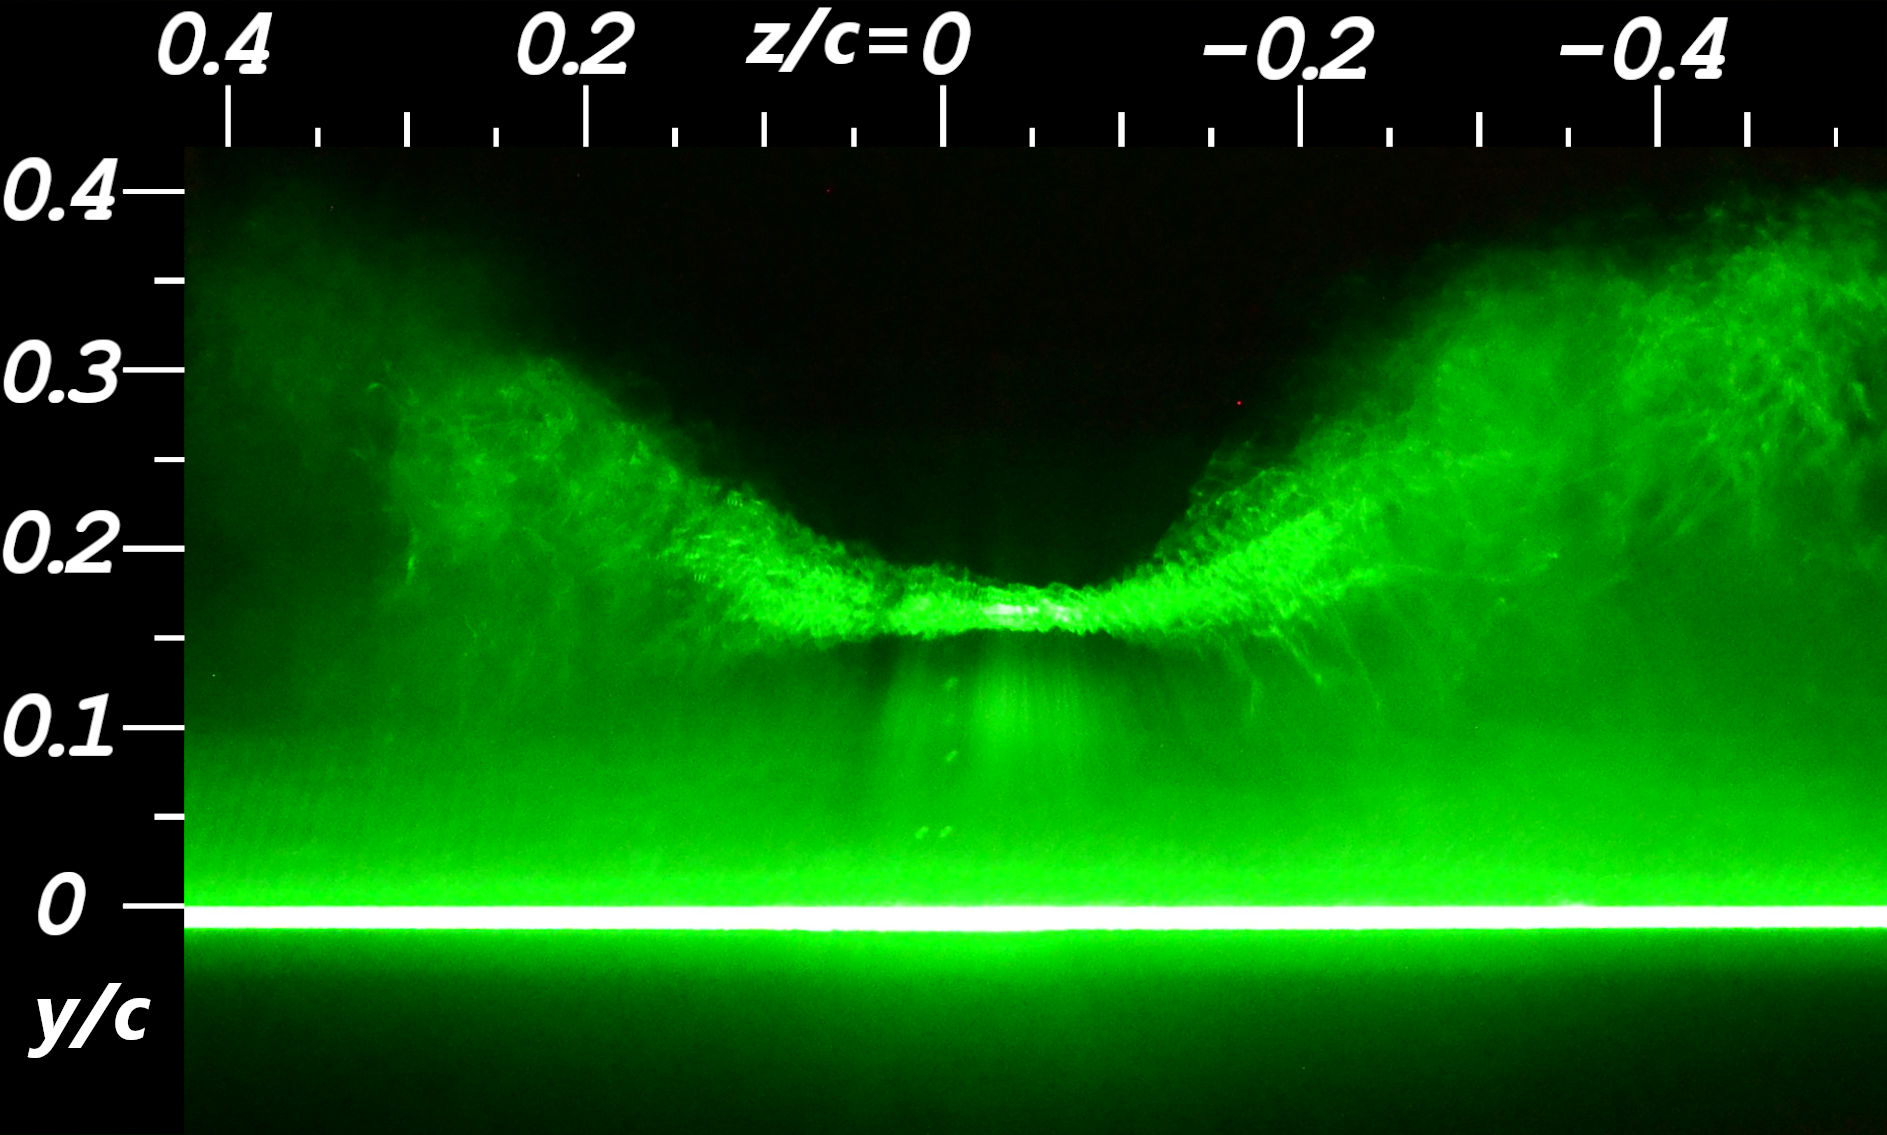
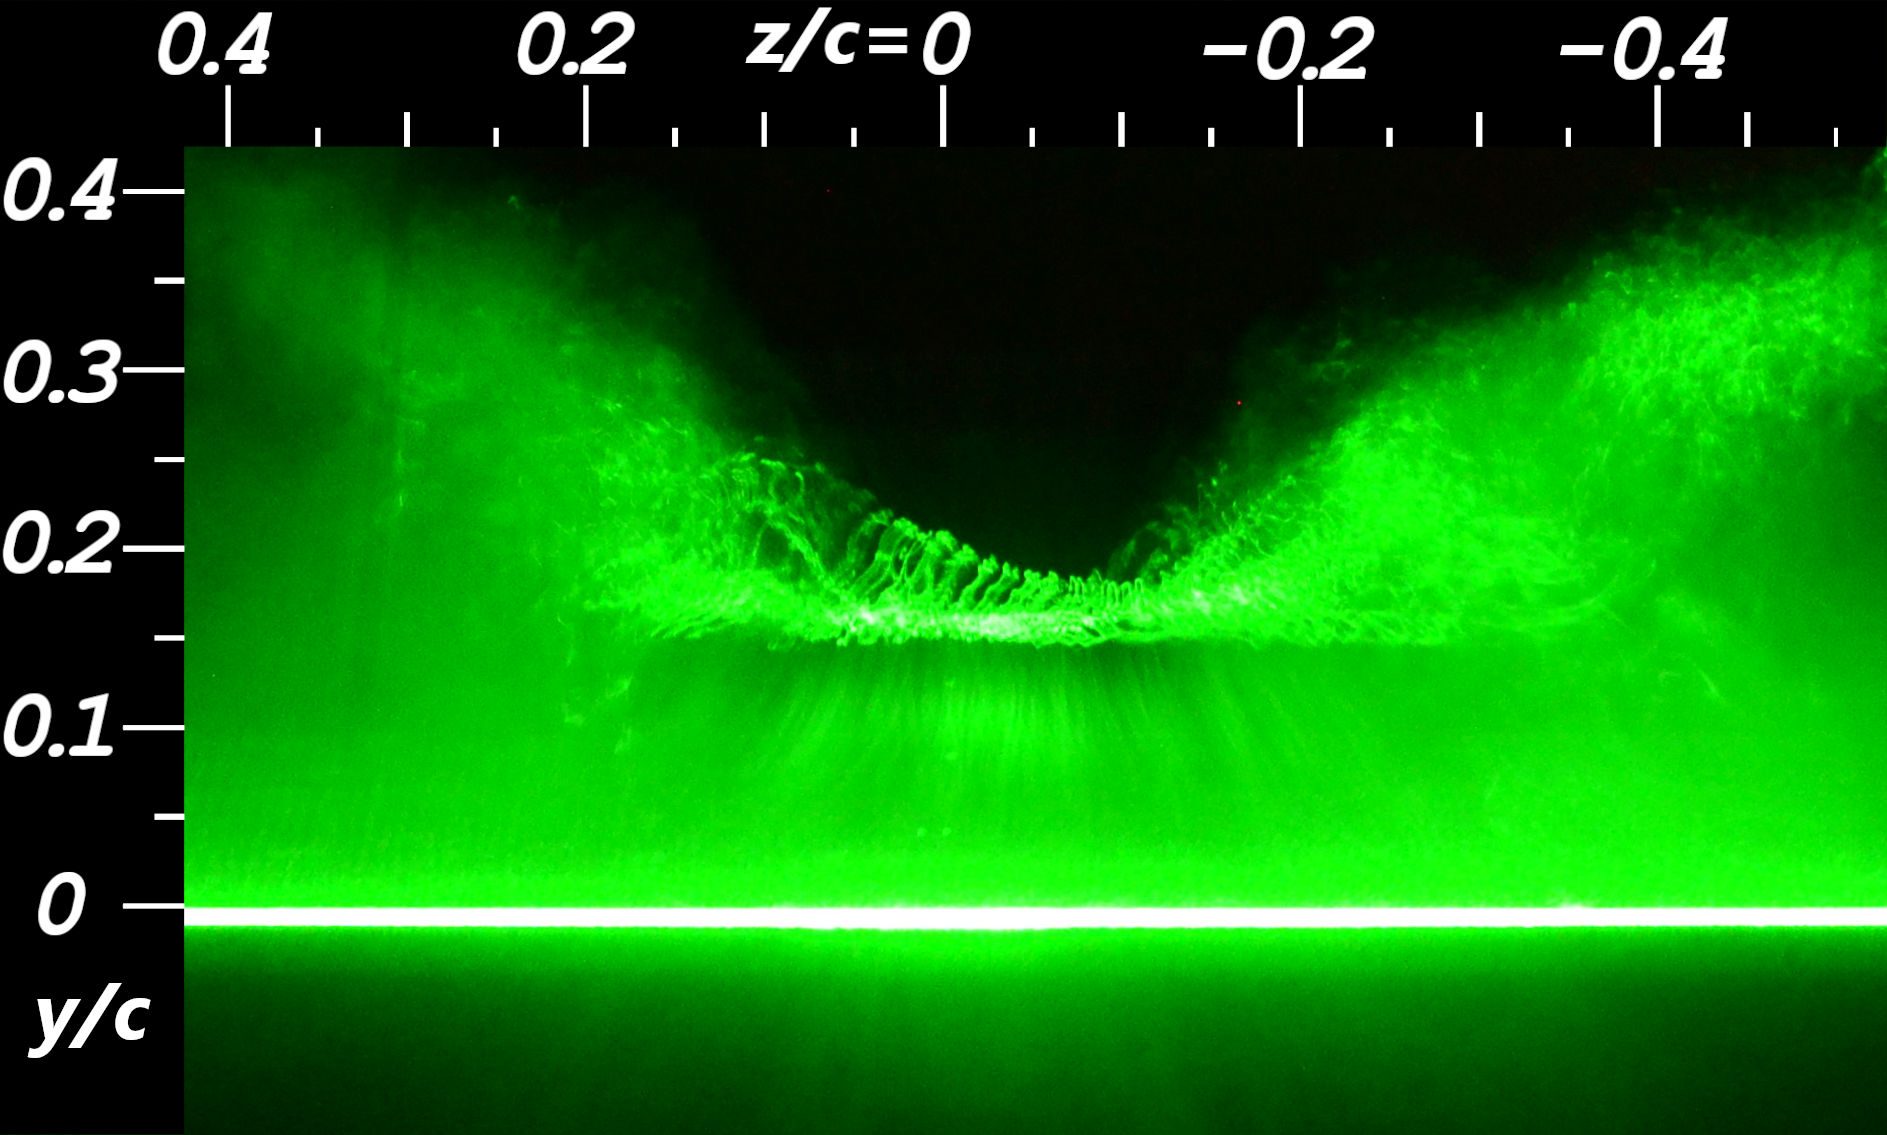
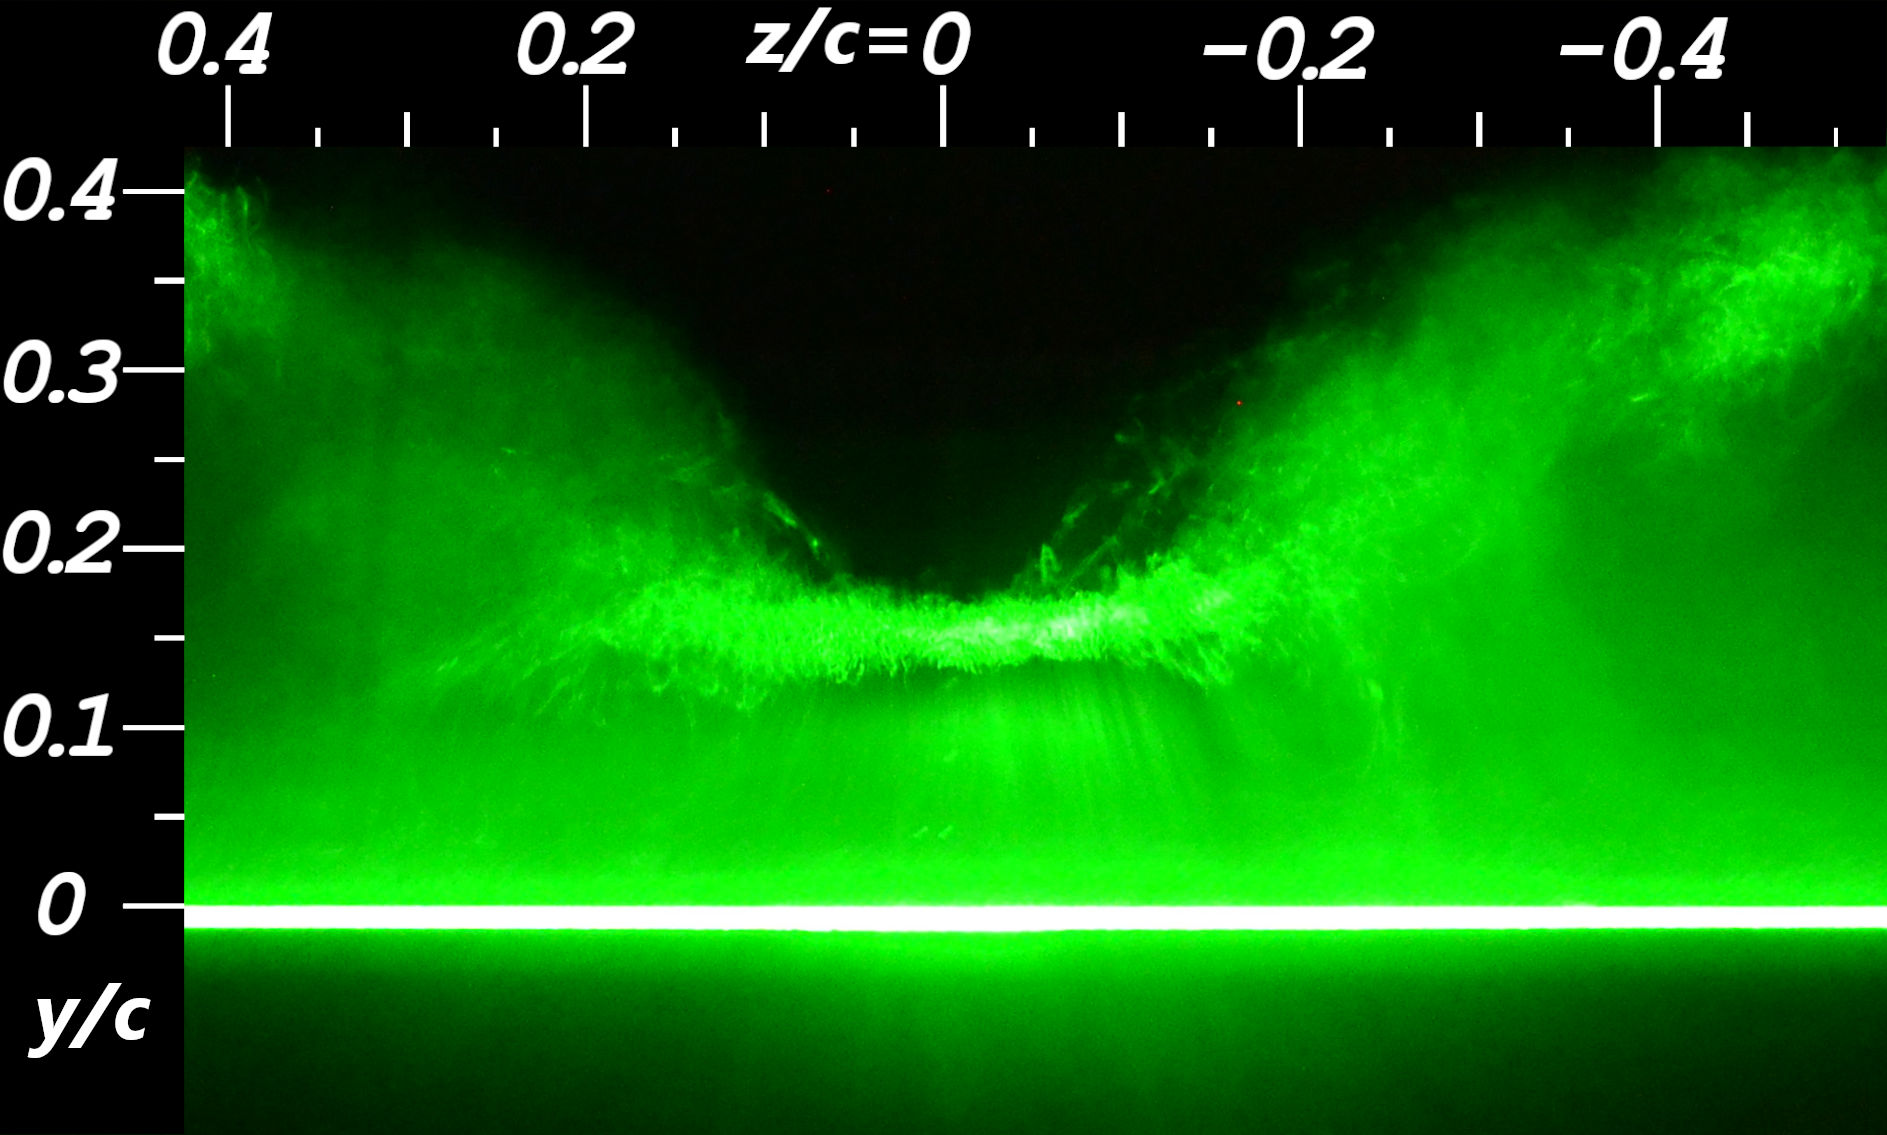
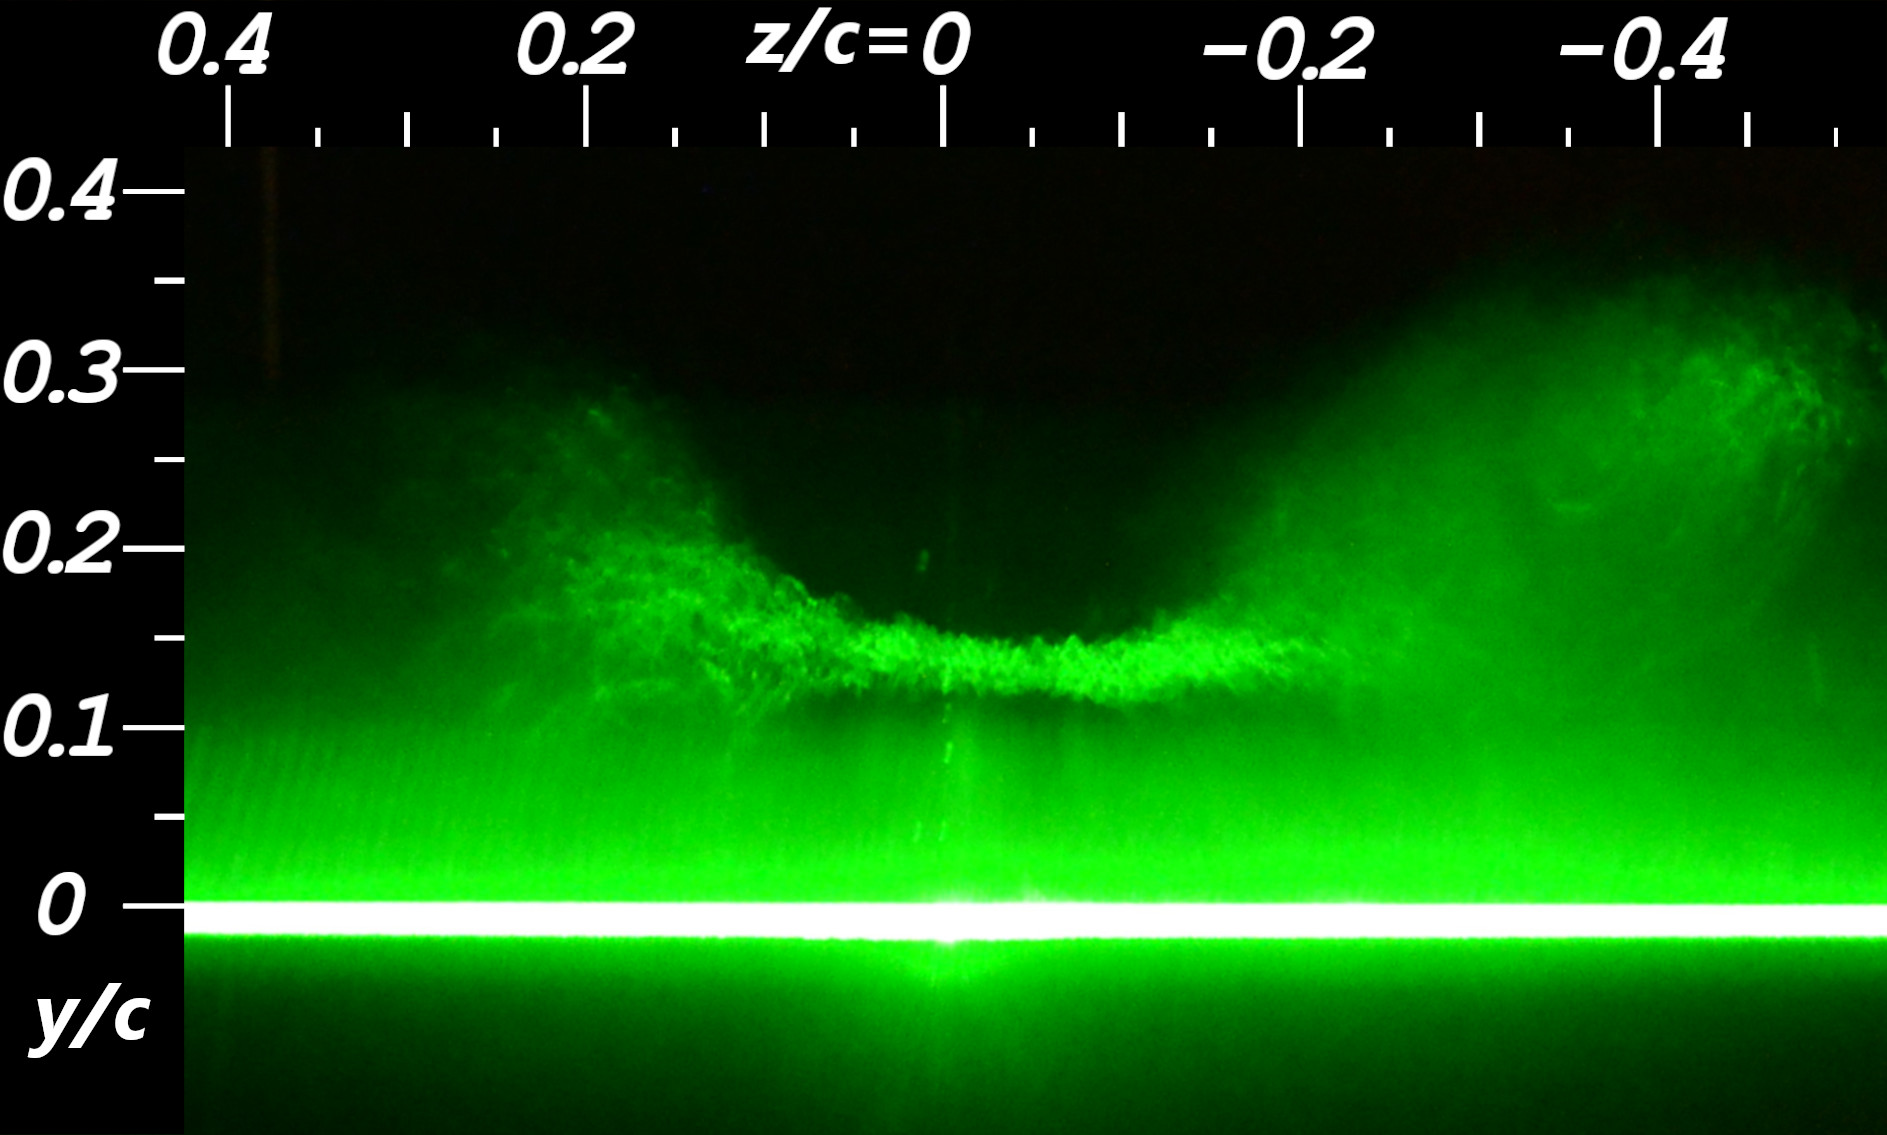
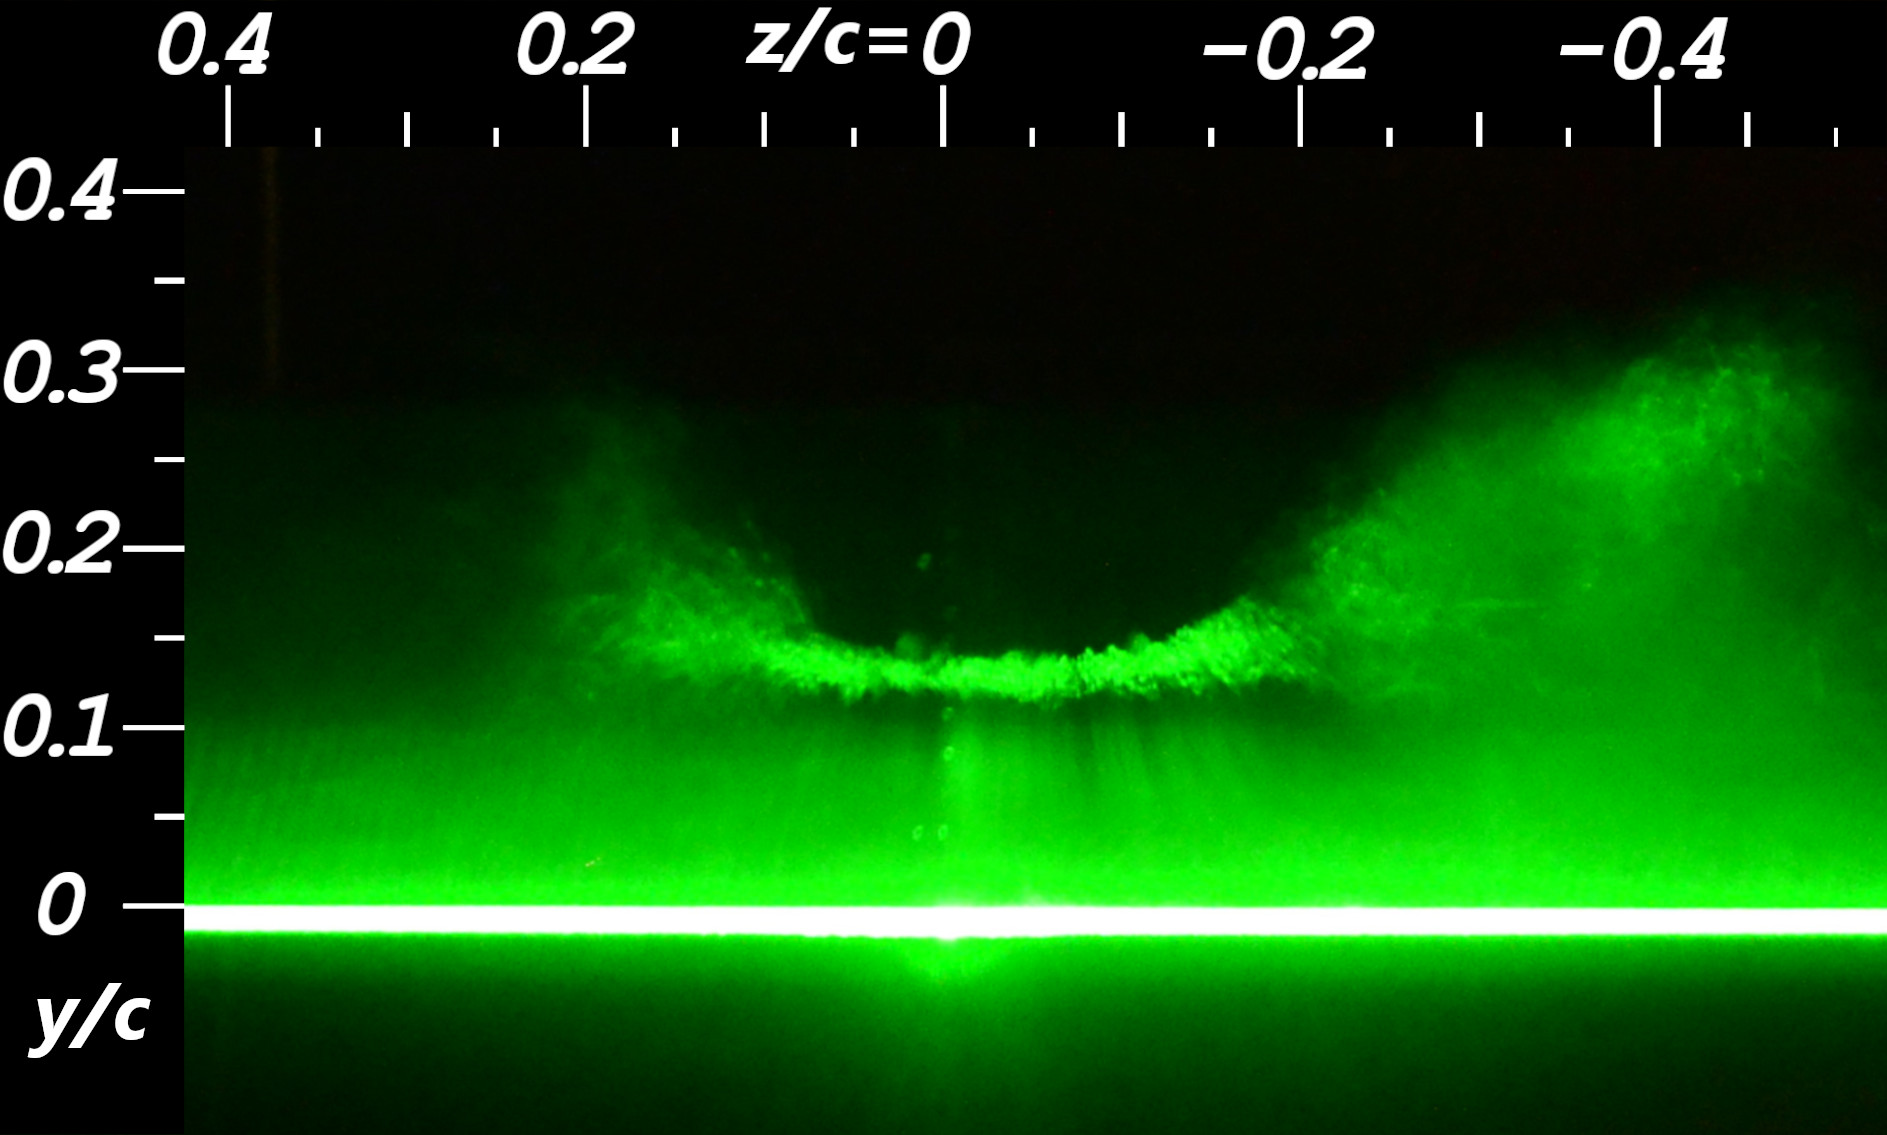
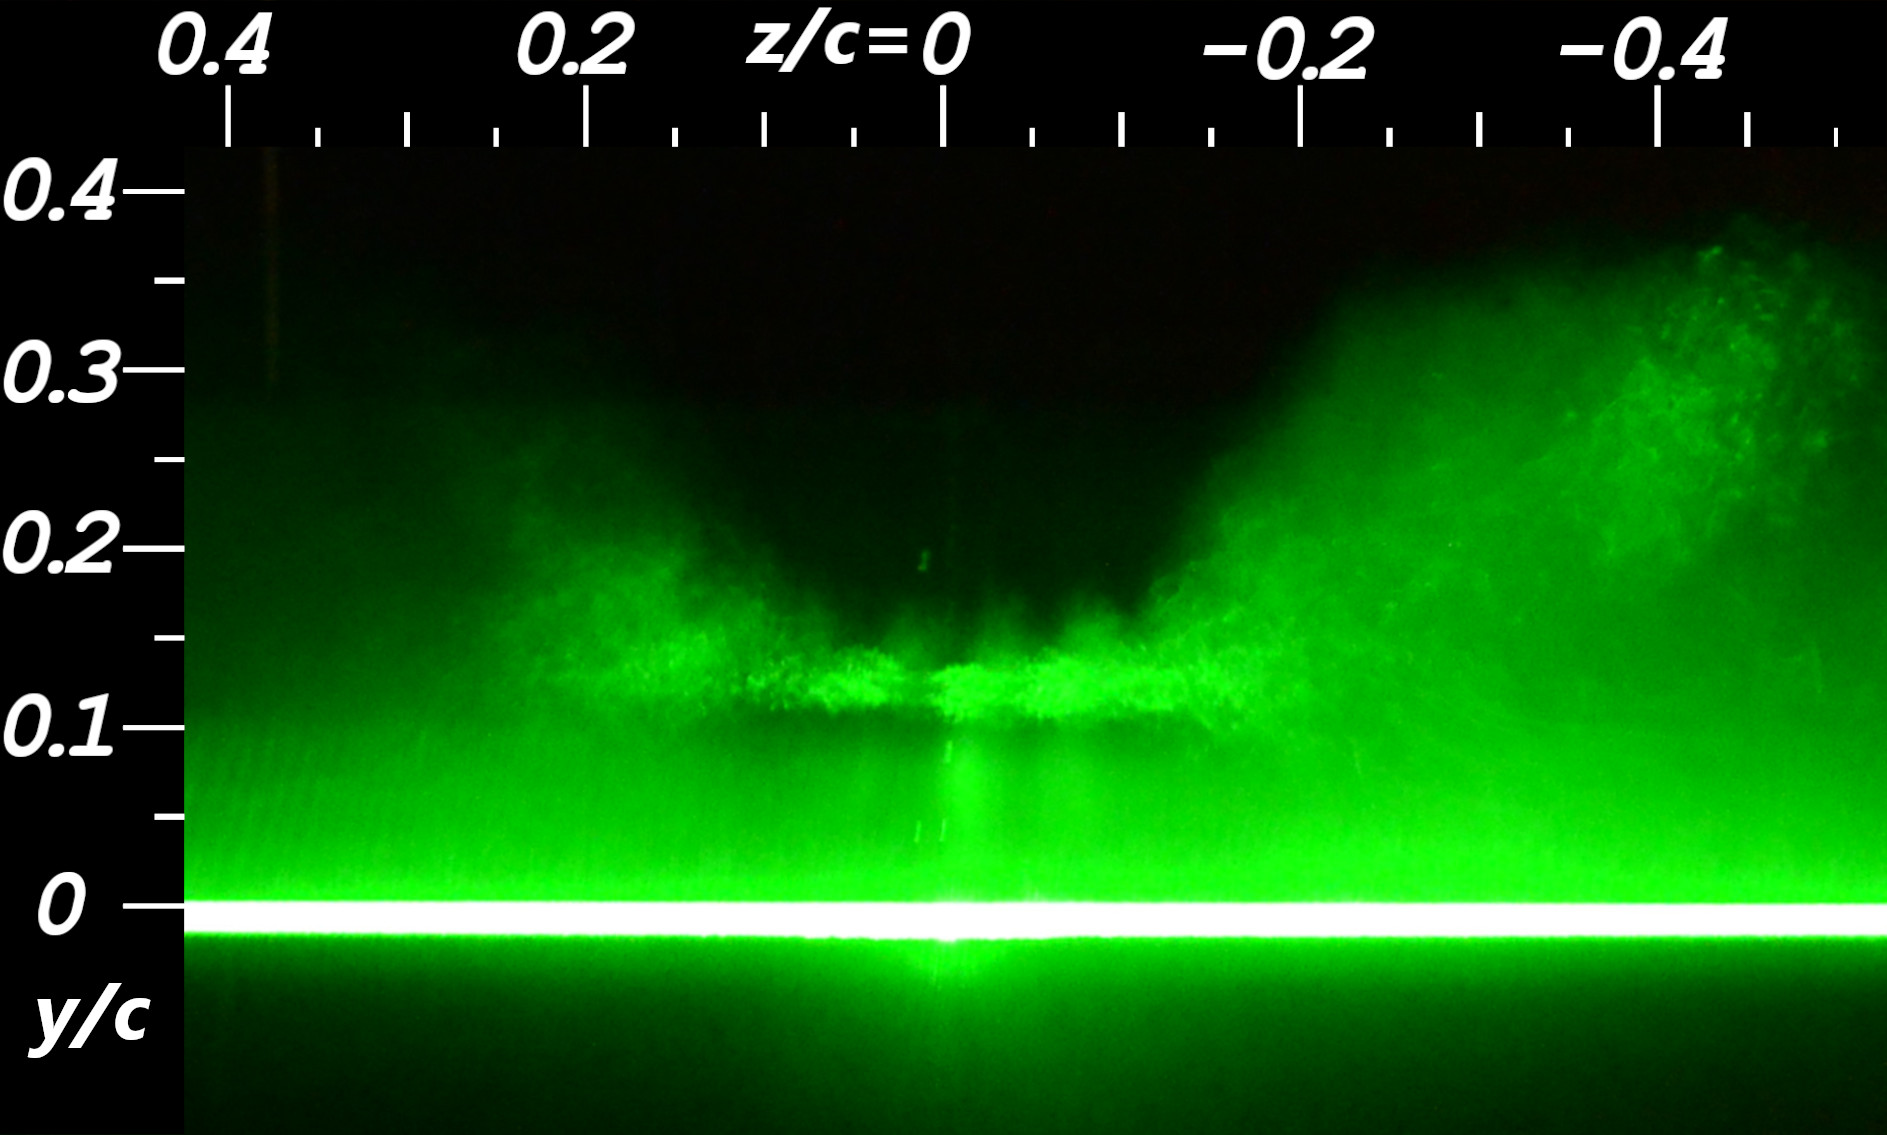
Cross-sectional smoke flow visualization in the spanwise-transverse plane was performed with a single horizontal smoke wire upstream of the wing. The horizontal smoke wire was positioned just above the airfoil’s stagnation point to visualize the flow at the edge of the shear layer. The horizontal smoke wire was installed upstream of the leading edge, as shown in blue in figure 3. The smoke wire length spanned slightly larger than the SJA array. Figure 3 shows how the horizontal wire (blue dashed line) is installed between two vertical support wires (yellow dash-dot lines). The horizontal wire was kept taut by making it slightly shorter than the distance between the vertical support wires so that they bowed inward. This also helped ensure the horizontal wire remained in the same position across all tests. The wire was coated with oil and then heated resistively to generate smoke streaks. A laser sheet, oriented perpendicular to the flow, illuminated the generated smoke at the trailing edge, providing a sectional visualization of the shear layer boundary (figure 6). A Nikon D7000 DSLR camera downstream of the airfoil and test section was used to image the smoke streaks. The camera was operated in burst mode, capturing up to six images per second, facilitating the capture of the smoke visualization at peak density. A long exposure time of 1/6 \unit (2.8 convective timescales) was used to provide a sense of the mean flow while capturing unsteady areas highlighted by motion blur. The camera was operated with an aperture of 1.8, and an ISO of 4000. Additional details on the smoke visualization method can be found in Machado et al. [36, 27].
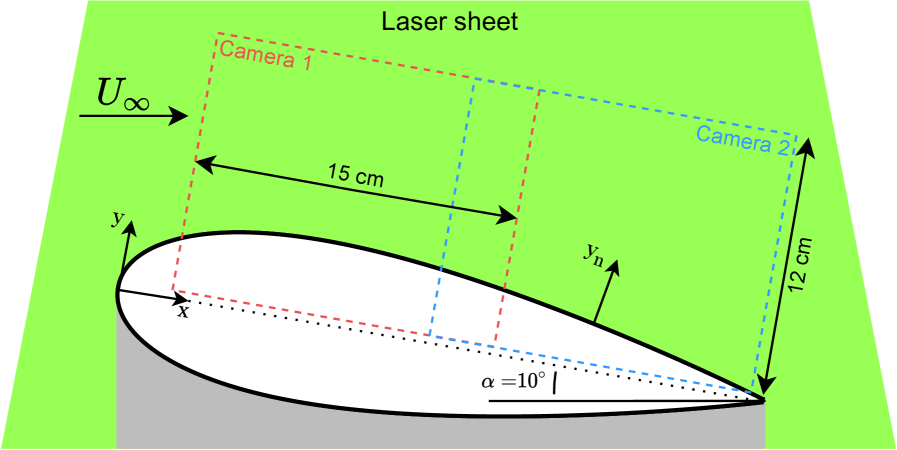
Particle image velocimetry (PIV) measured the streamwise-transverse velocity field above the airfoil. Neutrally, buoyant particles were introduced into the flow using a fog machine downstream of the test section. Two JAI SP-5000M-USB cameras, each with a resolution of 2560 2048, were positioned outside the test section and aligned with the airfoil’s chord. Composite images were created by stitching together the camera captures, resulting in a field of view (FOV) measuring , with a pixel resolution of (figure 7). The stitched FOV effectively captured the range and , covering the area of interest above the airfoil. A Litron Bernoulli Nd-YAG laser with a wavelength of was passed through converging and diverging cylindrical lenses ( \unit\milli and \unit\milli, respectively) to create a thin laser sheet that illuminated the measurement plane. The image acquisition and laser pulses were synchronized using an NI PCIe-6323 data acquisition card (DAQ) at , and 1000 image pairs were recorded for each measurement. The time delay between the frames in an image pair was set to . The random error in the mean velocity is estimated to be less than based on a convergence study. For the control cases, phase-locked velocity measurements were achieved by synchronizing image acquisition at eight evenly spaced phases relative to the SJA modulation frequency, where a phase angle of represents the activation of the actuator. Coherent fluctuations are extracted from the velocity signal using the triple decomposition [42]. The streamwise velocity was decomposed as , where is the time-averaged velocity, is the coherent velocity obtained from the phase-average, and is the fluctuation velocity [43]. Velocity vectors were obtained using open-source software OpenPIV-Python-GPU, utilizing a multi-pass cross-correlation algorithm to accurately record large and small displacements. The PIV process involved an initial iteration at an interrogation window size of 64 64 pixels, followed by two iterations at 32 32 pixels, and two iterations at 16 16 pixels. Linear window deformation was used to reduce correlation errors in high-shear regions.
3 Results and Discussion
3.1 Parametric study of duty cycle and blowing ratio
The power consumption of the SJA array, measured at various operating voltages and DCs, is presented in figure 8(a). The results reveal a clear linear dependence of the power consumption on the DC, as indicated by the lines of best fit. Secondly, an increase in voltage leads to higher power consumption and a steeper slope in the relationship between power consumption and DC, i.e. increases, as expected. Figure 8(b) shows the relationship between the momentum coefficient and the power input. The power consumption measurements are the same data points from figure 8(a), and the momentum coefficients are assumed to scale linearly with the DC.
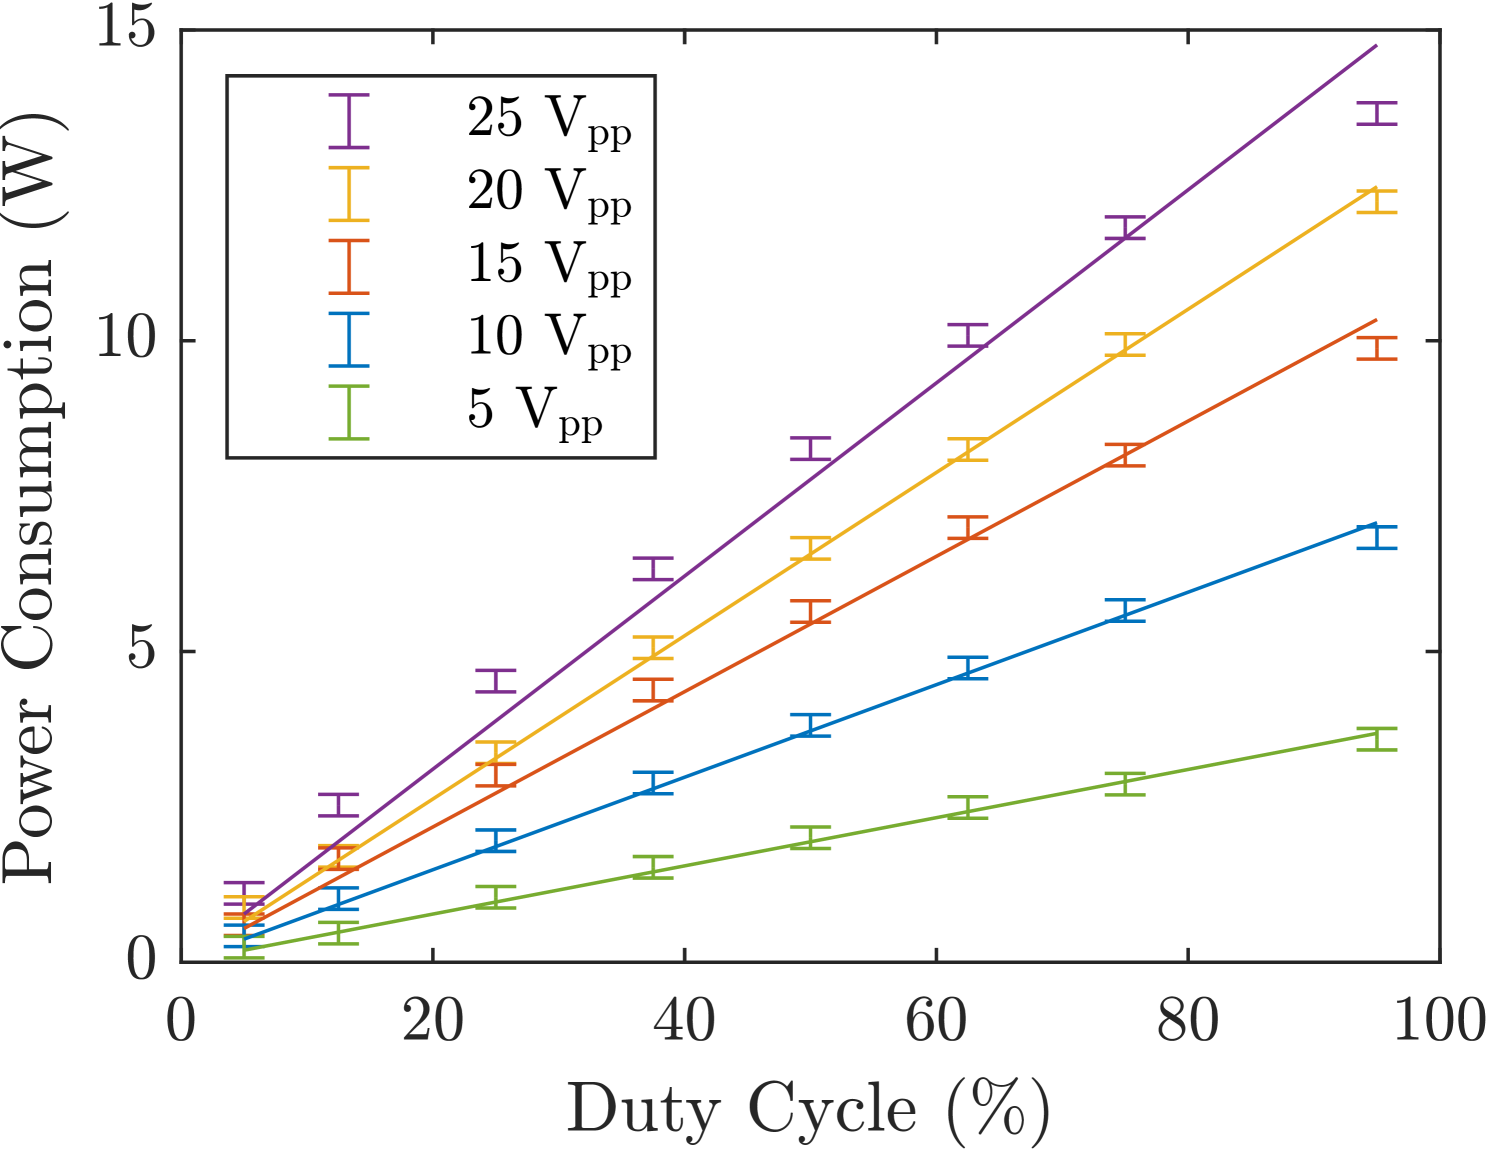
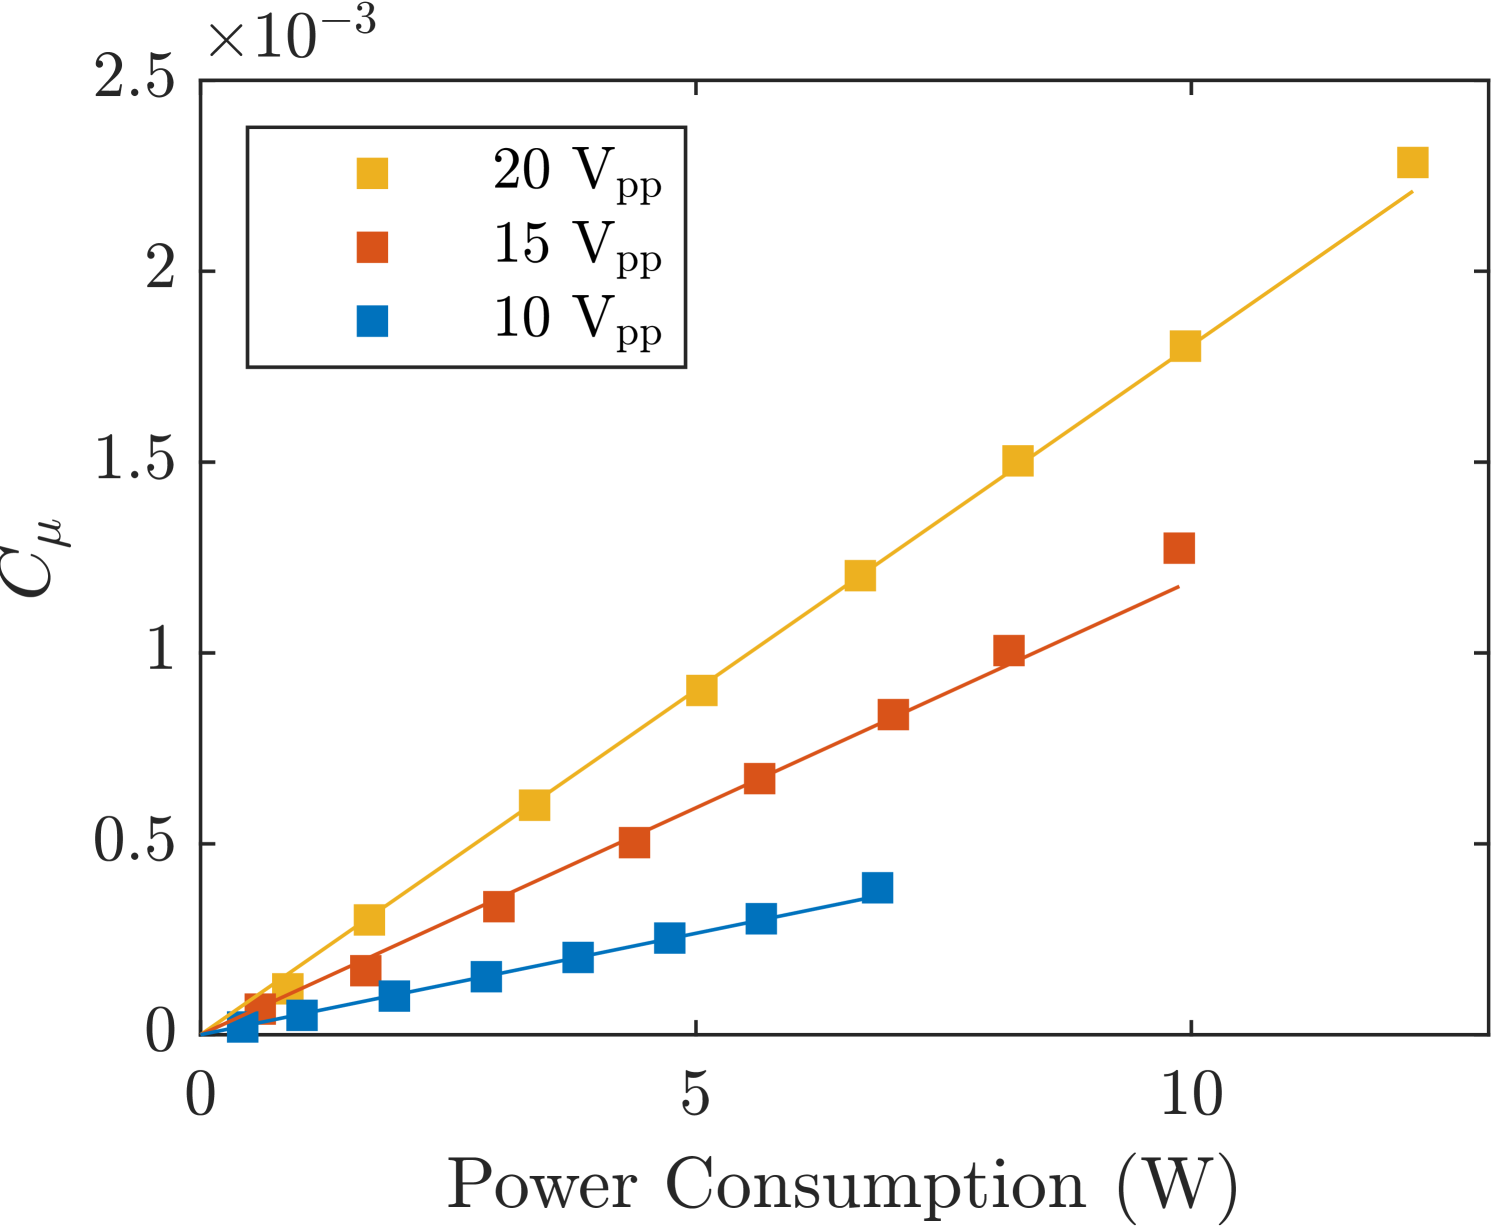
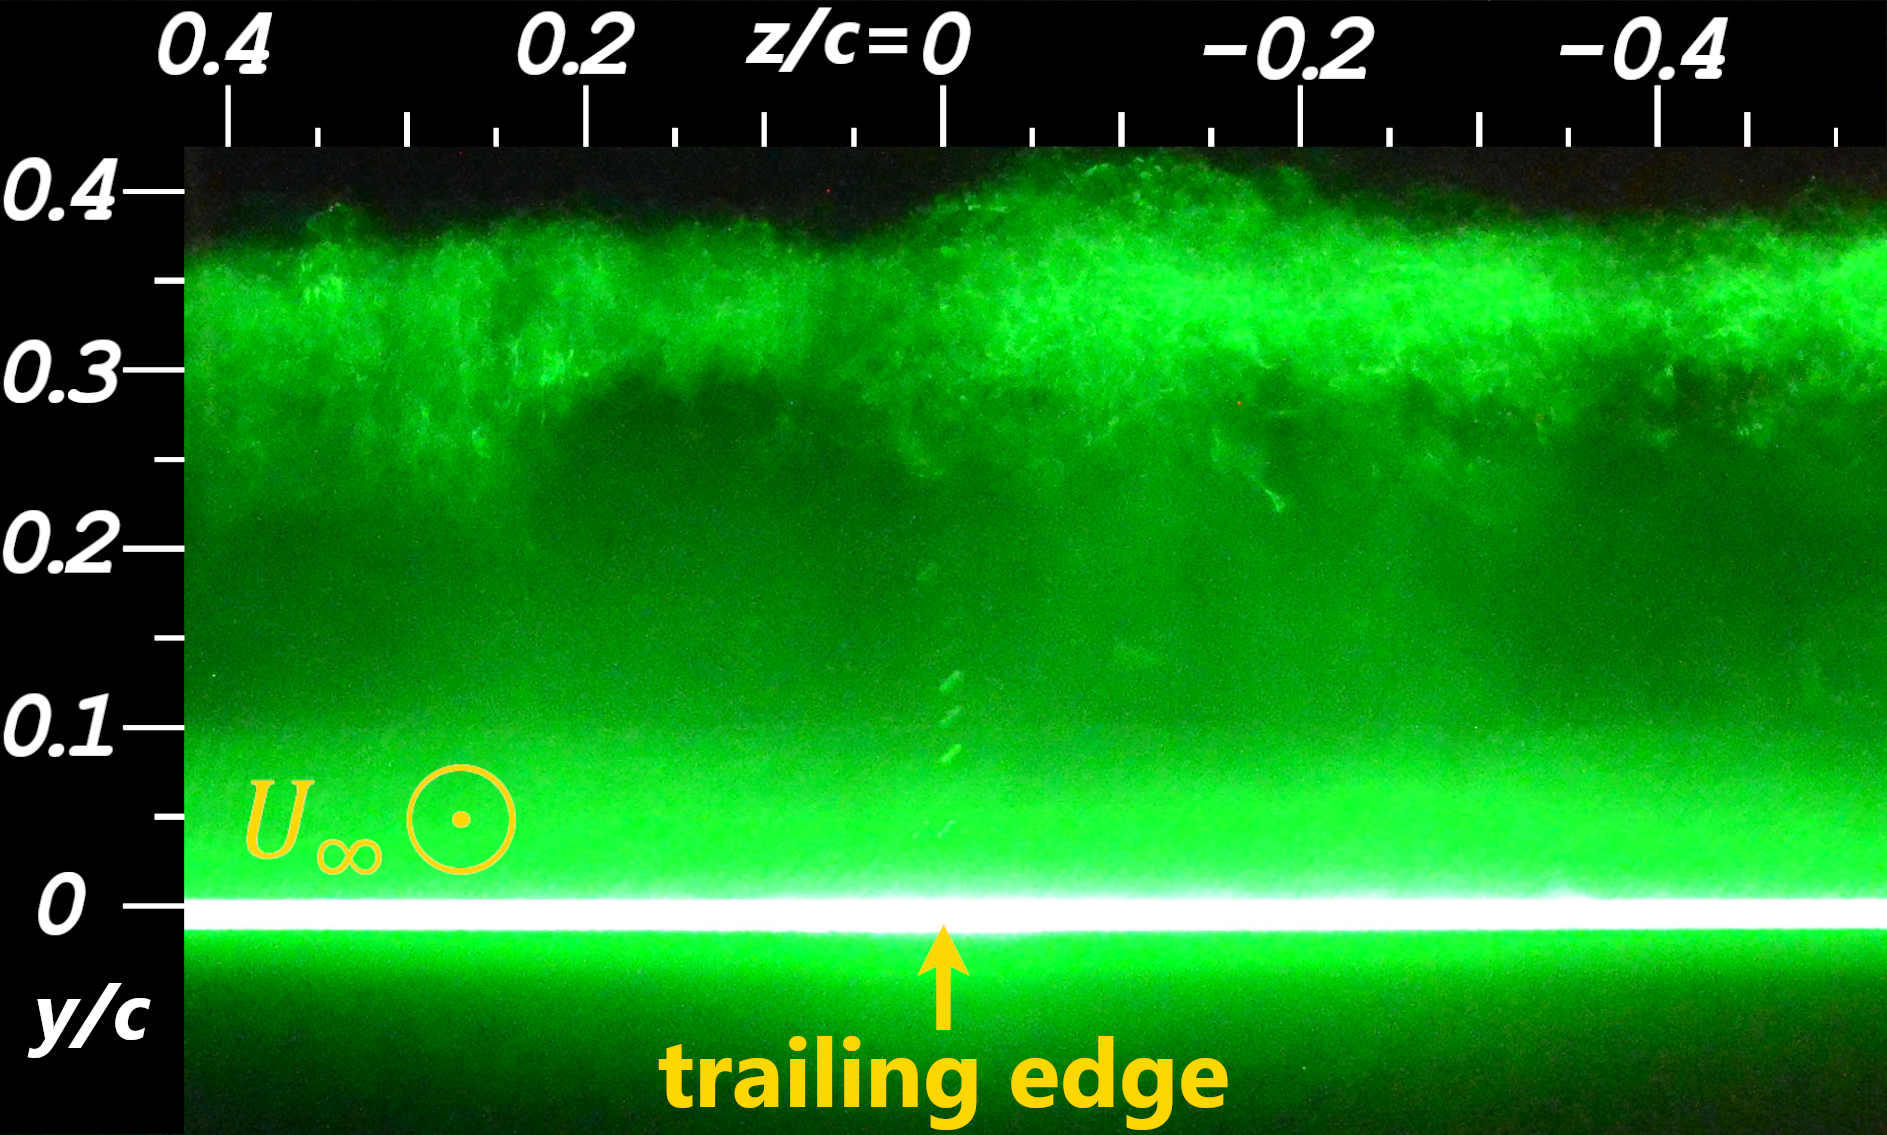
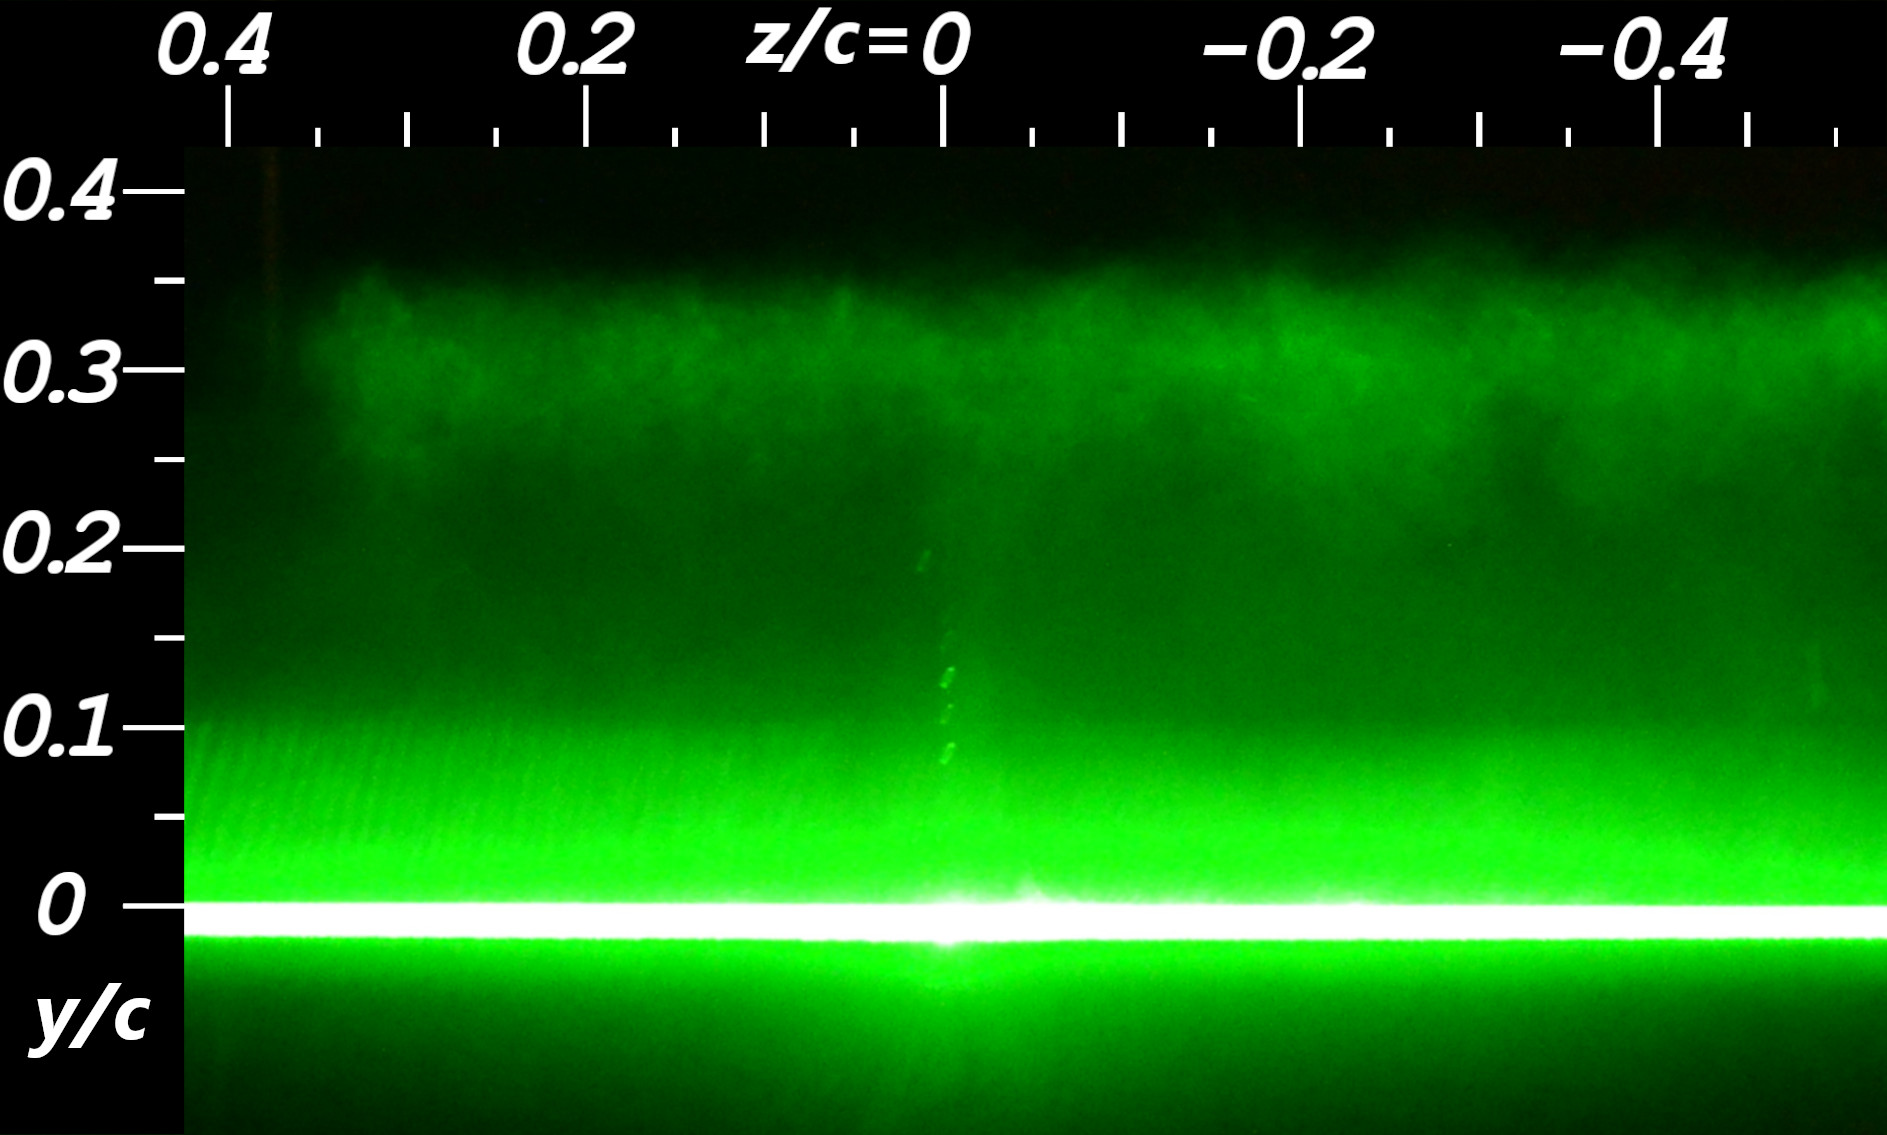
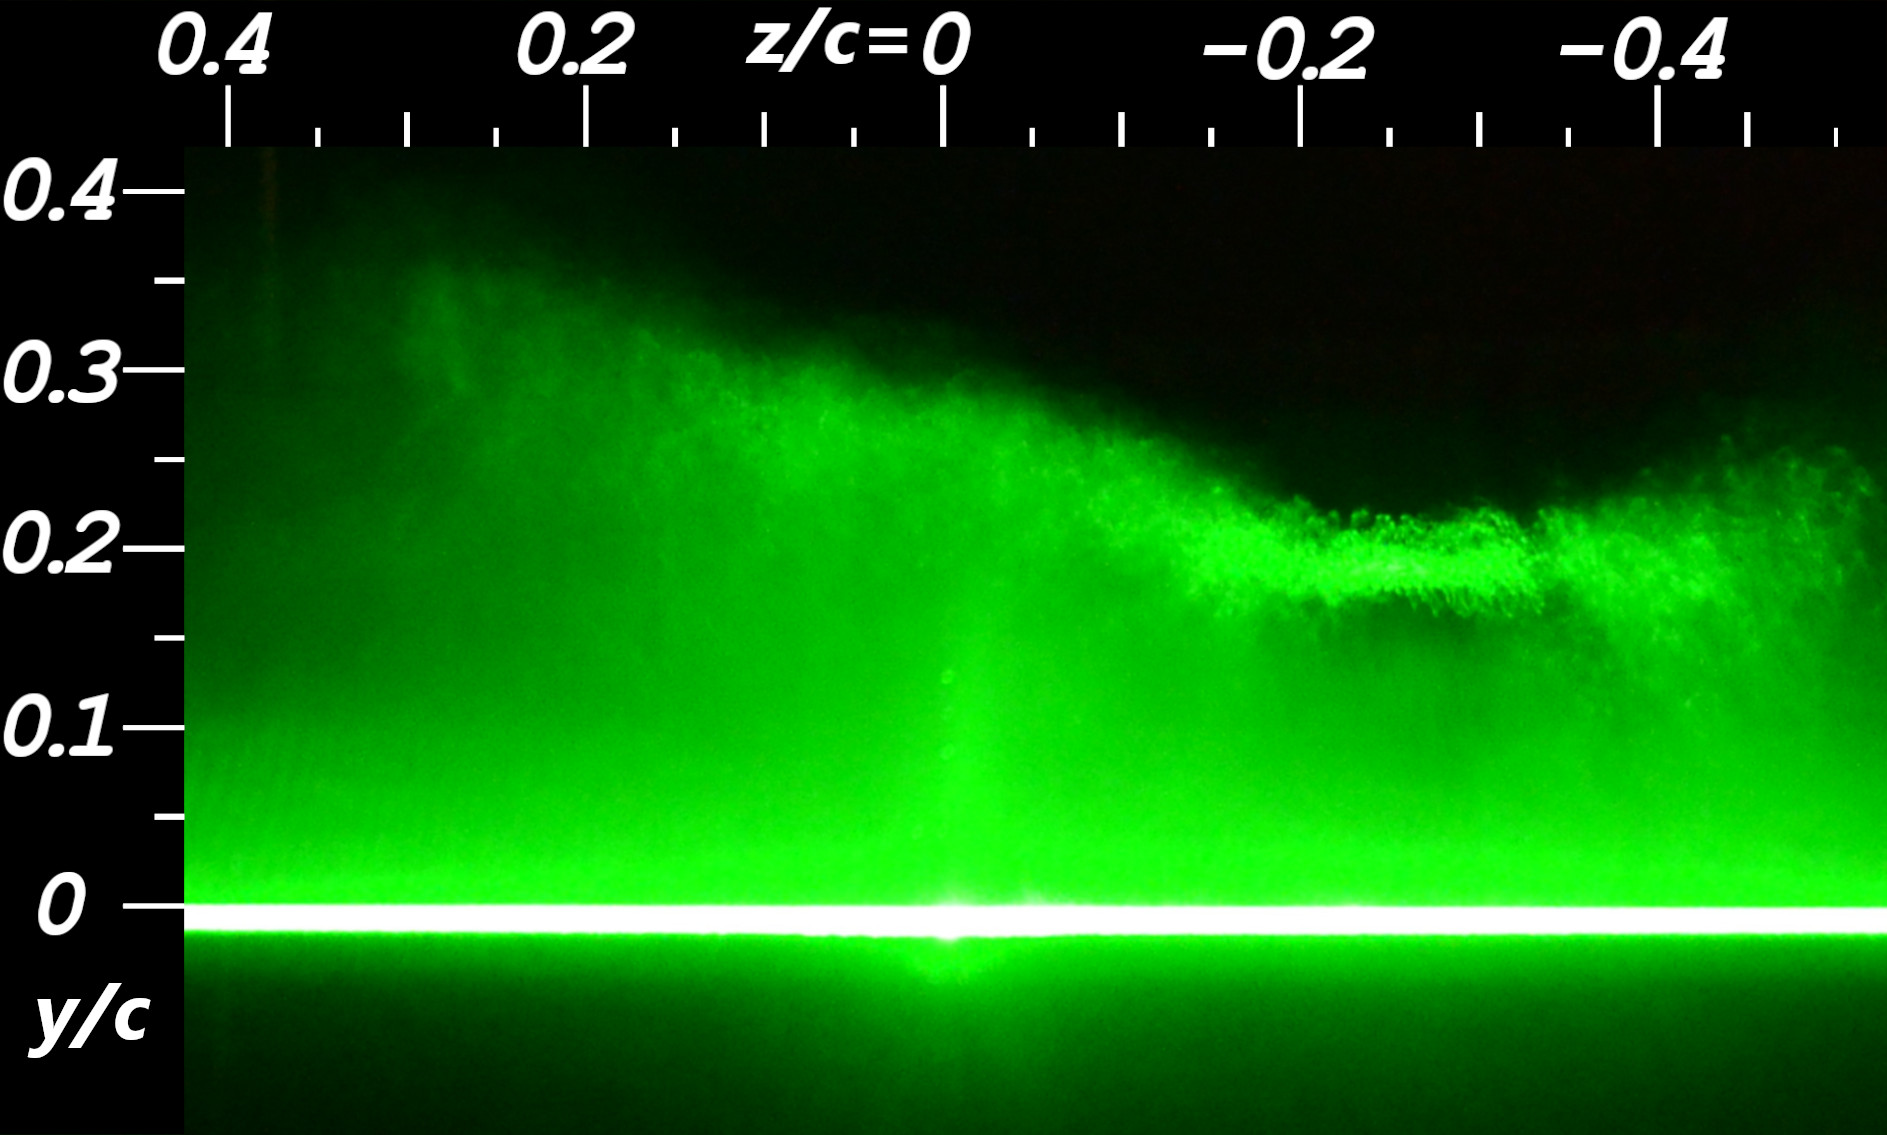
Figure 9 presents sectional flow visualizations at the trailing edge for 15 selected control cases and the baseline case, providing insights into the shear layer thickness, stability, and spanwise control authority under various control parameters. In the baseline stalled case (figure 9(a)) a large area of diffuse smoke is observed above the airfoil. At the two lowest power cases (figures 9(b) and 9(c)), the flow fails to fully reattach as indicated by the diffuse smoke above the midspan. This observation is consistent with findings from Feero et al. [20] and Goodfellow et al. [17], which showed that a threshold momentum coefficient must be reached to achieve lift recovery and drag reduction. The unique case of and DC will be discussed in detail. All 13 other control strategies, effectively mitigate shear layer separation at the midspan, resulting in stall recovery (figures 9(d) to 9(p)). The SJA array is most effective at controlling the flow at the midspan, where the shear layer is the thinnest and most steady. As the spanwise distance increases, the shear layer grows, as evidenced by the ‘U’ shape observed in the visualized smoke. The outer flow () deteriorates into a turbulent, separated state with recirculation, resembling the baseline case, which has been documented previously [36, 27, 41]. The effective spanwise control length for the reattached cases, marked by the dense smoke regions closest to the airfoil, is estimated to be between and , depending on the control case. Figure 9(e) illustrates the effects of an overly power-conservative control strategy. With actuation at a low-DC and blowing ratio, the shear layer at the midspan is noticeably larger than in the other reattached control cases, as indicated by the presence of smoke higher in the -direction. Additionally, the shear layer is fairly unsteady, indicated by the wider spread of smoke, and the spanwise control authority suffers, with the control region being noticeably shorter than in the other cases. An increase in either the DC or the blowing ratio results in a thinning of the shear layer and a tighter spread of smoke – indicating increased stability and greater spanwise control authority. This is aligned with prior oil flow visualizations, which revealed that increasing the blowing ratio via the input voltage can lead to a larger reattached flow region [25]. These observations indicate that increasing either the DC or the blowing strength can lead to aerodynamic improvements; however, trends indicating further improvements with higher power control strategies are not evident from the smoke visualizations. The spanwise control length reaches a maximum at approximately of the length of the SJA array due to the effect of the highly turbulent uncontrolled region beyond the extent of the array, as detailed by Machado et al. [36]. This highlights that achieving greater spanwise control authority remains challenging, even with high-power control strategies. Diminishing returns with higher power strategies suggest that more efficient control methods with lower power requirements are achievable.
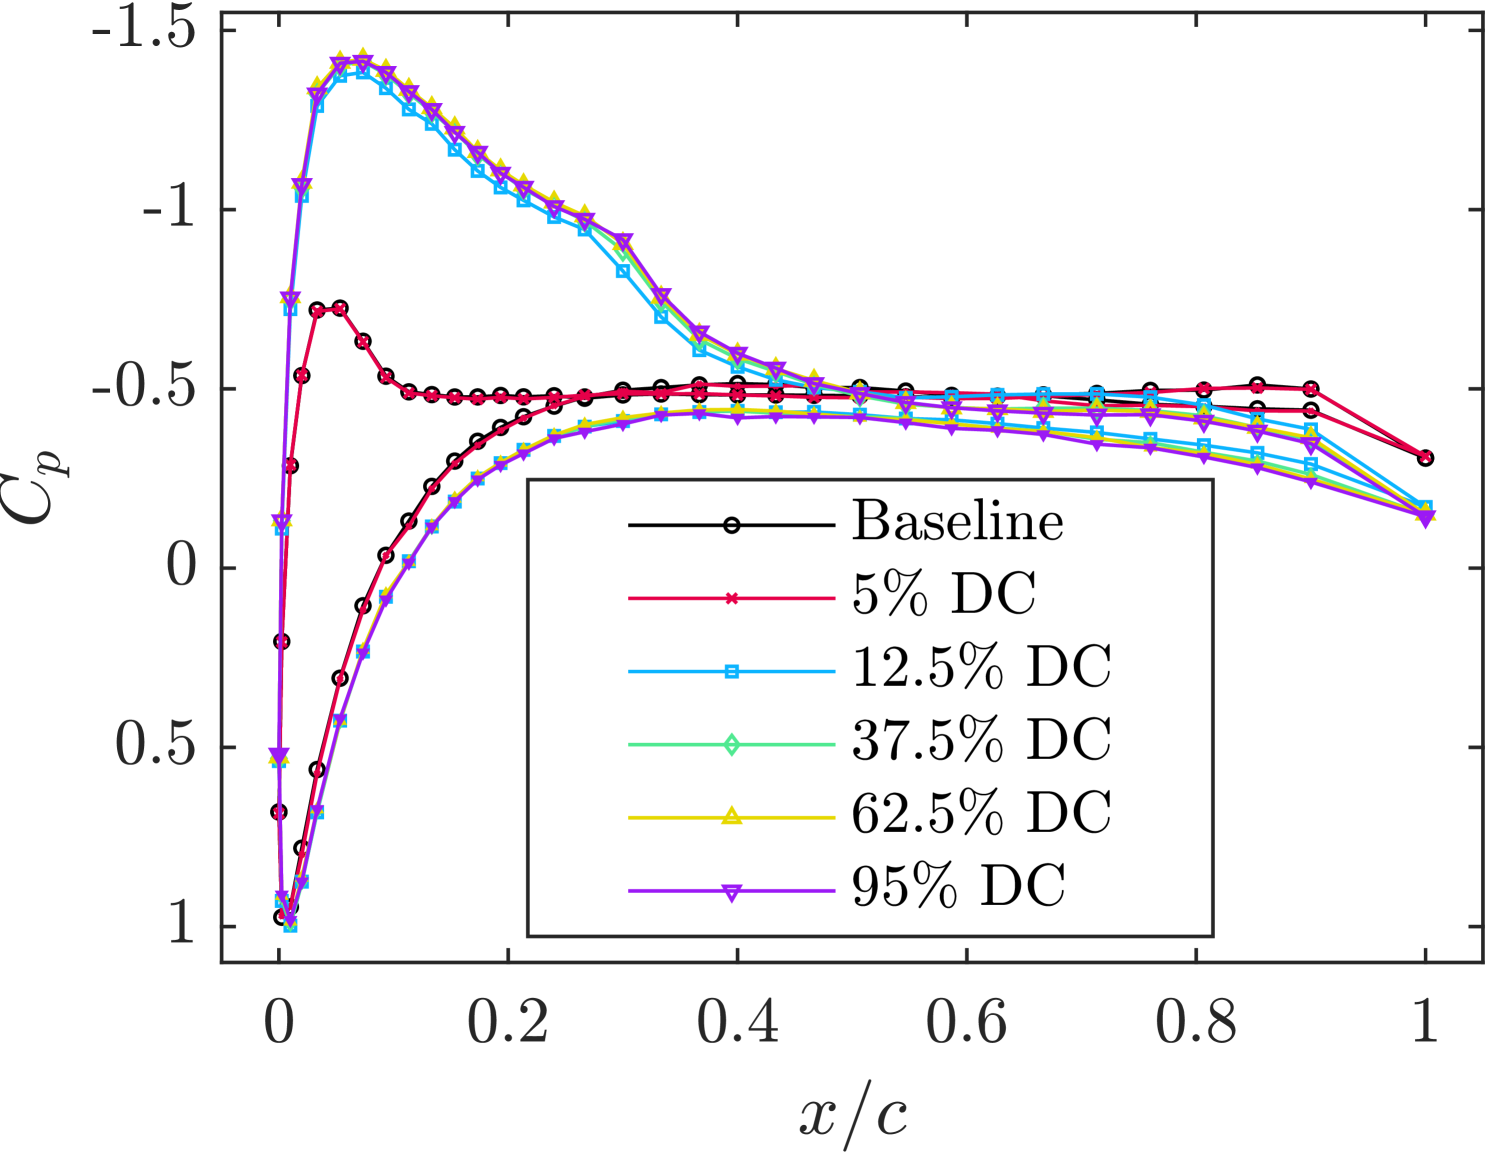
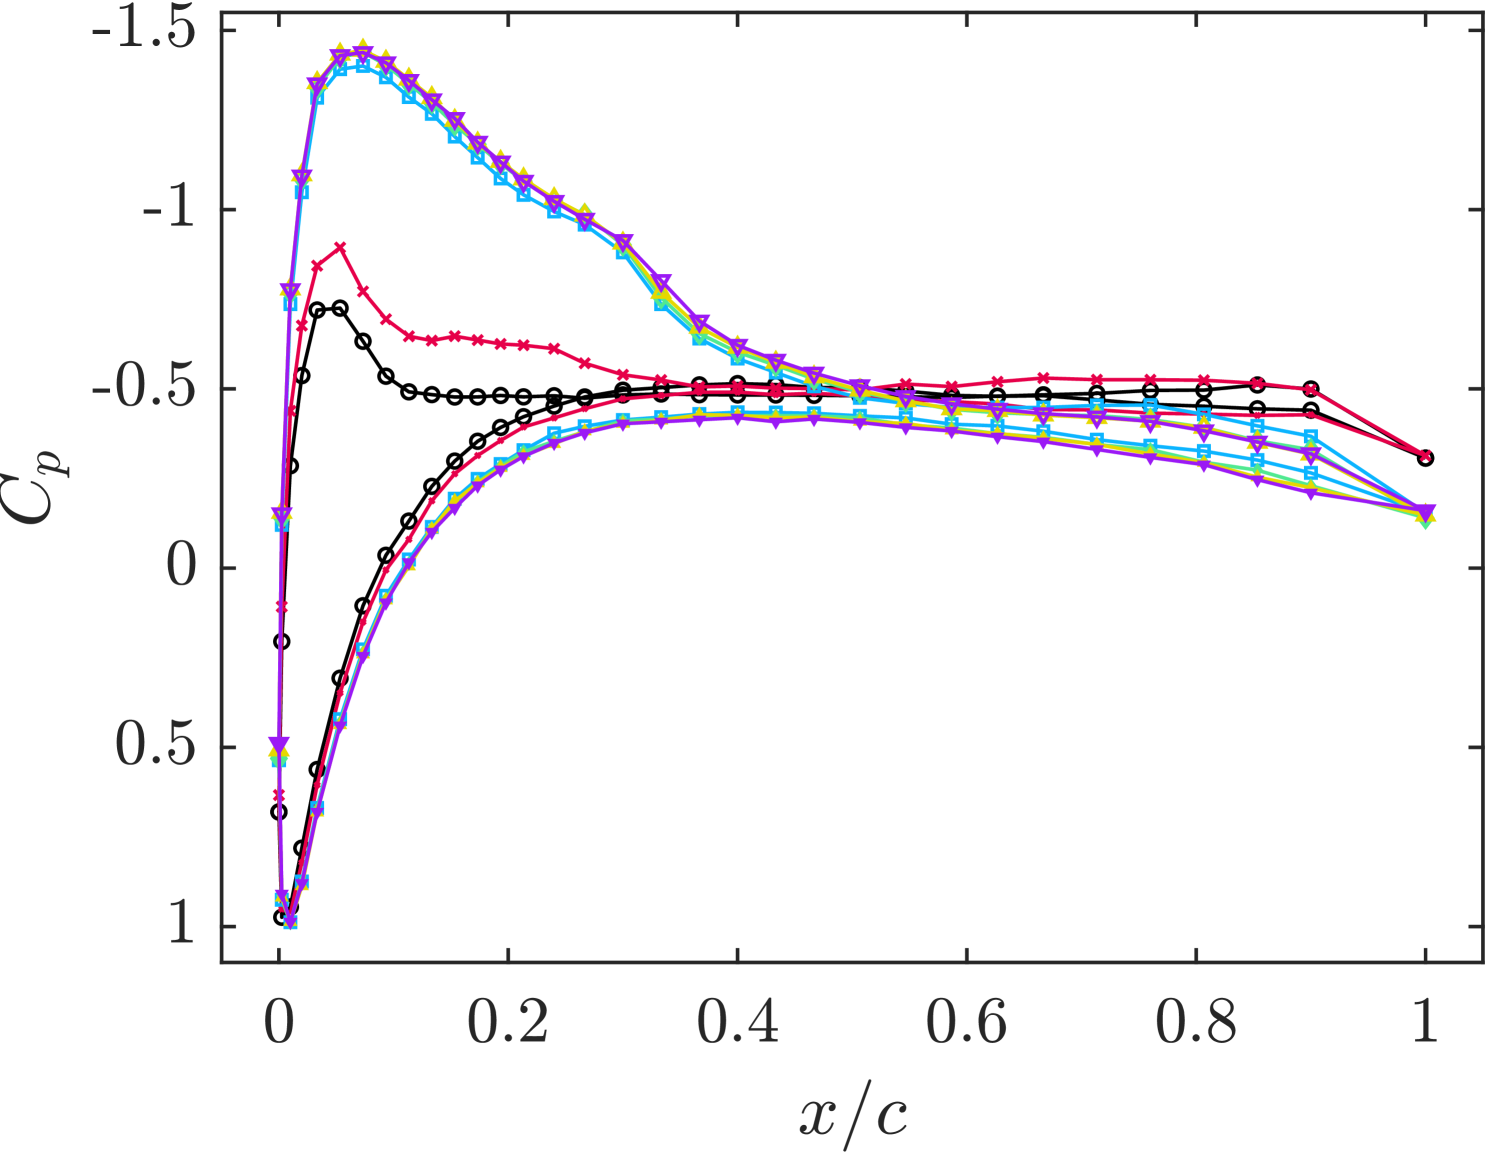
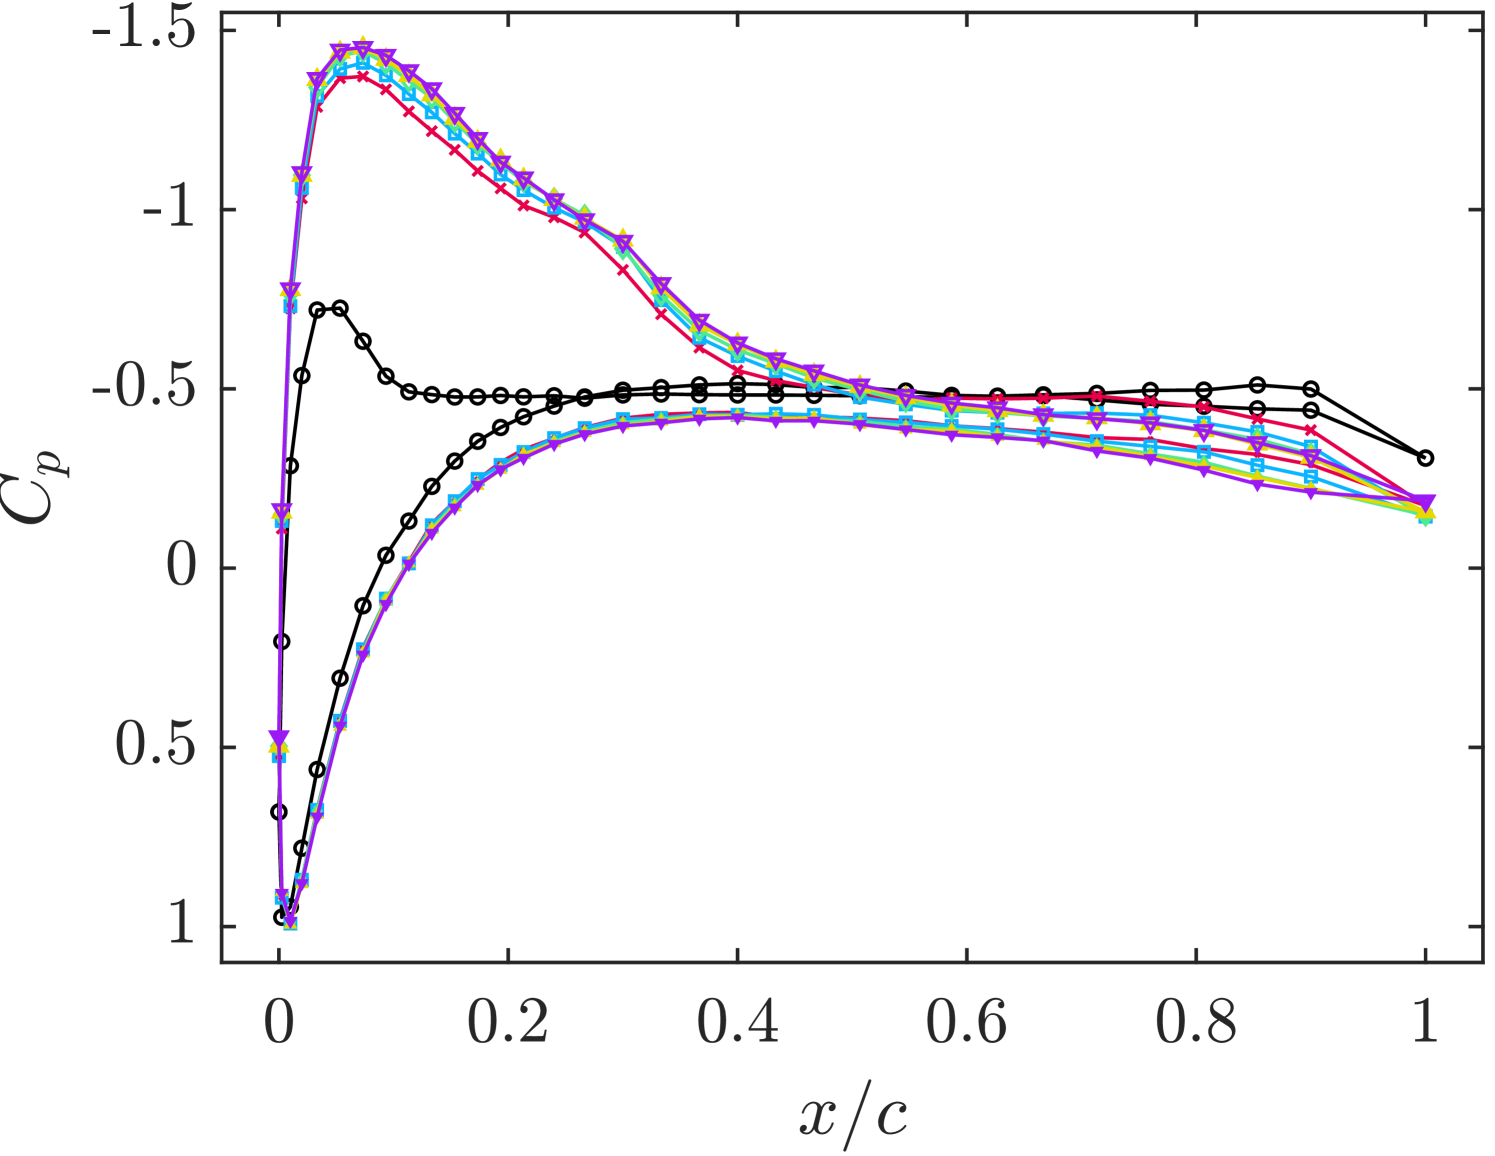
Surface pressure distributions are plotted in figure 10 for the baseline case and the various control strategies. Stall is evident in the baseline case, characterized by a plateau in the distribution of the suction surface, extending from shortly downstream of the suction peak to the trailing edge. At (figure 10(a)), all tested DCs except for result in a fully reattached flow, as indicated by the absence of a pressure plateau in the distribution. Additionally, lift recovery is evident from the heightened suction peaks. The DC shows a distribution nearly identical to the baseline case, suggesting that this control strategy has a negligible effect on the lift. This observation is consistent with the previously discussed smoke visualization. Increasing the blowing ratio to improves the pressure distribution for the DC case slightly, however, the flow is still separated, as indicated by the pressure plateau downstream of (figure 10(b)). Further increasing the blowing ratio to results in complete flow reattachment for all DCs, including . This demonstrates that the threshold DC for flow reattachment is dependent on the blowing ratio, consistent with literature indicating that a minimum momentum coefficient is required to fully reattach the flow [17, 20]. A review by Greenblatt and Williams [4] states that once a threshold momentum coefficient is attained, significant lift increases are observed. In the present study, this momentum threshold is surpassed by increasing either the blowing ratio or DC. For DCs above , flow reattachment is observed at all blowing ratios. Once reattachment is achieved, further increases in the DC or blowing ratio provide only marginal additional lift enhancement, as indicated by the slightly increased suction pressures.
Distributions of normalized instantaneous pressure coefficients measured at the suction peak () are presented in figure 11 for control at across various DCs. The distributions for DCs greater than or equal to are normally distributed and similar, whereas the DC case exhibits a substantially wider and right-skewed distribution (toward the higher suction side). The narrow, normal distributions for higher DCs suggest a more consistent suction peak and, consequently, a more stable lift force. In contrast, the broader distribution at DC indicates unsteady control. This low-power control case likely represents a transitional state between a fully attached flow and a massively separated flow, potentially characterized by a flapping shear layer, similar to those observed in previous experiments with weak SJA control [19, 12]. The moderate energy input does not fully eliminate flow separation but does improve the flow field by reducing the severity of the separation. This is further evidenced by the plots of mean velocity magnitude shown in figure 12. The position of the SJA array is marked as a black triangle at . In both the baseline and controlled case, the flow separates at , consistent with prior findings [14], forming a large mean recirculation region. In the baseline case, the core of the recirculation region is centered about the trailing edge, whereas, in the controlled case, the core shifts slightly upstream, and the separated shear layer becomes smaller.
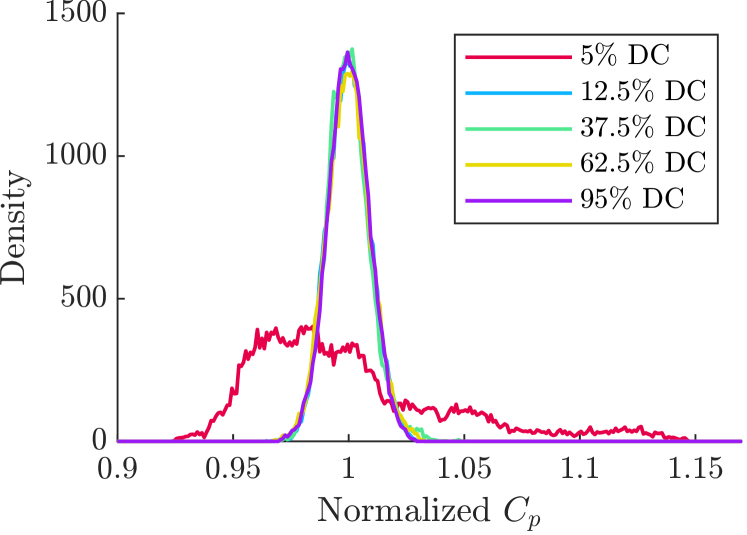
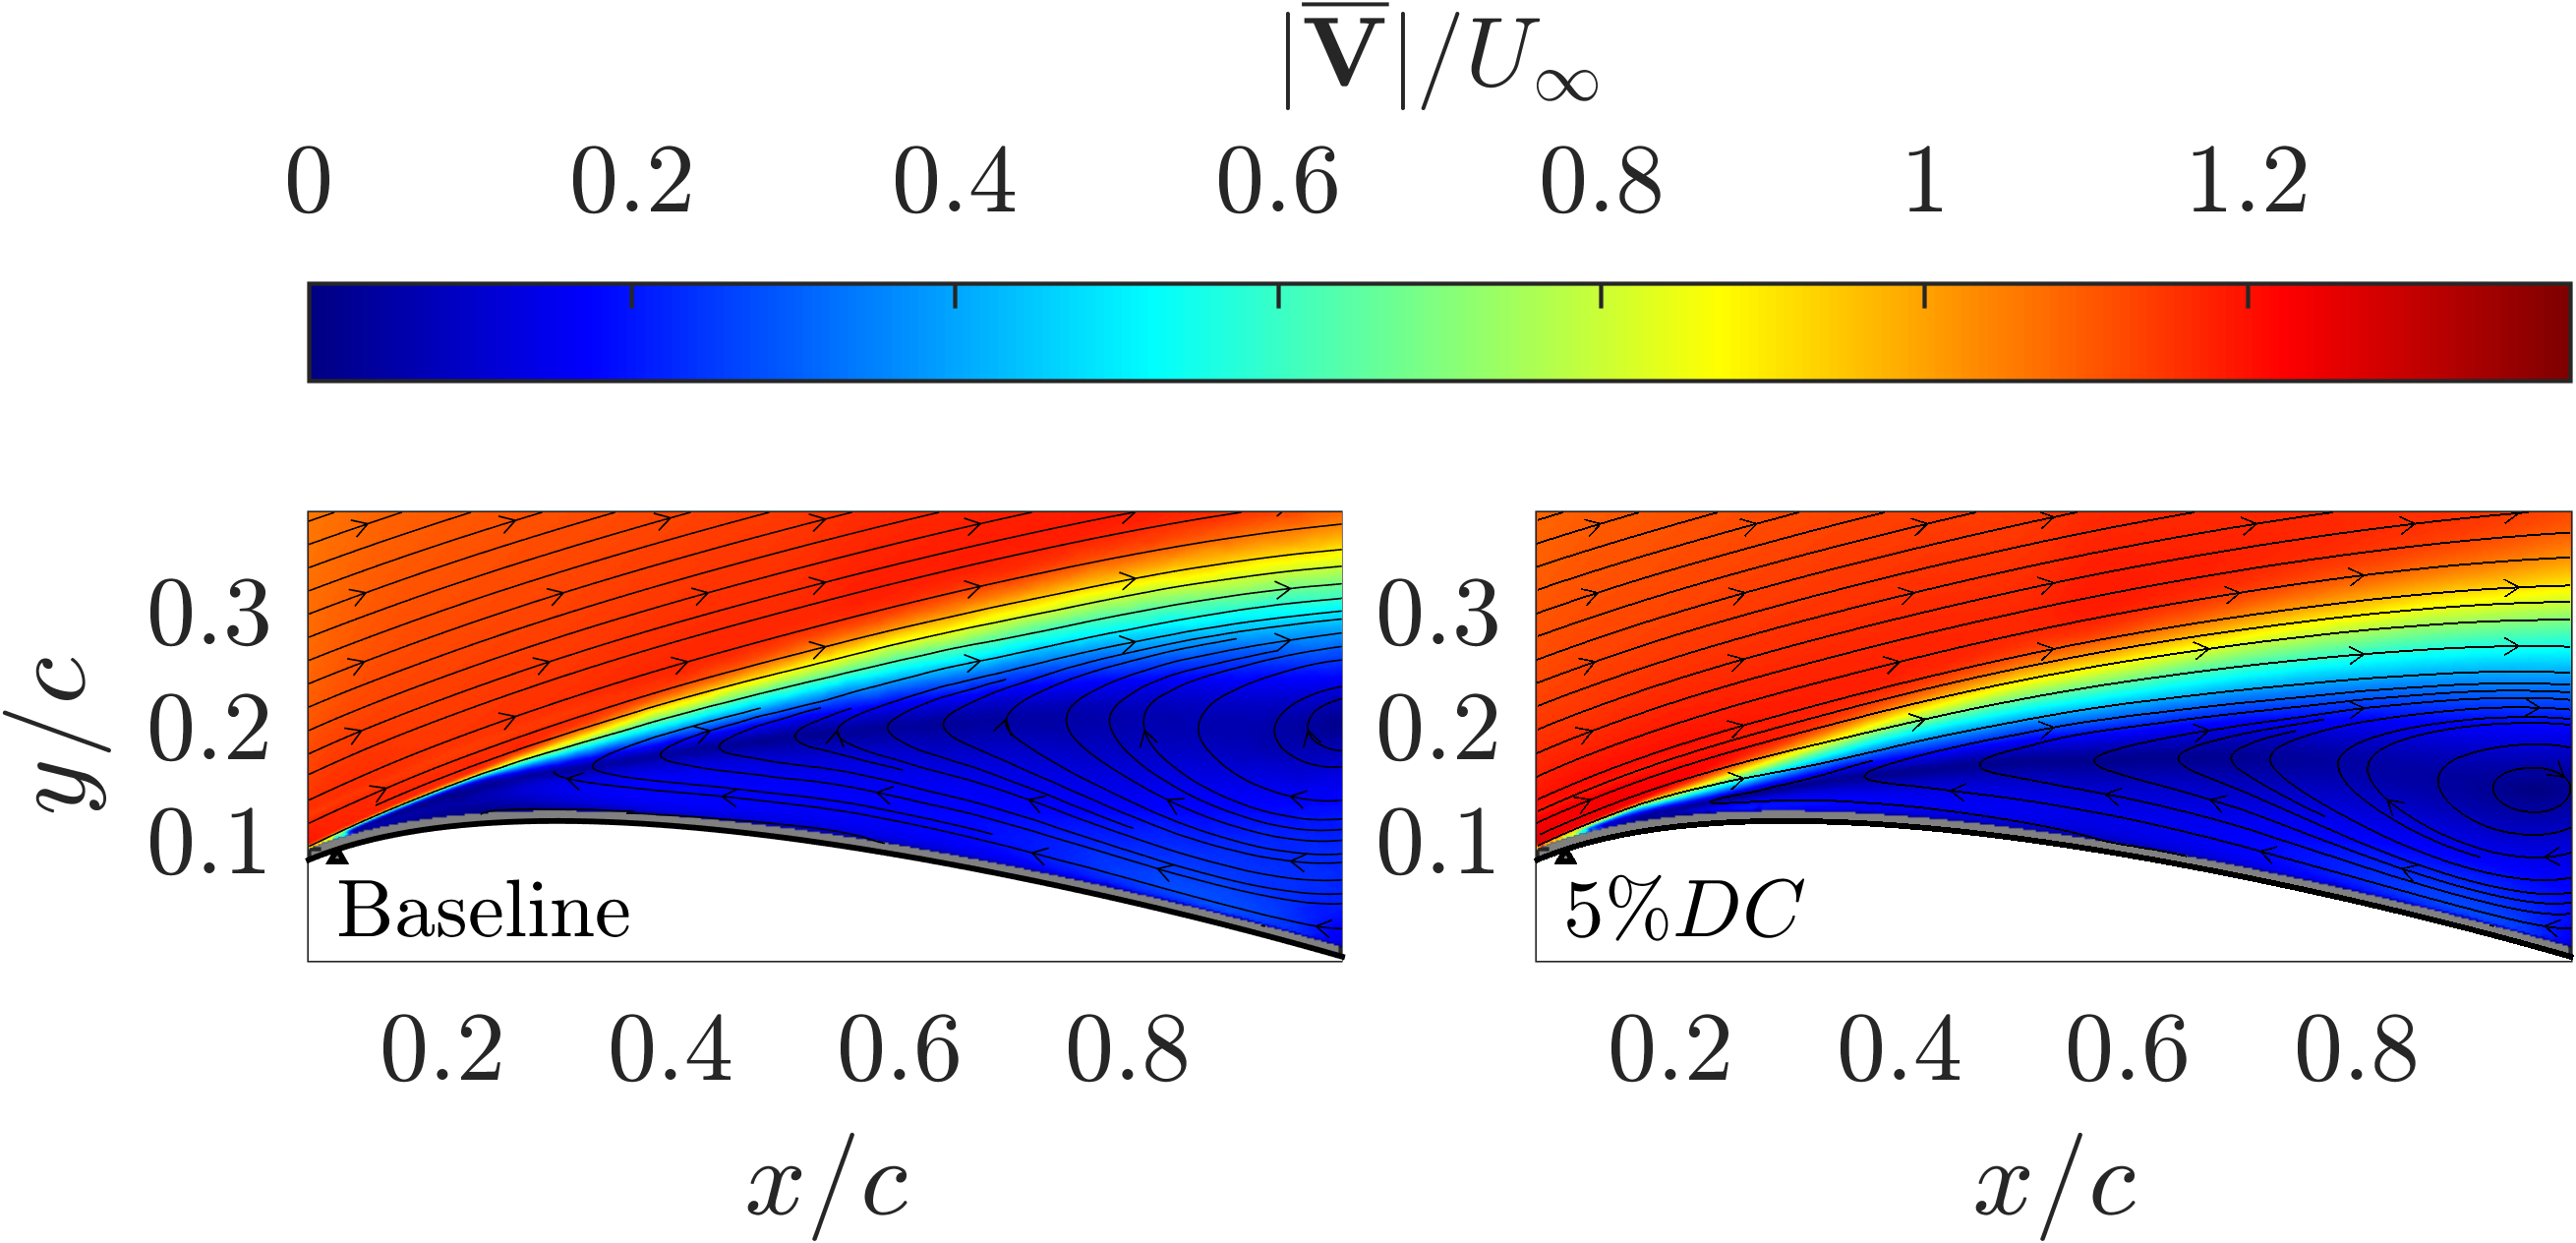
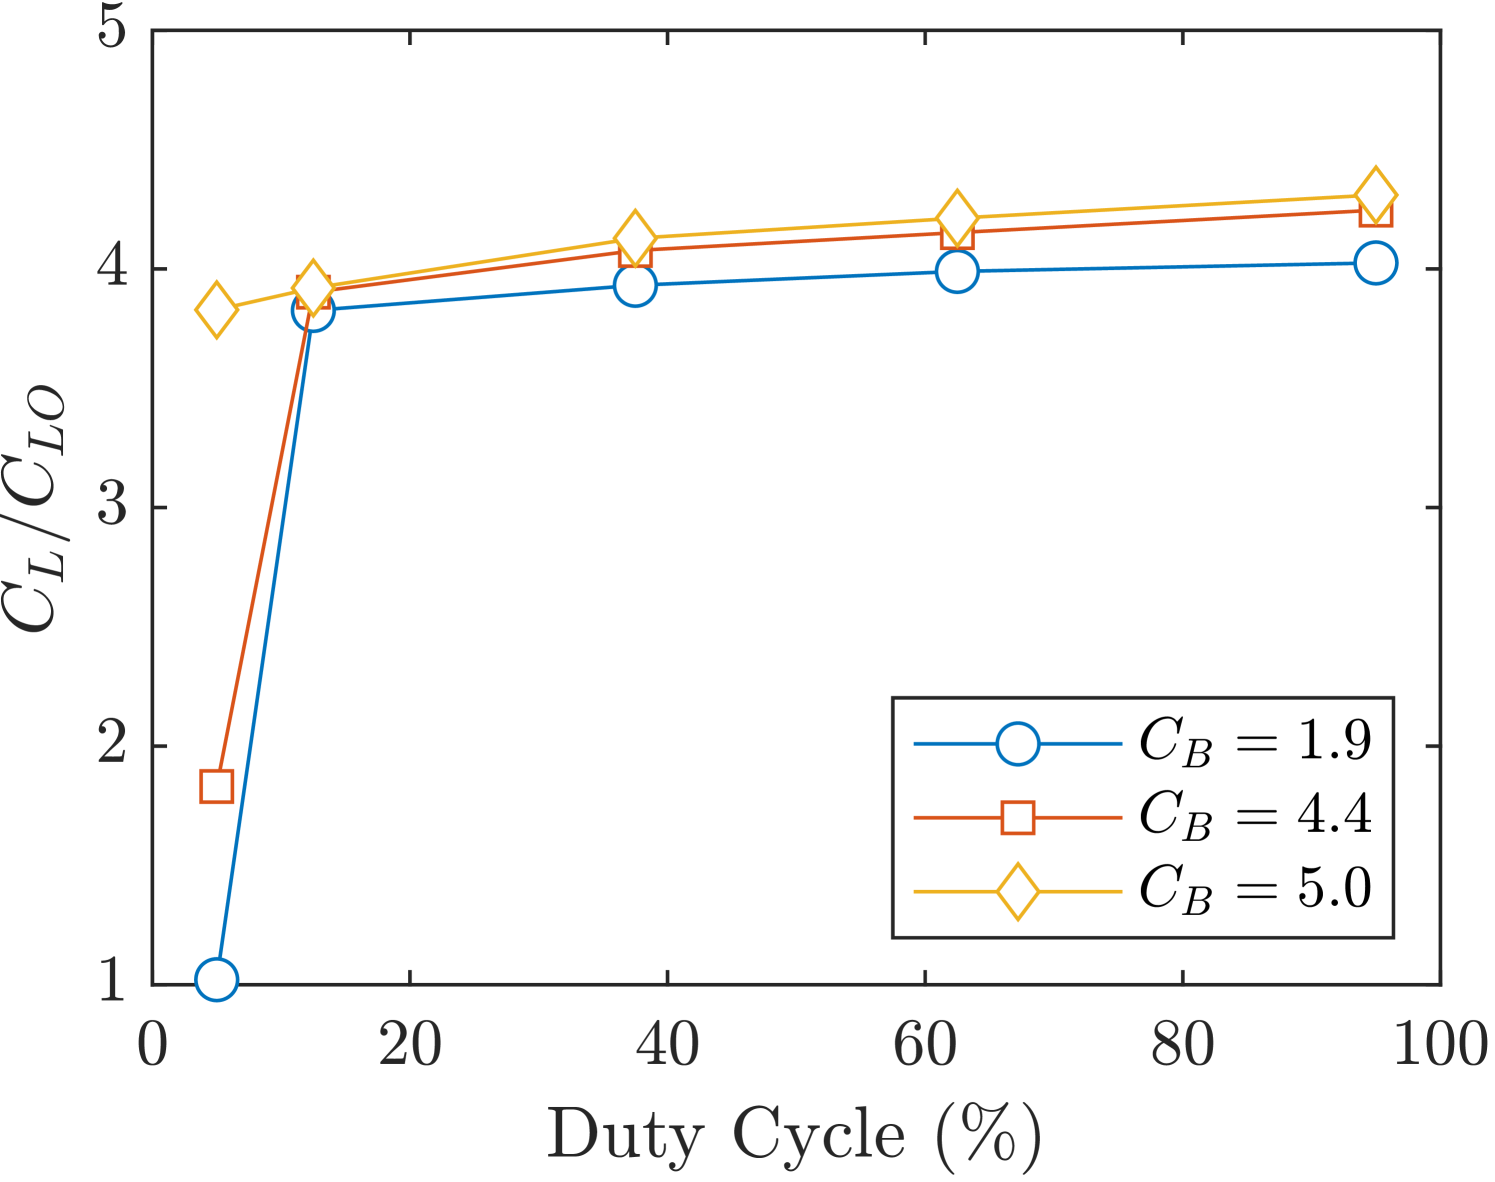
Figure 13(a) presents lift coefficients normalized by the baseline lift coefficient for various control strategies. The measured baseline lift coefficient, , is consistent with prior studies with the same airfoil model [20, 14]. The curves for the lower two blowing ratios exhibit a sharp increase in lift up to a threshold level, corresponding to fully attached flow. Beyond this threshold, further increases in DC past result in only marginal improvements in lift. Similarly, increasing the blowing ratio while keeping the DC constant also leads to higher lift coefficients. A large lift increase of over the baseline case is achieved at a low power consumption with , DC. However, only an additional lift increase is attained at the highest power control strategy, which requires 12 times the power input.
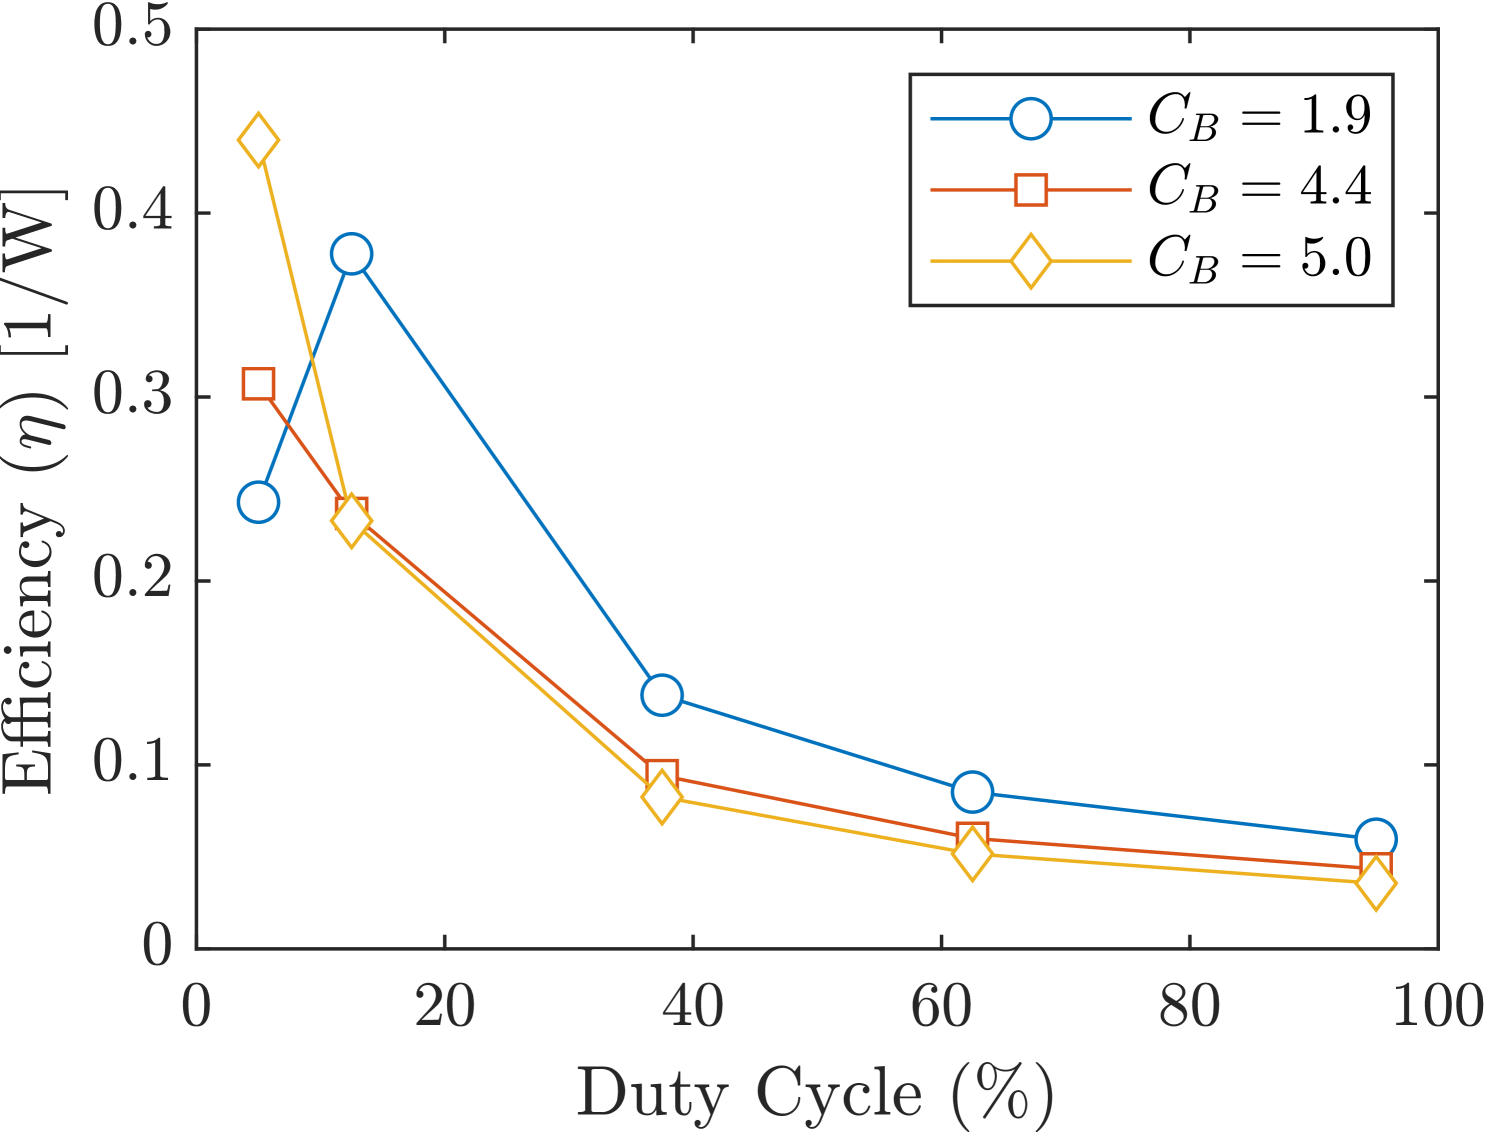
To highlight this effect of diminishing returns, lift coefficients are normalized by the power consumption for each control strategy, resulting in a measure of efficiency,
| (5) |
This efficiency metric is plotted against the DC in figure 13(b). The plot reveals that once the flow is fully reattached, the lift-to-power efficiency of the control decreases as either the blowing ratio or DC is increased. Furthermore, the highest efficiency is achieved with the highest blowing ratio combined with the lowest DC. This suggests that strong, yet brief perturbations to the oncoming flow are sufficient for reattachment while maintaining power efficiency. Additionally, at sufficiently high DCs, reducing the blowing ratio results in power savings with minimal impact on lift performance.
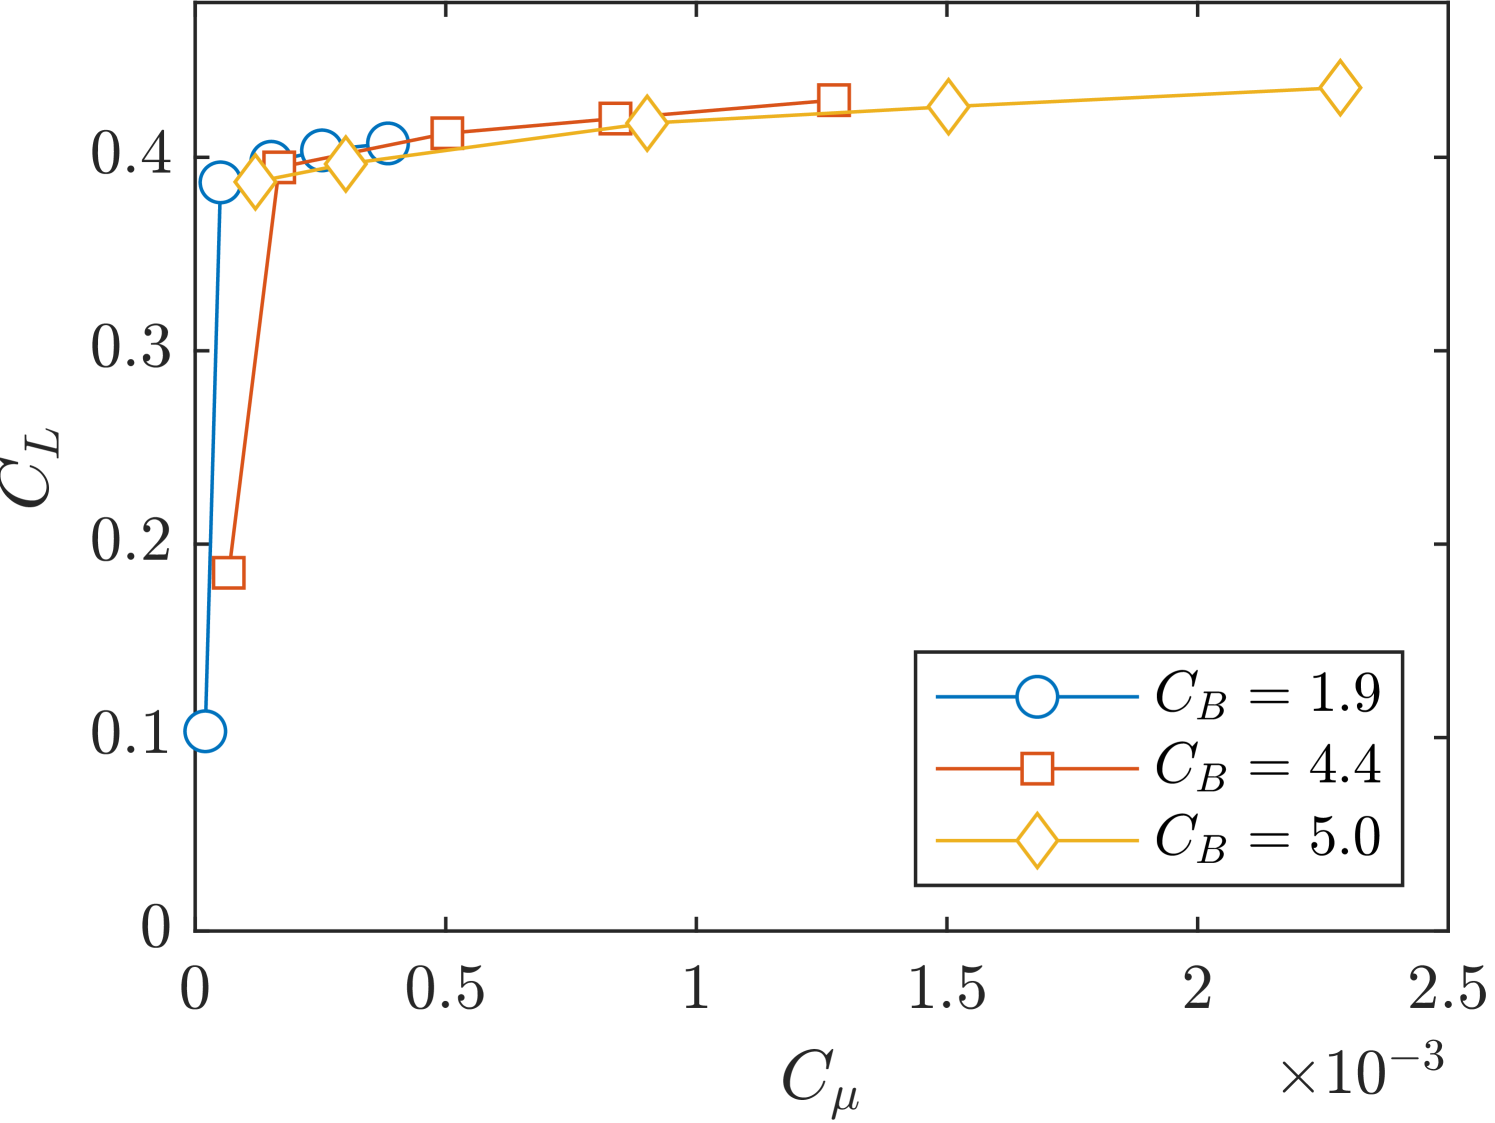
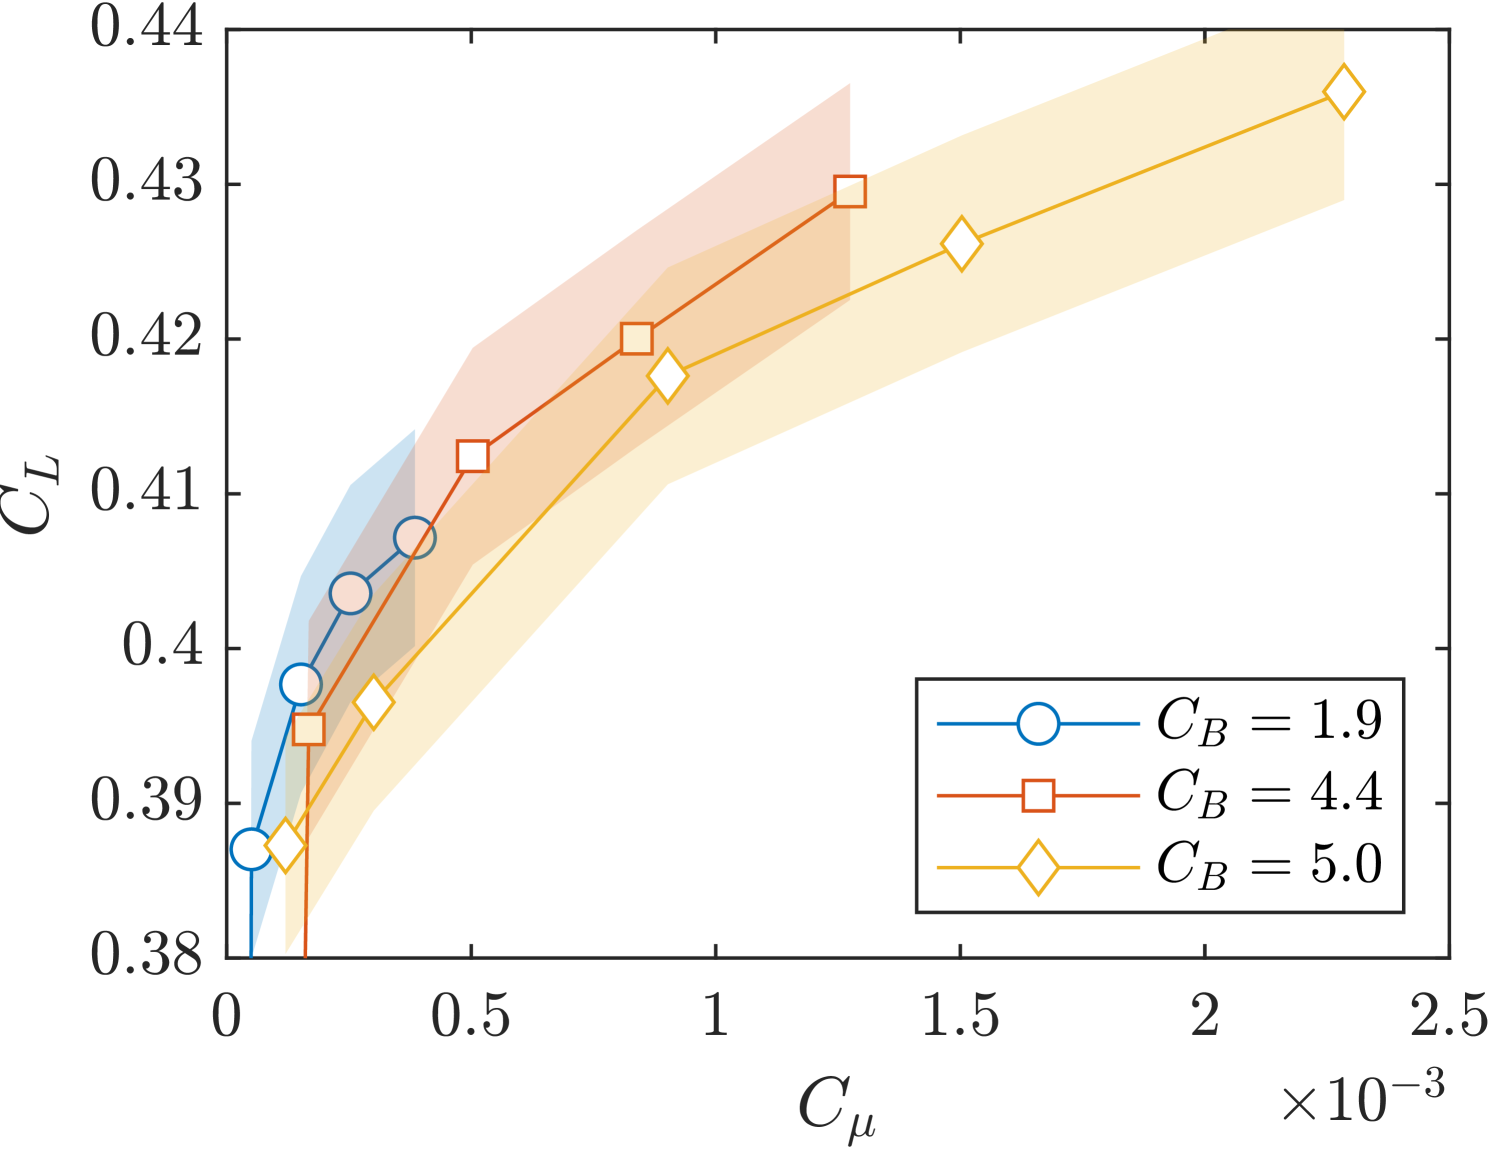
To examine the interactions between the DC and blowing ratio on the momentum coefficient and their combined effect on the lift coefficient, the lift coefficient response to varying momentum coefficients is presented in figure 14. The overlapping curves within the confidence intervals suggest that a given momentum coefficient generally corresponds to a consistent lift coefficient, regardless of the specific DC and blowing ratio combinations. This indicates that, in many cases, the momentum coefficient alone can be a reliable predictor of aerodynamic performance.
3.2 Effects of the duty cycle on the flow field
The analysis in this section focuses on evaluating the impact of varying the DC while maintaining a constant blowing ratio. Specifically, the PIV velocity fields are analyzed for control cases at a constant blowing ratio of , with DCs of , , and .
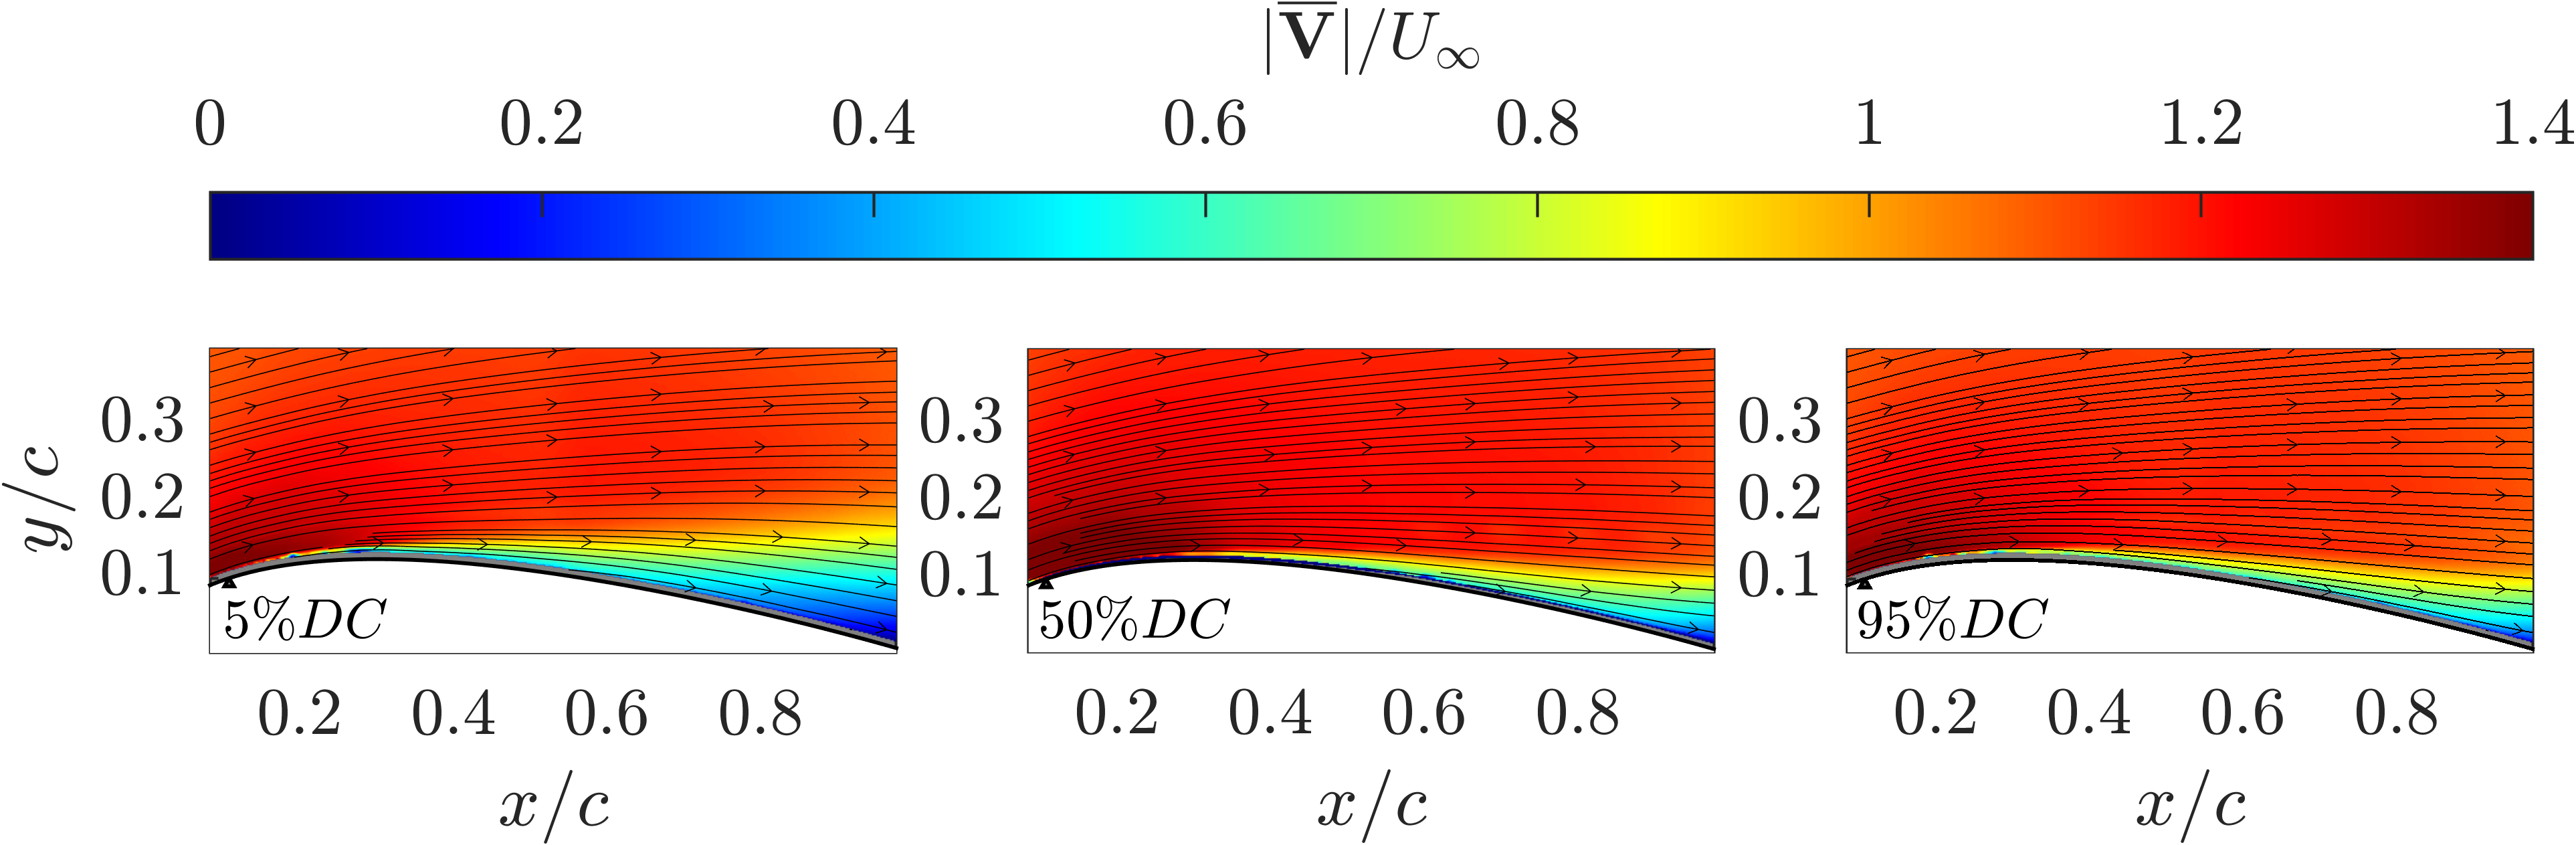
Contours of the time-averaged velocity magnitude with streamlines overlaid are presented in figure 15. The flow remains attached for all DCs, as indicated by the streamlines near the airfoil surface and the absence of reverse flow observed in the baseline case in figure 12. As the DC increases from to , the shear layer becomes thinner, indicating reduced drag and aerodynamic improvements. However, increasing the DC to does not result in a thinner shear layer compared to the control case, and the mean flow characteristics remain largely unchanged. This observation suggests that control effects improve with increasing DC up to a certain point. Beyond this threshold, further increases in DC do not enhance flow performance, indicating that the control effects are saturated already at DC. This finding is consistent with the previously discussed smoke flow visualizations and pressure distributions.
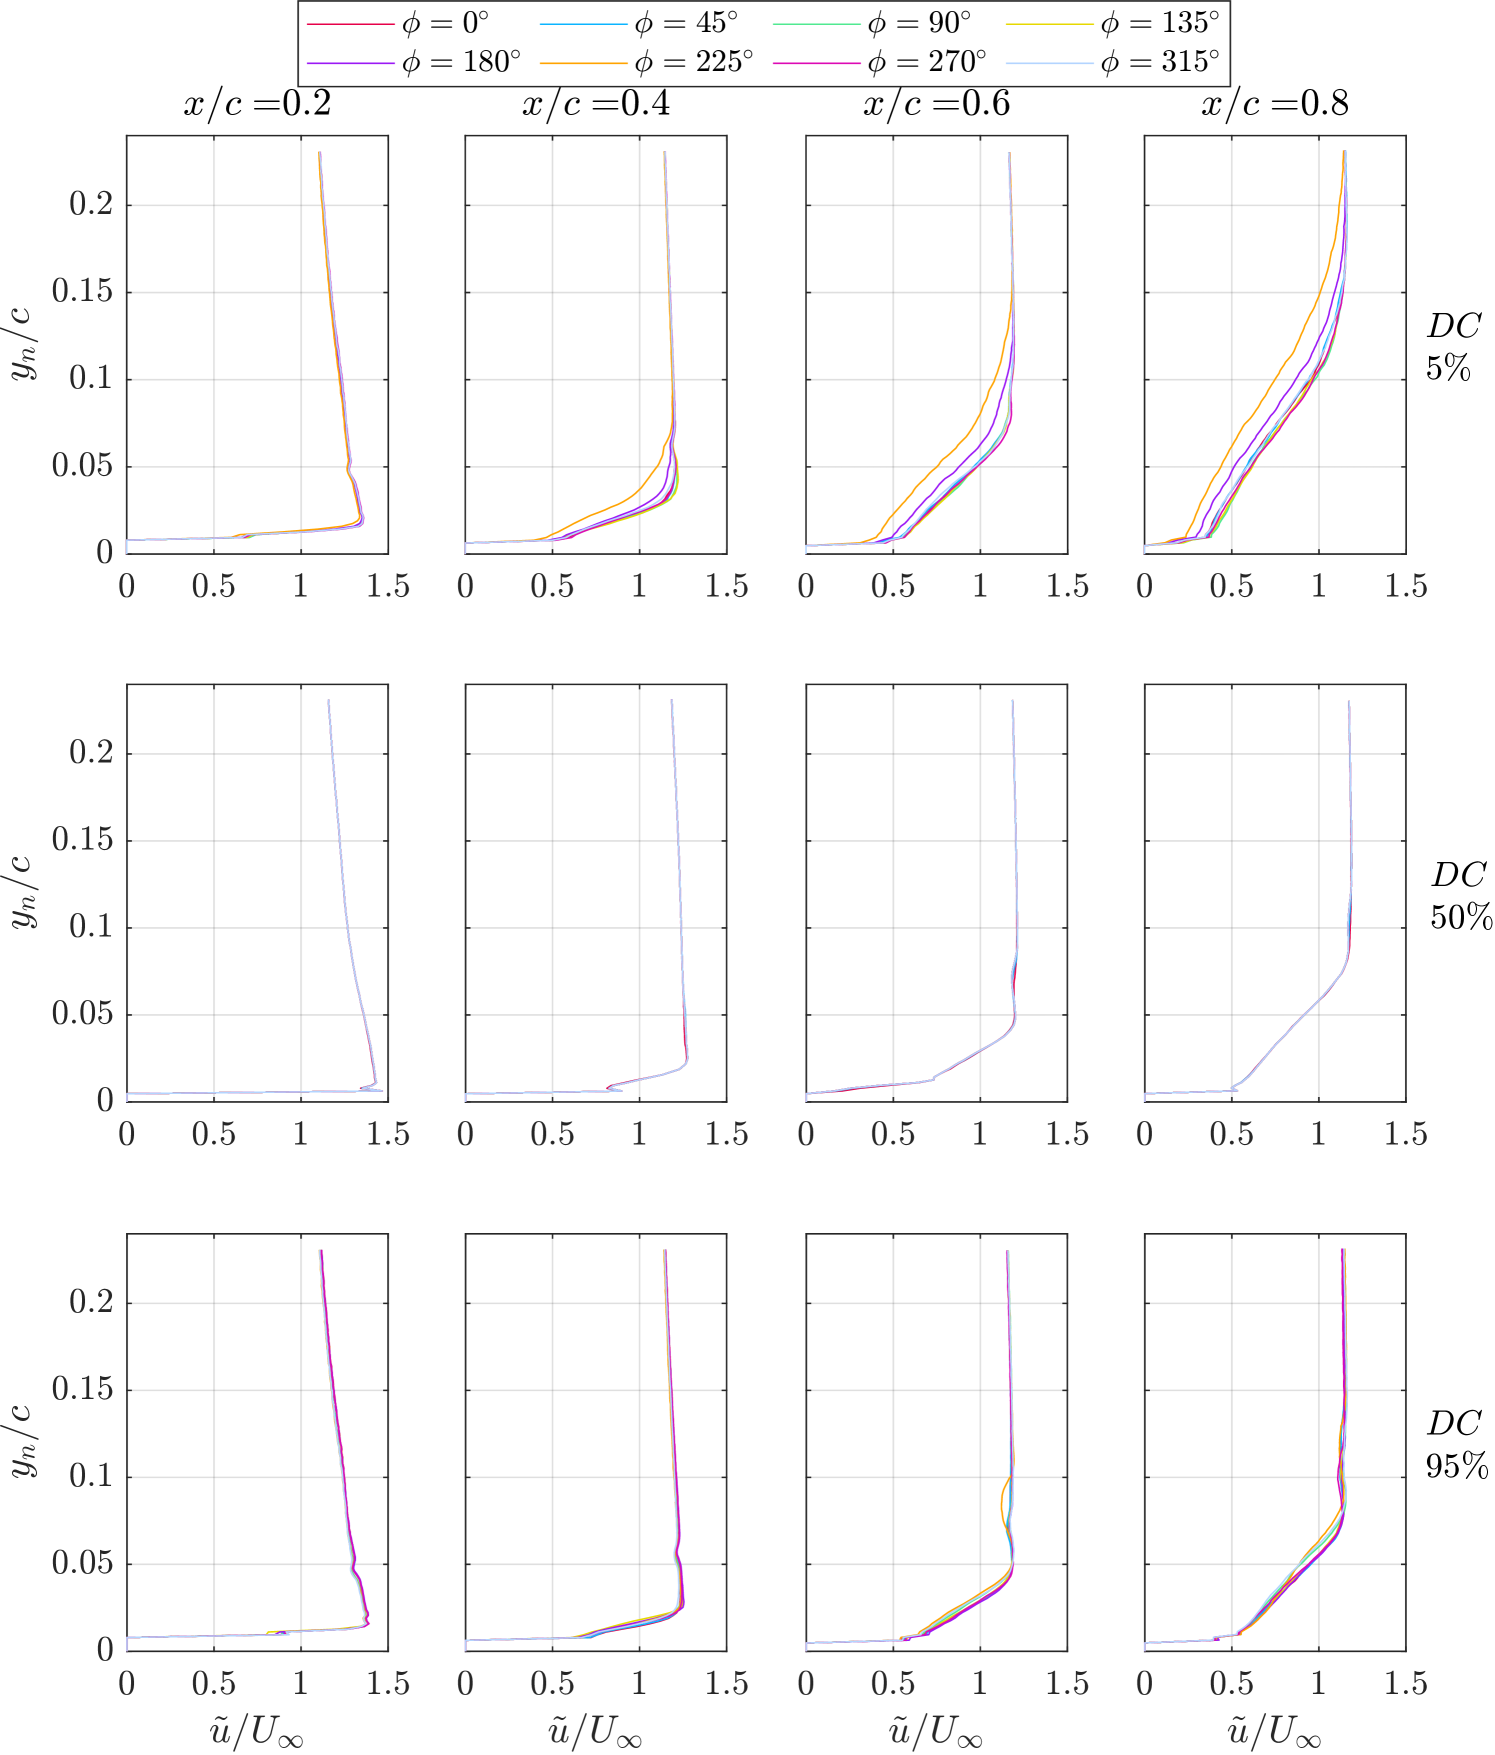
Wall-normal phase velocity plots at various chordwise locations are presented in figure 16. At a DC, the velocity profiles vary across different phase angles, indicating unsteady, phase-dependent flow. This contrasts with higher DCs ( and above), where the profiles become quasi-steady, showing minimal variation and suggesting improved flow stability. The small velocity deficits observed above the shear layer at are attributed to the core of a streamwise vortex ring induced by the SJA [14, 36]. For low-DCs, the near-wall velocity is significantly lower, reflecting less effective control and a larger shear layer. As the DC increases to , the near-wall velocity increases and the shear layer becomes thinner, enhancing control performance. However, increasing to a DC does not result in significant improvements to the velocity profiles; in fact, a slight increase in unsteadiness is observed, indicated by a broader spread in the phase velocity profiles.
The -criterion, defined as the second invariant of the velocity gradient tensor, is used to identify vortical structures in the controlled flow fields. For the 2D velocity field, is defined as:
| (6) |
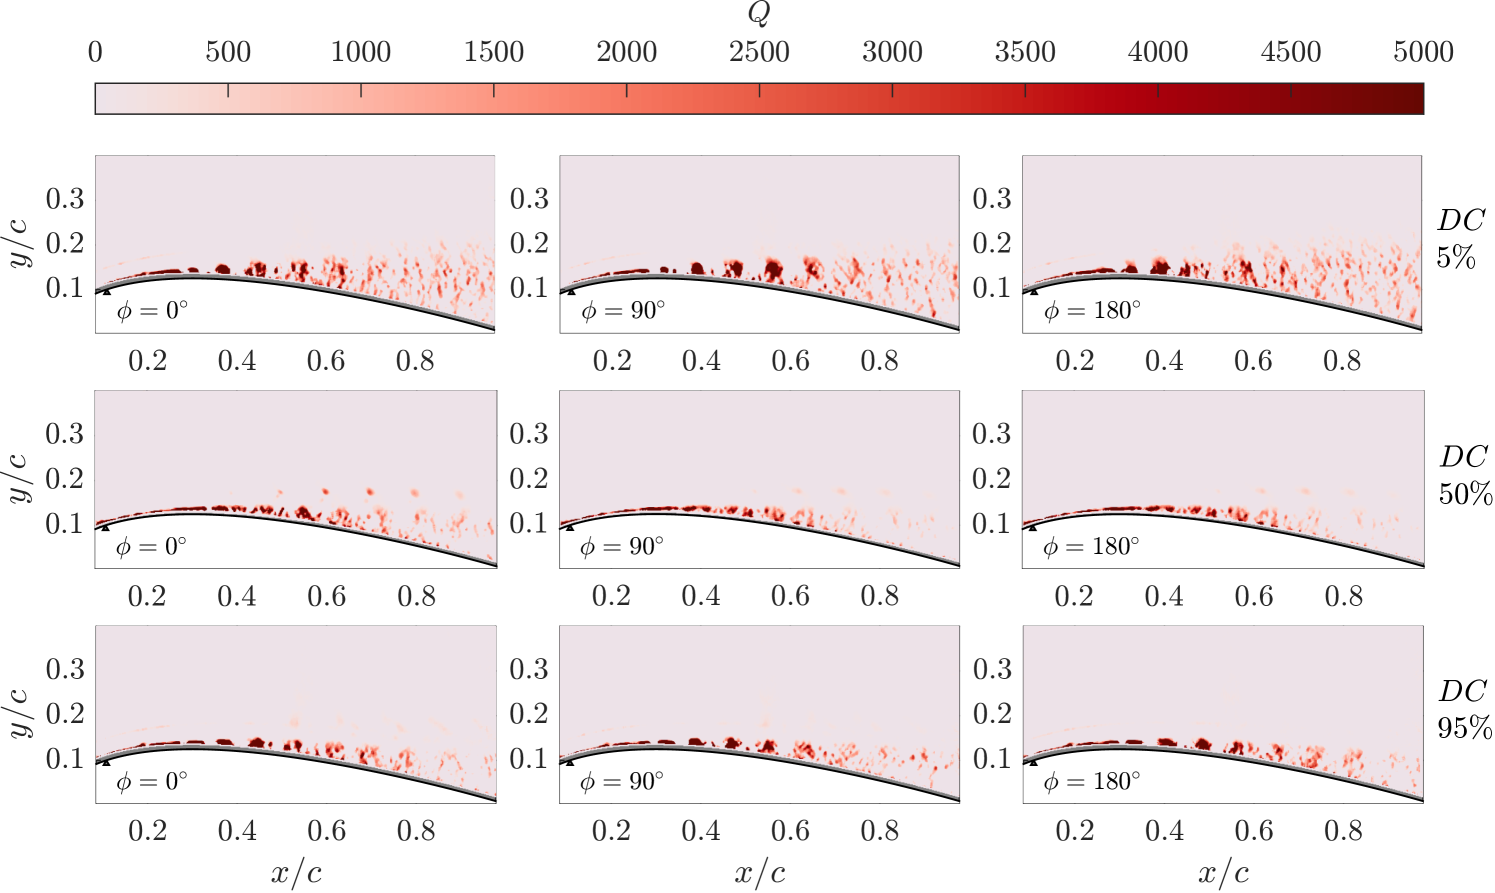
where is the out-of-plane vorticity, and is the strain-rate tensor [44]. Contours of the -criterion are plotted in figure 17 across three phase angles, illustrating the evolution of vortical structures during the actuation period. The vortices exhibit a clockwise rotational sense, as indicated by the vorticity field (figure 18), which aligns with the typical behaviour of SJA-induced vortices. With a DC, larger vortex structures are observed, which tend to lift off the airfoil surface and dissipate more quickly, reducing their effectiveness. In contrast, higher DCs produce smaller, stronger, and more persistent vortices that remain closer to the wall, effectively energizing the shear layer. This vortex configuration improves flow control, reduces the wake size and associated drag, and accelerates the flow over the airfoil, which in turn enhances lift. This result aligns with prior studies, which attribute post-reattachment control improvements to enhanced jet injection and increased intensity and persistence of the induced vortex structures [26, 24].
High-frequency actuation has been shown to result in quasi-steady control [45, 29, 30, 34, 14, 36]. This is due to the short actuation period, which results in the generation of additional vortices before the preceding ones have convected over the airfoil, as the actuation period, , is much shorter than the convective timescale, (). However, phase-dependent flow behaviour is still observed at the lowest DC control case. At and DC, a train of vortices persists until , where they begin to dissipate. In contrast, at the vortices dissipate earlier (around ), leading to reduced near-wall velocities and less effective momentum transport. This aligns with the phase velocity profiles discussed previously in figure 16, which illustrate slower near-wall velocities at and for . Higher DCs produce more consistent vortices across phases due to the more constant actuation effect from the SJAs. This phenomenon explains the tighter spread of phase velocity profiles in figure 16 for the and DC cases.
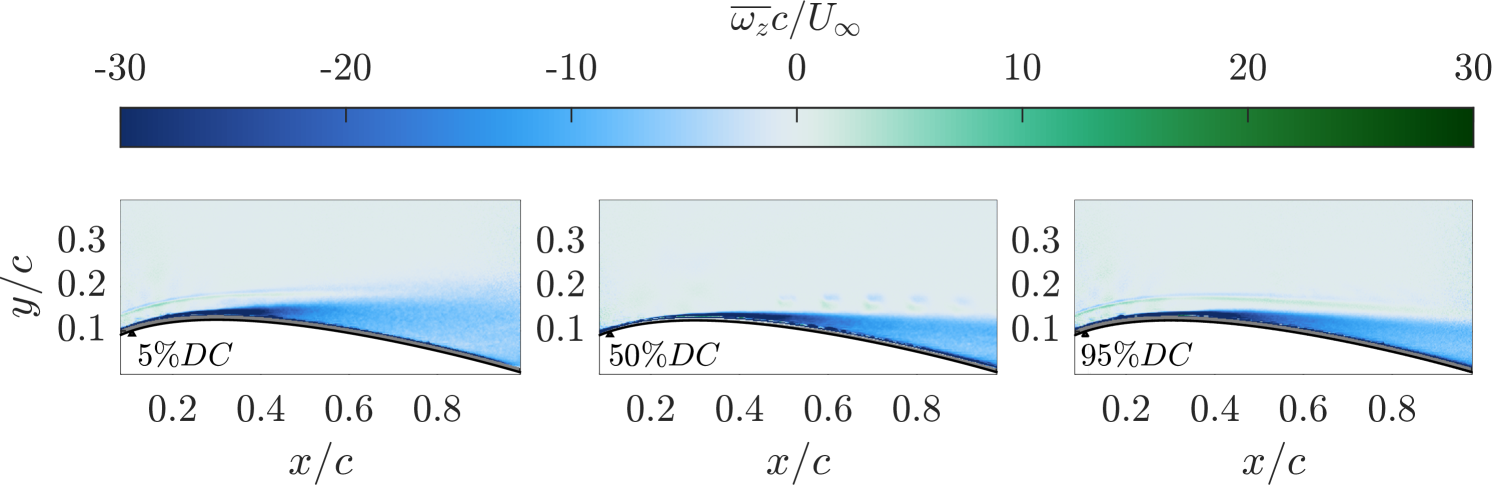
Time-averaged vorticity plots are presented in figure 18, which explain the observed differences in the control effectiveness across varying DCs. The area of negative vorticity above the airfoil indicates clockwise rotation of the spanwise vortices. At a low-DC of , the area of vorticity spreads higher above the airfoil surface, providing further evidence that the generated vortices are not well-contained near the wall. This spreading and dilution of vorticity results from the rapid dissipation of vortices, which limits their effectiveness in flow control. In contrast, at higher DCs of and , the vorticity remains concentrated near the airfoil surface. This concentration indicates stronger vortices that more effectively transport momentum to the near-wall region, thereby enhancing control and reducing the size of the shear layer. The concentrated vorticity region () ends at a slightly earlier chordwise location in the DC case compared to the higher DC cases. This further supports the conclusion that vortices induced by the SJAs at lower DCs disperse more quickly, whereas at higher DCs, they remain concentrated near the surface, which enhances circulation and thus increases the lift force.
3.3 Rapid lift estimation for multivariate control testing
When conducting factorial experiments to optimize SJAs for flow control in various environments, the experimental space can become too large to thoroughly test all possible combinations. Consequently, a single response variable is needed to evaluate the effectiveness of the control strategy. In the absence of force balances, pressure measurements are frequently used to estimate the lift coefficient, though this can be time-consuming. This section aims to correlate single-point pressure measurements with the lift coefficient and assess the feasibility of using such point measurements as the response variable.
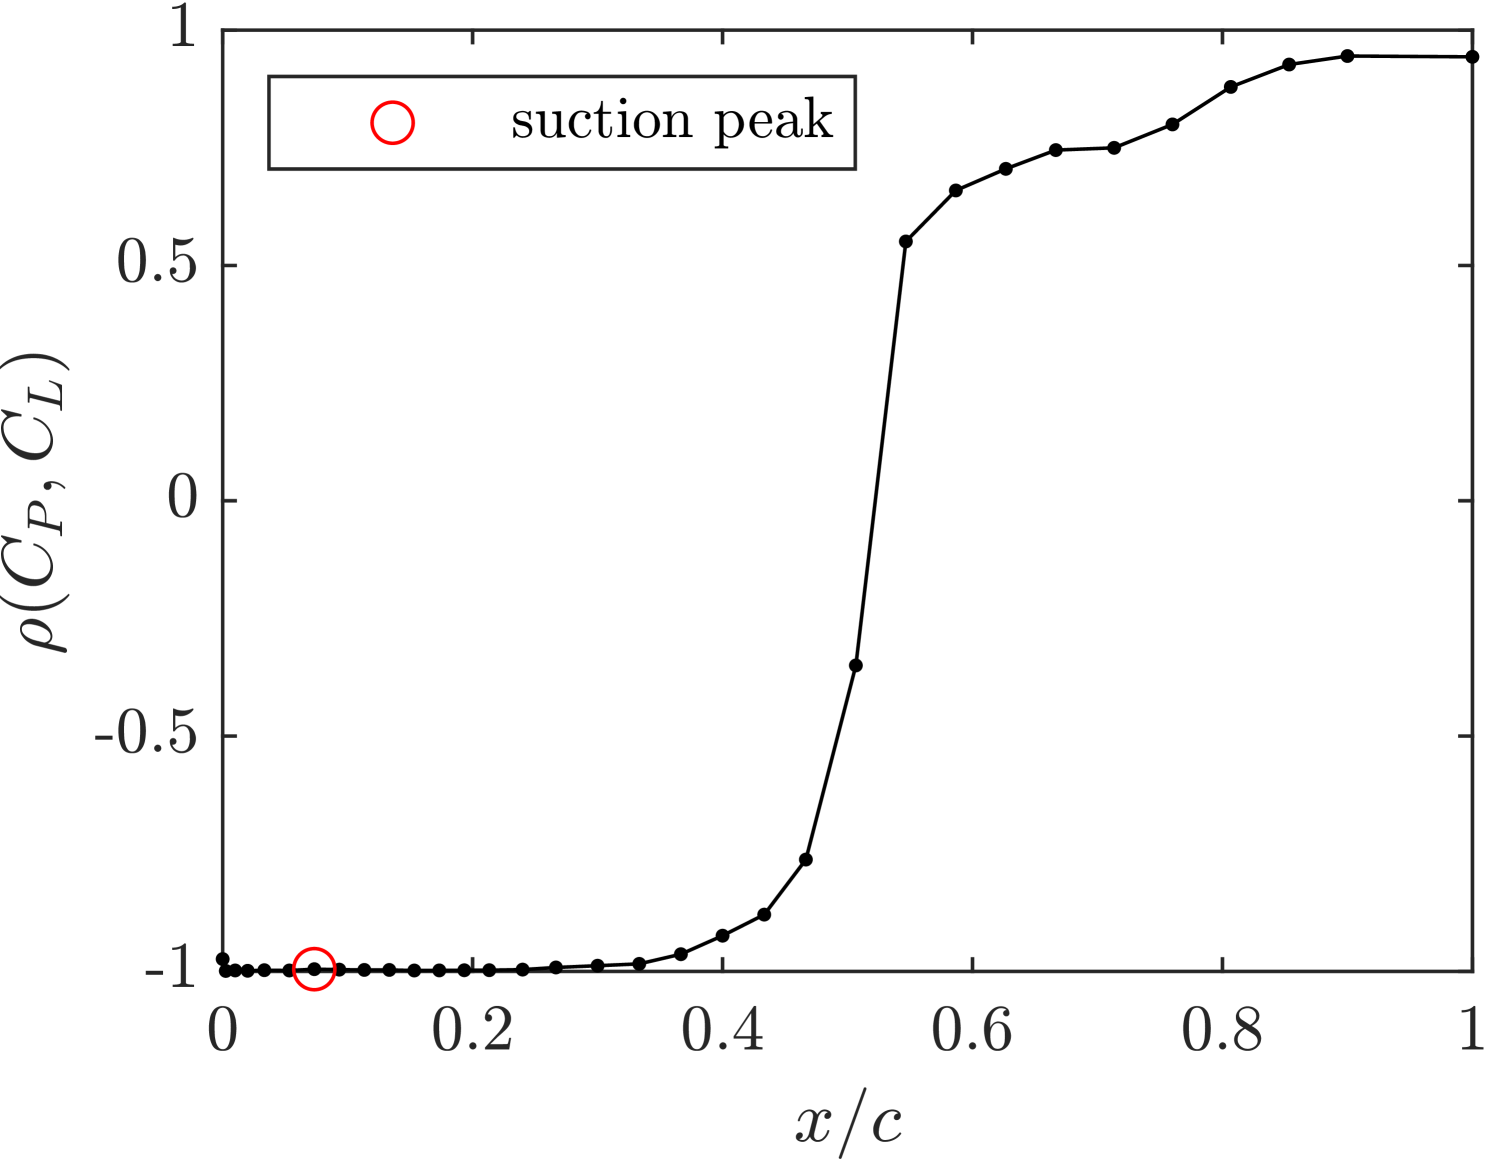
We first investigate the relationship between the overall lift coefficient and the pressure coefficients measured at chordwise locations along the suction surface of the airfoil. The Pearson correlation coefficient, , is plotted against the chordwise coordinate in figure 19(a). This correlation is calculated using data from all 15 control strategies, with each control case providing a single lift coefficient and 33 pressure coefficient measurements from the upper surface of the airfoil. The chordwise location with the highest magnitude of correlation and least variability is found between and , which includes the suction peak, with .
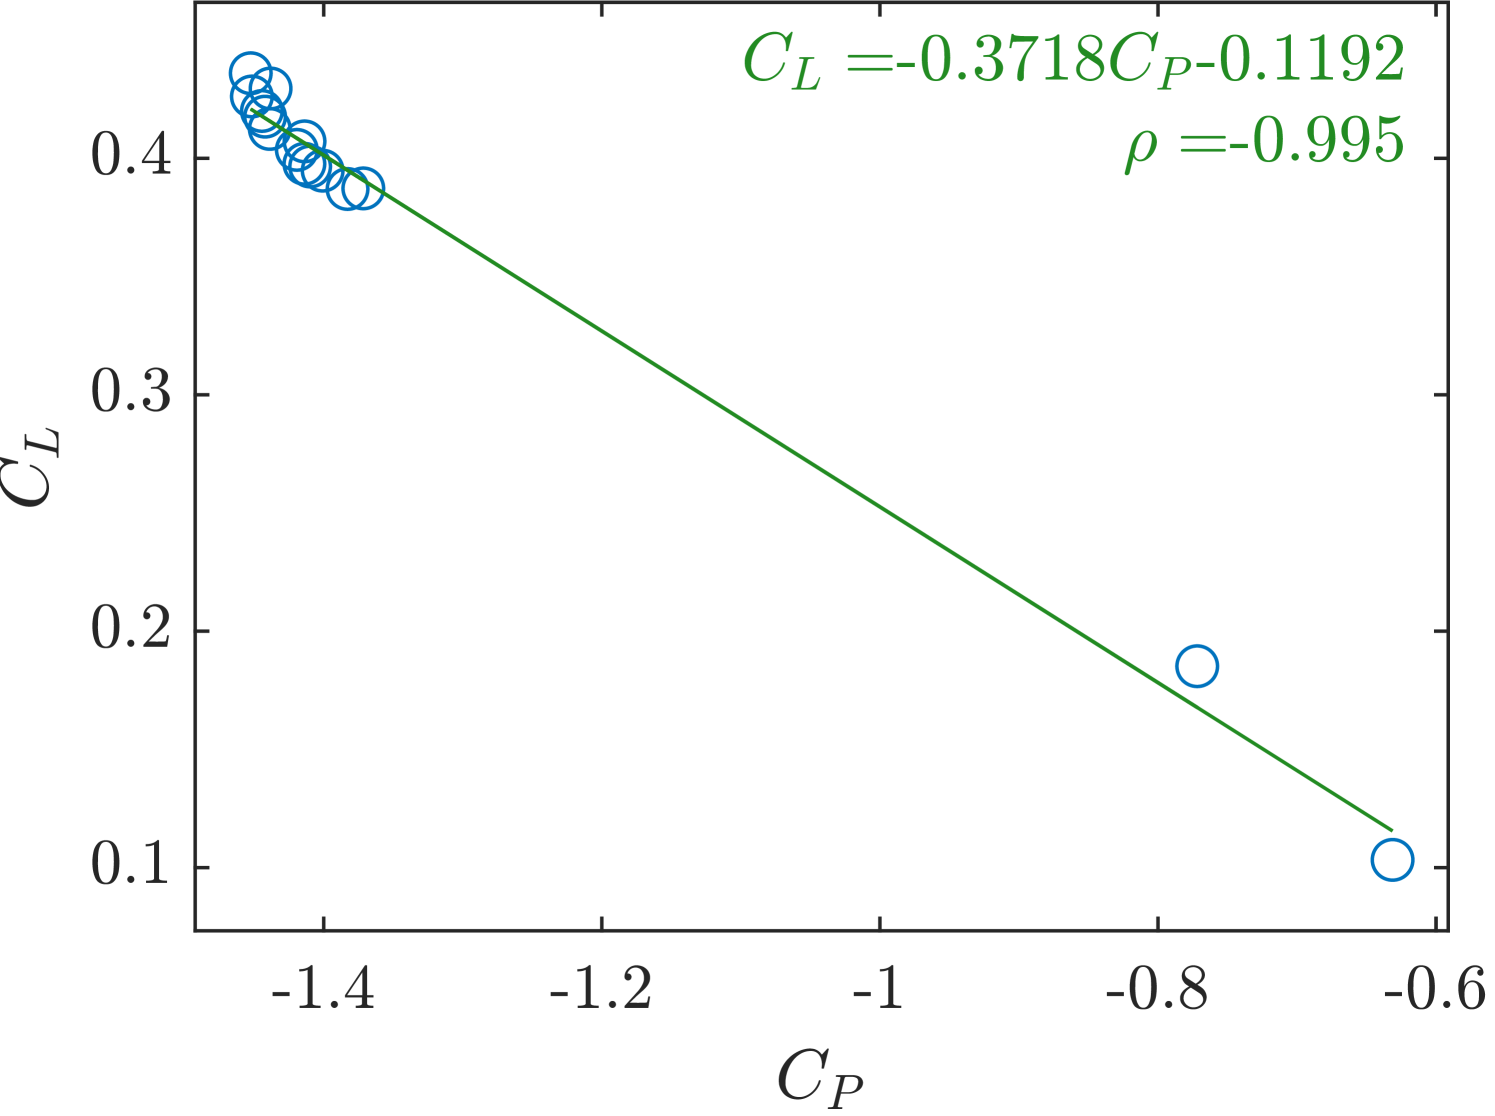
Lift coefficients are plotted against the pressure coefficients of the suction peak in figure 19(b) for the 15 control strategies tested. A strong linear negative correlation is observed, indicating that increased suction pressures at this location are strongly associated with higher lift coefficients. This finding suggests that single-point pressure measurements are viable response variables in large factorial experiments aimed at maximizing lift and can also be integrated into feedback loops, such as those used in genetic algorithms, further expediting the design and optimization phases.
4 Conclusion
This paper presents a comprehensive experimental investigation using a finite-span SJA array for flow reattachment on a stalled airfoil. The study focuses on the aerodynamic effects of two key control parameters: the blowing ratio (controlled by the input voltage) and the burst duty cycle, along with their interactions. Additionally, the power requirements of the tested control cases are measured to identify power-efficient strategies for synthetic jet flow control. Effective flow control was achieved with low-DC control strategies, leading to significant power savings compared to traditional methods that typically operate at a DC or with continuous actuation.
While it is widely established that increasing the momentum coefficient can improve lift characteristics, prior studies have primarily focused on controlling the momentum coefficient via the blowing ratio alone. A key finding of this paper is that the threshold momentum coefficient for reattachment can also be achieved by increasing the DC, which can trigger flow reattachment from a previously separated state at lower DCs. Additionally, higher blowing ratios were found to reduce the threshold DC required for flow reattachment. Increases in the momentum coefficient via either the DC or blowing ratio were found to improve the spanwise control authority and lift coefficient, however, these improvements were not consistent. A sharp initial increase in control effectiveness coincided with complete flow reattachment, after which further increases yielded diminishing returns, indicating that the control effects had saturated. The most power-efficient strategy for time-averaged lift recovery was found to involve low-DCs () at threshold blowing ratios, suggesting brief, strong perturbations are effective for reattachment while maintaining efficiency. Interestingly, employing high-power control strategies, operating at an order of magnitude higher wattage, did not significantly improve the spanwise control authority. The maximum spanwise control length achieved was limited to only of the array’s length. This highlights the challenges in achieving consistent control across the entire wing span with finite-span SJAs, which may be attributed to the impact of highly turbulent, uncontrolled flow beyond the extent of the array.
The study also investigates how the flow field, dynamics, and vortical structures vary across a wide range of DCs, offering insights into control effectiveness and lift force stability, which are crucial for aviation applications. With the blowing ratio held constant, the DC was varied from low () to medium () to high () values. Although all control cases achieved flow reattachment, differences were observed in the flow dynamics. Low-DCs resulted in unsteady control, while higher DCs produced a phase-invariant flow field and thus steady aerodynamic effects throughout the actuation period. This behaviour is explained by the analysis of the SJA-induced spanwise vortices, which serve as the primary mechanism in flow reattachment. At the low DC the vortices were larger, lifted off the airfoil surface, and dissipated earlier along the chord, reducing their effectiveness in transporting momentum from the freestream into the shear layer. Conversely, at high DCs, the vortices were smaller, yet stronger, and remained close to the suction surface, effectively transporting momentum and energizing the shear layer. Additionally, at low DCs, the chordwise dissipation point of vortices was found to be phase-dependent, explaining the variation in the shear layer dynamics across the actuation period. These results suggest that overly conservative flow control strategies with low DCs can lead to unstable aerodynamic effects.
Lastly, the study found a strong correlation between the lift coefficient and the strength of the suction peak, demonstrating that single-point pressure measurements can serve as reliable indicators of lift. This finding is particularly important for rapidly testing various control parameters, including modulation frequency, DC, and blowing ratio, to identify optimal combinations for different flow conditions.
Funding Sources
This work was supported by the Natural Science and Engineering Research Council of Canada and the SciNet High Performance Computing consortium and the Canadian Microelectronics Corporation (CMC).
References
- Lin [2002] Lin, J. C., “Review of research on low-profile vortex generators to control boundary-layer separation,” Progress in Aerospace Sciences, Vol. 38, 2002, pp. 389–420. 10.1016/S0376-0421(02)00010-6.
- Zhou and Wang [2012] Zhou, Y., and Wang, Z. J., “Effects of Surface Roughness on Separated and Transitional Flows over a Wing,” AIAA Journal, Vol. 50, 2012, pp. 593–609. 10.2514/1.J051237.
- Taylor et al. [2015] Taylor, K., Leong, C. M., and Amitay, M., “Load control on a dynamically pitching finite span wind turbine blade using synthetic jets,” Wind Energy, Vol. 18, 2015, pp. 1759–1775. 10.1002/we.1789.
- Greenblatt and Williams [2022] Greenblatt, D., and Williams, D. R., “Flow Control for Unmanned Air Vehicles,” Annual Review of Fluid Mechanics, Vol. 54, 2022, pp. 383–412. 10.1146/annurev-fluid-032221-105053.
- Viswanathan et al. [2022] Viswanathan, V., Epstein, A. H., Chiang, Y.-M., Takeuchi, E., Bradley, M., Langford, J., and Winter, M., “The challenges and opportunities of battery-powered flight,” Nature, Vol. 601, 2022, pp. 519–525. 10.1038/s41586-021-04139-1.
- Greenblatt and Wygnanski [2000] Greenblatt, D., and Wygnanski, I. J., “The control of flow separation by periodic excitation,” Progress in Aerospace Sciences, Vol. 36, 2000, pp. 487–545. 10.1016/S0376-0421(00)00008-7.
- Smith and Glezer [1998] Smith, B. L., and Glezer, A., “The formation and evolution of synthetic jets,” Physics of Fluids, Vol. 10, 1998, pp. 2281–2297. 10.1063/1.869828.
- Glezer and Amitay [2002] Glezer, A., and Amitay, M., “Synthetic Jets,” Annual Review of Fluid Mechanics, Vol. 34, 2002, pp. 503–529. 10.1146/annurev.fluid.34.090501.094913.
- Seifert and Pack [1999] Seifert, A., and Pack, L. G., “Oscillatory Control of Separation at High Reynolds Numbers,” AIAA Journal, Vol. 37, 1999, pp. 1062–1071. 10.2514/2.834.
- Smith and Swift [2003] Smith, B. L., and Swift, G. W., “A comparison between synthetic jets and continuous jets,” Experiments in Fluids, Vol. 34, 2003, pp. 467–472. 10.1007/s00348-002-0577-6.
- Cicca and Iuso [2007] Cicca, G. M. D., and Iuso, G., “On the near field of an axisymmetric synthetic jet,” Fluid Dynamics Research, Vol. 39, 2007, pp. 673–693. 10.1016/j.fluiddyn.2007.03.002.
- Salunkhe et al. [2016] Salunkhe, P., Tang, H., Zheng, Y., and Wu, Y., “PIV measurement of mildly controlled flow over a straight-wing model,” International Journal of Heat and Fluid Flow, Vol. 62, 2016, pp. 552–559. 10.1016/j.ijheatfluidflow.2016.08.004.
- Rice et al. [2018] Rice, T. T., Taylor, K., and Amitay, M., “Quantification of the S817 airfoil aerodynamic properties and their control using synthetic jet actuators,” Wind Energy, Vol. 21, 2018, pp. 823–836. 10.1002/we.2197.
- Xu et al. [2023] Xu, K., Lavoie, P., and Sullivan, P., “Flow Reattachment on a NACA 0025 Airfoil Using an Array of Microblowers,” AIAA Journal, 2023, pp. 1–10. 10.2514/1.J062512.
- Seifert et al. [2010] Seifert, A., David, S., Fono, I., Stalnov, O., and Dayan, I., “Roll Contrial via Active Flow Control: From Concept to Flight,” Journal of Aircraft, Vol. 47, 2010, pp. 864–874. 10.2514/1.45910.
- Toyoda and Hiramoto [2009] Toyoda, K., and Hiramoto, R., “Manipulation of vortex rings for flow control,” Fluid Dynamics Research, Vol. 41, 2009, p. 051402. 10.1088/0169-5983/41/5/051402.
- Goodfellow et al. [2013] Goodfellow, S. D., Yarusevych, S., and Sullivan, P. E., “Momentum Coefficient as a Parameter for Aerodynamic Flow Control with Synthetic Jets,” AIAA Journal, Vol. 51, 2013, pp. 623–631. 10.2514/1.J051935.
- Amitay et al. [2001] Amitay, M., Smith, D. R., Kibens, V., Parekh, D. E., and Glezer, A., “Aerodynamic Flow Control over an Unconventional Airfoil Using Synthetic Jet Actuators,” AIAA Journal, Vol. 39, 2001, pp. 361–370. 10.2514/2.1323.
- Tang et al. [2014] Tang, H., Salunkhe, P., Zheng, Y., Du, J., and Wu, Y., “On the use of synthetic jet actuator arrays for active flow separation control,” Experimental Thermal and Fluid Science, Vol. 57, 2014, pp. 1–10. 10.1016/j.expthermflusci.2014.03.015.
- Feero et al. [2017a] Feero, M. A., Lavoie, P., and Sullivan, P. E., “Influence of synthetic jet location on active control of an airfoil at low Reynolds number,” Experiments in Fluids, Vol. 58, 2017a. 10.1007/s00348-017-2387-x.
- Shuster et al. [2005] Shuster, J., Pink, R., McEligot, D., and Smith, D., The Interaction of a Circular Synthetic Jet with a Cross-Flow Boundary Layer, AIAA, 2005, p. 4749. 10.2514/6.2005-4749, URL https://arc.aiaa.org/doi/abs/10.2514/6.2005-4749.
- Jeyalingam and Jabbal [2016] Jeyalingam, J., and Jabbal, M., “Optimization of Synthetic Jet Actuator design for noise reduction and velocity enhancement,” 8th AIAA Flow Control Conference, American Institute of Aeronautics and Astronautics, 2016. 10.2514/6.2016-4236.
- Van Buren et al. [2016] Van Buren, T., Beyar, M., Leong, C. M., and Amitay, M., “Three-dimensional interaction of a finite-span synthetic jet in a crossflow,” Physics of Fluids, Vol. 28, No. 3, 2016, p. 037105. 10.1063/1.4943493, URL https://doi.org/10.1063/1.4943493.
- Yang et al. [2022] Yang, E., Ekmekci, A., and Sullivan, P. E., “Phase evolution of flow controlled by synthetic jets over NACA 0025 airfoil,” Journal of Visualization, Vol. 25, 2022, pp. 751–765. 10.1007/s12650-021-00824-5.
- Feero et al. [2017b] Feero, M. A., Lavoie, P., and Sullivan, P. E., “Three-dimensional span effects of high-aspect ratio synthetic jet forcing for separation control on a low Reynolds number airfoil,” Journal of Visualization, Vol. 20, 2017b. 10.1007/s12650-016-0365-7.
- Liu et al. [2022] Liu, R.-B., Wei, W.-T., Wan, H.-P., Lin, Q., Li, F., and Tang, K., “Experimental study on airfoil flow separation control via an air-supplement plasma synthetic jet,” Advances in Aerodynamics, Vol. 4, 2022, p. 34. 10.1186/s42774-022-00126-w.
- Machado et al. [2024a] Machado, A., Xu, K., and Sullivan, P. E., “Visualizing three-dimensional effects of synthetic jet flow control,” Journal of Visualization, Vol. 27, 2024a. 10.1007/s12650-024-00992-0.
- Amitay and Glezer [2002a] Amitay, M., and Glezer, A., “Controlled transients of flow reattachment over stalled airfoils,” International Journal of Heat and Fluid Flow, Vol. 23, 2002a, pp. 690–699. 10.1016/S0142-727X(02)00165-0.
- Glezer et al. [2005] Glezer, A., Amitay, M., and Honohan, A. M., “Aspects of Low- and High-Frequency Actuation for Aerodynamic Flow Control,” AIAA Journal, Vol. 43, 2005, pp. 1501–1511. 10.2514/1.7411.
- Feero et al. [2015] Feero, M. A., Goodfellow, S. D., Lavoie, P., and Sullivan, P. E., “Flow Reattachment Using Synthetic Jet Actuation on a Low-Reynolds-Number Airfoil,” AIAA Journal, Vol. 53, 2015, pp. 2005–2014. 10.2514/1.J053605.
- Borghi et al. [2017] Borghi, C. A., Cristofolini, A., Neretti, G., Seri, P., Rossetti, A., and Talamelli, A., “Duty cycle and directional jet effects of a plasma actuator on the flow control around a NACA0015 airfoil,” Meccanica, Vol. 52, 2017, pp. 3661–3674. 10.1007/s11012-017-0692-3.
- An et al. [2017] An, X., Williams, D. R., da Silva, A. F., Colonius, T., and Eldredge, J., “Response of the Separated Flow over an Airfoil to a Short-Time Actuator Burst,” 47th AIAA Fluid Dynamics Conference, American Institute of Aeronautics and Astronautics, 2017. 10.2514/6.2017-3315.
- Rice et al. [2021] Rice, T. T., Taylor, K., and Amitay, M., “Pulse modulation of synthetic jet actuators for control of separation,” Physical Review Fluids, Vol. 6, 2021, p. 093902. 10.1103/PhysRevFluids.6.093902.
- Kim et al. [2022] Kim, M., Essel, E. E., and Sullivan, P. E., “Effect of varying frequency of a synthetic jet on flow separation over an airfoil,” Physics of Fluids, Vol. 34, 2022. 10.1063/5.0077334.
- Abdolahipour et al. [2021] Abdolahipour, S., Mani, M., and Taleghani, A. S., “Parametric study of a frequency-modulated pulse jet by measurements of flow characteristics,” Physica Scripta, Vol. 96, 2021, p. 125012. 10.1088/1402-4896/ac2bdf.
- Machado et al. [2024b] Machado, A., Xu, K., and Sullivan, P. E., “Spanwise control authority of synthetic jets on a stalled airfoil,” Physics of Fluids, Vol. 36, 2024b. 10.1063/5.0212135.
- Margalit et al. [2005] Margalit, S., Greenblatt, D., Seifert, A., and Wygnanski, I., “Delta Wing Stall and Roll Control Using Segmented Piezoelectric Fluidic Actuators,” Journal of Aircraft, Vol. 42, No. 3, 2005, pp. 698–709. 10.2514/1.6904, URL https://doi.org/10.2514/1.6904.
- Steinfurth and Haucke [2018] Steinfurth, B., and Haucke, F., “Coherent Structures in the Actively Controlled Wake of a High-Lift Configuration,” AIAA Journal, Vol. 56, 2018, pp. 3848–3856. 10.2514/1.J057094.
- Berthold and Haucke [2020] Berthold, A., and Haucke, F., “Influence of Excitation Frequency, Phase Shift, and Duty Cycle on Cooling Ratio in a Dynamically Forced Impingement Jet Array,” Journal of Turbomachinery, Vol. 142, 2020. 10.1115/1.4046616.
- Chovet et al. [2016] Chovet, C., Lippert, M., Keirsbulck, L., and Foucaut, J.-M., “Dynamic characterization of piezoelectric micro-blowers for separation flow control,” Sensors and Actuators A: Physical, Vol. 249, 2016, pp. 122–130. 10.1016/j.sna.2016.08.016.
- Ho and Machado [2024] Ho, H. H., and Machado, A., “Computational and experimental study of spanwise synthetic jet flow control,” Thirteenth International Symposium on Turbulence and Shear Flow Phenomena (TSFP13), 2024.
- Hussain and Reynolds [1970] Hussain, A. K. M. F., and Reynolds, W. C., “The mechanics of an organized wave in turbulent shear flow,” Journal of Fluid Mechanics, Vol. 41, 1970, pp. 241–258. 10.1017/S0022112070000605.
- Buchmann et al. [2013] Buchmann, N. A., Atkinson, C., and Soria, J., “Influence of ZNMF jet flow control on the spatio-temporal flow structure over a NACA-0015 airfoil,” Experiments in Fluids, Vol. 54, 2013, p. 1485. 10.1007/s00348-013-1485-7.
- Hunt et al. [1998] Hunt, J., Wray, A., and Moin, P., “Eddies, streams, and convergence zones in turbulent flows,” Studying Turbulence Using Numerical Simulation Databases, 2. Proceedings of the 1988 Summer Program, 1998, pp. 193–208.
- Amitay and Glezer [2002b] Amitay, M., and Glezer, A., “Role of Actuation Frequency in Controlled Flow Reattachment over a Stalled Airfoil,” AIAA Journal, Vol. 40, 2002b, pp. 209–216. 10.2514/2.1662.