Scale dependent alignment between velocity and magnetic field fluctuations in the solar wind and comparisons to Boldyrev’s phenomenological theory
Abstract
A theory of incompressible MHD turbulence recently developed by Boldyrev predicts the existence of a scale dependent angle of alignment between velocity and magnetic field fluctuations that is proportional to the lengthscale of the fluctuations to the power 1/4. In this study, plasma and magnetic field data from the Wind spacecraft are used to investigate the angle between velocity and magnetic field fluctuations in the solar wind as a function of the timescale of the fluctuations and to look for the power law scaling predicted by Boldyrev. Because errors in the velocity vector can create large errors in the angle measurements, particularly at small scales, the angle measurements are suspected to be unreliable except at the largest inertial range scales. For the data at large scales the observed power law exponents range from 0.25 to 0.34, which are somewhat larger than Boldyrev’s prediction of 0.25. The results suggest that the angle may scale like a power law in the solar wind, at least at the largest inertial range scales, but the observed power law exponents appear to differ from Boldyrev’s theory.
Keywords:
Solar wind, Plasma turbulence, Magnetohydrodynamics:
52.35.Ra, 96.50.Tf, 96.50.Bh1 Introduction
Phenomenological turbulence theories developed independently by Iroshnikov Iroshnikov (1964) and Kraichnan Kraichnan (1965) extended and adapted the ideas of Kolmogorv’s well known theory of hydrodynamic turbulence to incompressible MHD turbulence. Both Iroshnikov and Kraichnan predicted an equipartition of energy between kinetic and magnetic field fluctuations in the inertial range and an energy spectrum proportional to . But these early studies neglected the anisotropy of the turbulence which was subsequently found to be ubiquitous in both laboratory plasma experiments and in theoretical studies based on analysis and simulations of the equations of resistive incompressible MHD Shebalin et al. (1983). Turbulence in magnetized plasmas is spatially anisotropic with the local mean magnetic field providing a natural axis of symmetry.
More recent theories of incompressible MHD turbulence incorporate the anisotropy of the turbulence into the theory in a fundamental way. An influential theory of this kind is the theory of Goldreich and Sridhar (1995) Goldreich and Sridhar (1995), hereafter GS95, with important corrections by Goldreich and Sridhar (1997) Goldreich and Sridhar (1997). GS95 introduced the idea of ‘critical balance’ in which there is a balance between the eddy turnover time, or energy cascade time, and the Alfvén crossing time of two wavepackets propagating in opposite directions along the local mean magnetic field. As a consequence of critical balance, the GS95 theory predicts that for a typical wavepacket the wavelengths parallel and perpendicular to the local field satisfy the anisotropic relation and the perpendicular energy spectrum is proportional to .
The decade following the publication of GS95 saw improved simulations of incompressible MHD turbulence in two and three dimensions, many of which showed that for plasmas with a strong mean magnetic field comparable to or greater than the r.m.s. magnetic field fluctuations the perpendicular energy spectrum scales like in contradiction to the GS95 theory Maron and Goldreich (2001); Ng et al. (2003); Müller et al. (2003); Müller and Grappin (2005). To resolve this discrepancy Boldyrev Boldyrev (2005, 2006) developed a new phenomenological theory with a critical balance condition different from that of GS95. A somewhat different theory was derived by Beresnyak and Lazarian Beresnyak and Lazarian (2006). The key new idea introduced by Boldyrev is that as energy cascades from large to small scales through the inertial range the velocity and magnetic field fluctuations undergo an alignment process whereby the average angle between and is a monotonically decreasing function of scale. In his theory, Boldyrev predicts that the angle obeys the scaling law and that the perpendicular energy spectrum is proportional to .
Evidence for Boldyrev’s alignment process and for the scaling law have been obtained through direct numerical simulations of forced, steady state incompressible MHD turbulence in three dimensions by Mason et al. Mason et al. (2006, 2008). These simulations demonstrate that for a number of different types of forcing functions the system develops an inertial range spanning approximately one decade in wavenumber where the perpendicular energy spectrum is proportional to and, presumably over the same range, . The successful demonstration of Boldyrev’s alignment process by Mason et al. prompted us to consider whether this alignment process may also take place in the solar wind, a naturally occuring turbulent plasma that is directly accessible to in-situ spacecraft measurements Marsch (1991); Goldstein et al. (1995); Tu and Marsch (1995); Bruno and Carbone (2005). Therefore a study was undertaken to investigate the possible existence of a scale dependent alignment between velocity and magnetic field fluctuations in the solar wind. The results of this study shall now be briefly summarized.
2 The quantity being measured
Boldyrev and his colleagues measure the angle using the formula Mason et al. (2006, 2008)
| (1) |
where and are the projections of the fluctuations and onto the plane perpendicular to the local mean magnetic field , respectively, and the displacement is perpendicular to . It is desirable but not possible to employ precisely the same formula (1) when analyzing solar wind data. A single spacecraft essentially performs measurements along the solar wind flow direction. Because the flow is super-Alfvénic, Taylor’s “frozen turbulence” hypothesis may be used to relate the time between measurements to a spatial separation along the average flow direction, approximately the radial direction in heliocentric coordinates. The angle between the mean magnetic field and the average flow direction varies significantly due to variations in the direction of the mean magnetic field, but it is often near 45 degrees, the inclination of the Parker spiral at 1 AU. Even though the theory is formulated for fluctuations between two points and inclined at 90 degrees to the local mean magnetic field, we expect that any alignment (if it exists) will still be measureable at inclinations of 45 degrees Podesta et al. (2008).
The solar wind data employed in this study consists of simultaneous measurements of the average velocity vector and magnetic field vector from instruments on the Wind spacecraft. The data was acquired near the orbit of the earth at 1 AU when Wind was far away from the influences of the Earth’s magnetosphere and bow shock. The data have an approximate 24-second cadence. The intervals analyzed have durations from several days to several months. For a given time scale the fluctuations and are projected onto the plane perpendicular to the local mean magnetic field to obtain and , respectively. The average angle is then computed using equation (1). The local mean magnetic field is scale dependent and is defined as the average (vector) over the interval from to . The essential difference between this study and the method employed by Boldyrev is that the displacement is not perpendicular to in the solar wind.
3 Results
An example of the angle measurements obtained using Wind data is shown in Figure 1.
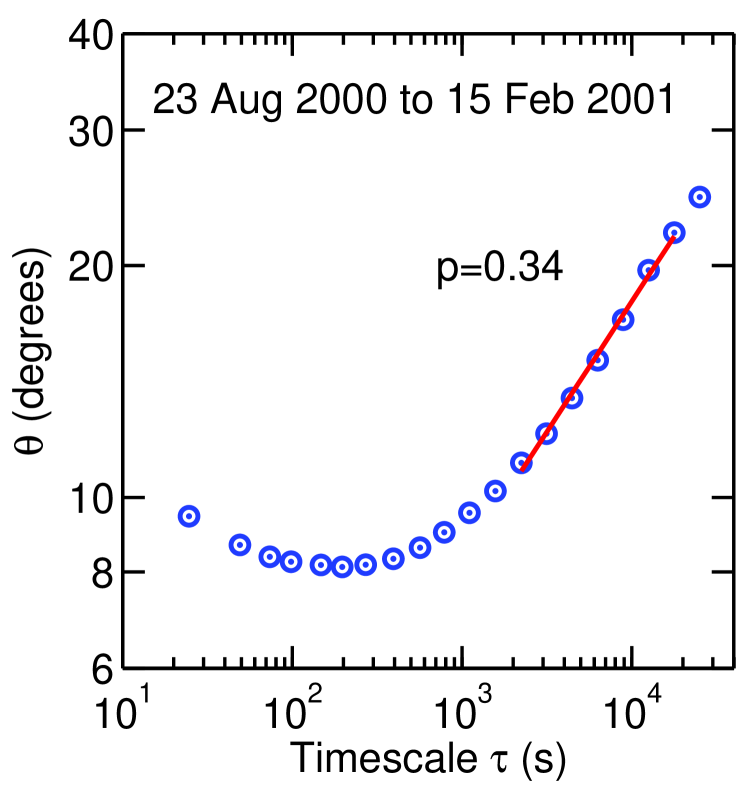
Note that the measurements span most of the inertial range, the range of timescales from approximately 3 s to s. All the data analyzed in this study show an approximate power law scaling at the largest inertial range scales (a straight line on a log-log plot) followed by a roll-over of the curve at medium to small scales. This roll-over is clearly a deviation from the power law behavior seen at the largest scales. We suspect that the roll-over is due to small errors in the plasma velocity measurements which can cause large errors in the angle measurements at small scales. For this reason, estimates of the power law exponent in the scaling law are only performed at the largest inertial range scales from to s. A linear least-squares fit on a log-log plot yields the best fit line and power law exponent for the data shown in Figure 1.
Proton velocity moments obtained using the 3DP instrument on Wind are subject to measurement errors, like any measurement apparatus. Let denote the typical measurement error for the velocity components , , and . Then, the typical error for the velocity difference is . Suppose the errors in the magnetic field are negligible compared to the errors in the velocity . To analyze the error, choose the -axis parallel to the vector and let the vector lie in the -plane. Then an error in the measured velocity will create an error in the angle as determined by the equations
| (2) |
Assuming the angles are all small, it follows that . If is replaced by its r.m.s. amplitude , then the quantity can be thought of as the smallest resolvable change in angle.
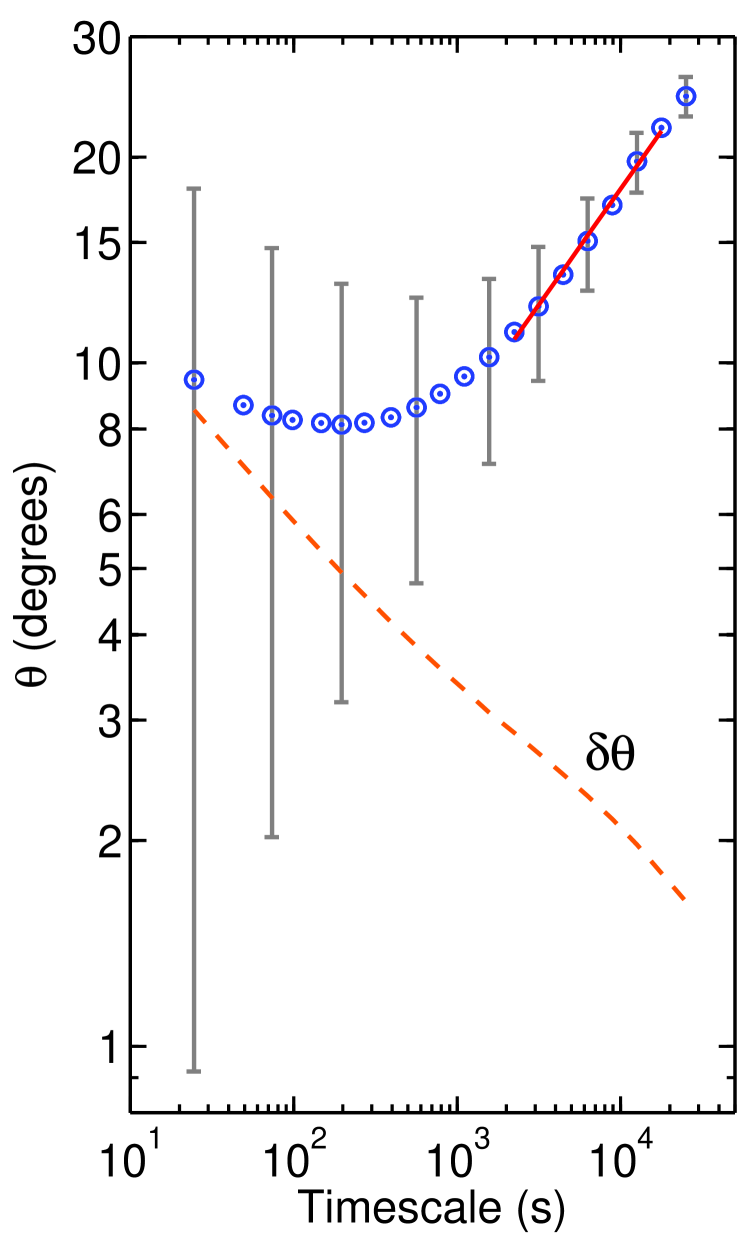
This rough error estimate can be used to derive rough error bars for the angle measurements in Figure 1. We emphasize that these are not true error bars, only a rough indication of the smallest resolvable angle at each scale. Assuming a typical value km/s, the rms velocity fluctuations are computed from the data and used to compute the estimated error . The result for is shown by the dashed orange line in Figure 2. Note that at the smallest scales the magnitude of is comparable to the measured average angle . This leads us to believe that the measurements at the smallest scales are unreliable. The error bars in Figure 2 furthermore suggest that data in the middle of the range are unreliable too. Only the data at the largest inertial range scales are considered to be sufficiently reliable for the purpose of estimating the power law exponent in the scaling law.
Results for the power law exponents estimated from linear least-squares fits over the range of timescales from to s are shown in Table 1. On average, the values for the power law exponent obtained from the data are larger than the value 0.25 predicted by Boldyrev’s theory. Therefore, the measurements are not in overall agreement with the theory. However, in two of four cases studied, intervals 2 and 3, the values and are within 8% of the predicted value 0.25. This prompts us to ask whether there may be differences in the solar wind conditions for intervals 2 and 3 compared to intervals 1 and 4, differences that may make it more likely to find agreement with the theory in the former case than in the latter. One difference is that intervals 2 and 3 consist of nearly homogeneous low-speed wind, devoid of any high speed streams, while intervals 1 and 4 both contain a notable presence of high speed streams. Recent work by Dasso et al. Dasso et al. (2005) has suggested that low-speed wind appears to be dominated by wavevectors perpendicular to the local mean magnetic field, as expected for quasi-2D turbulence, whereas high-speed wind appears to be dominated by wavevectors parallel to the mean field. If the turbulence in intervals 1 and 4 is not predominantly quasi-2D turbulence, then Boldyrev’s scaling law would not be expected to apply and that may explain why we observe deviations from Boldyrev’s scaling law in these cases. This interesting possibility needs further study.
| Interval | Begin Date | End Date | Days | |
|---|---|---|---|---|
| 1 | 01 Jan 1995 | 29 Jul 1995 | 209 | 0.34 |
| 2 | 15 May 1996 | 16 Aug 1996 | 93 | 0.25 |
| 3 | 08 Jan 1997 | 09 Jun 1997 | 152 | 0.27 |
| 4 | 23 Aug 2000 | 15 Feb 2001 | 176 | 0.34 |
4 Conclusions
The study of solar wind turbulence presented here suggests that the angle appears to scale like a power law at the largest inertial range scales, but in many cases the observed power law exponent is significantly larger than the value 1/4 predicted by Boldyrev’s theory. There is a clear breakdown of the scaling behavior at medium- to small-scales. Whether this breakdown is partly a genuine physical effect or is solely caused by measurement errors in the velocity data is not known at the present time. Therefore, we do not know whether the apparent power law scaling seen at large inertial range scales continues to hold at medium- and small-scales. More precise plasma measurements with errors less than 0.1 or 0.05 km/s for each velocity component are needed to answer this important question.
In half of the cases studied the power law exponent was within 8% of the value 0.25 predicted by Boldyrev. In these cases the solar wind can be characterized as generally low-speed wind without any high-speed streams. The better agreement with Boldyrev’s theory in these cases may be because low-speed wind is more quasi-2D in nature than high-speed wind as suggested by the analysis of Dasso et al. Dasso et al. (2005). This is an interesting open question.
References
- Iroshnikov (1964) P. S. Iroshnikov, Soviet Astronomy 7, 566 (1964).
- Kraichnan (1965) R. H. Kraichnan, Phys. Fluids 8, 1385–1387 (1965).
- Shebalin et al. (1983) J. V. Shebalin, W. H. Matthaeus, and D. Montgomery, J. Plasma Phys. 29, 525–547 (1983).
- Goldreich and Sridhar (1995) P. Goldreich, and S. Sridhar, Astroph. J. 438, 763–775 (1995).
- Goldreich and Sridhar (1997) P. Goldreich, and S. Sridhar, Astroph. J. 485, 680 (1997).
- Maron and Goldreich (2001) J. Maron, and P. Goldreich, Astroph. J. 554, 1175–1196 (2001).
- Ng et al. (2003) C. S. Ng, A. Bhattacharjee, K. Germaschewski, and S. Galtier, Phys. Plasmas 10, 1954–1962 (2003).
- Müller et al. (2003) W.-C. Müller, D. Biskamp, and R. Grappin, Phys. Rev. E. 67, 066302 (2003).
- Müller and Grappin (2005) W.-C. Müller, and R. Grappin, Physical Review Letters 95, 114502 (2005).
- Boldyrev (2005) S. Boldyrev, Astrophys. J. Lett. 626, L37–L40 (2005).
- Boldyrev (2006) S. Boldyrev, Physical Review Letters 96, 115002 (2006).
- Beresnyak and Lazarian (2006) A. Beresnyak, and A. Lazarian, Astrophys. J. 640, L175–L178 (2006).
- Mason et al. (2006) J. Mason, F. Cattaneo, and S. Boldyrev, Physical Review Letters 97, 255002 (2006).
- Mason et al. (2008) J. Mason, F. Cattaneo, and S. Boldyrev, Phys. Rev. E. 77, 036403 (2008).
- Marsch (1991) E. Marsch, MHD Turbulence in the Solar Wind, Physics of the Inner Heliosphere II. Particles, Waves and Turbulence, Springer-Verlag Berlin. Also Physics and Chemistry in Space, volume 21; 2, 1991, pp. 159–241.
- Goldstein et al. (1995) M. L. Goldstein, D. A. Roberts, and W. H. Matthaeus, Ann. Rev. Astron. Astroph. 33, 283–326 (1995).
- Tu and Marsch (1995) C.-Y. Tu, and E. Marsch, Space Science Reviews 73, 1 (1995).
- Bruno and Carbone (2005) R. Bruno, and V. Carbone, Living Reviews in Solar Physics 2, 4 (2005).
- Podesta et al. (2008) J. J. Podesta, B. D. G. Chandran, A. Bhattacharjee, D. A. Roberts, and M. L. Goldstein, J. Geophys. Res. (2008), submitted.
- Dasso et al. (2005) S. Dasso, L. J. Milano, W. H. Matthaeus, and C. W. Smith, Astroph. J. 635, L181–L184 (2005).