Search for PeV Gamma-Ray Emission from the Southern Hemisphere with 5 Years of Data from the IceCube Observatory
Abstract
The measurement of diffuse PeV gamma-ray emission from the Galactic plane would provide information about the energy spectrum and propagation of Galactic cosmic rays, and the detection of a point-like source of PeV gamma rays would be strong evidence for a Galactic source capable of accelerating cosmic rays up to at least a few PeV. This paper presents several un-binned maximum likelihood searches for PeV gamma rays in the Southern Hemisphere using 5 years of data from the IceTop air shower surface detector and the in-ice array of the IceCube Observatory. The combination of both detectors takes advantage of the low muon content and deep shower maximum of gamma-ray air showers, and provides excellent sensitivity to gamma rays between 0.6 PeV and 100 PeV. Our measurements of point-like and diffuse Galactic emission of PeV gamma rays are consistent with background, so we constrain the angle-integrated diffuse gamma-ray flux from the Galactic Plane at 2 PeV to at 90% confidence, assuming an E-3 spectrum, and we estimate 90% upper limits on point-like emission at 2 PeV between 10-21 - 10-20 for an E-2 spectrum, depending on declination. Furthermore, we exclude unbroken power-law emission up to 2 PeV for several TeV gamma-ray sources observed by H.E.S.S., and calculate upper limits on the energy cutoffs of these sources at 90% confidence. We also find no PeV gamma rays correlated with neutrinos from IceCube’s high-energy starting event sample. These are currently the strongest constraints on PeV gamma-ray emission.
1 Introduction
Cosmic rays arriving at Earth approximately follow a power-law energy spectrum over eleven orders of magnitude, from 1 GeV to 100 EeV, with a slightly changing spectral index and only a few notable features. The softening of the spectrum at the ‘knee’ at around 3 PeV and hardening of the spectrum at the ‘ankle’ at around 3 EeV are the most prominent features of the spectrum. It is generally believed that the Galactic contribution to the cosmic-ray flux begins decreasing at the knee but extends up to the ankle, where the extra-Galactic population is responsible for the spectral hardening (Gaisser, 2006). However, this belief remains unsubstantiated since Galactic sources capable of accelerating cosmic rays above a PeV have not been identified yet. Cosmic-ray interactions with the gas near the accelerator produce neutrinos and gamma-ray photons. Unlike cosmic rays, neutrinos and gamma rays are unaffected by magnetic fields and are thus critical towards the identification of these accelerators. Further, the cosmic rays which escape the local environment of their sources propagate through the Galaxy and interact with interstellar gas. The observable emission of neutrinos and gamma rays is expected to peak along the Galactic plane, where most of the interstellar gas is concentrated (Kalberla & Kerp, 2009). The measurement of this diffuse emission can provide information about the cosmic-ray diffusion processes and gauge the cosmic-ray spectrum at Galactic locations other than the Earth (Gaggero et al. 2015a and Acero et al. 2016).
The IceCube Observatory has observed an isotropic flux of astrophysical neutrinos (Aartsen et al. 2013c, Aartsen et al. 2014, Aartsen et al. 2015b) but no point-like sources have been resolved so far, except for recent strong indications of an extra-Galactic source based on multi-messenger observations (Aartsen et al., 2018). A recent study using neutrino data from both IceCube and ANTARES constrained the Galactic plane contribution to the isotropic flux to no more than 8.5% (Albert et al., 2018).
A complementary PeV gamma-ray search in the energy range of 0.6 PeV to 100 PeV is made possible by the presence of the surface air shower component of the IceCube Observatory. In this energy regime, gamma rays can only be observed over Galactic distances due to the high cross-section for pair production with the cosmic microwave background (CMB) radiation field (Protheroe & Biermann, 1996). Therefore, the measurement of PeV gamma rays can further constrain the Galactic contribution to the observed astrophysical neutrino flux. As the sole experiment to-date sensitive to PeV gamma rays in the Southern Hemisphere, the IceCube Observatory offers a unique window to high-energy processes in our Galaxy.
This paper will summarize the PeV gamma-ray measurements of the IceCube Observatory, and is a follow up of the previous study by Aartsen et al. (2013a), who used data taken over one year with a partial configuration of IceCube consisting of 40 strings (IC-40). Here, we analyze five years of data from the completed observatory with 86 strings and include inclined events recorded only by the surface array which significantly increases the detector acceptance over the entire field of view of (declination).
In the first part of this analysis, we obtain an air shower event sample rich in gamma-ray candidates by exploiting the key differences between air showers of cosmic-ray and gamma-ray origin. The most effective discriminator is the number of muons produced in the air shower. Muons are created in gamma-ray air showers from muon pair production as well as the decay of photo-produced pions and kaons (Drees et al. 1989, Halzen et al. 2009). However, these processes are much less frequent than muon production from nucleus-nucleus interactions in hadronic showers. From CORSIKA (Heck et al., 1998) simulations utilizing hadronic interaction models FLUKA (Battistoni et al., 2007) and SYBILL 2.1 (Ahn et al., 2009), we find that 1 PeV vertical proton showers contain roughly ten times the number of 1 GeV muons at the IceTop surface compared to 1 PeV vertical gamma-ray showers. This ratio increases to roughly a hundred for muons with energy greater than 460 GeV at the surface. The in-ice array of IceCube is sensitive to muons highly collimated around the shower axis with energies greater than 460 GeV at the surface. While the surface array is crucial to measure the energy deposited in the electromagnetic part of the shower, it is also sensitive to lower energy muons arriving far from the shower core. Additionally, the shower maximum from gamma-ray primaries occurs on average deeper in the atmosphere, resulting in a younger shower age (Risse & Homola, 2007). The stage of longitudinal shower development can be assessed from the electromagnetic component observed by the surface array. The gamma-hadron discrimination method is detailed in Section 3.3.
In the second part of this analysis, we search for point-like sources of PeV gamma rays in the Southern Hemisphere using the event sample containing gamma-ray-like events. The current generation of ground-based air Cherenkov detectors have uncovered a wealth of Galactic TeV gamma-ray sources (e.g. Abeysekara et al. 2017, Benbow et al. 2017, Carrigan et al. 2013). Of particular interest in this analysis are the results of the High Energy Spectroscopic System (H.E.S.S.), which has a field of view that overlaps with that of IceTop. H.E.S.S. is the only experiment to detect sources that show no evidence of a cutoff at TeV energies in a location testable by this analysis. These sources include Pulsar Wind Nebulae (PWN), Supernova Remnants (SNR), and several other unclassified sources (Carrigan et al., 2013). We search for emission spatially correlated with these known TeV gamma-ray sources in addition to an unbiased search for PeV gamma-ray sources across the entire analysis field of view. We also search for PeV counterparts to the IceCube neutrino events with a high likelihood of astrophysical origin (Aartsen et al., 2015c), a component of which may be of Galactic origin (Joshi et al. 2014, Ahlers & Murase 2014, Kachelriess & Ostapchenko 2014, Ahlers et al. 2016). The search methods are described in Section 4.1 and the results of the point source searches are presented in Sections 5.1, 5.2, and 5.3.
Diffuse gamma-ray emission from the Galactic plane has been measured by ground-based air/water Cherenkov observatories up to 10 TeV (Hunter et al. 1997, Aharonian et al. 2006, Abdo et al. 2008, Ackermann et al. 2012b). In the Northern hemisphere, CASA-MIA (Borione et al., 1998) has placed upper limits on a diffuse flux from the Galactic plane between 140 TeV and 1.3 PeV, while KASCADE-Grande has reported limits on an isotropic diffuse flux of gamma rays from 100 TeV to 1 EeV (Apel et al., 2017). The IC-40 analysis (Aartsen et al., 2013a) produced the sole limit on the PeV flux from a section of the Galactic plane visible in the Southern Hemisphere. In the third part of this analysis, we search for a diffuse flux from the Galactic plane within the field of view of IceTop (). We use the neutral pion decay component of the Fermi-LAT diffuse emission model (Ackermann et al., 2012a) as a spatial template in a maximum likelihood analysis described in Section 4.2). The result of this search is presented in Section 5.4.
2 The IceCube Observatory
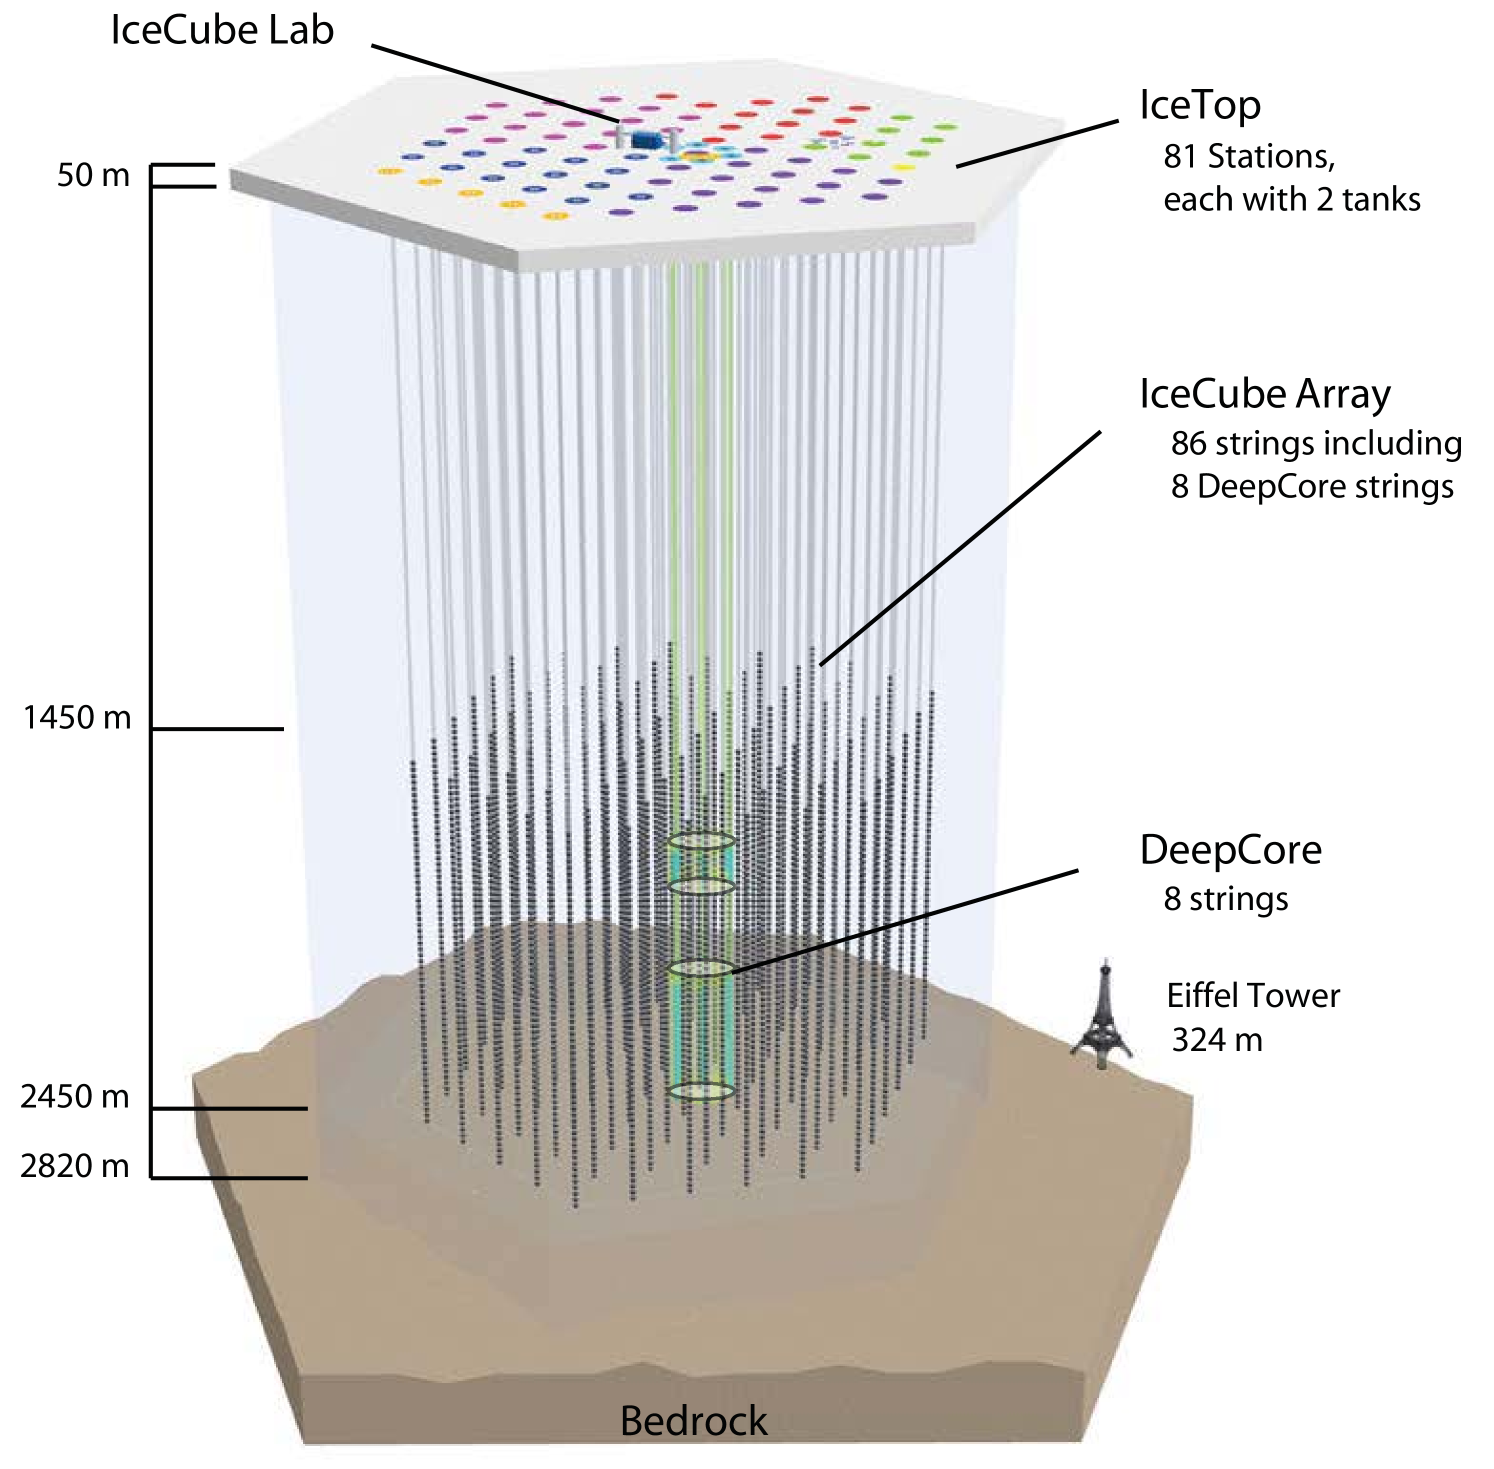
Located at the geographic South Pole, the IceCube observatory (sketched in Figure 1) consists of two major components - an in-ice array and a companion surface array known as IceTop. The in-ice array is capable of detecting neutrinos in the energy range of 100 GeV to EeV and high energy muons originating in the cosmic-ray showers, whereas the surface array is designed to detect air showers from cosmic rays in the energy range of 300 TeV to EeV. The IceCube observatory (Aartsen et al., 2017b) was completed in 2010 following seven years of construction.
The cubic kilometer in-ice array is comprised of a total of 5,160 optical sensors, or digital optical modules (DOMs), organized on 86 cables installed in the ice between depths of 1450 m and 2450 m. Each DOM contains a 10-inch Hamamatsu photomultiplier tube in addition to electronic boards necessary for triggering, digitization, and readout (Abbasi et al., 2009). The in-ice array detects the Cherenkov photons emitted by relativistic charged particles traversing the array.
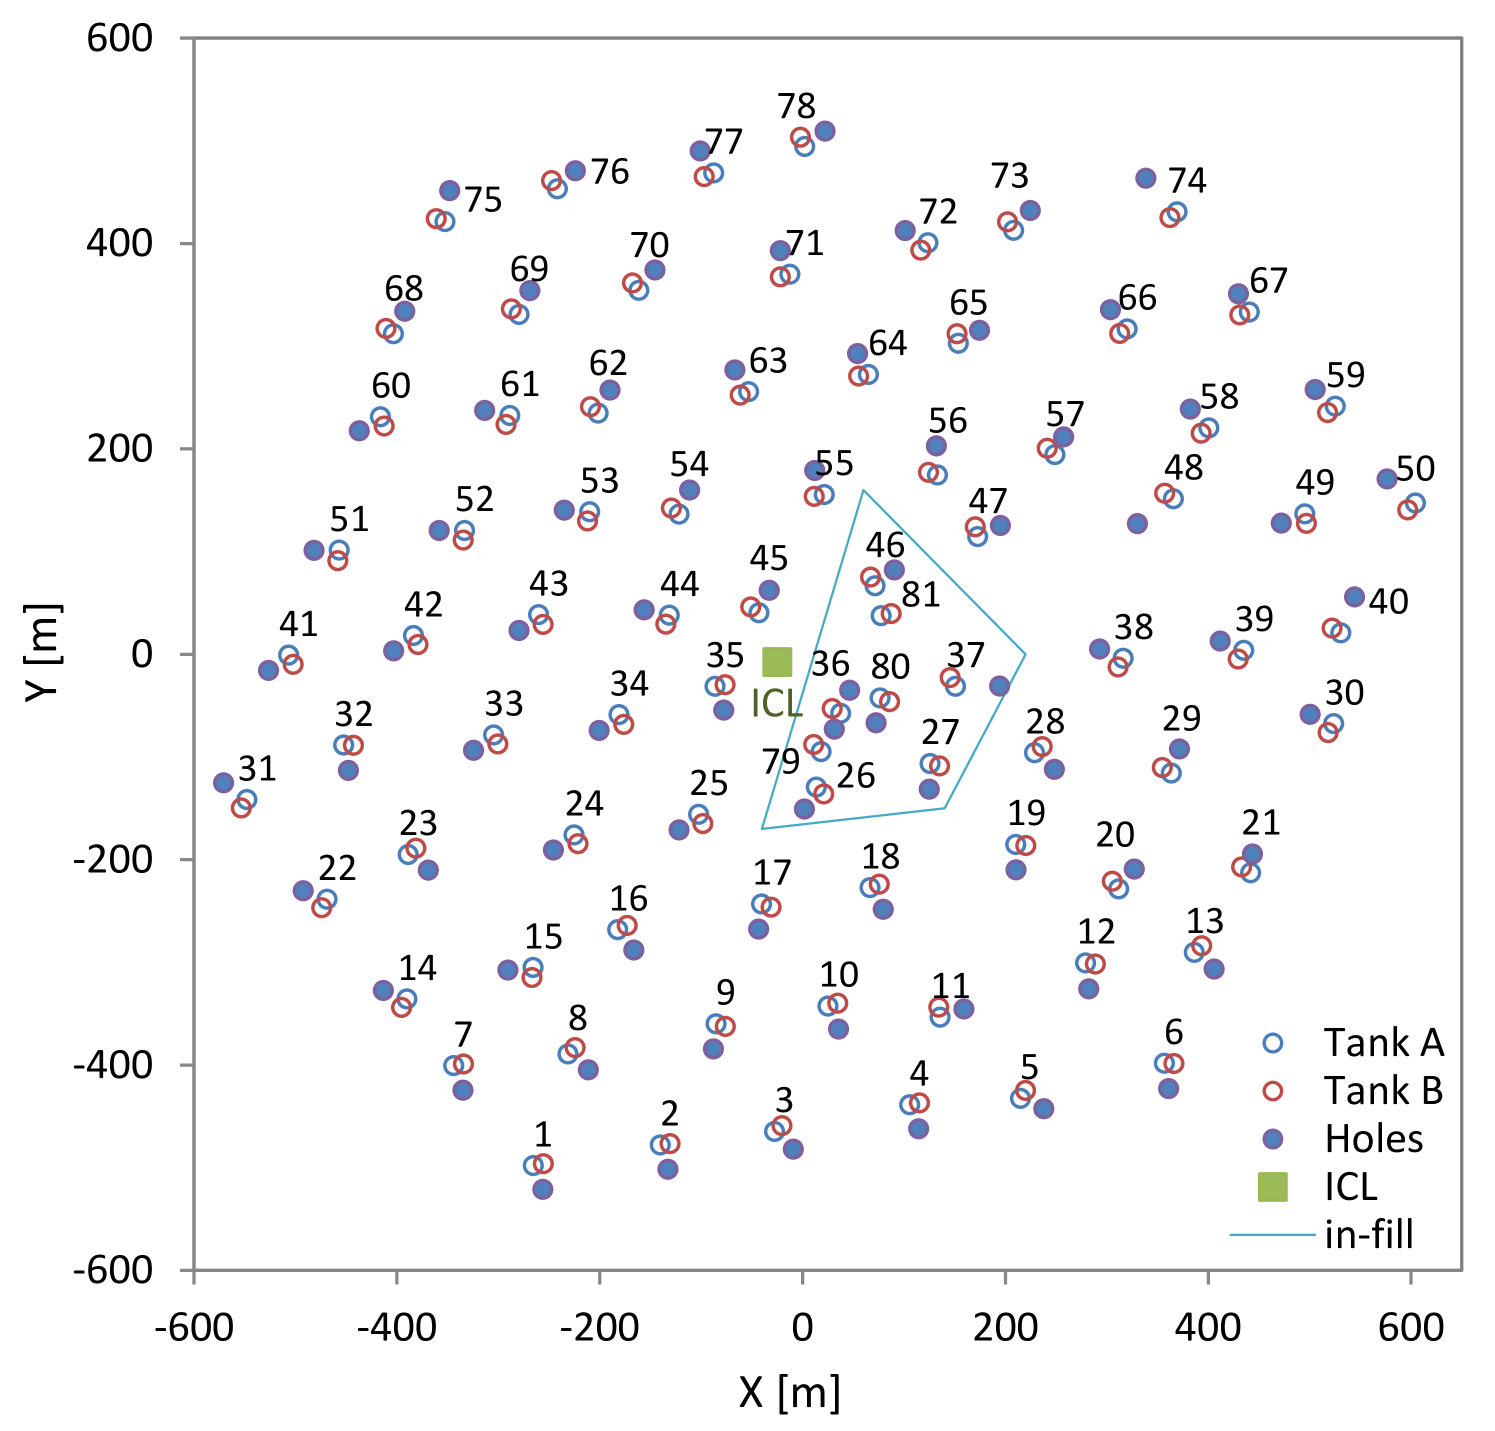
The surface array of the IceCube observatory, IceTop (Abbasi et al., 2013), is located on top of the ice sheet at an altitude of 2835 meters above sea level. The geometry of IceTop is displayed in Figure 2. IceTop is comprised of 81 stations, where a station is defined as two tanks filled with ice that are situated above a subset of IceCube strings. Each tank contains two DOMs embedded in ice and configured with different PMT gains in order to increase the dynamic range of signal measurement. In this way, each tank is capable of detecting the Cherenkov radiation from muons and other charged particles traversing it. IceTop triggers on extensive air showers by measuring the Cherenkov light inside the tanks emitted by air shower particles or by secondary particles from their interactions in ice. At the surface, a typical cosmic-ray muon has an energy of a few GeV. Such minimum ionizing muons, passing through a tank, will deposit roughly the same amount of energy depending on their path length inside the tank. Every DOM’s charge spectrum from single muons, obtained from low-energy cosmic ray showers, is fitted to find the charge value corresponding to vertical muons. Thus all IceTop DOMs are calibrated to convert their charge value to a standard ’Vertical Equivalent Muon’ (VEM) unit.
1
| Data Year | Livetime [Days] | [m] | Nevents (total) | Nevents (PS) | Nevents (GP) |
|---|---|---|---|---|---|
| 2011 | 308.7 | 2.10 | 27551210 | 97034 | 68286 |
| 2012 | 295.9 | 2.25 | 35662684 | 85079 | 64823 |
| 2013 | 321.4 | 2.25 | 35215316 | 107009 | 79787 |
| 2014 | 325.7 | 2.30 | 33174803 | 96682 | 73473 |
| 2015 | 325.2 | 2.30 | 30244777 | 85657 | 61907 |
Note. — For each data year, the livetime of the data runs used in the final analysis, the snow absorption length used in the charge correction, as well as the number of events before classification, classified as gamma-ray candidates by the point source (PS) event selection, and classified as gamma-ray candidates by the galactic plane (GP) event selection.
In this analysis, both the surface and in-ice arrays are used to discriminate gamma-ray induced air showers from cosmic-ray induced air showers. Reconstructions using IceTop signals for an air shower provide the energy proxy, arrival direction, and a primary mass sensitive parameter (see Section 3.3.2), while the in-ice array provides an estimate of the energy deposited by TeV muons for air showers whose axis passes through the deep ice detector.
3 Dataset Construction
Five years of experimental data is used in this analysis, collected between May 2011 and May 2016. We use a machine learning classifier to separate gamma-ray signal from cosmic-ray background. During the training of this classifier, 10% of the observed data is used to model background, leaving 90% available for the final analysis. Since the expected fraction of gamma rays in the air shower data is very low (), we use data in lieu of Monte-Carlo simulations as a proxy for the cosmic-ray background. This greatly reduces the systematic dependencies inherent to simulation such as the choice of hadronic interaction model, atmospheric model, cosmic-ray composition model, and snow height averaging. The total livetime of the data used for each year in the final analysis is listed in Table 1. To model signal, Monte-Carlo simulations of gamma-ray air showers were produced using CORSIKA version 7.37, with high-energy hadronic interactions treated with SYBILL 2.1 and low-energy hadronic interactions modeled using FLUKA. 80% of the gamma-ray Monte-Carlo was used in the training of the event classifiers, with the remaining 20% withheld to test the final analysis performance. The simulated gamma-ray showers were weighted to a power-law spectrum, with the choice of spectral index depending upon the source hypothesis. Simulations and data were treated identically with regards to event processing, event selection, and event reconstruction.
3.1 Air Shower Event Reconstruction
An event is recorded in IceTop whenever at least three stations (six tanks) are hit by a shower front within a time interval of 6 s. Then the data recorded from the collection of tanks for each event is filtered to remove uncorrelated background particle hits. The simultaneous reconstruction of shower size and arrival direction is carried out through the maximization of likelihood functions describing the lateral distribution of the signal and the shower front shape (Abbasi et al., 2013). The signal charge distribution, , around the shower core in the shower frame of reference is known as the lateral distribution function (LDF). The LDF chosen to describe air shower events in IceTop is an empirically derived double logarithmic parabola. At a lateral distance from the shower axis, the charge expectation in an IceTop tank is defined as
| (1) |
where , also referred to as shower size, is the fitted signal strength at a reference distance of 125 meters, is the fitted slope parameter correlated with shower age, and = 0.303 is a constant determined through simulation studies. The shower size, , is proportional to the energy of the primary particle, and is converted to a reconstructed energy, Ereco, using parameterization obtained from cosmic-ray simulations (Rawlins & Feusels, 2016).
Accumulation of snow on top of the IceTop tanks suppresses the electromagnetic portion of the air shower, requiring a correction factor to the signal expectation defined as
| (2) |
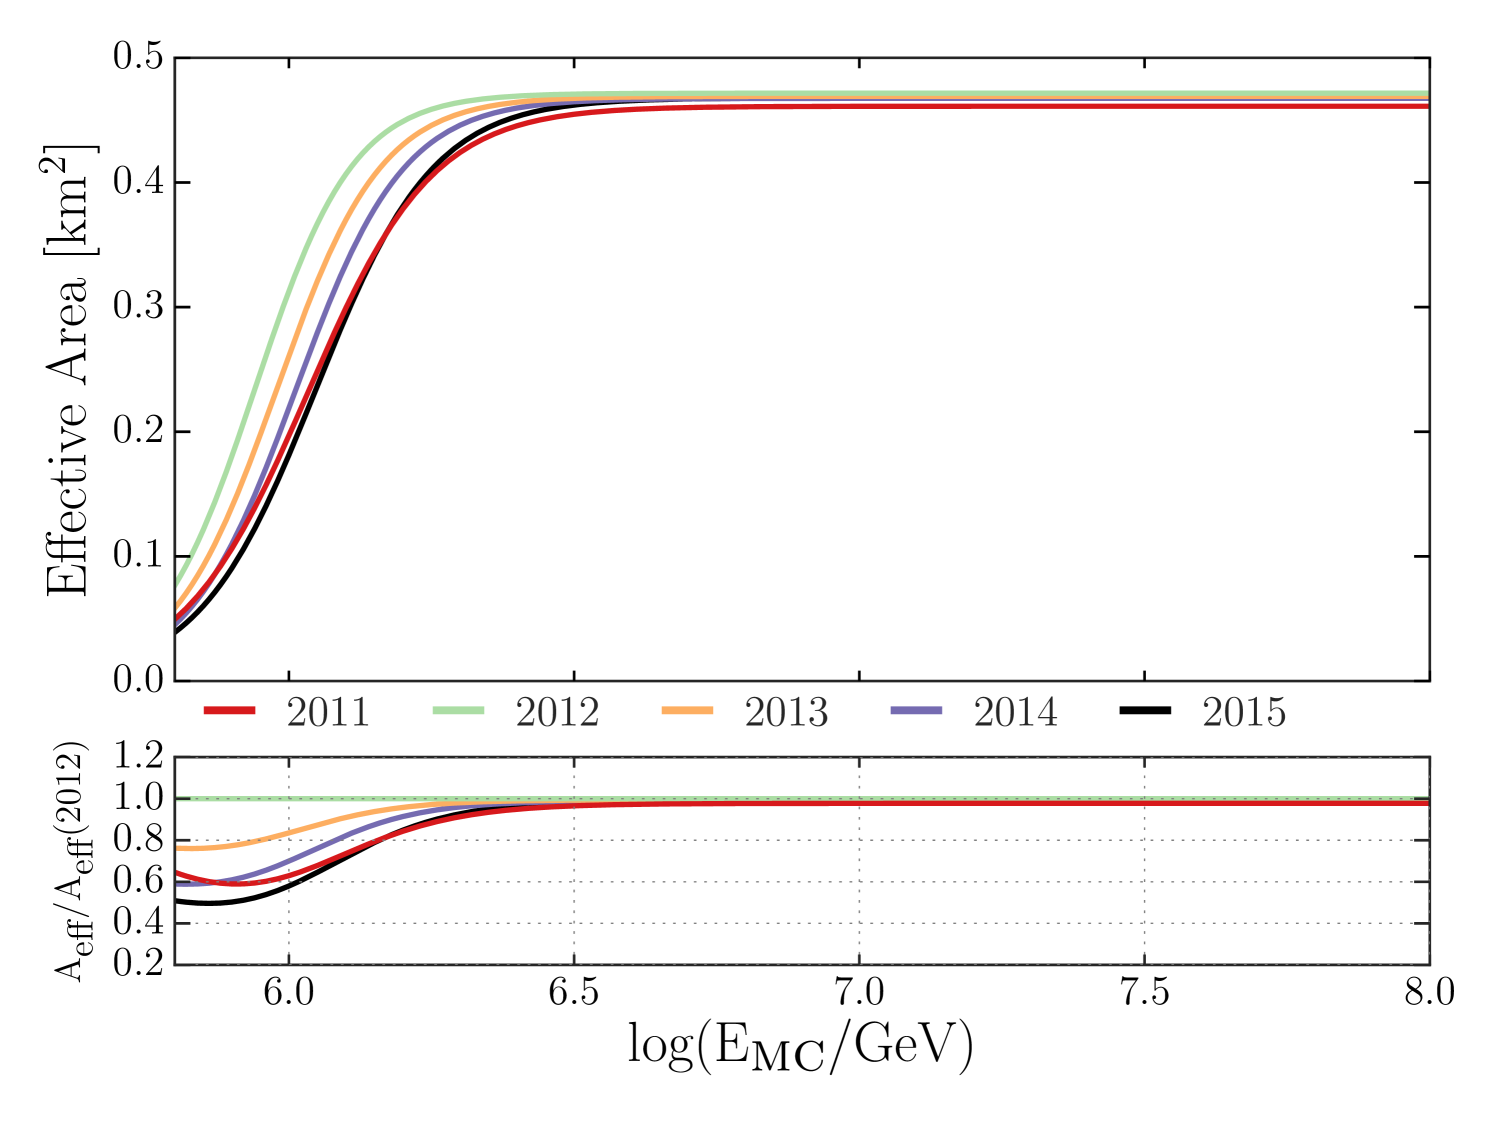
where is the corrected signal expectation, is the snow height above tank , is the reconstructed zenith angle of the shower, and is the effective absorption length in snow. The value for used for each analysis year is also listed in Table 1. The effective absorption length was optimized by comparing each year’s snow-corrected spectrum with the spectrum from the first year of operation with least amount of snow. Snow on top of IceTop tanks is constantly increasing at a rate of 20 cm per year, which significantly degrades the detector acceptance. In order to accurately account for this effect, the detector response was simulated for each year of data included in the analysis using the same set of CORSIKA gamma-ray showers. For each dataset, the snow level on top of the tanks was set to the snow heights measured during the austral summer season. Figure 3 shows the effective area of IceTop to gamma rays for each year as a function of the primary energy, illustrating the event rate loss caused by increasing amounts of snow. The effective area is lower for the 2011 data year due to low statistics for events with less than eight stations because only one in three such events were being transmitted north from the South Pole in 2011.
3.2 Quality Event Selection
To ensure good energy and direction reconstruction, the following quality cuts were applied:
-
1.
Events must trigger at least 5 IceTop stations (i.e., where both tanks in the station have DOMs with deposited charge within 1 s).
-
2.
The energy and directional reconstructions must converge.
-
3.
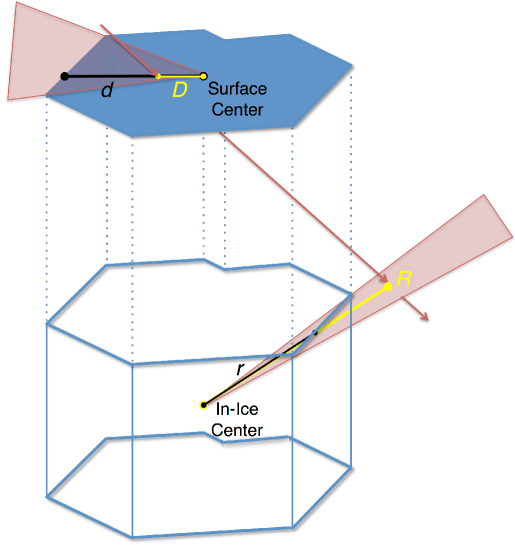
The reconstructed core position must be contained within the surface array geometry. Specifically, the event must satisfy / 1, where and are defined in Figure 4.
-
4.
The tank with the largest deposited charge must not lie on the edge of the IceTop array.
-
5.
At least one IceTop tank must have a signal greater than 6 VEM.
-
6.
The reconstructed zenith angles satisfy cos() 0.8.
-
7.
The reconstructed shower sizes satisfy .
We limit the event selection to E100 PeV, as extending to higher energies would have required additional higher energy gamma-ray simulations for a negligible improvement in sensitivity.
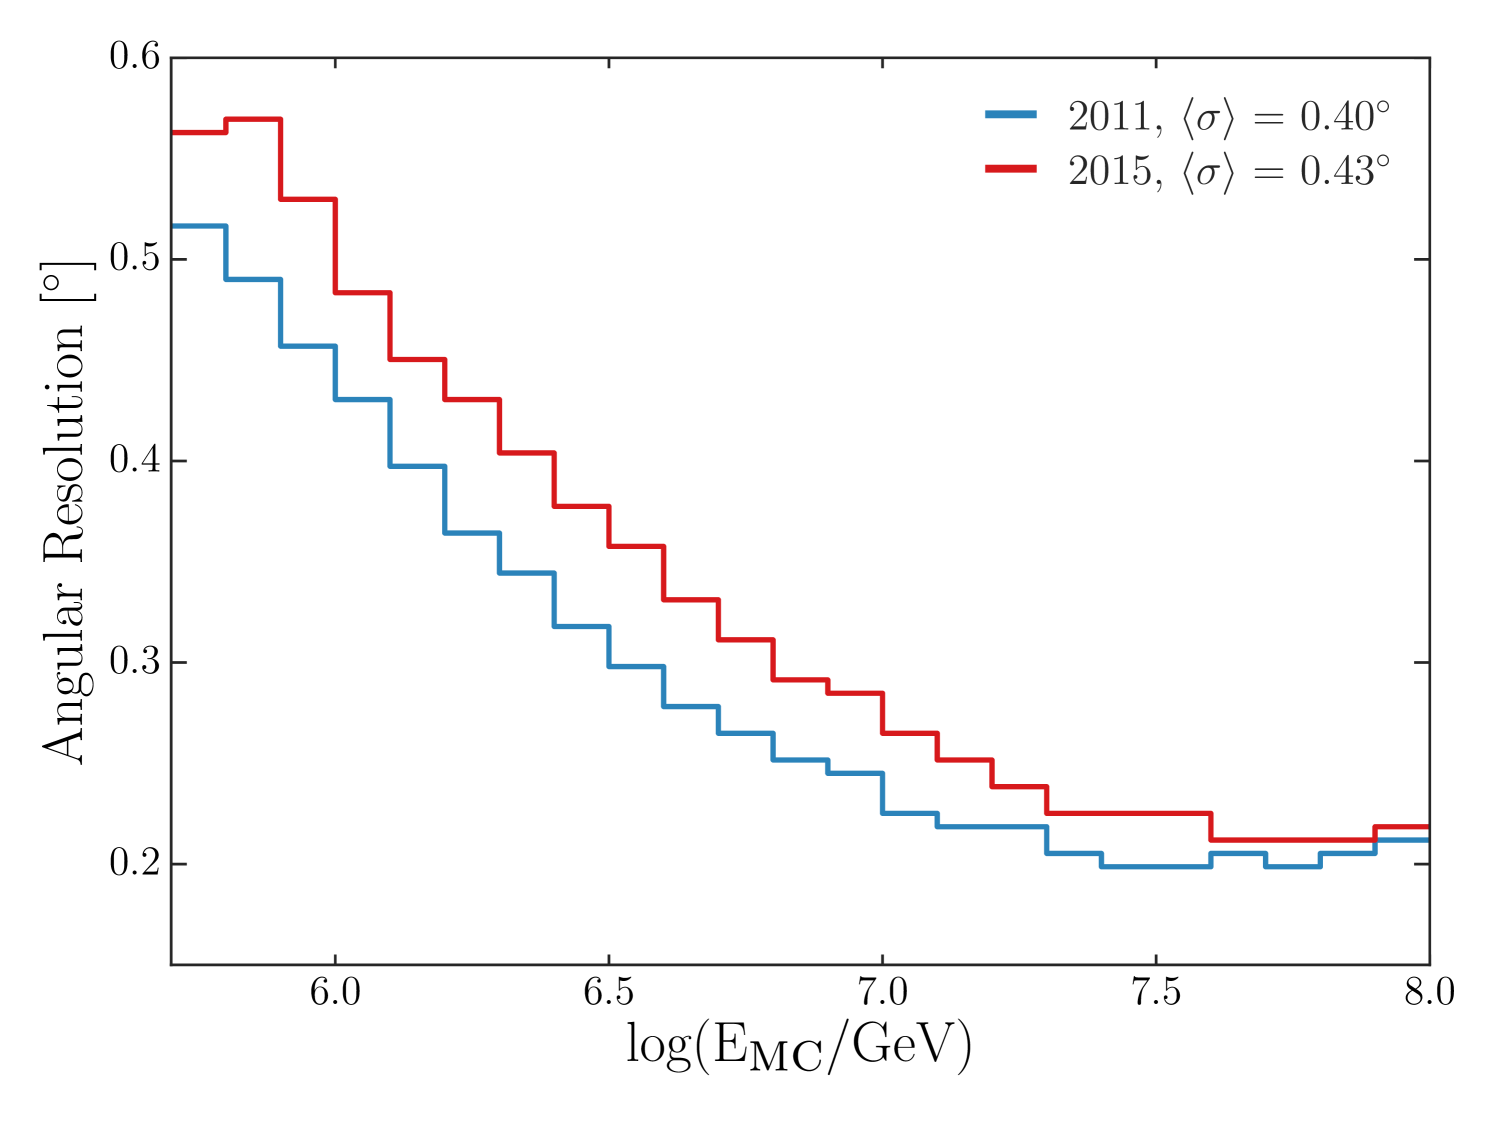
Angular resolution, defined as the angular radius that contains 68% of reconstructed showers coming from a fixed direction, drives the sensitivity of searches for point-like and extended sources. Figure 5 shows the angular resolution of simulated gamma rays as a function of the true primary energy. The first and last years are shown to illustrate the impacts of the snow accumulation on the angular resolution, which amounts to a degradation of around 8% on average.
3.3 Discriminating Gamma-ray Showers
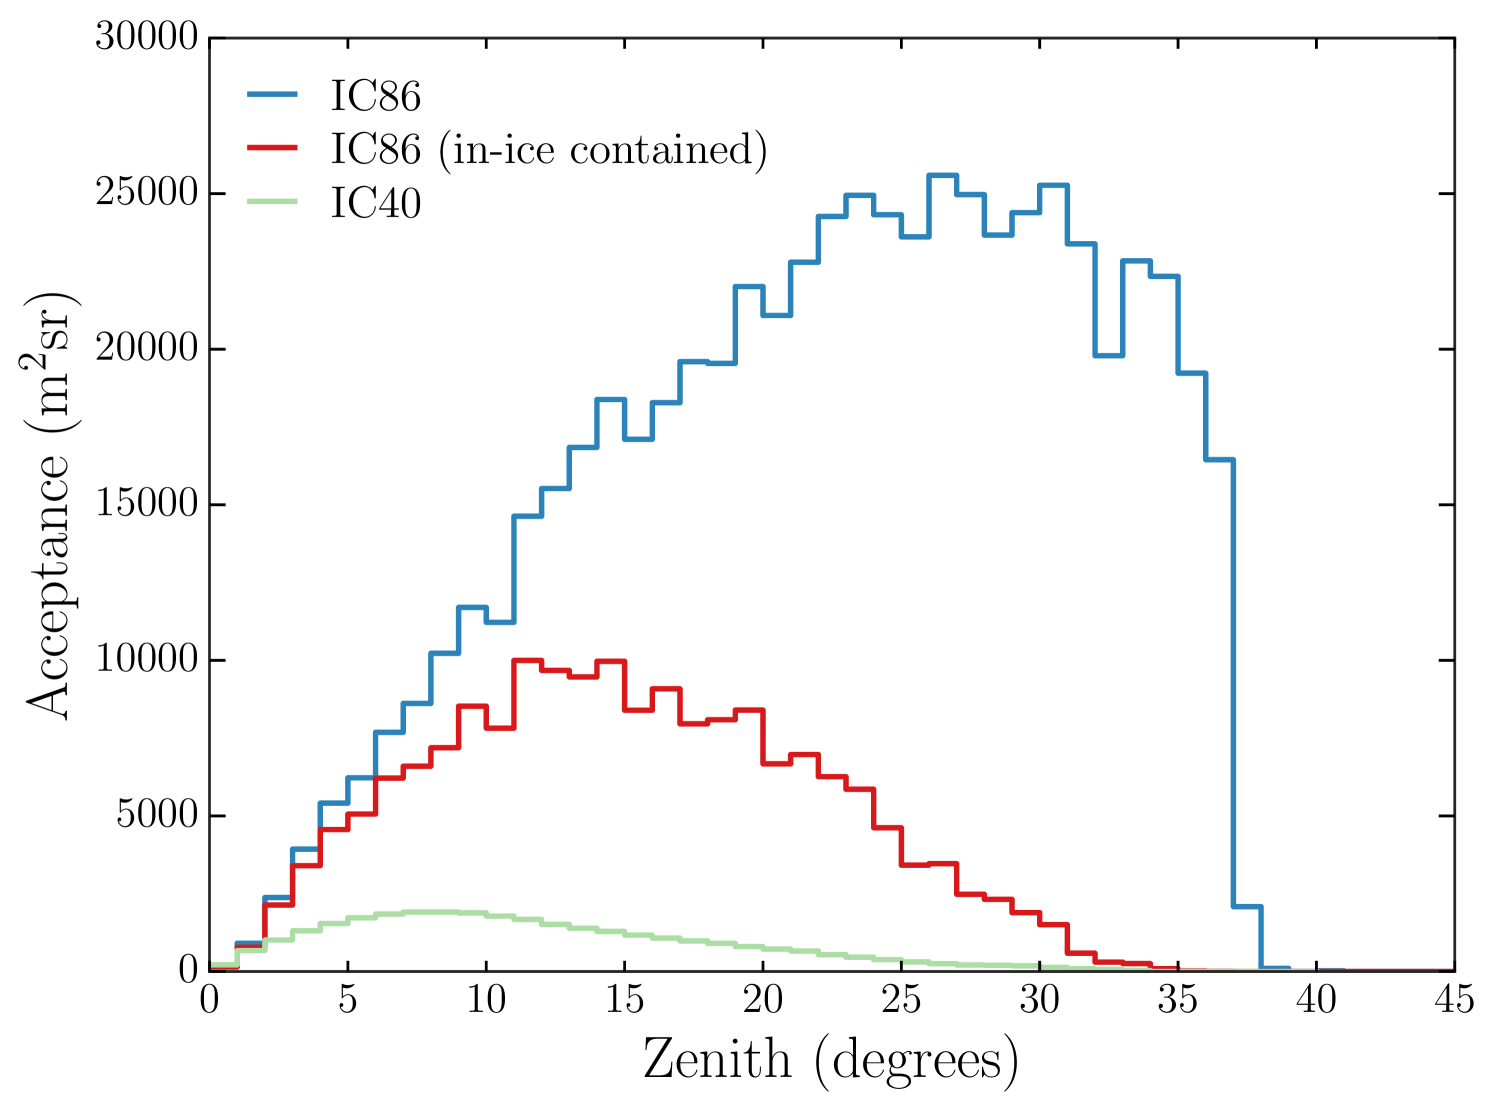
In order to extract all the shower information correlated with the type of the primary particle, both surface and in-ice components of the detector are utilized. Section 3.3.1 details the technique used to obtain clean data from the in-ice array which informs on the amount of high energy muons in the shower. Section 3.3.2 describes the implementation of a new likelihood method which optimally retrieves information from the surface array correlated with the number of low-energy muons, shower age, and shower profile. IceTop based shower discrimination allows us to include showers which do not pass through the in-ice array in the analysis. While the loss of in-ice information for these showers reduces separation power, there is a large increase in detector acceptance at higher zenith angles, which is displayed in Figure 6. We combine the in-ice and surface components in a single classifier using machine learning as described in Section 3.3.3.
3.3.1 High Energy Muons In Ice
Muons that have energy greater than 460 GeV at the surface are capable of generating light that can be detected by the photomultipliers of the in-ice array. This is the main parameter used to judge the hadronic content of air showers with trajectories that pass through the in-ice detector component. We use the total charge measured in-ice as a discriminating feature. In order to isolate the signal produced by muons, a cleaning procedure is applied to remove charge deposited by uncorrelated background particles. The cleaning procedure for events with or without an in-ice trigger are described below.
Nearest or next-to-nearest neighboring DOMs on the same string that have deposited charge (a ‘hit’) within a time window of 1 s are designated to be in Hard Local Coincidence (HLC). An in-ice trigger is defined as 8 or more such HLC hits in an event within a 5 s time window. An in-ice trigger which falls between 3.5 s and 11.5 s after the start of an IceTop trigger is considered coincident, in which case hits outside of the coincident time window are removed. Next, HLC hits are used as seeds in a hit selection algorithm which searches for single hits which are within 150 meters and 1 s of each seed DOM. In an iterative manner, single hits which satisfy the criteria are included in the seeds and the search is performed again. This is repeated three times. The combined charge of the final selection of hits is used as a discriminating feature.
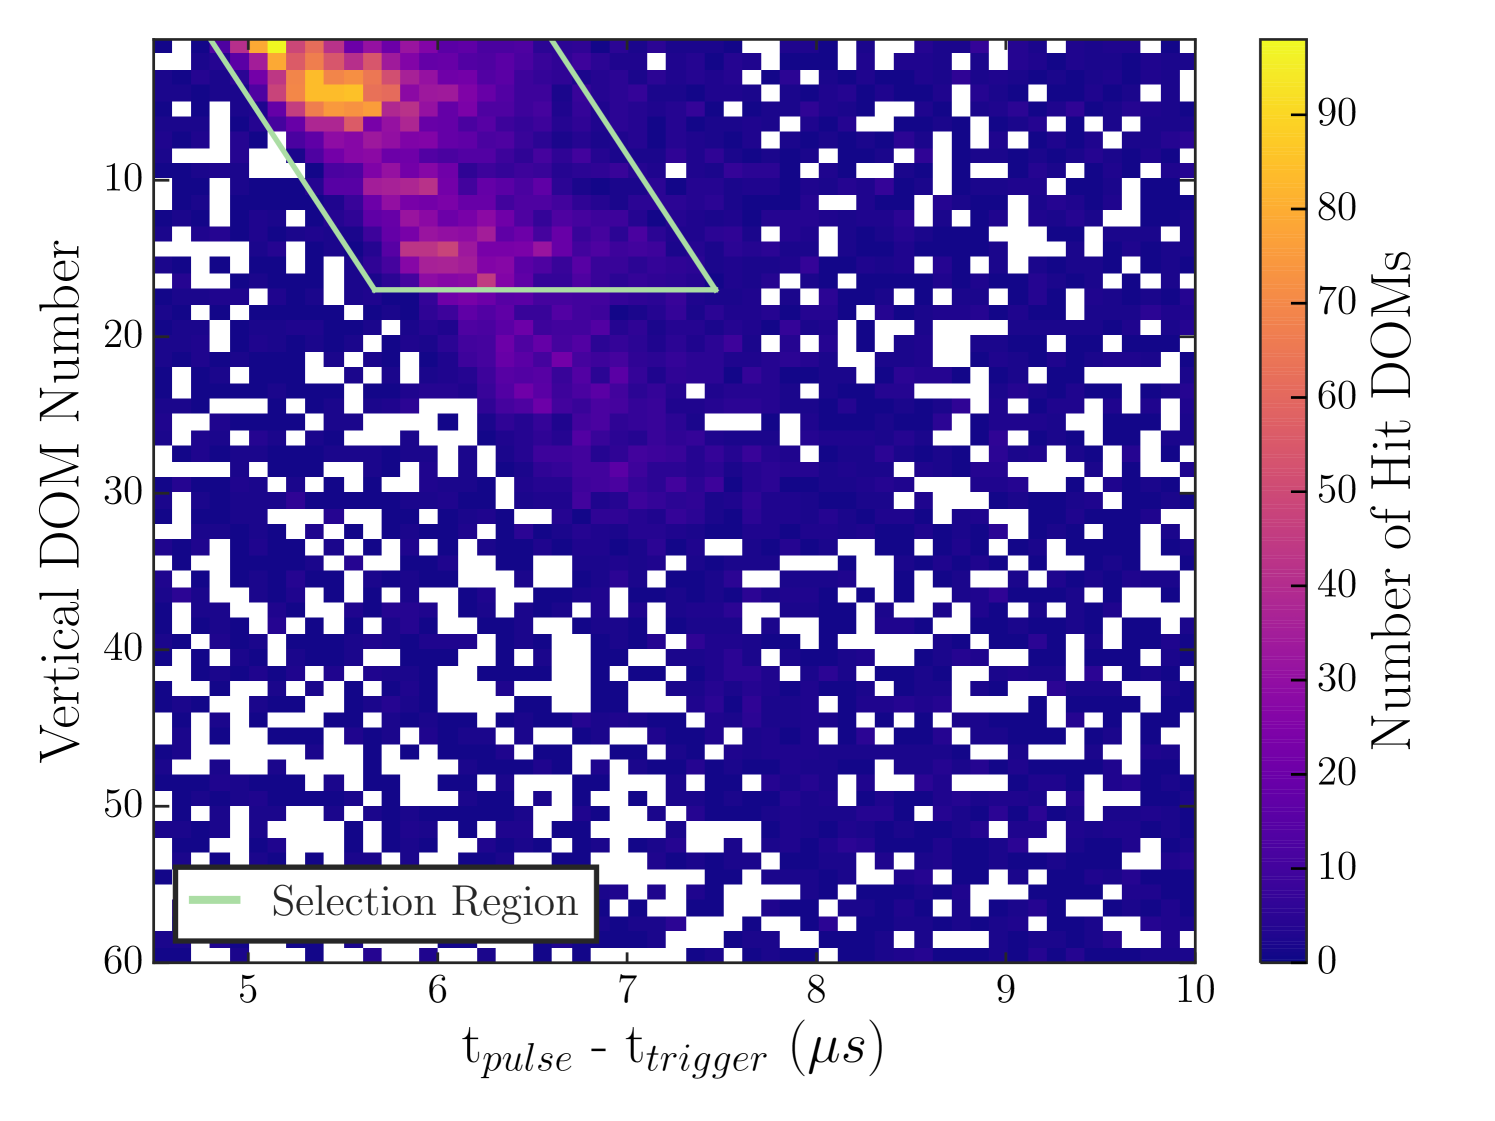
For those events which have only an IceTop trigger, simpler cleaning is applied. For HLC hits, a time window selection is used to reduce the uncorrelated muon background, optimized to be between 3.5 s and 9 s after the trigger in IceTop. Hadronic showers may produce isolated hits in IceCube without an HLC flag. This is illustrated in Figure 7, which displays the number of single hits as a function of vertical DOM number (analogous to depth) and time with respect to the trigger for a collection of events which have no HLC hits. There is a clear excess in hits near the top of the detector that is suitable for classification. A selection window is optimized by a maximization of the ratio of signal and square root noise. We define the front of the time window for charge selection as:
| (3) |
where is the reconstructed zenith angle of the event, is the depth of the hit in meters, and is the speed of light. Hits are retained if they fulfill the following criteria, represented by the green box shown in Figure 7:
-
1.
The hit is within 130 meters of the reconstructed shower axis.
-
2.
The hit is within the top 16 layers of in-ice DOMs.
-
3.
The hit has a time stamp , such that .
3.3.2 IceTop Shower Footprint
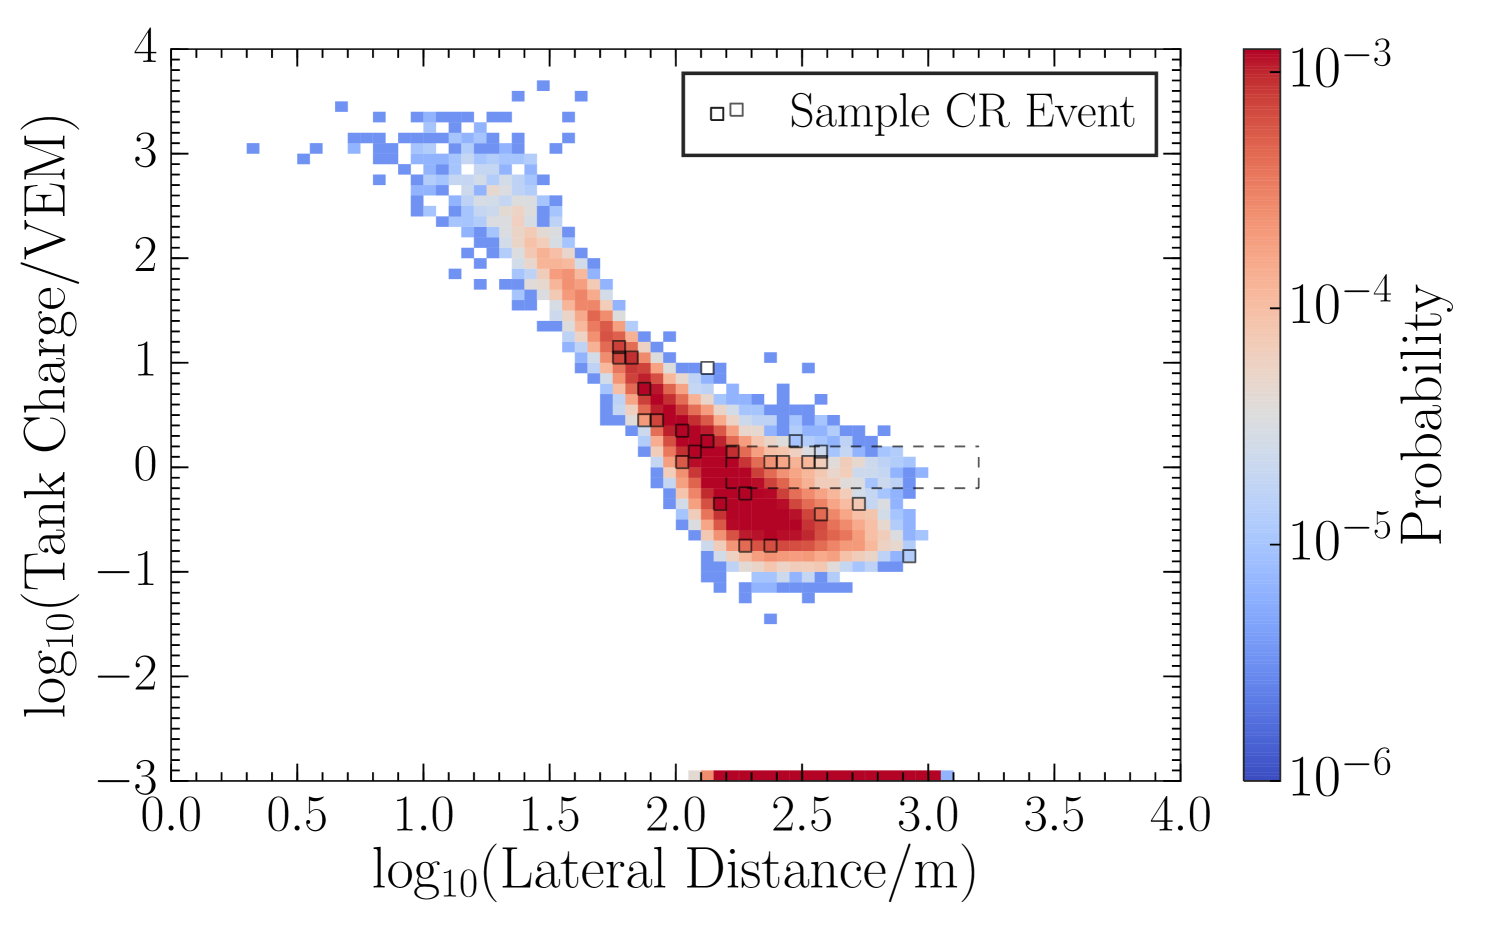
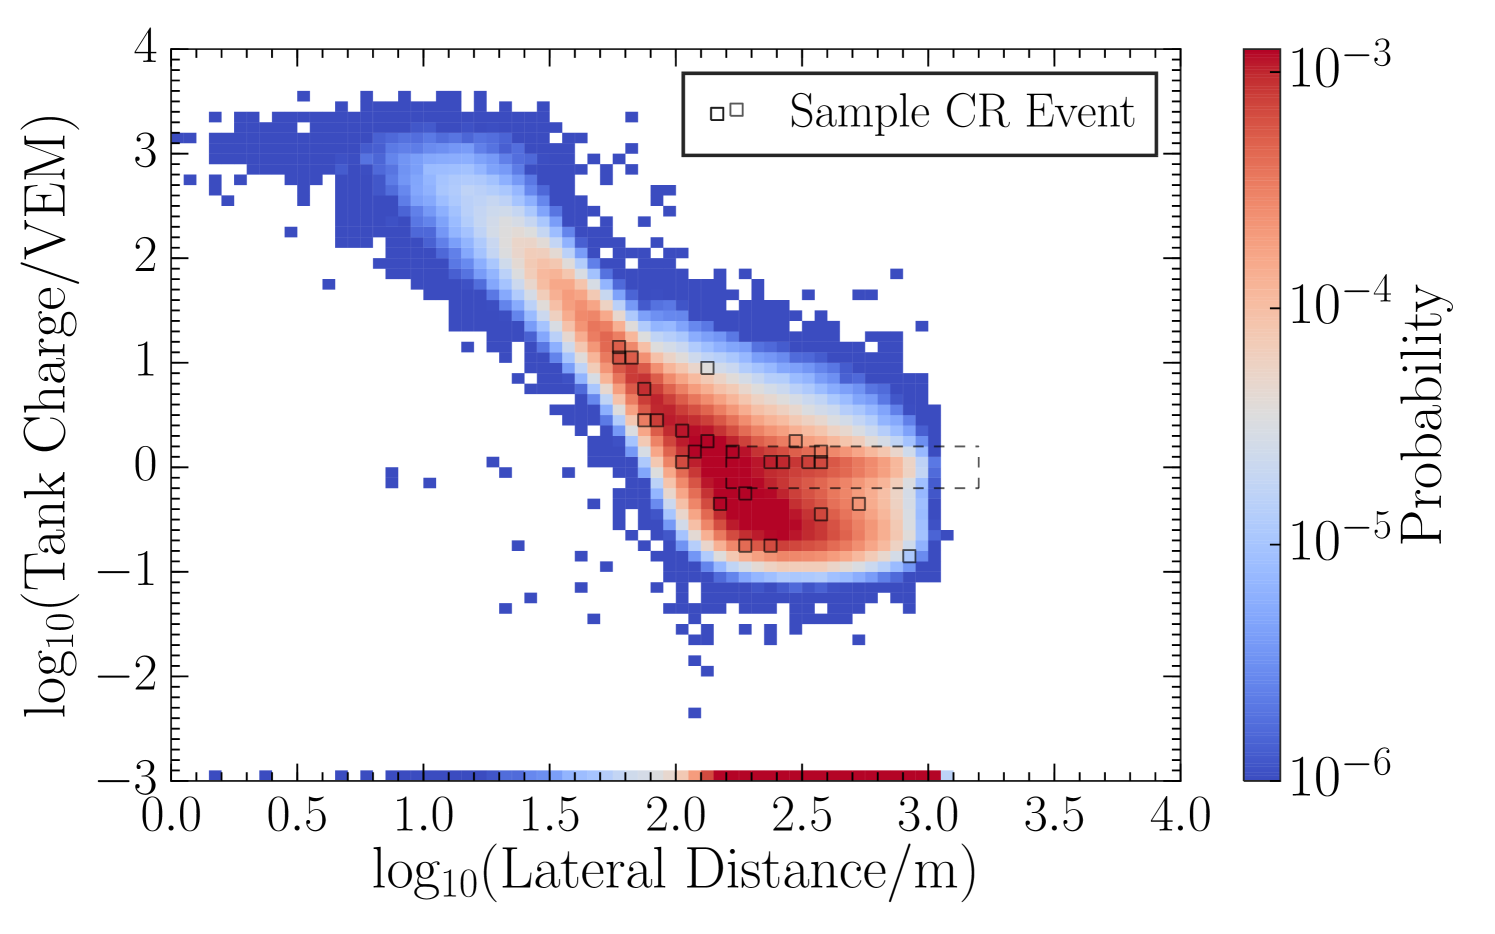
As discussed in Section 2, minimum ionizing muons passing through an IceTop tank deposit charge such that the peak of the muon charge distribution is at 1 VEM with a width attributed to the zenith angle distribution of muons (Abbasi et al., 2013). At sufficiently large distance from the shower core, the electromagnetic component becomes sub-dominant and the characteristic 1 VEM signals from GeV muons can be discerned. Figure 8 shows a probability distribution function (PDF) describing the distribution of the charges as function of the lateral distance from the reconstructed shower core, also called LDF, for simulated gamma rays and observed cosmic rays. The prominent muon signal can be seen emerging in the cosmic-ray PDF beyond 200 m while it is very diminished in the gamma-ray PDF. The local charge fluctuations, observed as the width of the charge distribution for a given lateral distance in Figure 8, is also a measure of the hadronic content of the shower. The longitudinal development stage of the shower is reflected in the slope of the LDF seen in Figure 8. The curvature of the shower front, i.e. arrival time distribution of particles as a function of the lateral distance, is also sensitive to the longitudinal stage of the shower as it reaches the IceTop surface.
We construct three two-dimensional PDFs that incorporate these shower front properties. For this we use information from individual IceTop tanks, which are indexed from 1i162. The PDFs are constructed using tank charges , their lateral distances from the reconstructed shower axis , and hit times with respect to the expected planar shower front arrival time . Gamma-ray simulations and 10% of cosmic-ray data are used to construct the PDFs for the gamma-ray and cosmic-ray hypotheses, respectively. Unhit and inactive tanks are included in the PDFs by assigning artificial and fixed values to charge and time (=0.001 VEM and =0.01 ns) outside the range of hit tank values. The lateral distance distribution of unhit tanks (as seen in the bottom of plots in Figure 8) also contributes to the differences between the gamma-ray and cosmic-ray PDFs.
Based on each of the three two-dimensional PDFs, a log-likelihood ratio is calculated for all events. For instance, the log-likelihood ratio using the lateral charge distribution for a given event is defined as
| (4) |
where the likelihood is defined as
| (5) |
with being the probability of observing a tank with measured charge and at lateral distance , for the hypothesis . Hit tanks for a sample cosmic-ray event, overlaid on PDFs in Figure 8 using hollow boxes, illustrate how such an event would collect a greater likelihood from the cosmic-ray PDF as compared to the gamma-ray PDF.
Similarly, one can calculate and from the PDFs that describe the time distribution of charges and the shower front curvature. The sum of all three log-likelihood ratios is then used as an input to a random forest classifier described in Section 3.3.3. The hadronic content and the longitudinal development stage of the shower at the surface depend on the primary energy and zenith angle in addition to mass of the primary particle. To reduce this dependence, the construction of PDFs and calculation of the log-likelihood ratio is carried out in bins of 0.1 and bins of 0.05.
3.3.3 Random Forest
The final event selection is performed using a random forest classifier implemented using the open-source python software Scikit-learn (Pedregosa et al., 2011). In total, five features are included in the training process:
-
1.
The total charge deposited in the in-ice array after applying the cleaning procedure described in Section 3.1.1.
-
2.
The likelihood sum as described in Section 3.1.2.
-
3.
The energy proxy .
-
4.
The cosine of the reconstructed zenith angle.
-
5.
A parameter which describes the containment of the shower axis within the in-ice array, defined to be , where and are defined in Figure 4.
To prevent over-training, the maximum tree depth is limited to 8. The output of the random forest is a score between 0 and 1, with 1 being the most gamma-ray-like. The signal threshold for classifying events as gamma rays is chosen to be 0.7. These values were optimized through a cross-validation grid search on sensitivity performance. Tuning the additional hyper-parameters of the random forest showed negligible impact and they were kept at their default values.
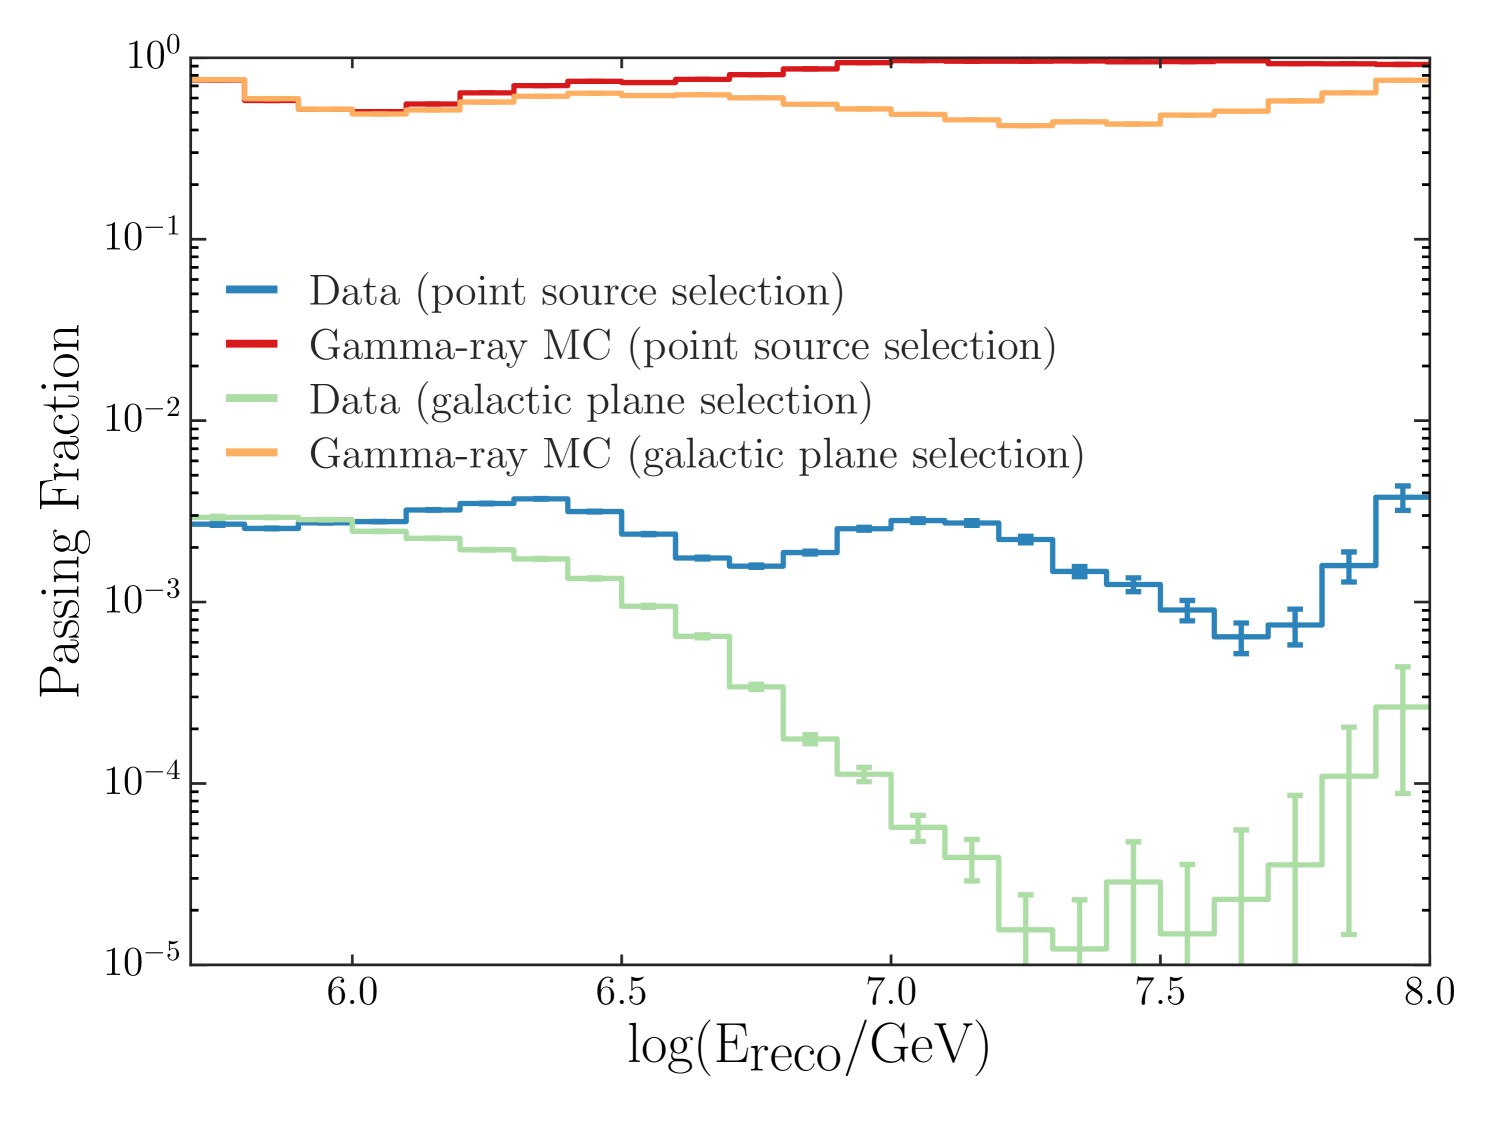
Due to the differences in flux expectation, the gamma-ray spectrum used for training the classifier is different for the point source and diffuse cases. For point sources, in order to be robust in performance to a range of spectral indices, we use two classifiers - one trained with a relatively hard (E-2.0) spectrum and the other with a relatively soft (E-2.7) spectrum. In this case, the event is retained if either classifier returns a score above the signal threshold value. For the diffuse case a single random forest trained with an E-3.0 spectrum is used (see Section 5.4 for the motivation behind the choice of spectral index). Figure 9 illustrates the fraction of events that pass the signal threshold cut as function of energy. The total number of events classified as gamma rays under this criteria for both cases are listed in Table 1 for each analysis year.
4 Likelihood Analysis Methods
All source hypotheses considered in this analysis were tested through an unbinned likelihood ratio method following the prescription of Braun et al. (2008). The form of the likelihood is dependent on the source class considered.
4.1 Point Sources
Sources that are point-like or extended in TeV gamma-ray astronomy should both appear point-like in this analysis. Hence, we construct a point source hypothesis for an unbiased source search in our entire field of view as well as for targeted H.E.S.S. source searches. The likelihood under this assumption takes the form:
| (6) |
The likelihood is a product over events in each of datasets, where each dataset is comprised of one year of data. For a dataset , is the number of signal events originating from the point source and is the total number of events. Each event has a direction consisting of a right ascension and declination , an energy , and an angular uncertainty . The events are compared to a point-source hypothesis comprised of a direction and spectral index . For the single source case the signal PDF is defined as:
| (7) |
where the angular uncertainty is included using a Gaussian distribution with a . Here, is the normalized signal energy distribution. The background PDF is defined as:
| (8) |
where is the declination-dependent detector acceptance to cosmic rays derived from data, and is the normalized background energy distribution. The background PDF is uniform in right ascension and constructed from cosmic-ray data randomized in right ascension.
The likelihood is maximized with respect to and , where is the total number of signal events distributed among the signal events of each dataset proportionally according to the effective area and livetime of the samples. This yields best fit values and and a test statistic defined as:
| (9) |
To evaluate the significance of an observed test statistic, a background test statistic ensemble is constructed from scrambled data using random right ascension values for the event directions. The p-value is the fraction of the ensemble that have a test statistic exceeding the observed value. When relevant, the number of independent trials performed (e.g. the number of H.E.S.S. source locations tested individually) is accounted for and a post-trial p-value is reported for the search.
To gauge the analysis sensitivity to point sources, a range of simulated fluxes are injected on top of scrambled data events. The sensitivity is defined as the flux which produces a test statistic above the median of the background-only trial ensemble at the injected direction in 90 of the trials. This is equivalent to the Neyman 90 confidence level construction (Neyman, 1941). The discovery potential is defined as the flux which achieves a 5 detection in 50 of the trials.
When searching for emission from the selected H.E.S.S. point sources, we include a test for signal from all sources combined. This stacking approach requires a modification to the likelihood, which we implement following the method in Aartsen et al. (2017a). For a catalog of point source locations, the signal PDF is constructed as:
| (10) |
where is the relative detector acceptance to gamma rays at the location of the source . In this form, the sources are weighted assuming equal flux at Earth for each source.
4.2 Diffuse Source
The source hypotheses for the Galactic plane and cascade neutrino (see Section 5.3) searches extend spatially over a significant portion of the sky. For these cases, it is no longer valid to treat the signal as having a negligible contribution to the background PDF by averaging the right ascension. Instead, a modification to the likelihood is made, following a method first introduced by Aartsen et al. (2015a) in a binned likelihood approach and later applied in an unbinned likelihood by Aartsen et al. (2017c), whose formulation we use here.
The background term in Equation 6 is replaced with two terms, and , which are the event densities of the experimental data and gamma-ray simulation, respectively, after averaging over right-ascension:
| (11) |
The construction of the signal PDF begins with a model of the gamma-ray flux distribution over the entire field of view. This raw signal term must be convolved with the detector response to produce the expected observed distribution of emission in direction and energy. This is executed through a bin-by-bin multiplication of the relative detector acceptance to gamma rays, determined through simulation, and the flux model. The point spread function of each event, described as a Gaussian distribution of width , is accounted for through the convolution of the signal map with a range of from 0.1∘ to 1.0∘ in steps of 0.05∘. On an event-by-event basis, the map corresponding to the of the event is used as the signal PDF .
5 Results
5.1 All-Sky Point Source Search
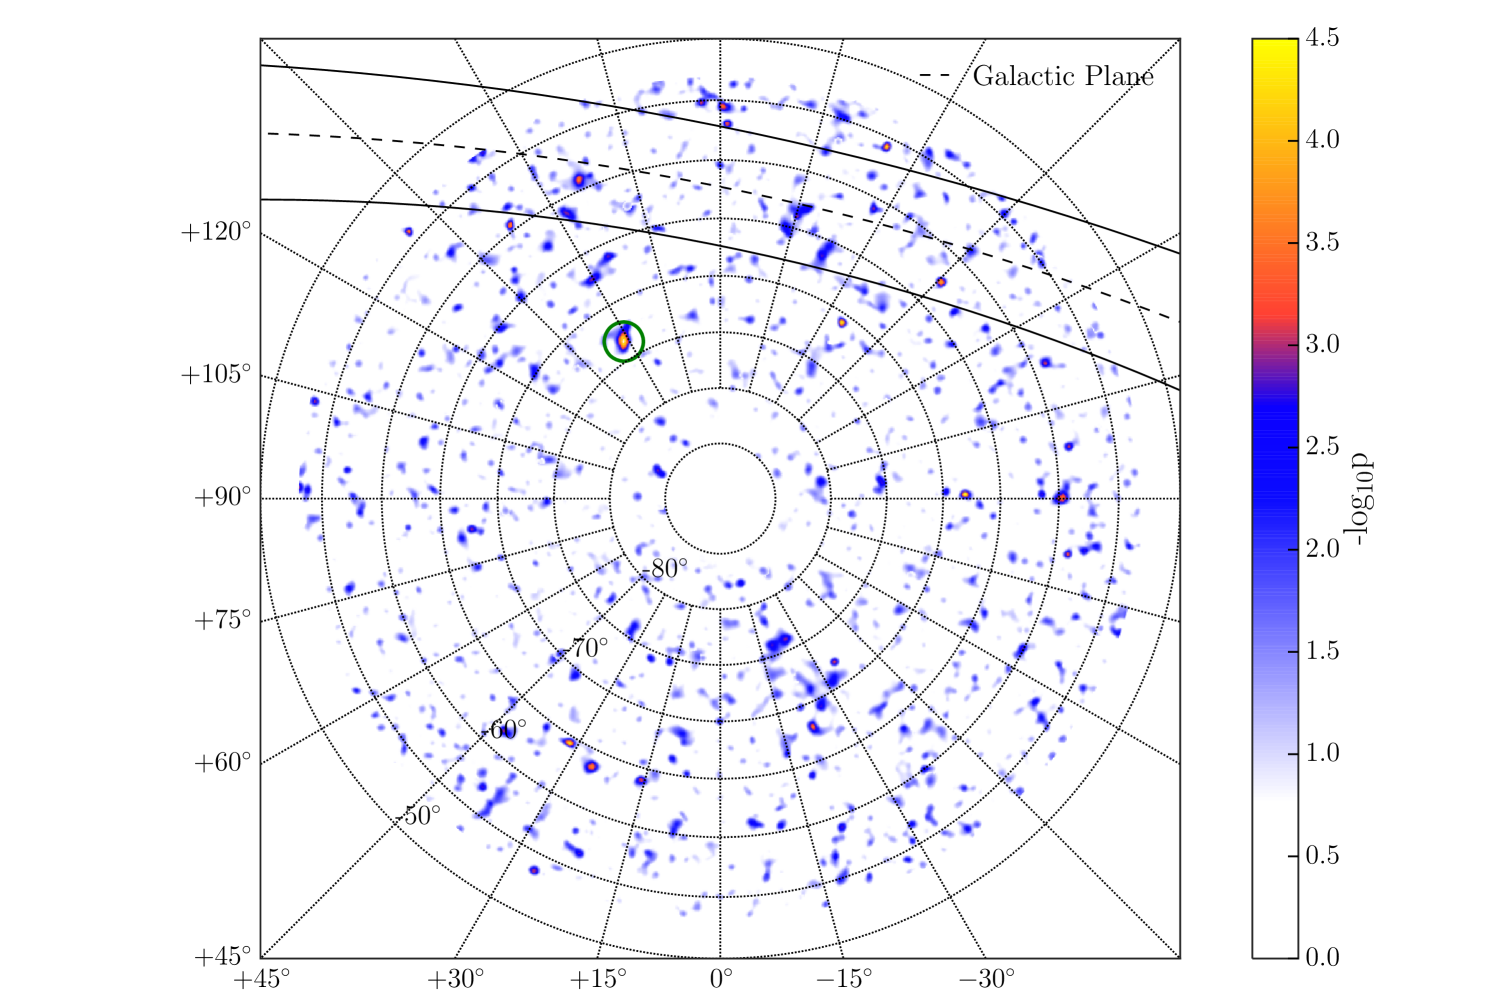
An unbiased search for a point source is accomplished by scanning over the entire field of view. The position of a single point source is assumed to lie in the direction of a given pixel in a HEALPIX map (Nside=512, pixel diameter of 0.11∘) (Gorski et al., 2005). A test statistic is calculated using Equation 6 under this hypothesis. This process is repeated for each pixel in the analysis field of view. The resulting p-values of this scan, before accounting for trials, are show in Figure 14. The region of the sky with zenith angle 5∘ is excluded, as within this region scrambling in right ascension alone is insufficient to build independent background trials.
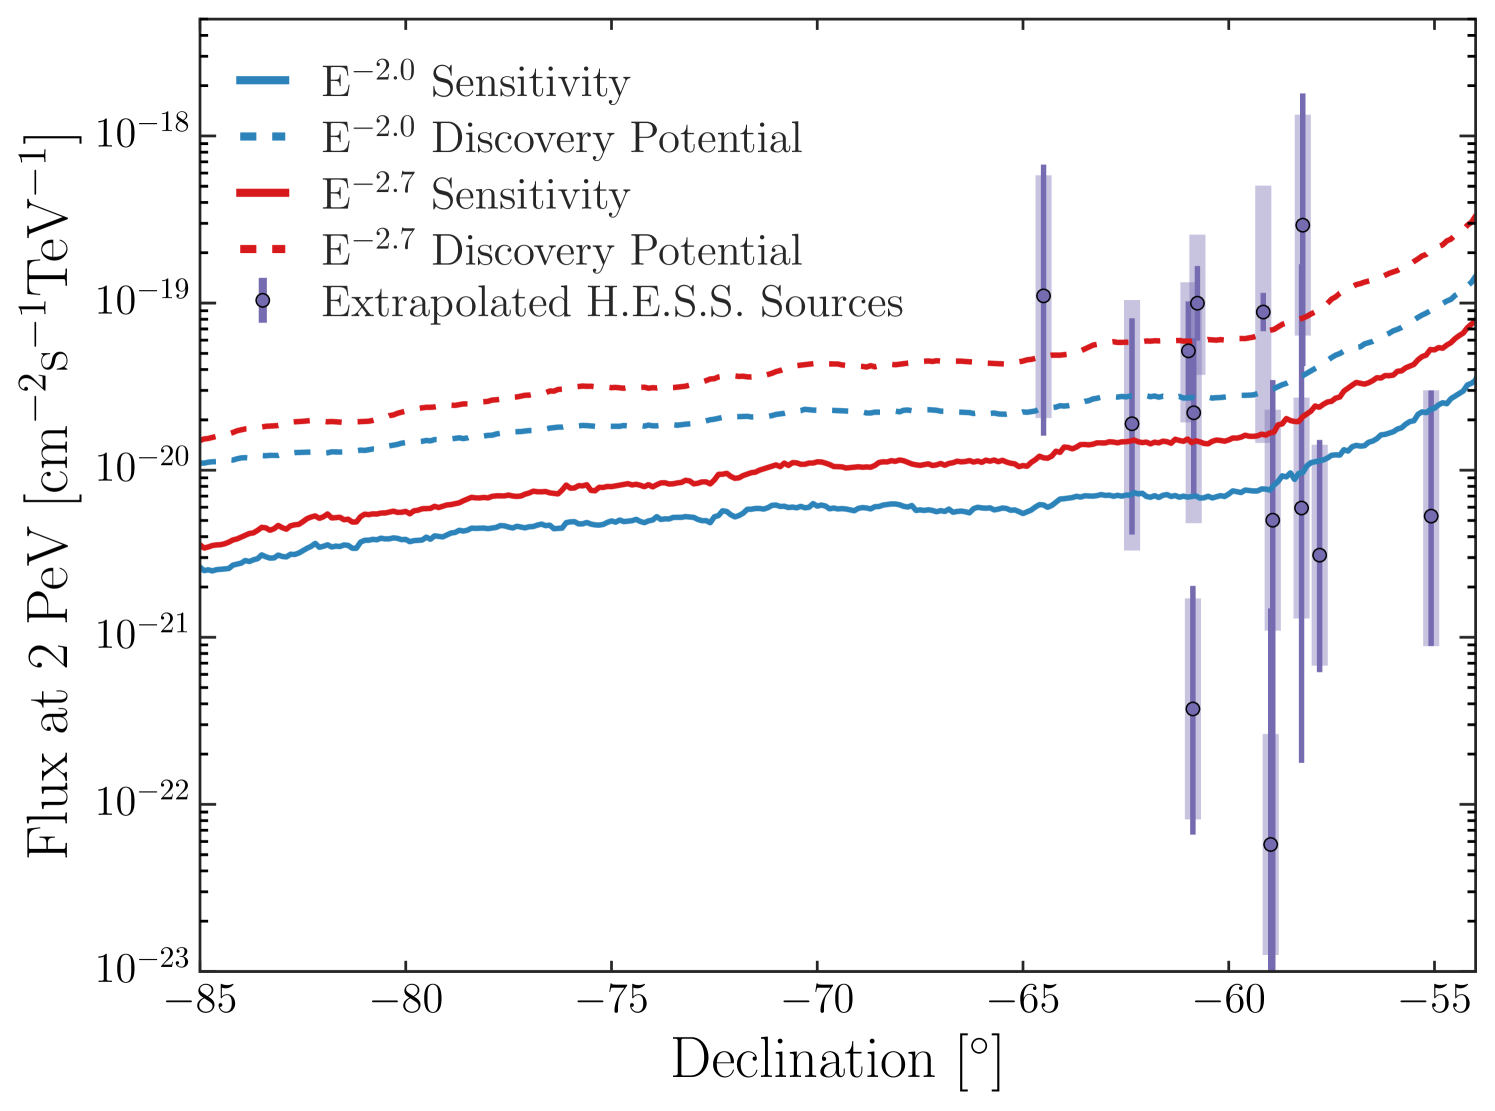
The hottest spot in the sky, with a pre-trial p-value of , is located at -73.4∘ in declination and 148.4∘ in right ascension, with = 67.9 and a spectral index of 2.9. The post-trial p-value, calculated by comparing the observed test statistic to the background ensemble of hottest-spot test statistic values, is 0.18, consistent with background expectation. Figure 10 shows the sensitivity and discovery potential to point sources of this analysis as a function of declination. The proportion of showers which are contained in IceCube drops sharply at higher shower inclinations, resulting in a decrease in performance at high declination values.
2
| Source | Type | Declination | Spectral Index | p-value | (2 PeV) | Distance | E U.L. |
|---|---|---|---|---|---|---|---|
| [∘] | [] | [kpc] | [PeV] | ||||
| HESS J1356-6451 | PWN | -64.50 | 2.20 | 0.50 | 2.41 | 0.9 | |
| HESS J1507-6222 | PWN | -62.35 | 2.24 | 0.29 | 8.5* | 16.6 | |
| HESS J1119-614 | Unidentified | -61.40 | N/A | 0.30 | N/A | 5.013 | N/A |
| HESS J1418-6094 | SNR | -60.98 | 2.22 | 0.31 | 5.04 | 3.5 | |
| HESS J1458-6085 | Unidentified | -60.87 | 2.80 | 0.22 | 8.5* | — | |
| HESS J1427-6086 | PWN | -60.85 | 2.20 | 0.07 | 8.5* | 25.9 | |
| HESS J1420-6074 | PWN | -60.76 | 2.17 | 0.49 | 5.614 | 1.4 | |
| HESS J1457-593 | SNR | -59.47 | N/A | 0.50 | N/A | 8.5* | N/A |
| HESS J1514-5918 | PWN | -59.16 | 2.27 | 0.52 | 5.215 | 1.5 | |
| HESS J1018-589 B9 | PWN | -58.98 | 2.90 | 0.08 | 8.5* | — | |
| HESS J1018-589 A9 | Unidentified | -58.93 | 2.20 | 0.07 | 8.5* | — | |
| HESS J1503-58210 | Unidentified | -58.23 | 2.40 | 0.17 | 8.5* | — | |
| HESS J1026-58211 | PWN | -58.20 | 1.94 | 0.09 | 2.316 | 1.4 | |
| HESS J1023-57511 | Unidentified | -57.79 | 2.58 | 0.08 | 8.017 | — | |
| HESS J1554-55012 | PWN | -55.08 | 2.10 | 0.50 | 9.018 | — |
Sources with no reported spectral index, in which case we do not report source specific limits.
*Sources without an x-ray or radio observation are given a value of 8.5 kpc, approximately the distance to the Galactic center.
Note. — First, the source type, declination, and best-fit spectral index by H.E.S.S. for each candidate source. Next, the pre-trial p-value observed by this analysis and 90% confidence level upper limits on the flux at 2 PeV at Earth assuming the H.E.S.S. best-fit spectral index and no cut-off in energy. Finally, the best known distance to each source and a 90% confidence level upper limit on the energy cut-off of the source assuming an extrapolation of the H.E.S.S. best-fit power law spectrum with an energy cut off and absorption from Vernetto & Lipari (2018). Sources where this analysis cannot limit the energy cut off are denoted by —.
References. — 1Abramowski et al. (2011b), 2Acero et al. (2011), 3Djannati-Ata¨ı et al. (2010), 4Aharonian et al. (2006), 5de los Reyes et al. (2012), 6Aharonian et al. (2008), 7Hofverberg et al. (2010), 8Aharonian et al. (2005), 9Abramowski et al. (2012), 10Renaud et al. (2008), 11Abramowski et al. (2011a), 12Acero (2011), 13Crawford et al. (2001), 14Kishishita et al. (2012), 15Gaensler et al. (1999), 16Keith et al. (2008), 17Rauw et al. (2011), 18Sun et al. (1999)
5.2 TeV Gamma-Ray Source Studies at PeV Energies
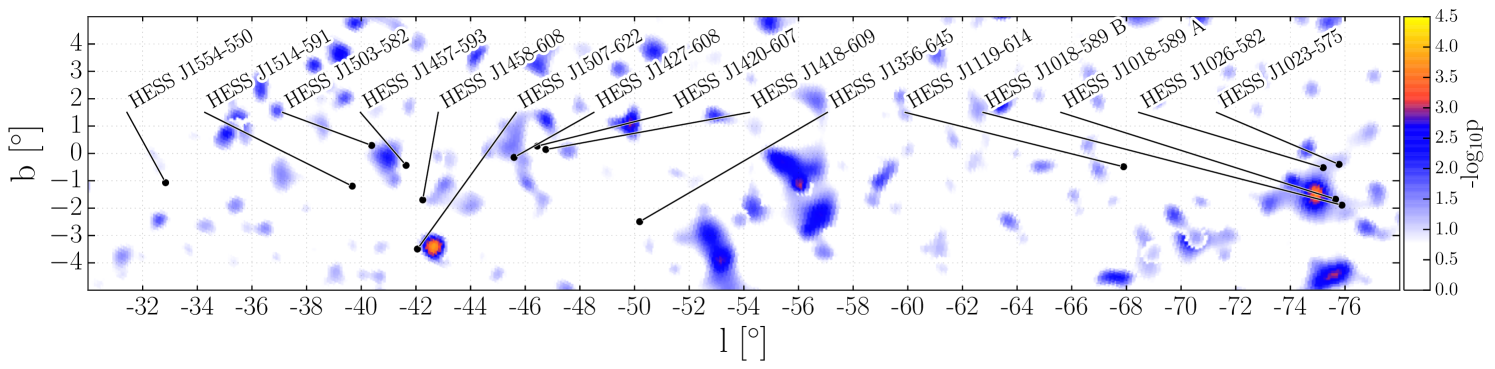
There are a total of 15 TeV gamma-ray sources in the field of view of this analysis which have no evidence of a cut-off in their energy spectrum; all of these sources were reported by the H.E.S.S. collaboration. Table 5.1 lists the name of each source paired with the citation which provided the H.E.S.S. fit information, along with the best-fit declination and spectral index observed by H.E.S.S.. The projected flux at 2 PeV of these sources assuming there is no cut-off in their energy spectra are shown in Figure 10. Attenuation effects were calculated for the galactic coordinates and distance of each source using model results provided by Lipari & Vernetto (2018). Source distances were estimated from associated x-ray or radio observations when possible (Wakely & Horan, 2008). Otherwise, a distance of 8.5 kpc, roughly that of the Galactic center, is assumed. The directions of the sources are shown overlaid on the all-sky scan in Figure 11.
In the first test of these sources, each source location is evaluated independently, making no assumption on the spectral index of the source. The pre-trial p-value for every considered source resulting from this test is reported in Table 5.1. The most significant individual source, HESS J1427-608, has a pre-trial p-value of 0.07, with a fitted of 25.9 and spectral index of 3.2. This results in a trials-corrected p-value of 0.65, consistent with background expectation.
To place constraints on the fluxes of these sources individually, we consider the case where the flux of each source extends with no cut off in energy and with the spectral index observed by H.E.S.S.. Under this flux assumption, we report the 90% confidence level upper limit on the flux at 2 PeV at Earth for each source in Table 5.1 as . We note that uncertainties in the best-fit H.E.S.S. spectrum have a negligible effect on the upper limits and their relationship to the extrapolated flux.
For a subset of the sources our limits are strong enough to place constraints on an energy cut-off of the source flux. Here we assume the flux to be the combination of a power law and an exponential energy cut-off at :
| (12) |
The value of was determined by evaluating, for a range of energy cut-off values, the resulting flux of the source and the analysis sensitivity for the same hypothesis. Here we do incorporate absorption from Lipari & Vernetto (2018) in order to limit the energy cut off at the source. The minimum energy cut-off values where our sensitivity lies below the flux expectation of the source is reported in Table 5.1 as a 90% confidence level upper limit on .
We additionally search for combined PeV emission from all the H.E.S.S. sources. In this test all the sources are stacked, using the modified signal PDF from Equation 10, which weights the sources assuming equal flux at Earth for each source. The result of this stacking correlation test is a p-value of 0.08, consistent with background.
5.3 IceCube HESE Neutrino Correlation
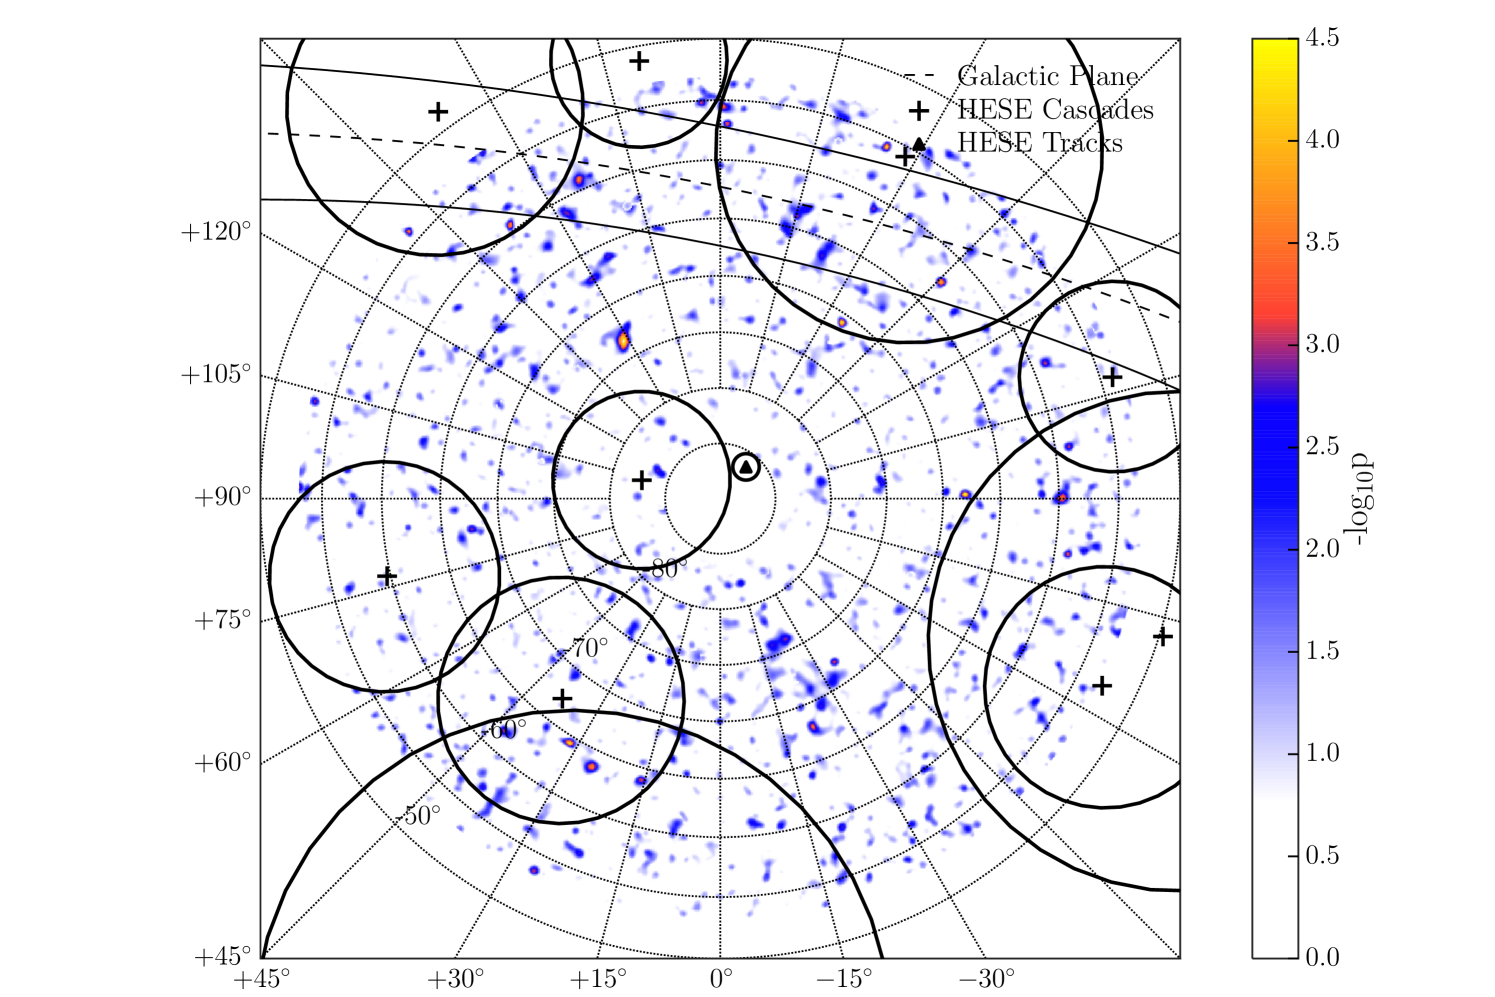
From the four year high-energy starting event (HESE) neutrino sample (Aartsen et al., 2015c) a total of eleven events lie within the field of view of this analysis. The event positions and 1 uncertainties are overlaid on top of the pre-trial p-value map of the all-sky point-source search in a polar projection in Figure 15. There are two topologically distinct event types, referred to as cascades and tracks. We treat the event types separately.
Cascade neutrino events are produced by neutral-current interactions as well as charged-current interactions of electron and tau neutrinos. These events have poor angular resolution, typically greater than 10∘ in the HESE sample. In order to correctly account for the change in detector acceptance over such a large point spread function, we test for a correlation with these cascade neutrino events using the template likelihood method described in Section 4.2. The signal template is constructed by combining the spatial likelihood contour PDFs for each event. The correlation test resulted in a conservative p-value of 0.5. We place a 90 confidence level upper limit of on the flux at 2 PeV of a source class consistent with the HESE cascade directions and an E-2.0 spectrum.
Track neutrino events are the product of charged current muon neutrino interactions. These interactions produce muons that can travel several kilometers through the ice, which allows for reconstructions with angular resolution 1.2∘ for events in the HESE sample. There is one track event in our field of view, which we treat under the point source prescription. At a declination of =-86.77∘, scrambling events in right ascension alone is insufficient to build a background test statistic distribution; instead, we scramble events randomly throughout the polar cap region of 5∘ zenith angle, within which acceptance was found to be approximately even. No evidence of signal was found in test for a point source at the event location, which resulted in a conservative p-value of 0.5.
5.4 Diffuse Galactic Plane Template Analysis
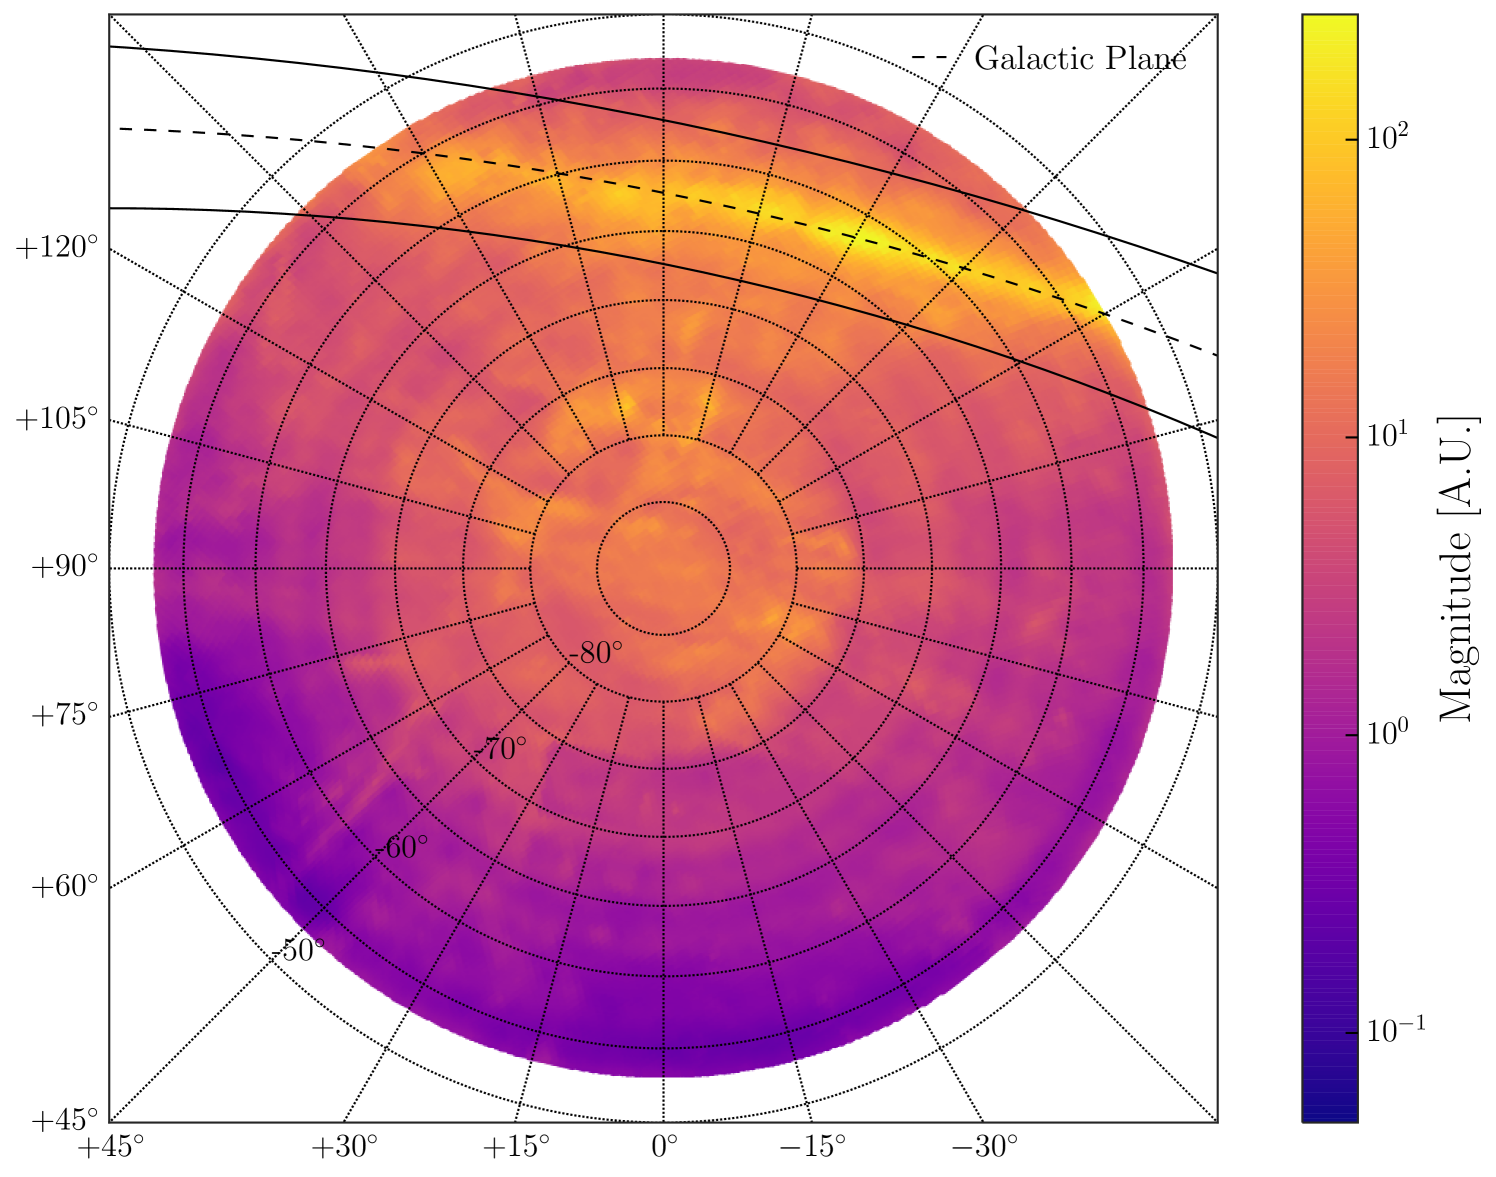
To test for a diffuse flux from the Galactic plane, the template likelihood method is employed with the signal template taken to be the pion decay component of the Fermi-LAT diffuse emission model (Ackermann et al., 2012a). The Fermi-LAT template multiplied by the detector acceptance is shown in Figure 16 for the 2012 sample.
The expected observed spectral index of diffuse gamma rays from the Galactic plane is still an open question due to existing uncertainties in the Galactic cosmic-ray spectrum, interstellar gas distribution, and flux attenuation. The unattenuated flux at PeV energies has been predicted to be as hard as E-3 (Vernetto & Lipari 2018, Ingelman & Thunman 1996), although the spectrum could be as soft as E-3.4 (Ingelman & Thunman, 1996) after attenuation. Here we fix the spectral index to 3.
Maximization of the likelihood in Equation 11 returns an observed test statistic corresponding to a p-value of 0.28, which provides no evidence of a diffuse signal from the Galactic plane under the current hypothesis. We place a 90 confidence level upper limit of on the normalization of the spectral energy distribution at 2 PeV with spectral index 3. The normalization energy was chosen to be 2 PeV as that is the energy for which the analysis was found to be least sensitive to the spectral index assumption.
As previous experimental limits have used a box region around the Galactic plane to describe the diffuse emission, for a limit comparison we use an angular-integrated scaled flux
| (13) |
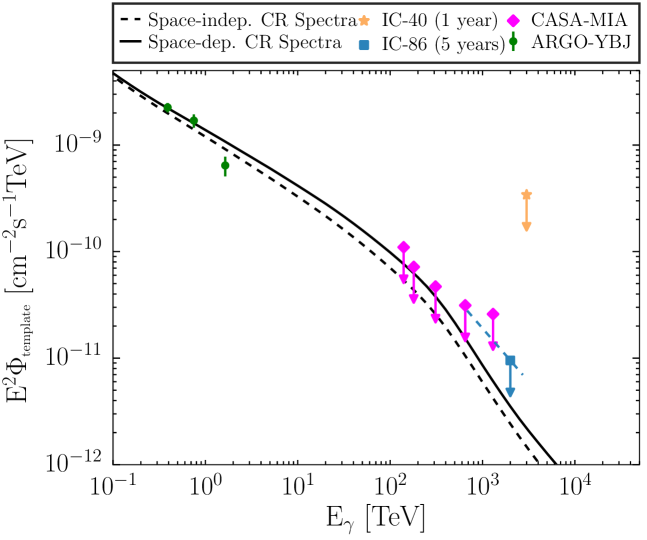
where the angular-integrated flux from the observed region is , and the second term scales this flux by the fraction of the Galactic plane emission present in the observed region as given by the Fermi-LAT pion decay template SFermi. This is, in effect, a limit on the overall normalization of the Fermi template flux. Figure 12 compares the scaled flux limits from this analysis with the existing IC-40 (Aartsen et al., 2013a) and CASA-MIA (Borione et al., 1998) limits, as well as the measured flux by ARGO-YBJ (Bartoli et al., 2015). In addition, the gamma-ray flux from the diffuse Galactic plane in the analysis field of view is shown for two model predictions from Lipari & Vernetto (2018). The first assumes that cosmic-ray spectra have a space independent spectral shape throughout the Galaxy. The second assumes the central part of the Galaxy has a harder cosmic-ray spectrum than observed at Earth, an idea supported by some recent analyses (Gaggero et al. 2015b, Yang et al. 2016).
5.5 Systematics
There are a number of systematic uncertainties that can affect the estimated sensitivity of the study, including the snow attenuation, the calibration of the charge deposited in IceTop tanks, the hadronic interaction model and the ice model used in simulations, and the anisotropy of the cosmic-ray flux. For each systematic component, datasets are constructed using the parameter uncertainty bounds. These datasets are propagated through the entire analysis chain to evaluate the corresponding uncertainty in sensitivity. Here we report both point source and Galactic plane analysis sensitivity uncertainties. For the point source sensitivity, we assume the median uncertainty based on a scan over the declination range in 0.1∘ bins. These datasets were constructed from events not used in the training of the random forest classifier detailed in Section 3.3.3.
The optimal value for the snow attenuation coefficient , used in the charge correction for IceTop tanks as shown in Equation 2, has been found to vary by 0.2 m over a range of zenith angle and energy values (Aartsen et al., 2013b). A more thorough model of the snow attenuation is work in-progress; for this work we quote this bound as a conservative estimate. This systematic results in an uncertainty of 11.0% in sensitivity to point sources and 11.2% in sensitivity to a diffuse flux from the Galactic plane.
The calibration of IceTop tank charge to VEM units requires a fitting of the muon peak in the charge spectrum of the tank (Abbasi et al., 2013). The dependence of this fit to systematic factors was studied in detail by Van Overloop (2011). They found an uncertainty of at most 3% on the charge calibration, which propagates directly to an uncertainty in the deposited signal. This systematic error results in an uncertainty of 2.1% in sensitivity to point sources and 7.4% in sensitivity to a diffuse flux from the Galactic plane.
The number of muons generated in simulated gamma-ray air showers at energies sufficient to trigger the detectors is governed by the high-energy hadronic interaction model used in CORSIKA. In order to evaluate the magnitude of the model dependence, we perform sensitivity studies with simulation generated using QGSJetII-04 (Ostapchenko, 2011), but otherwise identical to the original set. We chose QGSJetII-04 over other post-LHC models since it was the model that produced the most muons in hadronic air showers (Plum et al., 2018). Sensitivities calculated with these systematic datasets resulted in a 23.2% uncertainty for point sources and a 26.2% uncertainty for a diffuse flux from the Galactic plane.
The anisotropy of the cosmic-ray flux is a potential source of signal contamination. While declination-dependent anisotropy is accounted for due to the use of data to construct the background PDF in the likelihood, any anisotropy in right ascension is not. However, within the analysis field of view this anisotropy is at a level of at most 0.03% (Aartsen et al., 2016). This is negligible in relation to statistical uncertainties, which is 25% in flux at the sensitivity threshold.
In simulation, the uncertainties in the optical properties of the ice can affect the amount of charge measured. While this a potential for systematic error, an analysis with datasets using 10% in deposited charge in IceCube showed negligible impact on sensitivity compared to statistical fluctuations. Finally, the method we use naturally corrects for any bias in the energy proxy. Any systematic biases in fitted ns and values unaccounted for are found to be negligible when compared to statistical uncertainties.
Under the assumption that the errors discussed are independent and Gaussian distributed, the overall sensitivity uncertainty resulting from quadrature addition is 25.8% for point sources and 29.4% for the Galactic plane.
6 Discussion and Conclusion
We have presented the results of multiple searches for PeV gamma rays using five years of data from 2011 to 2016 collected by the IceCube Observatory. For all flux hypotheses considered, no significant excess in emission above background expectation was observed.
An unbiased scan over the entire analysis field of view resulted in a declination-dependent 90% confidence level upper limit of 10-21 - 10-20 on the flux at 2 PeV of a gamma-ray point source, the most stringent PeV gamma-ray point source limits to date and an improvement of more than an order of magnitude over the previous IceCube analysis (Aartsen et al., 2013a).
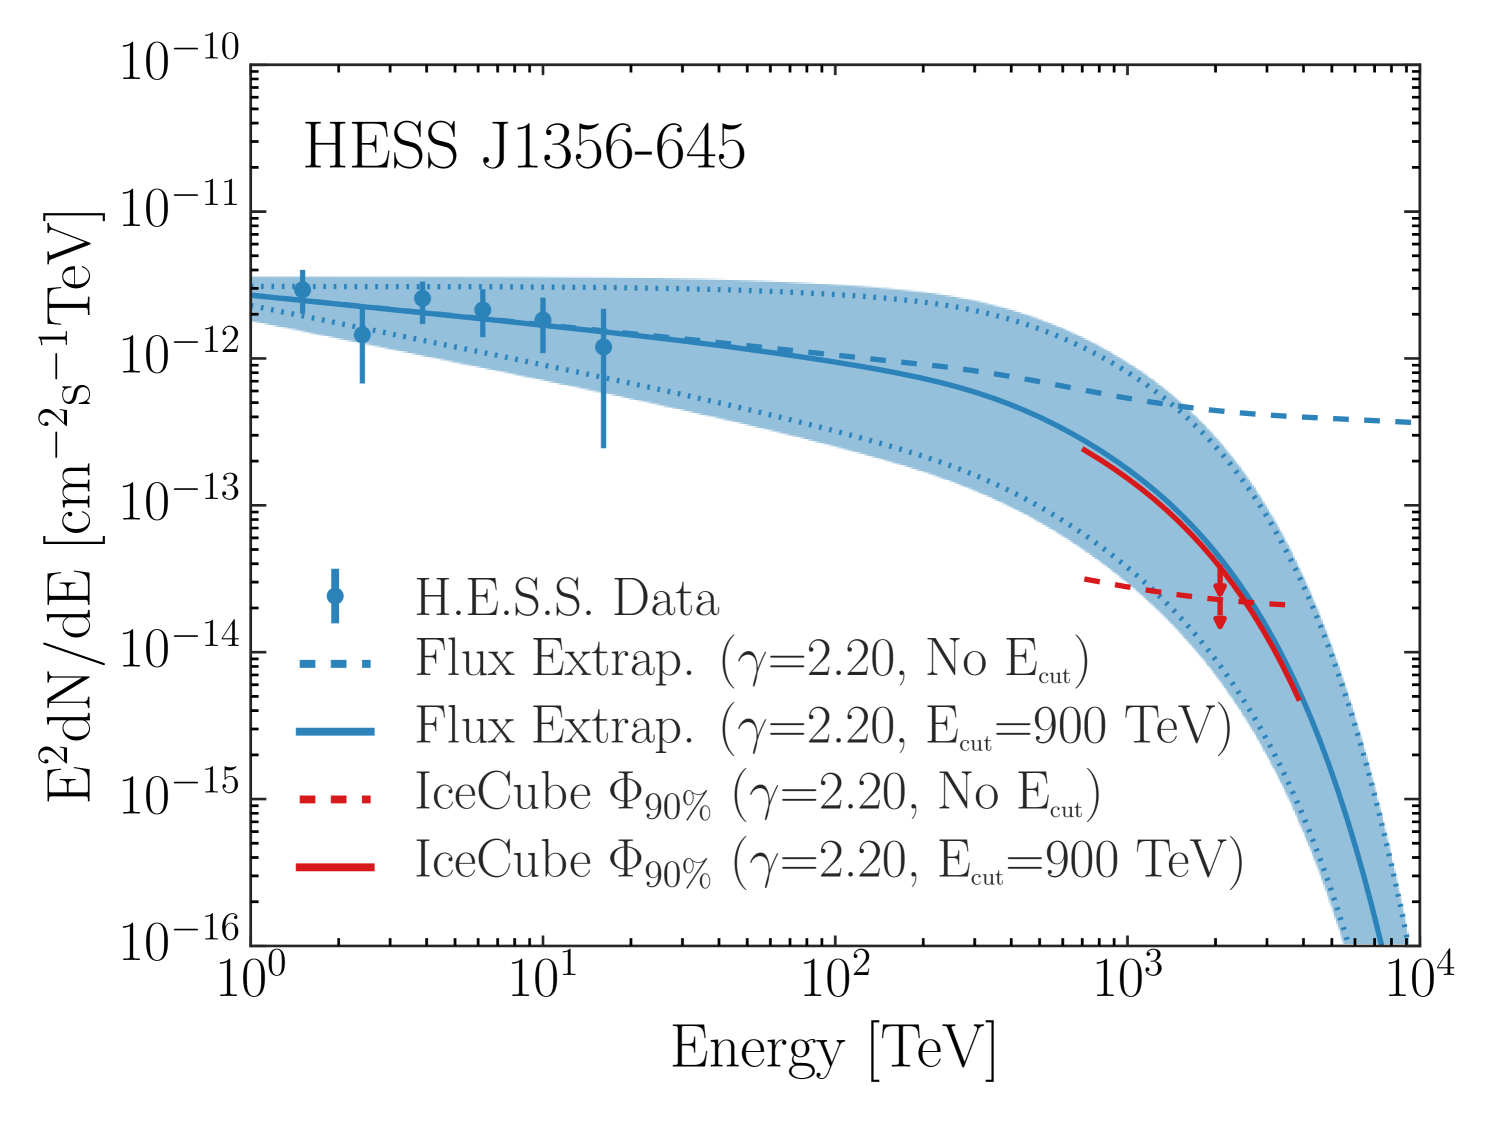
In addition, we searched for PeV gamma-ray emission of H.E.S.S. sources that show no evidence for a spectral cut off at TeV energies. For the first time, upper limits have been placed on the high-energy emission of these sources. For seven sources, these limits exclude the spectra observed by H.E.S.S. from extending without a cut off to PeV energies after accounting for absorption. The lowest energy cut-off limit value is 900 TeV for the source HESS J1356-645. Figure 13 illustrates the extrapolated flux for this source with a 900 TeV cut off in energy along with the corresponding 90% upper limits set by this analysis to the same flux assumptions. Considering the systematic/statistical uncertainties in the H.E.S.S. measurements, in the measurement of the source distance, and those presented in Section 5.5, we do not expect sensitivity to spectral assumptions that slightly differ from our own. We present these constraints as order of magnitude estimates for other spectral assumptions which may have, for example, additional spectral softening or a cut off other than a simple exponential.
Since this analysis was executed, a new Galactic plane survey paper was published by the H.E.S.S. collaboration that included a reanalysis of the sources included in this study (Abdalla et al., 2018). For all cases, the new analysis positions, spectral indices, and flux normalizations at 1 TeV are consistent with the values used for calculating the presented upper limits within statistical and systematic errors. The largest discrepancy in fit values is for the source HESS J1427-608, which had a best-fit spectral index of 2.20 in Aharonian et al. (2008). Guo et al. (2017) reported on a counterpart seen in Fermi-LAT data at GeV energies with a best fit including the H.E.S.S. data from Aharonian et al. (2008) of over four orders of magnitude in energy with no break in the spectrum, a property unique among currently known TeV sources. However, in Abdalla et al. (2018) the reanalysis best-fit spectral index was found to be 2.85.
The point-source map in the Galactic plane region shown in Figure 11 has several interesting spots with low p-values. The first is spatially coincident with the binary source HESS J1302-638 at = -0.99∘ and = -55.81∘ (Aharonian et al., 2005). This source was excluded from the targeted search as TeV emission has only been observed during the periastron of the source, which occurs only once every 3.4 years due to a highly eccentric orbit (Romoli et al., 2017). One such periastron occurred during the collection period of data used in this analysis in 2014. However, a follow-up analysis with only the data from the 2014 period showed no evidence for PeV gamma-ray emission from this direction. The second spot, near HESS J1507-622, is interesting as both the source and the spot lie on the edge of a large, nearby CO molecular cloud observed by Dame et al. (2001) which is most likely 400 pc away. The type of the source has not been established, and it has a uniquely high Galactic latitude (3.5∘) (Acero et al., 2011). This allows for the possibility of the source being nearby. However, the offset from the spot to the source location and the most dense region of the molecular cloud makes any association unlikely.
The correlation test between PeV gamma-ray candidate events and the neutrino events, from the IceCube HESE sample which lie within the field of view of this analysis, also yields a null result.
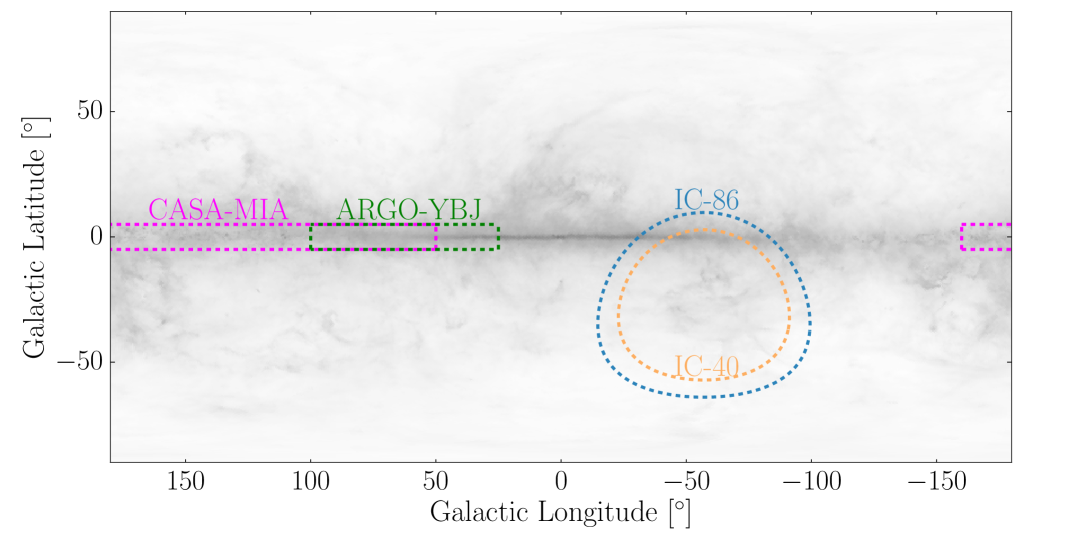
We place a 90 confidence level upper limit of on the angular-integrated diffuse gamma-ray flux from the Galactic plane at 2 PeV under the assumption of an E-3 spectrum. Figure 12 (left) compares the field of views of the different experiments. Here it is worth noting that the current analysis (IC-86) constrains PeV diffuse flux from a denser region of the Galactic plane than CASA-MIA (Borione et al., 1998). As shown in Figure 12 (right), the IC-86 upper limit is an order of magnitude better than the IC-40 result, and the most stringent constraint on the diffuse flux above 1 PeV. The IC-86 upper limit is also compared to two model predictions for attenuated diffuse flux from the Galactic plane in the IceCube field of view as given by Lipari & Vernetto (2018). Both models derive diffuse gamma-ray emission under appropriate assumptions for the cosmic-ray flux throughout the Milky Way, inter-stellar gas distribution, and gamma-ray absorption effects. The model labeled as ‘space-dependent CR Spectra’ includes a changing spectral index of the gamma-ray spectrum as a function of the distance to the Galactic center to reproduce the effects of a harder cosmic-ray spectrum near the Galactic center. The two model predictions are not too different for the IC-86 field of view since it observes a part of the Galactic plane sufficiently far from the Galactic center. Even though the IC-86 upper limit cannot constrain the partially-empirical model predictions by Lipari & Vernetto (2018), it may serve as important data for other detailed simulations of Galactic cosmic-ray transport such as Gaggero et al. (2015b).
IceCube’s sensitivity to the gamma-ray flux is expected to improve at a rate lower than the inverse square root of the livetime expected from additional exposure. This is due to the reduced acceptance to gamma-ray air showers with continued snow accumulation on IceTop tanks. A proposed scintillator array (Huber et al., 2018) at the surface will improve the sensitivity to the electromagnetic shower component and counteract the degradation of the photon-sensitivity due to snow accumulation. Furthermore, radio antennas at the surface may improve the gamma-hadron separation and increase the sky coverage such that the Galactic Center comes into the field of view (Balagopal V. et al., 2018). In the long term, a 7.9 km3 next generation IceCube detector (van Santen J. et al., 2018) is being designed along with a 75 km2 surface scintillator array. Adding radio antennas and non-imaging air cherenkov telescopes to the surface array would provide sensitivity to PeV gamma-rays over a much larger field of view than the current detector. Recent hints of a PeVatron (Abramowski et al., 2016) near the Galactic center and the expected increase in the diffuse flux towards the Galactic center are strong motivators to search for PeV gamma rays in the future with higher sensitivity instruments. A future gamma-ray analysis with the IceCube observatory would be complementary to the planned experiments LHAASO (Cui et al., 2014) and HiSCORE (Tluczykont et al., 2014) in the Northern Hemisphere. Such an analysis would be aided in a search for galactic point sources by results from the proposed southern CTA site, which will provide even higher energy measurements than H.E.S.S. of possible PeVatrons in the Southern Hemisphere (Acharya et al., 2013).
References
- Aartsen et al. (2013a) Aartsen, M. G., Abbasi, R., Abdou, Y., et al. 2013a, PhRvD, 87, 062002, doi: 10.1103/PhysRevD.87.062002
- Aartsen et al. (2013b) —. 2013b, PhRvD, 88, 042004, doi: 10.1103/PhysRevD.88.042004
- Aartsen et al. (2015a) Aartsen, M. G., Abraham, K., Ackermann, M., et al. 2015a, EPJC, 75, 492, doi: 10.1140/epjc/s10052-015-3713-1
- Aartsen et al. (2016) —. 2016, ApJ, 826, 220, doi: 10.3847/0004-637X/826/2/220
- Aartsen et al. (2017a) —. 2017a, ApJ, 835, 45, doi: 10.3847/1538-4357/835/1/45
- Aartsen et al. (2013c) Aartsen, M. G., Ackermann, M., Adams, J., et al. 2013c, Science, 342, 1242856, doi: 10.1126/science.1242856
- Aartsen et al. (2014) —. 2014, PhRvL, 113, 101101, doi: 10.1103/PhysRevLett.113.101101
- Aartsen et al. (2015b) —. 2015b, ApJ, 809, 98, doi: 10.1088/0004-637X/809/1/98
- Aartsen et al. (2015c) —. 2015c, Proceedings of Science, ICRC 2015. https://arxiv.org/abs/1510.05223
- Aartsen et al. (2017b) —. 2017b, JINST, 12, 03012, doi: 10.1088/1748-0221/12/03/P03012
- Aartsen et al. (2017c) —. 2017c, ApJ, 839, 67, doi: 10.3847/1538-4357/aa8dfb
- Aartsen et al. (2018) —. 2018, Science, 361, 147, doi: 10.1126/science.aat2890
- Abbasi et al. (2013) Abbasi, R., Abdou, Y., Ackermann, M., et al. 2013, NIMPA, 700, 188, doi: 10.1016/j.nima.2012.10.067
- Abbasi et al. (2009) Abbasi, R., Ackermann, M., Adams, J., et al. 2009, NIMPA, 601, 294, doi: 10.1016/j.nima.2009.01.001
- Abdalla et al. (2018) Abdalla, H., Abramowski, A., Aharonian, F., et al. 2018, A&A, 612, A1, doi: 10.1051/0004-6361/201732098
- Abdo et al. (2008) Abdo, A. A., Allen, B., Aune, T., et al. 2008, ApJ, 688, 1078, doi: 10.1086/592213
- Abeysekara et al. (2017) Abeysekara, A. U., Albert, A., Alfaro, R., et al. 2017, ApJ, 843, 40, doi: 10.3847/1538-4357/aa7556
- Abramowski et al. (2011a) Abramowski, A., Acero, F., Aharonian, F., , et al. 2011a, A&A, 525, A46, doi: 10.1051/0004-6361/201015290
- Abramowski et al. (2011b) Abramowski, A., Acero, F., Aharonian, F., et al. 2011b, A&A, 533, A103, doi: 10.1051/0004-6361/201117445
- Abramowski et al. (2012) —. 2012, A&A, 541, A5, doi: 10.1051/0004-6361/201218843
- Abramowski et al. (2016) Abramowski, A., Aharonian, F., Benkhali, F. A., et al. 2016, Nature, 531, 476, doi: 10.1038/nature17147
- Acero (2011) Acero, F. 2011, International Cosmic Ray Conference, 7, 185, doi: 10.7529/ICRC2011/V07/0928
- Acero et al. (2016) Acero, F., Ackermann, M., Ajello, M., et al. 2016, ApJS, 223, 26, doi: 10.3847/0067-0049/223/2/26
- Acero et al. (2011) Acero, F., Aharonian, F., Akhperjanian, A. G., et al. 2011, A&A, 525, A45, doi: 10.1051/0004-6361/201015187
- Acharya et al. (2013) Acharya, B., Actis, M., Aghajani, T., et al. 2013, Astroparticle Physics, 43, 3 , doi: 10.1016/j.astropartphys.2013.01.007
- Ackermann et al. (2012a) Ackermann, M., Ajello, M., Atwood, W. B., et al. 2012a, ApJ, 750, 3, doi: 10.1088/0004-637X/750/1/3
- Ackermann et al. (2012b) Ackermann, M., et al. 2012b, Astrophys. J., 750, 3, doi: 10.1088/0004-637X/750/1/3
- Aharonian et al. (2005) Aharonian, F., Akhperjanian, A. G., Aye, K.-M., et al. 2005, A&A, 435, L17, doi: 10.1051/0004-6361:200500105
- Aharonian et al. (2005) Aharonian, F., Akhperjanian, A. G., Aye, K.-M., et al. 2005, A&A, 442, 1, doi: 10.1051/0004-6361:20052983
- Aharonian et al. (2006) Aharonian, F., Akhperjanian, A. G., Bazer-Bachi, A. R., et al. 2006, ApJ, 636, 777, doi: 10.1086/498013
- Aharonian et al. (2006) Aharonian, F., Akhperjanian, A. G., Bazer-Bachi, A. R., et al. 2006, A&A, 456, 245, doi: 10.1051/0004-6361:20065511
- Aharonian et al. (2008) Aharonian, F., Akhperjanian, A. G., de Almeida, U. B., et al. 2008, A&A, 477, 353, doi: 10.1051/0004-6361:20078516
- Ahlers et al. (2016) Ahlers, M., Bai, Y., Barger, V., & Lu, R. 2016, Phys. Rev., D93, 013009, doi: 10.1103/PhysRevD.93.013009
- Ahlers & Murase (2014) Ahlers, M., & Murase, K. 2014, Phys. Rev., D90, 023010, doi: 10.1103/PhysRevD.90.023010
- Ahn et al. (2009) Ahn, E.-J., Engel, R., Gaisser, T. K., et al. 2009, PhRvD, 80, 094003, doi: 10.1103/PhysRevD.80.094003
- Albert et al. (2018) Albert, A., André, M., Anghinolfi, M., et al. 2018. https://arxiv.org/abs/1808.03531
- Apel et al. (2017) Apel, W. D., et al. 2017, Astrophys. J., 848, 1, doi: 10.3847/1538-4357/aa8bb7
- Balagopal V. et al. (2018) Balagopal V., A., Haungs, A., Huege, T., & Schröder, F. G. 2018, Eur. Phys. J., C78, 111, doi: 10.1140/epjc/s10052-018-5537-2
- Bartoli et al. (2015) Bartoli, B., Bernardini, P., Bi, X. J., et al. 2015, ApJ, 806, 20, doi: 10.1088/0004-637X/806/1/20
- Battistoni et al. (2007) Battistoni, G., Cerutti, F., Fassò, A., et al. 2007, AIP Conference Proceedings, 896, 31, doi: 10.1063/1.2720455
- Benbow et al. (2017) Benbow, W., et al. 2017, AIP Conference Proceedings, 1792, 050001, doi: 10.1063/1.4968947
- Borione et al. (1998) Borione, A., Catanese, M. A., Chantell, M. C., et al. 1998, ApJ, 493, 175, doi: 10.1086/305096
- Braun et al. (2008) Braun, J., Dumm, J., Palma, F. D., et al. 2008, APh, 29, 299, doi: 10.1016/j.astropartphys.2008.02.007
- Carrigan et al. (2013) Carrigan, S., Brun, F., Chaves, R. C. G., et al. 2013, Proceedings of Science, ICRC 2013, 0741. https://arxiv.org/abs/1307.4690
- Crawford et al. (2001) Crawford, F., Gaensler, B. M., Kaspi, V. M., et al. 2001, ApJ, 554, 152, doi: 10.1086/321328
- Cui et al. (2014) Cui, S., Liu, Y., Liu, Y., & Ma, X. 2014, Astroparticle Physics, 54, 86 , doi: 10.1016/j.astropartphys.2013.11.003
- Dame et al. (2001) Dame, T. M., Hartmann, D., & Thaddeus, P. 2001, ApJ, 547, 792, doi: 10.1086/318388
- de los Reyes et al. (2012) de los Reyes, R., Zajczyk, A., Chaves, R. C. G., et al. 2012, ArXiv e-prints. https://arxiv.org/abs/1205.0719
- Djannati-Ata¨ı et al. (2010) Djannati-Ataï, A., Marandon, V., Terrier, R., Chaves, R., et al. 2010, in 38th COSPAR Scientific Assembly, Vol. 38, 2811
- Drees et al. (1989) Drees, M., Halzen, F., & Hikasa, K. 1989, PhRvD, 39, 1310, doi: 10.1103/PhysRevD.39.1310
- Gaensler et al. (1999) Gaensler, B., Brazier, K., Manchester, R., Johnston, S., & Green, A. 1999, Monthly Notices of the Royal Astronomical Society, 305, 724, doi: 10.1046/j.1365-8711.1999.02500.x
- Gaggero et al. (2015a) Gaggero, D., Grasso, D., Marinelli, A., et al. 2015a, ApJL, 815, L25, doi: 10.1088/2041-8205/815/2/L25
- Gaggero et al. (2015b) Gaggero, D., Urbano, A., Valli, M., & Ullio, P. 2015b, PhRvD, 91, 083012, doi: 10.1103/PhysRevD.91.083012
- Gaisser (2006) Gaisser, T. K. 2006, Journal of Physics: Conference Series, 47, 15, doi: 10.1088/1742-6596/47/1/002
- Gorski et al. (2005) Gorski, K. M., Hivon, E., Banday, A. J., et al. 2005, ApJ, 622, 759, doi: 10.1086/427976
- Guo et al. (2017) Guo, X.-L., Xin, Y.-L., Liao, N.-H., et al. 2017, ApJ, 835, 42, doi: 10.3847/1538-4357/835/1/42
- Halzen et al. (2009) Halzen, F., Kappes, A., & Murchadha, A. O. 2009, PhRvD, 80, 083009, doi: 10.1103/PhysRevD.80.083009
- Heck et al. (1998) Heck, D., Knapp, J., Capdevielle, J. N., et al. 1998, Report No. FZKA 6019
- Hofverberg et al. (2010) Hofverberg, P., Chaves, R. C. G., Fiasson, A., et al. 2010, in 25th Texas Symposium on Relativistic Astrophysics, 196. https://arxiv.org/abs/1104.5119
- Huber et al. (2018) Huber, T., Kelley, J., Kunwar, S., D.Tosi, et al. 2018, PoS, ICRC2017, 401, doi: 10.22323/1.301.0401
- Hunter et al. (1997) Hunter, S. D., et al. 1997, Astrophys. J., 481, 205, doi: 10.1086/304012
- Ingelman & Thunman (1996) Ingelman, G., & Thunman, M. 1996. https://arxiv.org/abs/hep-ph/9604286
- Joshi et al. (2014) Joshi, J. C., Winter, W., & Gupta, N. 2014, Mon. Not. Roy. Astron. Soc., 439, 3414, doi: 10.1093/mnras/stu189, 10.1093/mnras/stu2132
- Kachelriess & Ostapchenko (2014) Kachelriess, M., & Ostapchenko, S. 2014, Phys. Rev., D90, 083002, doi: 10.1103/PhysRevD.90.083002
- Kalberla & Kerp (2009) Kalberla, P. M., & Kerp, J. 2009, ARA&A, 47, 27, doi: 10.1146/annurev-astro-082708-101823
- Keith et al. (2008) Keith, M., Johnston, S., Kramer, M., et al. 2008, Monthly Notices of the Royal Astronomical Society, 389, 1881, doi: 10.1111/j.1365-2966.2008.13711.x
- Kishishita et al. (2012) Kishishita, T., Bamba, A., Uchiyama, Y., Tanaka, Y., & Takahashi, T. 2012, The Astrophysical Journal, 750, 162, doi: 10.1088/0004-637X/750/2/162
- Lipari & Vernetto (2018) Lipari, P., & Vernetto, S. 2018, Phys. Rev., D98, 043003, doi: 10.1103/PhysRevD.98.043003
- Neyman (1941) Neyman, J. 1941, Biometrika, 32, 128, doi: 10.2307/2332207
- Ostapchenko (2011) Ostapchenko, S. 2011, PhRvD, 83, 014018, doi: 10.1103/PhysRevD.83.014018
- Pedregosa et al. (2011) Pedregosa, F., Varoquaux, G., Gramfort, A., et al. 2011, JMLR, 12, 2825
- Plum et al. (2018) Plum, M., Aartsen, M. G., Ackermann, M., et al. 2018, Cosmic Ray Spectrum and Mass Composition from IceTop and IceCube, TeVPA 2018. https://indico.desy.de/indico/event/18204/session/15/contribution/215
- Protheroe & Biermann (1996) Protheroe, R. J., & Biermann, P. L. 1996, ApJ, 6, 45, doi: 10.1016/S0927-6505(96)00041-2
- Rauw et al. (2011) Rauw, G., Sana, H., & Nazé, Y. 2011, Astronomy & Astrophysics, 535, A40, doi: 10.1051/0004-6361/201117000
- Rawlins & Feusels (2016) Rawlins, K., & Feusels, T. 2016, PoS, ICRC2015, 334, doi: 10.22323/1.236.0334
- Renaud et al. (2008) Renaud, M., Goret, P., Chaves, R. C. G., et al. 2008, in American Institute of Physics Conference Series, Vol. 1085, American Institute of Physics Conference Series, ed. F. A. Aharonian, W. Hofmann, & F. Rieger, 281–284, doi: 10.1063/1.3076660
- Risse & Homola (2007) Risse, M., & Homola, P. 2007, MPLA, 22, 749, doi: 10.1142/S0217732307022864
- Romoli et al. (2017) Romoli, C., Bordas, P., Mariaud, C., et al. 2017, Proceedings of Science, ICRC 2017, 675, doi: 10.22323/1.301.0675
- Sun et al. (1999) Sun, M., ru Wang, Z., & Chen, Y. 1999, The Astrophysical Journal, 511, 274, doi: 10.1086/306656
- Tluczykont et al. (2014) Tluczykont, M., Hampf, D., Horns, D., et al. 2014, Astroparticle Physics, 56, 42 , doi: 10.1016/j.astropartphys.2014.03.004
- Van Overloop (2011) Van Overloop, A. 2011, Proceedings of Science, ICRC 2011, 97, doi: 10.7529/ICRC2011/V01/0899
- van Santen J. et al. (2018) van Santen J., et al. 2018, PoS, ICRC2017, 991, doi: 10.22323/1.301.0991
- Vernetto & Lipari (2018) Vernetto, S., & Lipari, P. 2018, PoS, ICRC2017, 718, doi: 10.22323/1.301.0718
- Wakely & Horan (2008) Wakely, S. P., & Horan, D. 2008, Proceedings of Science, ICRC 2008, 3, 1341
- Yang et al. (2016) Yang, R., Aharonian, F., & Evoli, C. 2016, Phys. Rev., D93, 123007, doi: 10.1103/PhysRevD.93.123007