Shape and angular distribution of the 4.438-MeV line from proton inelastic scattering off 12C
Abstract
The emission of the 4.438-MeV -ray line in proton inelastic scattering off 12C has been investigated in detail. For this, two independent descriptions of the correlated scattering and emission process have been used, one for the direct reaction mechanism and the other for the compound-nucleus (CN) component. Direct reactions were calculated in the framework of the coupled-channels formalism, while the CN component was described as a superposition of separate resonances with definite spin and parity, treated with the angular momentum coupling theory. Both components were incoherently added and compared to a comprehensive data set on measured line shapes and -ray angular distributions in the proton energy range = 5.44 - 25.0 MeV. In the range 14 - 25 MeV, good agreement with data was obtained with a dominating direct reaction component. At lower energy, an important CN component was required to describe line shape and angular distribution data. In general, a good decription of the data could be found for a CN component with spin and parity corresponding to a known nearby resonance. The new calculation was found to improve significantly the agreement with line shape data in particular in the region of dominating CN resonances compared to previous calculations. Based on these results, predictions for line shapes and -ray angular distributions up to = 100 MeV were made and applied to -ray emissions in solar flares and proton radiotherapy.
pacs:
23.20En, 24.10Eq, 24.30Gd, 25.40EpI Introduction
The 4.438-MeV line of 12C is probably the most interesting target for line shape studies of proton-induced reactions for several reasons. The combination of such a relatively high -ray energy with the low mass of the 12C nucleus, leads to significant line broadening and energy shift even in proton reactions. Moreover, the lifetime of the emitting 2+, 4.439-MeV level of 12C is short enough (t1/2 = 61 fs) for dominant in-flight emission of the ray in practically all materials. The emitting level at 4.439 MeV is furthermore the only excited level below the particle emission threshold in 12C. It results in negligible feeding by higher-lying levels and simplifies considerably the line shape calculations.
It is an important component in astrophysical sites with accelerated particle populations, where it is one of the strongest prompt nuclear deexcitation lines. It is for example regularly observed in strong solar flares Chupp et al. (1973); Murphy et al. (1997); Verstrand et al. (1999); Smith et al. (2003); Gros et al. (2004); Ackermann et al. (2014) and emission of this line from the inner Galaxy due to interactions of low-energy cosmic rays, is one of the primary science objectives of next-generation -ray observatories Benhabiles-Mezhoud et al. (2013); Tatischeff et al. (2016). Its main production in these sites comes from inelastic scattering of protons and particles off 12C and the 16O(p,p)12C and 16O(,2)12C reactions and reactions of accelerated 12C and 16O with ambiant H and He.
The interest of line shape analysis to deduce accelerated-particle properties has early been pointed out Ramaty and Crannell (1976). First detailed studies were applied to -ray spectra obtained with space-borne moderate-resolution scintillation detectors Share et al. (2002), and more recently with high-resolution HP-Ge detectors onboard the Rhessi and INTEGRAL satellites Smith et al. (2003); Kiener et al. (2006); Harris et al. (2007). In the latter in particular, detailed line shape analysis could be used to pin down composition and directional distribution of the accelerated-particle populations. Furthermore, there is significant interest in the monitoring of the dose deposition in radiotherapy with particle beams Durante and Paganetti (2016). A good example is provided by devices that detect the prompt rays resulting from proton interactions in human tissue, rising the demand of detailed and reliable nuclear cross sections Verburg et al. (2012, 2014); Jeyasugiththan and Peterson (2015). In this context, carbon and oxygen make up more than 3/4 of the human body mass, making the 4.438-MeV line the strongest prompt emission line produced.
A first global, astrophysically motivated approach for the calculation of the 4.438-MeV -ray line profile was presented by Ramaty, Kozlovsky and Lingenfelter Ramaty et al. (1979). It is based on measured differential proton scattering cross sections and a parameterization for the magnetic-substate population of the excited 12C, reproducing a few measured line shapes and -ray angular distributions, that were available at that time. This approach was further developed with new experiment data, but encountered problems to reproduce simultaneously line shapes and the -ray angular distribution Murphy et al. (1988). The agreement with measured data could be improved for proton energies where excitation of the 2+, 4.439-MeV state in 12C proceeds dominantly through the direct reaction mechanism. Werntz, Lang and Kim Werntz et al. (1990) used nuclear reaction calculations in the coupled-channels formalism, expected to work well in this case, to obtain a complete description of the correlated proton inelastic scattering and subsequent -ray emission process.
Kiener, de Séréville and Tatischeff Kiener et al. (2001) adopted both methods to reproduce simultaneously line shapes and -ray angular distributions of an extensive data set, covering a relatively wide angular and energy range in proton irradiations of carbon and oxygen. The data for the 4.438-MeV line in proton inelastic scattering off 12C above 15 MeV could be relatively well described by nuclear reaction calculations with the coupled-channels formalism for the direct component, similar to the findings of Werntz, Lang and Kim Werntz et al. (1990). At lower energies, however, the CN component becomes important and the direct reaction mechanism failed to reproduce the data. There, measured line shapes and -ray angular distributions could be approximately described with the slightly modified approach of Murphy et al. (1988).
Since then, new -ray data for proton inelastic scattering off 12C are available Belhout et al. (2007) which, together with older data Kiener et al. (1998), form a comprehensive data set of line shapes and angular distributions for the 4.438-MeV line in the proton energy range from threshold to = 25 MeV. There are now, in particular, line shape data close to the energy of each CN resonance that shows up as a distinct peak in the -ray production cross section in proton reactions with 12C. With these data, the present paper aims to significantly improve the accuracy of the line-shape calculations, in particular in the region of dominating CN resonances. For that, a new method has been employed that improves specifically the description of line shapes and -ray angular distributions in the region of dominating CN resonances, i.e. from threshold to about = 12 MeV. At higher proton energies, coupled-channels calculations with a deformed potential for nucleon scattering off 12C Meigooni et al. (1985) reproduced fairly well the measured data. The current work, which includes explicit CN resonances and the direct reaction component in calculations compared to measured data in wide energy and angular ranges, is, to the knowledge of the present author, the most comprehensive study of -ray line shapes ever performed.
In the following section, the formalism of the calculations for the 4.438-MeV line emission in proton inelastic scattering off 12C will be outlined. The extended parameter search for these calculations to reproduce measured -ray line shapes and angular distributions is described and the results are discussed in section III. Then the interpolation of the calculations to higher proton energies is discussed and finally applications to solar-flare -ray emission and dose monitoring in proton radiotherapy are presented.
II Formalism for angular correlations
The 4.438-MeV line emission results from the deexcitation of the first excited state of 12C, 2+ at 4.439 MeV with a half-life of 61 fs. This level belongs to the ground-state rotational band and is thus strongly coupled to the 0+ ground state, which results in relatively high cross sections in proton inelastic scattering off 12C. The second excited state of 12C, a 0+ state at 7.654 MeV, is already above the -particle emission threshold and has only a very weak -decay branching, as generally for all higher-excited states of 12C.
Lets mention for completeness that there are two 1+ states at 12.71 and 15.11 MeV, that have a moderate -decay branching to the 4.439-MeV state. The inelastic scattering cross sections to these states are, however, much smaller than to the 4.439-MeV state, and cascades from these levels may therefore be safely ignored for the present calculations. The only potential source of complexity is the 4.445-MeV state in 11B, whose deexcitaton gives rise to a 4.444-MeV -ray line. Nuclear reaction calculations predict that it may contribute significantly via the 12C(p,2p)11B reaction above 25 MeV. This line shape component will be briefly discussed in the section giving results of the line shape calculations (section III).
Proton inelastic scattering to states of a collective band like the 4.439-MeV state of 12C generally has a strong direct reaction component. In such cases, calculations in the coupled-channels framework are often able to describe satisfactorily total and differential cross sections (see e.g. Satchler (1983) and references therein). This is readily done with nuclear reaction codes like Ecis Raynal (1994), that provide the necessary flexibility in the reaction parameter input to define the ground and excited states and their couplings, potentials, etc. A broad outline of the nuclear reaction calculations has already been given in Kiener et al. (2001), but some practical aspects will be given anyhow further below.
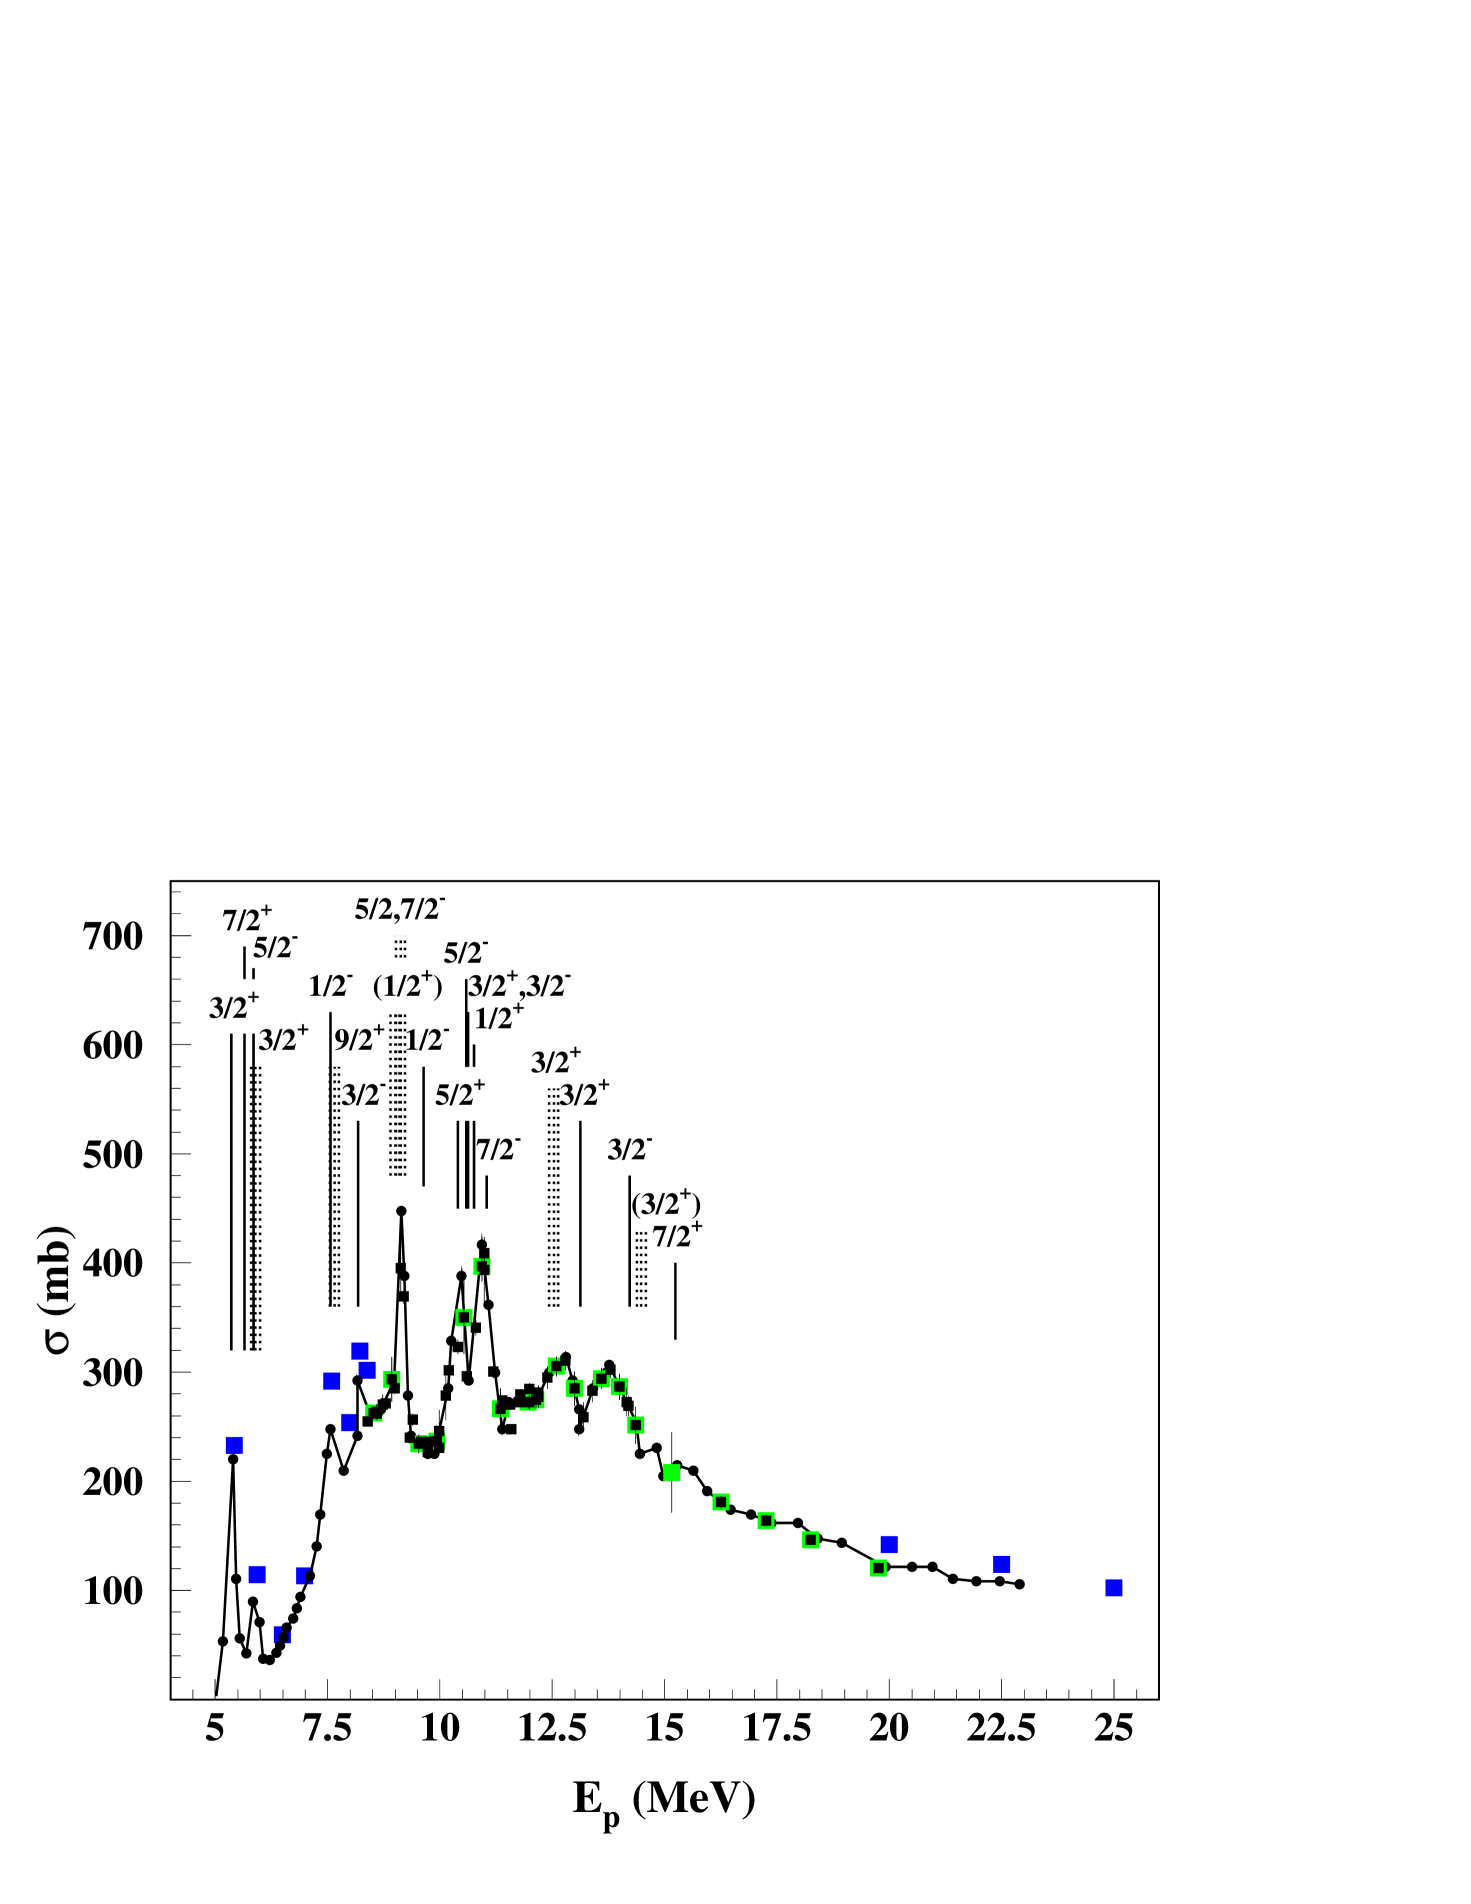
At proton energies below about 15 MeV, the CN component is clearly present, evidenced by the distinct peaks in the cross section of 12C(p,p)12C (see Fig. 1). The typical separation of the peaks suggests that they may be formed from isolated CN resonances with definite spin and parity and in fact, a good part of them can be identified with known states in the compound nucleus 13N. It is therefore tempting to describe the inelastic scattering reaction in the region up to about = 15 MeV by a superposition of the direct reaction mechanism and isolated CN resonances. In the following, the calculations of the line shapes and -ray angular distributions for the CN and direct component will be more detailed.
II.1 Compound-nucleus resonances
The formalism for inelastic scattering reactions proceeding through an intermediate CN resonance, or CN state, has been taken from the monograph of Ferguson Ferguson (1965). Taking a CN state with spin , its decay by particle emission with angular momentum to an excited state of the target nucleus with spin , followed by a deexcitation ray with multipolarity to target state , is described as a cascade with angular momenta:
| (1) |
The most general formulation of the angular correlation is given by equation (2.96) in Ferguson, implying a summation over 20 indices. In the present case, the deexcitation of the = 2+, 4.439-MeV state to the 12C ground state with = 0+ fixes = = 2, which reduces considerably the formula. For the line shape calculations, in the case of an unobserved deexcited recoil nucleus, equation (2.96) leads to:
| (2) |
where the tensor describes the CN state, the are efficiency tensors for particle and -ray counters, is a factor containing the angular couplings, and are reduced matrix elements. Summation is over . The different terms are detailed in the appendix of the present paper, the general expression of is given in equation (2.98) in Ferguson.
The tensor is the result of the reaction in the ingoing channel, the formation of the CN state with angular momenta:
| (3) |
Here, = is the proton spin (spin of 12Cg.s. = 0+), which results in a unique orbital angular momentum for a given of the CN state. Assuming an unpolarized proton beam along the laboratory system z axis, only = 0 elements of are nonzero, and can be reduced to:
| (4) |
where = , is a Clebsch-Gordan coefficient and a Racah coefficent. runs from 0 to 2, and = even, selected by the Clebsch-Gordan coefficient.
Equation 2 is thus completely defined by the angular momenta and their couplings, with the exception of the relative values of the reduced matrix elements . For the outgoing proton, is the result of spin-orbit coupling = + . Since it can be supposed that does not depend on the proton spin (), the probability for decay of the CN state by proton emission with orbital angular momentum is given by . In the present studies, 2 different values of were sufficient to describe the CN reactions at all energies. Let be the smallest possible angular momentum in the decay channel, the branching ratio
| (5) |
is the only free parameter. For the line shape calculations, equation 2 was calculated as a function of , separately for and . The differential cross section can be obtained from equation (2.96) in Ferguson, by assuming unobserved ray and excited nucleus (see Appendix). Finally, the line shapes and -ray angular distributions of the CN state were taken as an incoherent sum of both angular momenta with the respective weight factors and (1 - ).
II.2 Direct reactions
The formalism has been taken from the monograph of Satchler Satchler (1983). It is similar to the above described one for CN resonances, but with a different division of the treatment of the reaction sequence. The first two steps in the CN case, equations 3 and 1(1), leading to the excited state of 12C by inelastic scattering, is here contracted to one step with spins
| (6) |
where and are the 12C ground and excited state, respectively, is the proton spin and and the incoming and outgoing angular momenta.
The orientation of is the result of coherent summing of all contributions with possible combinations of , and . It is calculated in the framework of nuclear reactions in the coupled-channels formalism. Practically, the program Ecis97 Raynal (1994) was used for these calculations.
The angular distribution of the emitted ray is given by equation (10.132) of Satchler:
| (7) |
where the polarization tensors describe the state of orientation of the excited state after proton inelastic scattering with angle , and are the gamma-radiation parameters, detailed by equation (10.154) in Satchler (see Appendix).
The polarization tensors can be constructed from the scattering (or transition) amplitudes (equation (10.32b) in Satchler):
| (8) |
where , are the projections of spins and , respectively and the projections of the proton spin in the ingoing and outgoing channels. Summation in the present case () is only over .
Scattering amplitudes are either obtained directly from the nuclear reaction codes, or have to be assembled from other output parameters. The latter is the case for the code Ecis97 Raynal (1994), where the amplitudes can be derived from the scattering-matrix elements (see Appendix.)
III Line shape calculations
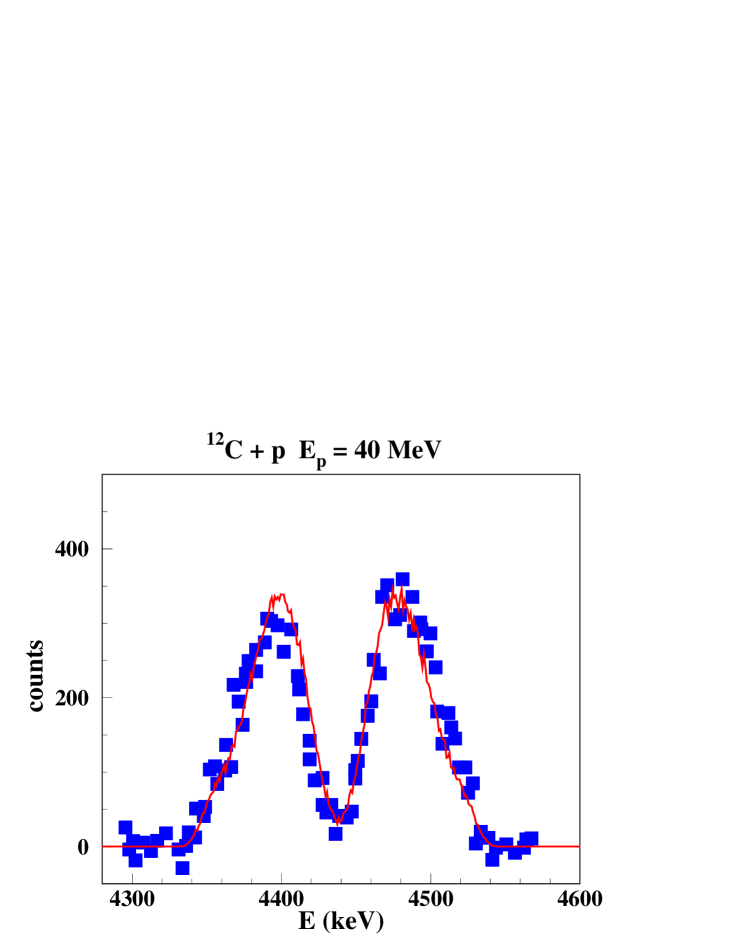
Measured line shapes come from essentially two experiments, both done at the tandem-Van-de-Graaff accelerator at Orsay. Line shapes from the first experiment in 1997 Kiener et al. (1998) have already been used for the line shape studies of Kiener, de Séréville and Tatischeff Kiener et al. (2001). Line shape data are available for selected runs in the range = 8.4 - 15.2 MeV with collodion targets (chemical composition C12H16N4O18) and with carbon targets in the range = 16.25 - 19.75 MeV. The energy ranges below = 8.4 MeV and above = 20 MeV were covered in the second experiment in 2002 Belhout et al. (2007) with carbon targets. Angular distribution data are available at some selected energies from the experiments of Dyer et al. Dyer et al. . An overview of availabe line shape data and measured cross sections is shown together with known resonance states in 13N in Fig. 1. Additionally to that, some line shapes are published in Kolata, Auble & Galonsky Kolata et al. (1967) at = 23 MeV and Lang et al. Lang et al. (1987) at = 40 MeV.
In both Orsay experiments, -ray spectra have been obtained with large-volume coaxial HP-Ge detectors equipped with active BGO shielding. In the 1997 experiment Kiener et al. (1998), 8 detectors were used in the angular range = 45∘ - 145∘, and 5 detectors in the 2002 experiment Belhout et al. (2007) in the range = 45∘ - 157.5∘ in a first phase and after a detector failure, 4 detectors in the range = 67.5∘ - 157.5∘ in a second phase. The HP-Ge crystals had typically 7 cm diameter, 7 cm length and were at about 35 cm from the target. Except for the two highest proton beam energies = 22.5 and 25 MeV, high-statistics profiles of the 4.439-MeV line on a relatively small background have been recorded. For the comparison with calculated line shapes, the Compton background below the lines was subtracted by linear interpolation (1997 experiment) or with the help of Geant simulations of the detection setup (2002 experiment).
Line shape calculations for CN resonances and direct reactions were realized with two separate Monte-Carlo type programs, very similar except for the formalism describing the angular correlations. The programs consisted in event-by-event simulation of the reaction sequence from the inelastic scattering reaction to the emission and detection of the ray. The interaction depth in the target, center-of-mass (CM) scattering angle , time of the -ray emission and -ray emission angles , were randomly drawn from cumulative distributions reflecting the different probabilities. For the -ray emission, the probabilities depend on the CM scattering angle. Therefore, a series of cumulative ()-distributions were made for a grid of CM scattering angles with = 5∘ in the case of CN resonances and = 10∘ for direct reactions.
Recoil angle and energy of the excited 12C in the laboratory were determined from nuclear reaction kinematics following the CM scattering angle and incoming proton energy. The slowing down of the recoil 12C in the target was calculated with the stopping power tables of SRIM Ziegler until the deexcitation of the 4.439-MeV state and emission of the ray with a half-life of = 61 fs occurred. Angular straggling was ignored as well as the geometrical effect of the finite beam-spot size on the target. Polar angle and energy of the emitted ray in the laboratory were calculated with relativistic kinematics and stored in an energy-angle histogram. Line shapes were then constructed from the energy-angle histogram for the solid angles spanned by the HP-Ge detectors employed in the Orsay experiments. Only full-energy events in the detectors were considered, with the effect of detector energy resolution on the line shapes, typically 4.5 keV FWHM at 4.4 MeV, included. A few million events per proton energy were simulated, resulting in high-statistics calculated line profiles.
For the direct reaction component, differential cross sections and angular correlations were obtained with the nuclear reaction code ECIS Raynal (1994) in the coupled-channels formalism. Rotational coupling between the 12C 0+ ground state and the 2+ state at 4.439 MeV with deformation parameters = -0.61 and = 0.05 was used. At energies above = 15 MeV, the 4+ state at 14.08 MeV was also included. This coupling scheme was taken from Meigooni et al. Meigooni et al. (1985), who used it in coupled-channels calculations to derive an energy- and channel-dependent potential for nucleon scattering off 12C in the range = 20-100 MeV. Calculations with this potential were already succesfully used in the previous study of Kiener, de Séréville and Tatischeff Kiener et al. (2001) for the direct reaction component above = 15 MeV. It provided also good results at lower energies, except at a few energies below = 10 MeV. There, other potentials from the compilation of Perey and Perey Perey and Perey (1976) were also tried and sometimes provided a better description of the data.
Line shapes and -ray angular distributions of the CN component at each proton energy were calculated with the spins and parities of close by 13N states. It provided mostly satisfactory descriptions of data in the region of dominating CN component with a few exceptions discussed below. At some proton energies, where several nearby states exist, calculations with all of the ’s were made and compared to the data. Calculations with the different spin parities showed in general marked differences in the line shapes or the -ray angular distributions, such that the choice was usually evident.
After selection of the CN state , the branching ratio of CN state decay orbital angular momenta and the proportion of CN () and direct reaction component (1-) were scanned, aiming for a simultaneous good reproduction of the line shapes in all detectors and the -ray angular distribution. Practically, for each , varied in steps in steps of 0.05 - 0.2, the parameter was found in a fit of the angular distribution and the resulting line shapes calculated and compared to the data. Usually, the calculated line shapes at most or all detector angles and the angular distribution had their best agreement with experiment for very similar parameter values.
IV Results
IV.1 Orsay-1997 experiment
The results of the parameter search for the CN and the used nuclear potential for the direct component to reproduce the measured line shapes and -ray angular distributions are summarized in table 1. Good agreement with measured data could be obtained at each energy with the potential of Meigooni et al. Meigooni et al. (1985) for the direct reaction component and one single resonance for the CN component. At all energies except the lowest, the (C) obtained with the calculated angular distributions are similar to and sometimes even smaller than the (L) of Legendre-polynomial fits to the angular distribution data. The are in both cases obtained with 3 free parameters (, and an overall normalization factor for the calculated distributions, 3 coefficients for the Legendre-polynomial fit of an electric quadrupole transition 2+ 0+). Error bars on the experimental data are of the order of 4 - 6 %.
The of the best adjustment corresponds in nearly all cases to a resonance state in 13N whose energy is within , the total width of the state, to the excitation energy in the CN reaction. At = 12.0 MeV ( = 13.0 MeV), calculations with = corresponding to the most probable state at 13.50(20) MeV ( 6500 keV) could not reproduce the data. They were reproduced by a = , that may be attributed to the state at 12.937(24) MeV ( 400 keV) whose is not known. No nearby state in 13N was found at = 16.25 MeV, but the measured data could also be reasonably reproduced without a CN component.
As expected, the proportion of the CN component is high for proton energies on the three narrow peaks at 9.1, 10.4 and 10.9 MeV in the cross section excitation function, see Fig. 1. For the peak at 9.1 MeV, the closest measurement is at = 9.2 MeV, where, however, no line shapes were available. Because of the particular importance of the cross section here, the result of the angular distribution fit was nonetheless included in table 1. There, equivalent were obtained for and resonances, but is more probable because the width of the 13N state with = ( = 10.360 MeV, = 75 keV) seems barely compatible with the apparent peak width of 200 keV in the cross section data of Dyer et al. Dyer et al. (1981).
Below = 12 MeV with significant CN component, the values of and are typically constrained to within 0.15. For resonances, decay angular momenta = 1 and = 3 give exactly the same line shapes and -ray angular distributions, such that could not be constrained. For resonances, only = 2 is possible. Above that energy, the CN component is weak, reasonable adjustements could also be obtained throughout with = 0, and the constraints on are weaker ( 0.3). At the highest energy with the collodion target, = 15.2 MeV, the 16O(,2)12C reaction contributes and has been added in the calculations.
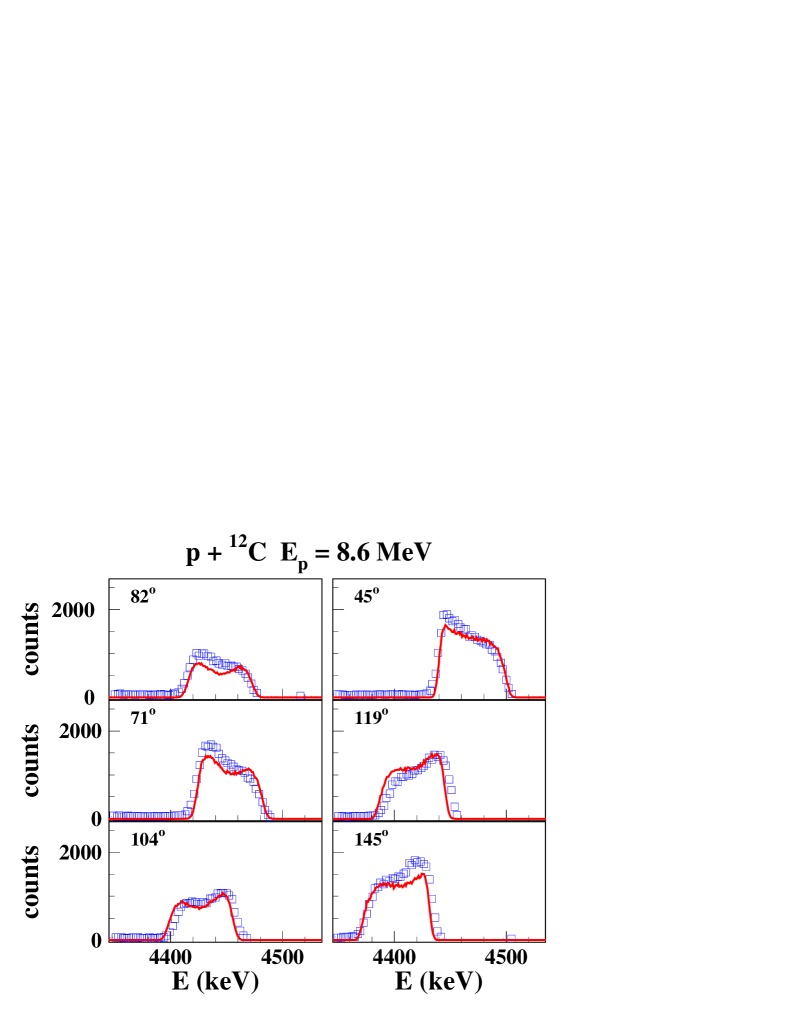
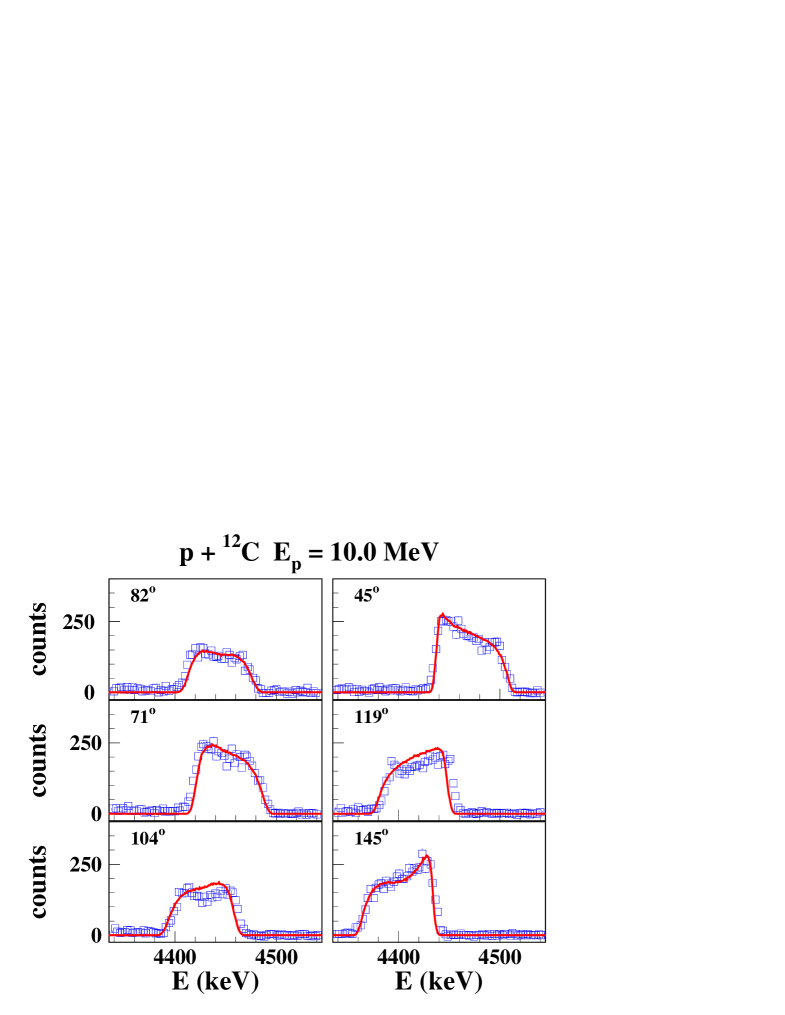
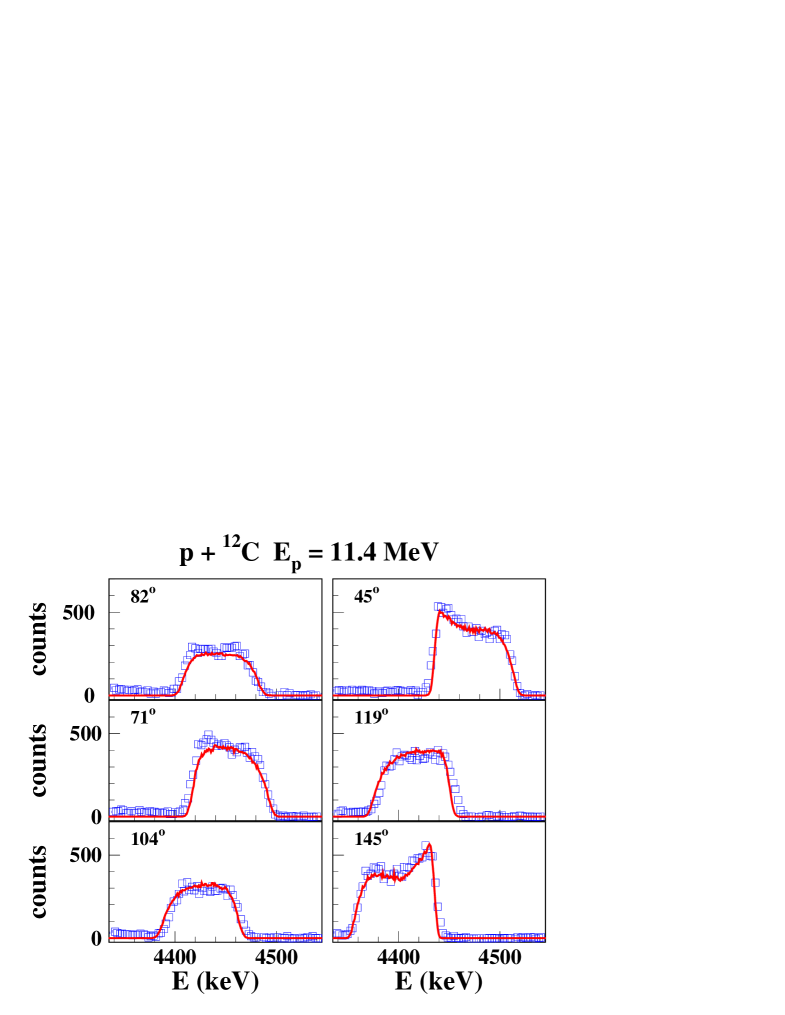
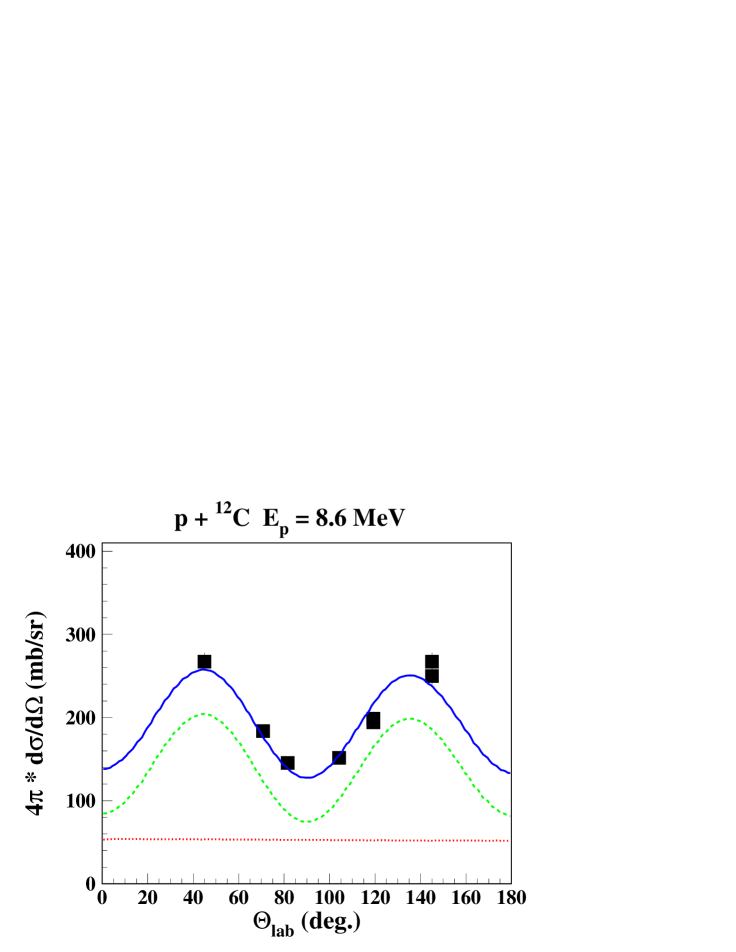
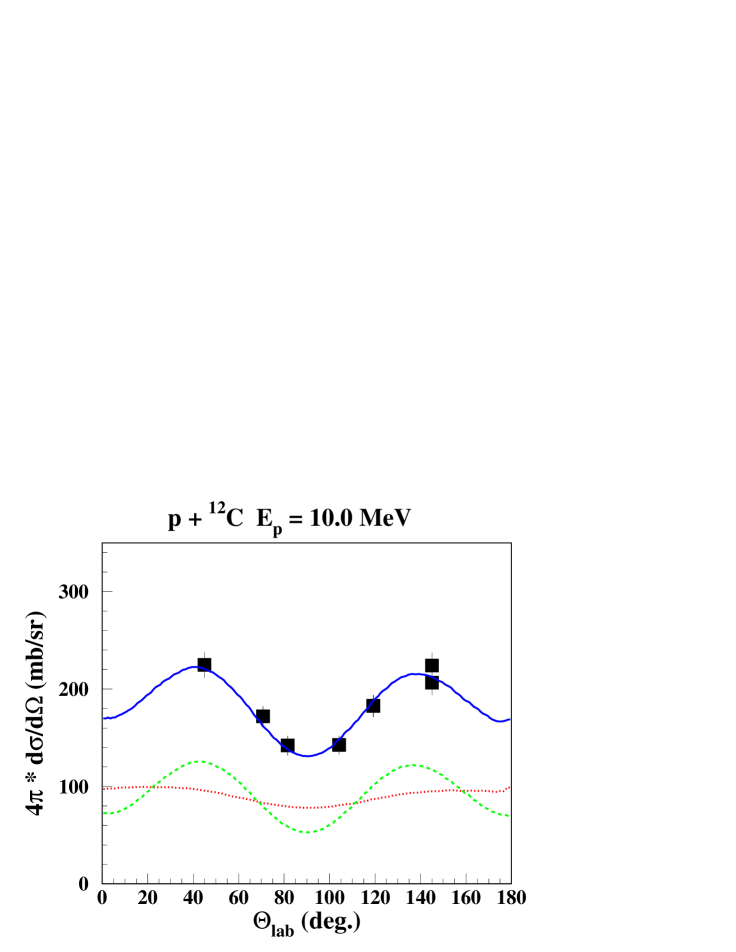
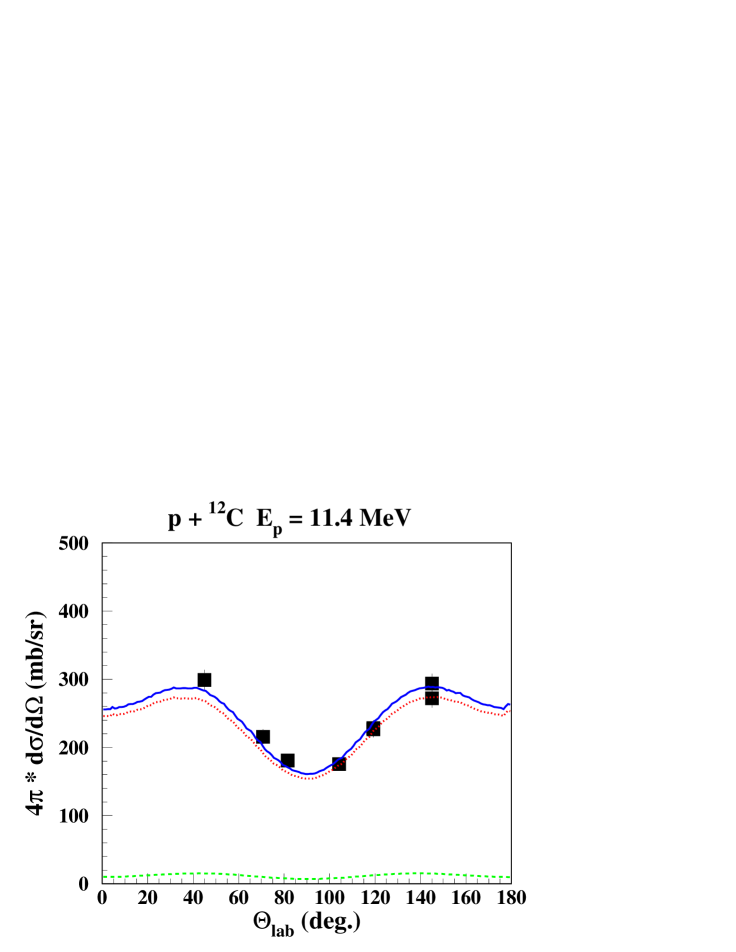
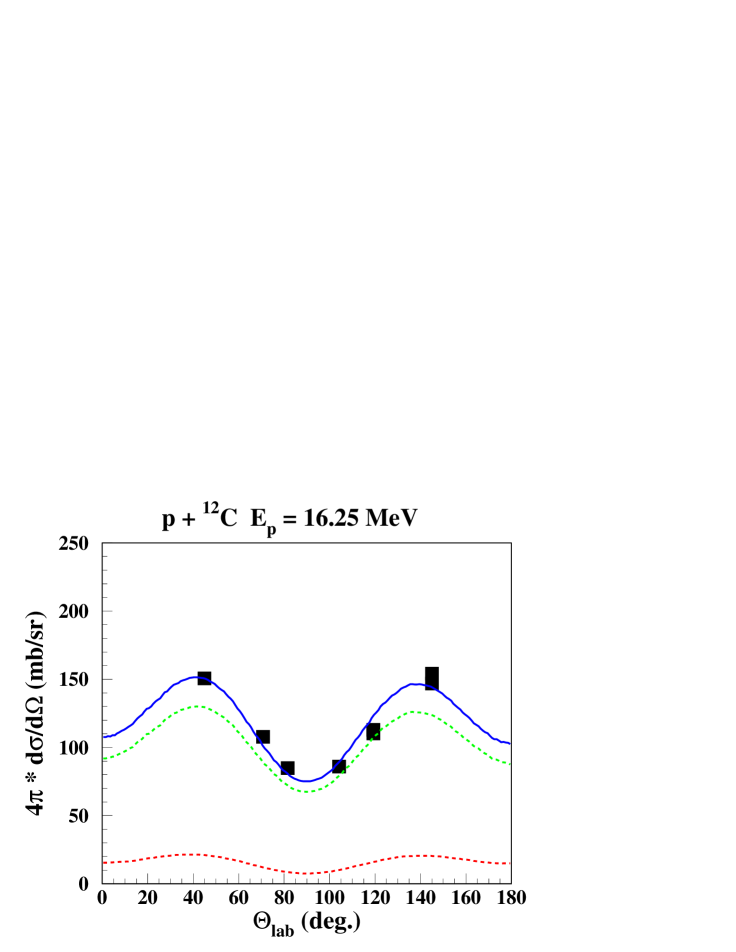
Calculated and measured line shapes and angular distributions at 4 proton beam energies are shown in Figs. 2 and 3. It includes proton energies with largely dominating CN or direct reaction components, at = 11.4 MeV and = 16.25 MeV, respectively, and energies with a more equal mixture of both components at = 8.6 MeV and at = 10.0 MeV. These examples represent also the typical degree of agreement between calculation and measured data, with very good adjustments of the -ray angular distribution and reasonably well reproduced line shapes with some deviations of the order of 20% at a few angles.

IV.2 Orsay-2002 experiment
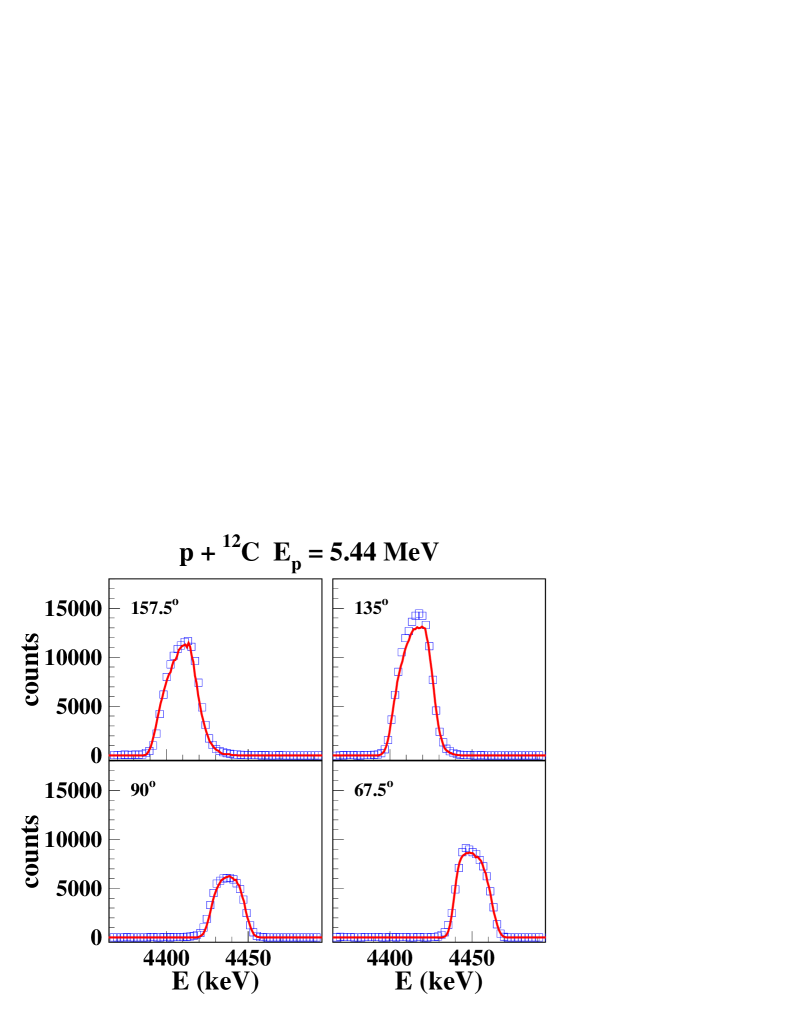
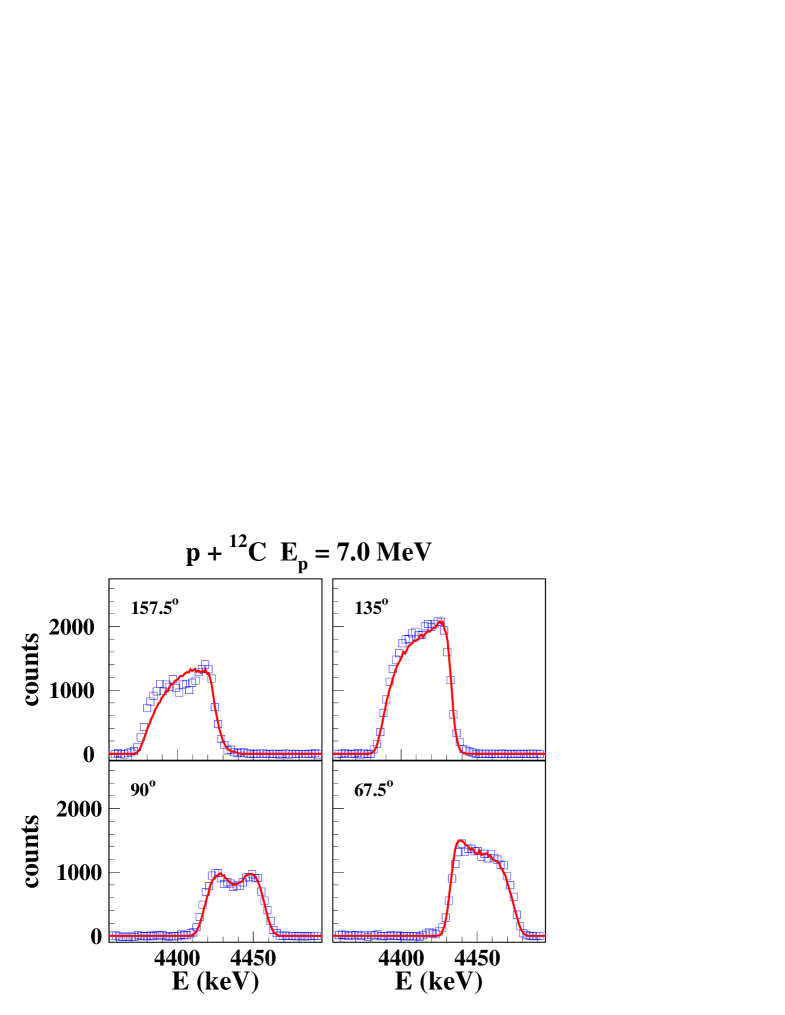
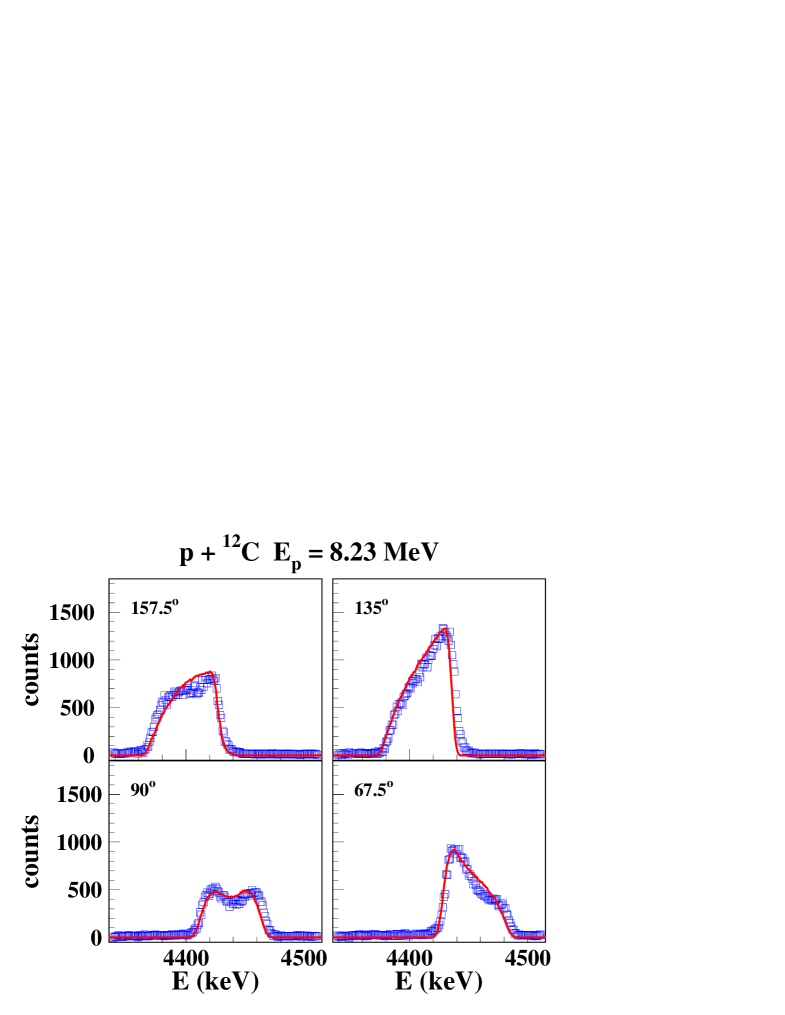
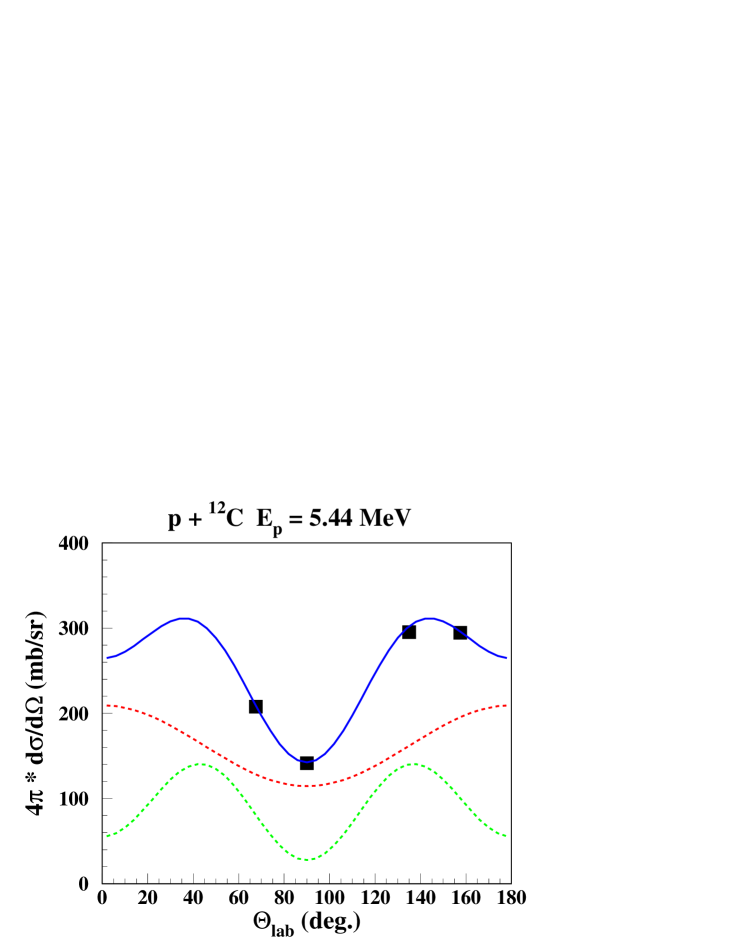
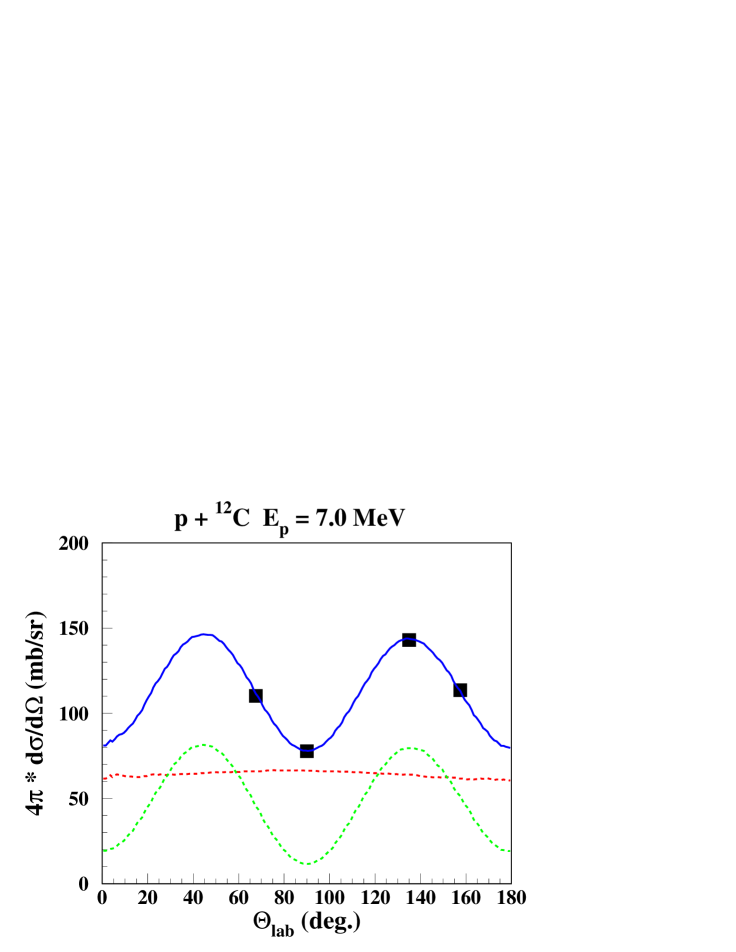
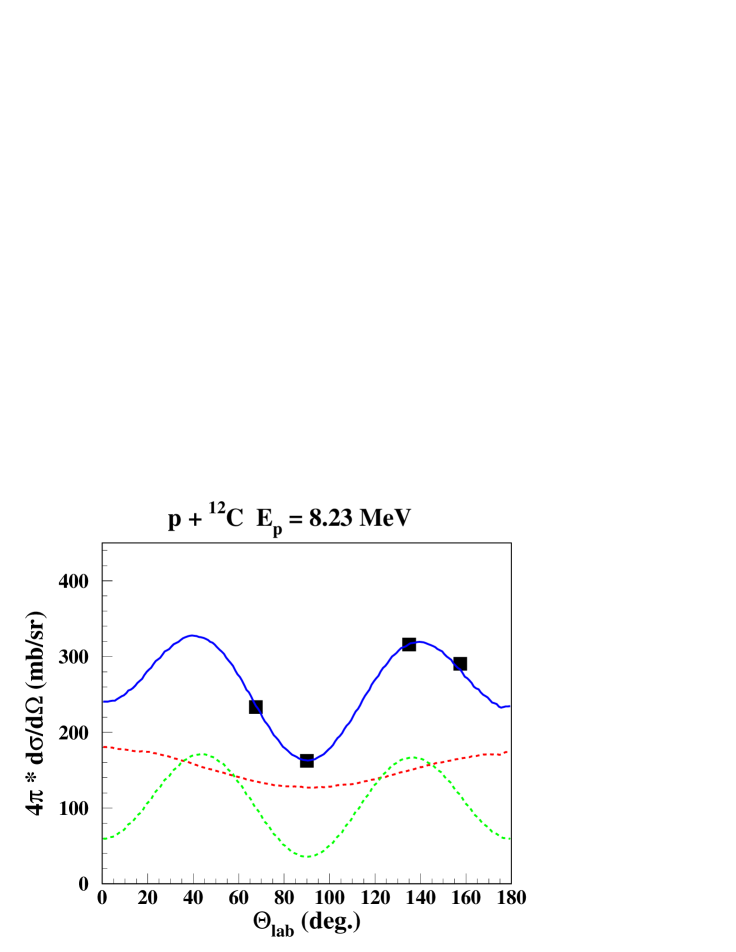
The results of the parameter search to reproduce measured line shapes and -ray angular distributions in the energy ranges = 5.44 - 8.4 MeV and = 20.0 - 25 MeV, are listed in table 2. Good agreements with measured data could be obtained with the direct reaction and one single resonance component. In the range = 5.44 - 8.4 MeV, the angular distribution adjustments are good to excellent, considering error bars on the measured data of 1.5 - 2.5 %. For the three highest energies, experimental error bars are of the order of 5 - 15 % due to lower count statistics, and adjustments are good.
The potential of Meigooni et al. Meigooni et al. (1985) gave good results in the = 20-25 MeV range but was not able to reproduce several of the experimental data below 8 MeV. Attempts with modified strengths of the surface imaginary potentials and different coupling schemes could in some cases improve the agreement with data, but were not conclusive. Also attempts with a low-energy extension Weppner of another global nucleon-nucleus optical model Weppner et al. (2009), did not give a better description of the data. Finally, for the sake of simplicity, it was decided to use optical model potentials listed in the compilation of Perey and Perey Perey and Perey (1976) for similar proton energies (see table 2), and without modification in the coupled-channels calculations. This could significantly improve the agreement with the experimental data for 4 proton energies.
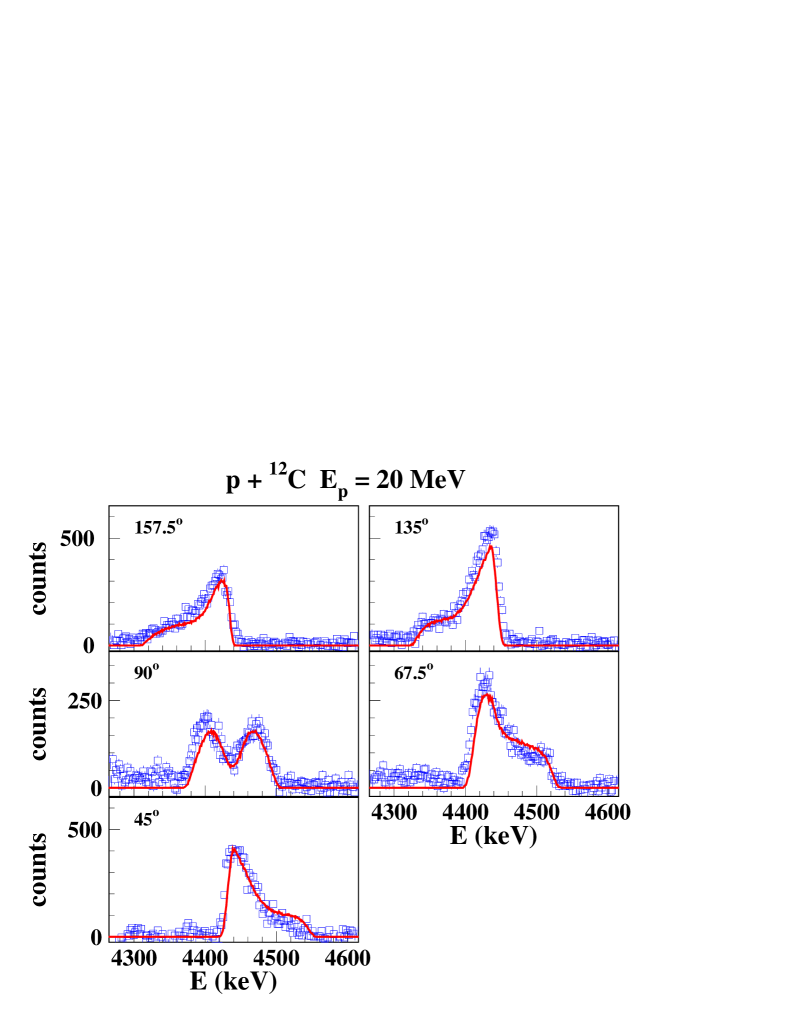
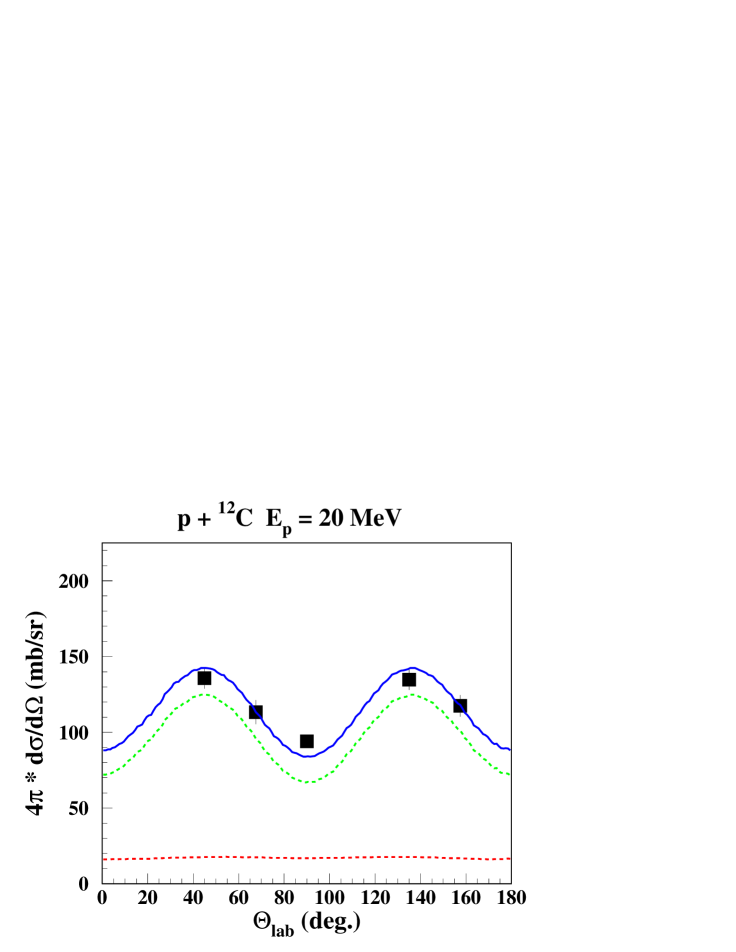
For the CN component below = 7.6 MeV, the best agreements were obtained with ’s corresponding to the most probable 13N state. At = 8.0 - 8.4 MeV, calculations with = and of the closest 13N states at 9.000 and 9.476(8) MeV, respectively, were unable to describe the data. They could, however, be reproduced with a component, probably corresponding to the state at 7.900 MeV whose total width is 1500 keV. Above = 20 MeV, the data could best be described with a CN component. A corresponding state with known spin parity could only be found for = 20 MeV. Here, line shapes are better reproduced with a negligible CN component, while the angular distributions are better fitted with 30% CN component ((C) = 0.3-2.1). The indicated values represent a compromise and are also in better agreement with adjustments of other angular distribution data in this energy range, see below.
Again, similar to the results for the Orsay-1997 data, there is a sizeable CN component at lower proton energies, while the data above = 20 MeV are dominated by the direct reaction component. and are typically constrained within 0.15, except at = 20 - 25 MeV, where the uncertainties on are of the order of 0.3.
Calculated and measured line shapes and angular distributions at 4 proton beam energies are shown in Figs. 4, 5. There is an excellent agreement between the calculated laboratory -ray angular distributions and the measured data for the 3 lower proton energies. As mentioned above, the angular distribution at = 20 MeV would be better fitted with about twice as much of the quasi-isotropic CN component, however with a degrading fit for the line shapes. The calculated line shapes at = 5.44 MeV and 20 MeV reproduce nicely the experimental data, while for = 7.0 MeV and 8.23 MeV, the agreement is generally good, except at 157.5∘.
IV.3 Other experiments
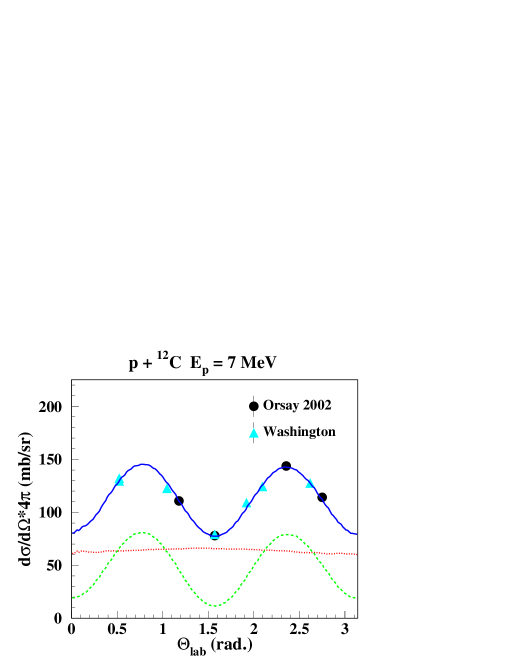
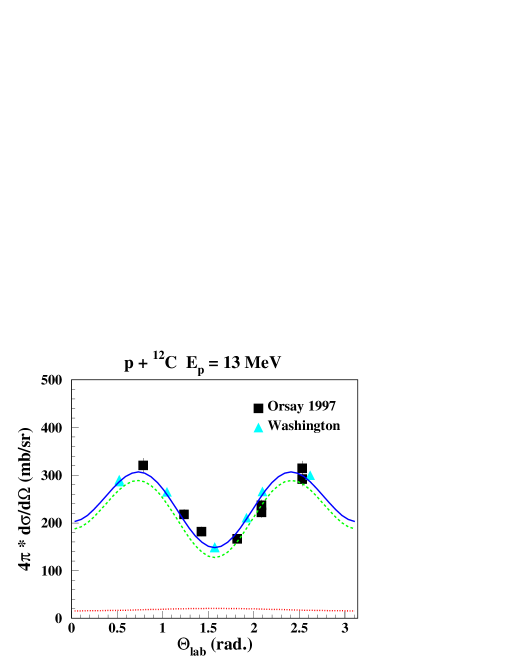
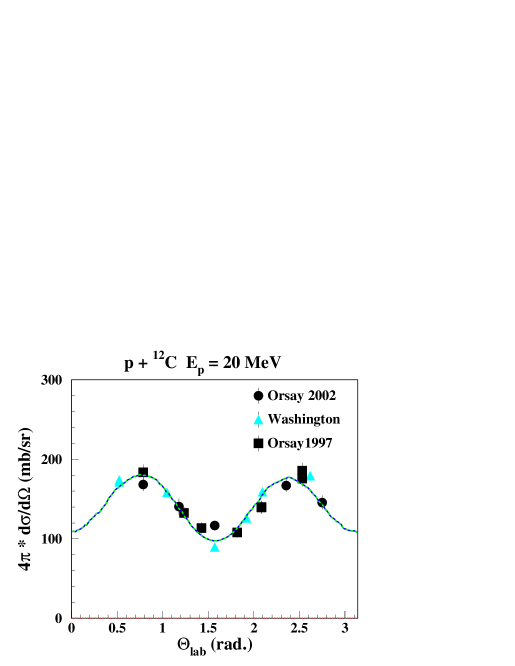
The most comprehensive data set of 4.438-MeV -ray cross sections in proton inelastic scattering off 12C has been obtained at the Washington tandem accelerator from threshold up to = 23 MeV by Dyer et al. Dyer et al. (1981). No line shapes are available from that experiment, but angular distributions are available at some selected energies Dyer et al. . They agree well with the Orsay-1997 and 2002 data up to = 18 MeV, and thus support the results presented in Tables 1, 2. At higher energies, the Washington and the Orsay-1997 data have slightly more pronounced minima and maxima than the Orsay-2002 data and clearly agree with negligible CN components. This is illustrated on Fig. 6 where Orsay and Washington data scaled to the same integrated cross section, are shown together for some proton energies.
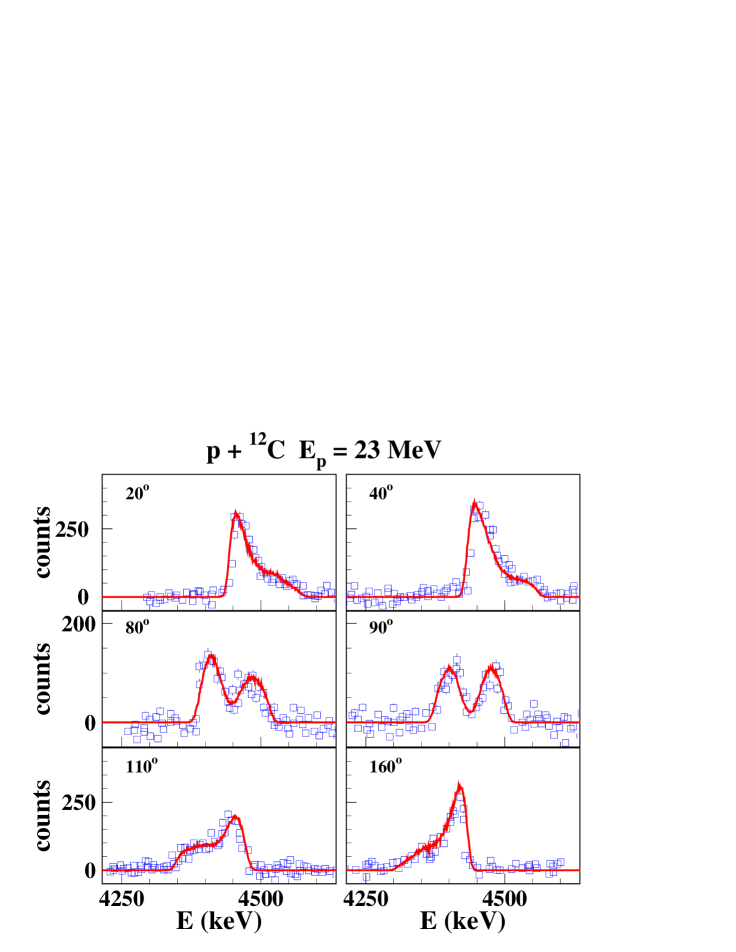
Kolata, Auble & Galonsky Kolata et al. (1967) published partial -ray spectra around the second escape peak of the 4.438-MeV line at 11 different angles in the range = 20 - 160∘ for = 23 MeV. These data, after subtracting an estimated background and applying an energy shift of 40 keV for all detectors (in the spectra of Fig. of Ref. Kolata et al. (1967), only channel numbers are shown, and the energy dispersion is indicated in the caption), are well reproduced by the direct reaction component with the potential of Meigooni et al. Meigooni et al. (1985) and with a negligible CN component. A comparison with calculated line shapes at 6 different angles is shown on Fig. 7.
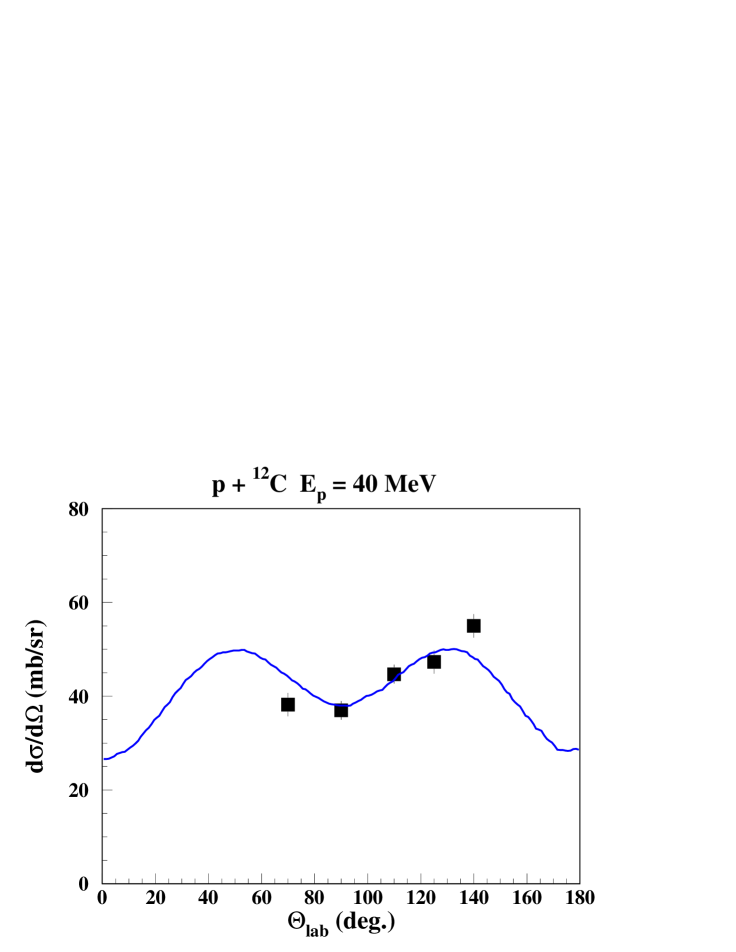
For = 40 MeV, a line shape at = 90∘ and the -ray angular distribution have been published by Lang et al. Lang et al. (1987). The line shape is well reproduced by a pure direct reaction component, calculated with the potential of Meigooni et al. Meigooni et al. (1985), but there is an obvious disagreement between the calculated and the mesured angular distribution, see Fig. 8. However, the difference of 17% between the differential cross section data at 70∘ and 110∘ is much larger than the possible assymetry with respect to 90∘ in the laboratory system, having furthermore the wrong sign. This may indicate an underestimation of the error bars, presented to be of the order of 5%.
Calculations with the nuclear reaction code Talys Koning et al. (2008) predict a non-negligible contribution of 11B at = 40 MeV, by deexcitation of its second excited state at 4.445 MeV. Using for the 12C(p,2p)11B reaction the method of Kiener, de Séréville and Tatischeff Kiener et al. (2001) for the calculation of the 4.439-MeV line in the 16O(p,p)12C reaction, the 4.445-MeV line at 90∘ presents a flat profile in the range 4350 - 4530 keV and an isotropic angular distribution. The deep valley at the nominal line energy of the measured 4.439-MeV line shape (Fig. 8) leaves practically no space for a sizeable 11B contribution. This contribution was consequently neglected for the line shape calculations in the next section.
V Discussion and applications
Line shapes and -ray angular distributions are well reproduced at all energies up to = 20 MeV with one single for the CN component, that in many cases can be attributed to a known state in 13N. There is a strong CN component up to 12 MeV, above that the direct reaction reaction component dominates. For = 20-25 MeV, only the -ray angular distributions of the Orsay-2002 experiment favor a significant CN component, while the angular distributions of the Orsay-1997 and the Washington experiments, as well as the line shapes of Kolata, Auble & Galonsky and of both Orsay experiments favor a negligible CN component. The latter is also expected from nuclear reaction theory and it is thus highly probable that the CN component is negligible for the 4.438-MeV line emission above = 20 MeV.
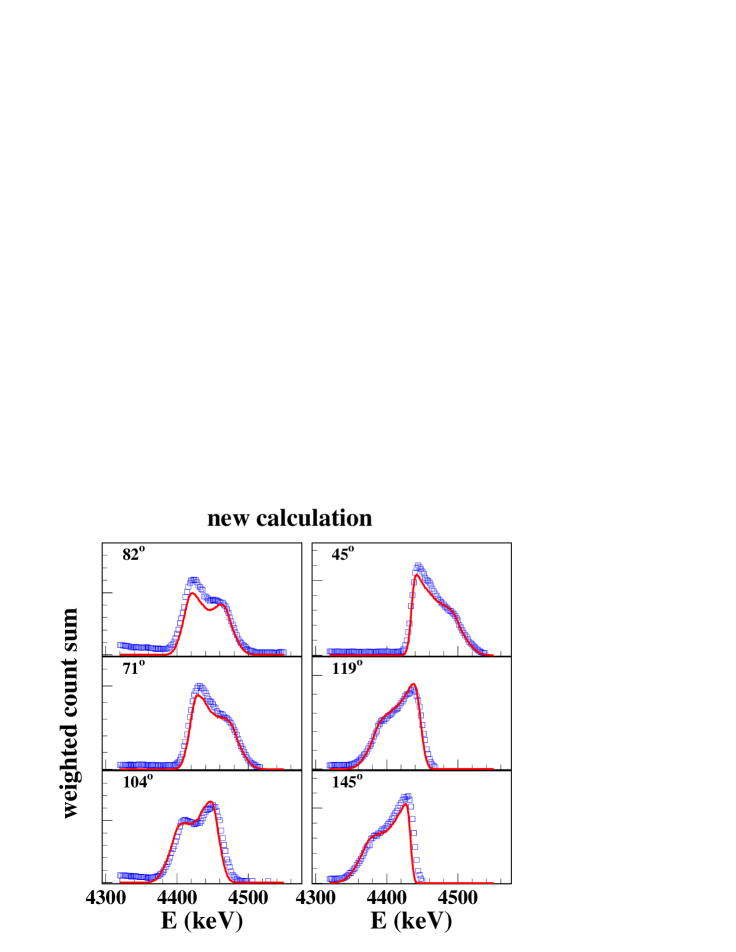
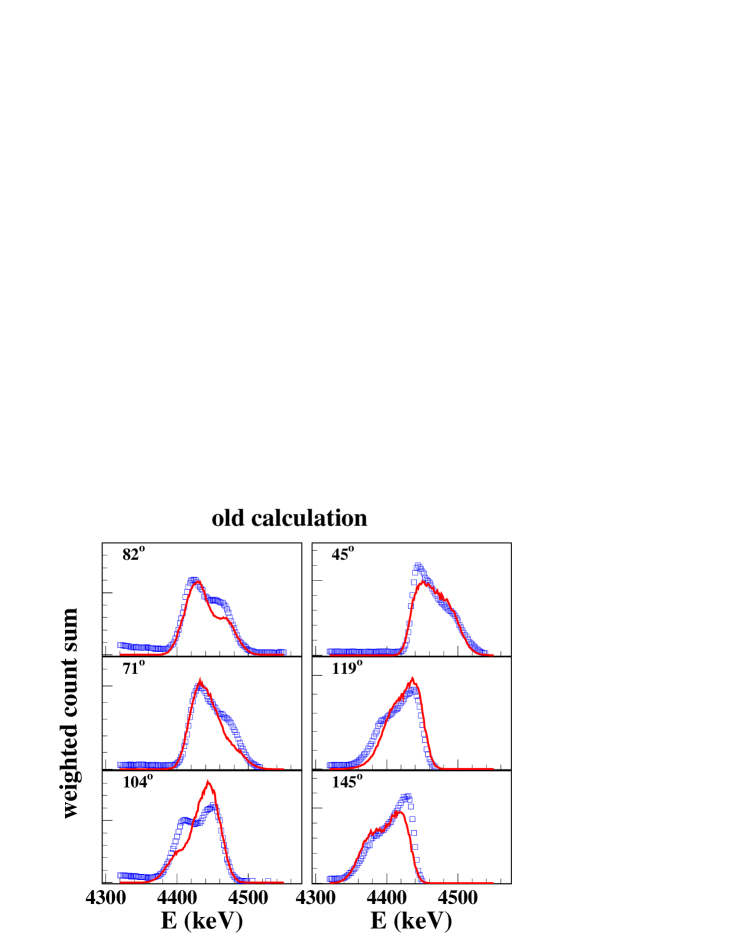
Although not all line shapes are perfectly reproduced by the calculations, the present study brings a significant improvement with respect to previous line shape calculations. The improvement is particularly obvious in the proton energy range with strong CN contribution, where the full treatment of particle- correlations in the CN component with the angular momentum coupling theory results in much better line shape and angular distribution adjustments than the magnetic-substate population method as proposed in Ref. Ramaty et al. (1979) and extensively used in Ref. Kiener et al. (2001). This is illustrated in Fig. 9 where the line shape data of the Orsay-1997 experiment and calculations are summed with weight factors corresponding to a thick-target interaction probability of an injected beam with energy spectrum , as encountered in solar flares.
At higher energies, the new data of the Orsay-2002 experiment at = 22.5 and 25 MeV and the data of Refs. Kolata et al. (1967); Lang et al. (1987) at = 23 MeV and 40 MeV, respectively, consolidate the results of Refs. Kiener et al. (2001); Werntz et al. (1990) pointing out a largely dominating direct reaction component. For this component, the potential of Meigooni et al. Meigooni et al. (1985) is very successful, predicting correctly the line shapes up to = 40 MeV and the angular distributions up to = 25 MeV with certainty, and very probably up to = 40 MeV. It is worth noting that this potential, developed for elastic and inelastic nucleon scattering off 12C in the range = 20 - 100 MeV should then also give quite reasonable line shapes and -ray angular distributions up to 100 MeV. It is thus a very important ingredient for applications requiring calculations in a large proton energy range. With the present results, the 4.438-MeV line emission for solar-flare conditions and in proton radiotherapy of eye tumors can be calculated. In both sites, it is a thick target interaction where proton reactions below = 100 MeV are dominating the line emission.
V.1 Solar flares
-ray emission from the Sun during strong solar flares is regularly observed by orbiting spacecraft since more than 40 years. The high-energy photon spectrum often features some strong, relatively narrow nuclear -ray lines sitting on a quasi-continuum composed of thousands of other, weaker or broader, nuclear lines and a smooth spectrum from electron bremsstrahlung (see e.g. Verstrand et al. (1999)). This emission is thought to be produced in impulsive solar flares by energetic particles that are accelerated in the solar corona up to GeV energies and trapped in magnetic loops on the solar surface. The interactions leading to electron bremsstrahlung and nuclear -ray line emissions happen then essentially in the solar chromosphere and photosphere, where the energetic particles are eventually stopped.
Important questions in solar flares are the composition, the energy spectrum and the directional distribution of the energetic particles, that are linked to the mechanism that accelerates and propagates them in the solar atmosphere. Composition and directional distribution, and to a lesser extent the energy spectrum, can be deduced from the observed shapes of the strongest nuclear -ray lines. The 4.438-MeV line is often, together with 2.225-MeV neutron capture line on 1H and the 511-keV annihilation line, the strongest line from nuclear interactions. The narrow component of the 4.438-MeV line in solar flares is mainly produced in interactions of energetic protons and particles with 12C and 16O of the solar atmosphere Ramaty et al. (1979). The line is also produced in reverse kinematics by energetic 12C and 16O interacting with ambient 1H and 4He, but with a very large width and it is hardly detectable.
The line-shape calculations are done with a solar flare loop model of the energetic particle interactions as detailed in Refs. Hua et al. (1989); Murphy et al. (1990), that describes many features of the observed solar flare -ray emission. Accelerated particles are injected isotropically at the top of a magnetic loop, consisting of an arc in the solar corona connected to two straight portions along a solar radius through the chromosphere down to the loop footpoints in the photosphere, with field strength B constant in the corona and depending on the pressure in the other regions. Particle transport along the magnetic field lines is calculated, including pitch-angle scattering on MHD turbulence until the particle is absorbed in a nuclear interaction or stopped. The interactions of the energetic particles in this model are predominantly induced by downward-directed particles inside the chromosphere.
For the spectrum and composition of the incident, accelerated particle population the values of Ref. Kiener et al. (2006) are used, which were deduced from the analysis of the October 28, 2003 solar flare. This flare was observed by the gamma-ray spectrometer SPI onboard the INTEGRAL satellite Gros et al. (2004) and features the most precise data available for the 4.438-MeV line in solar flares. In the described solar flare loop model for this case, slightly more than half of the 4.438-MeV rays accounting for the narrow component are produced by proton inelastic scattering off 12C. Also, more than 90% of these proton inelastic scattering reactions take place at energies lower than = 25 MeV, completely covered by the calculations, validated by experimental data, of the present study.
A detailed analysis of the 4.438-MeV 12C and 6.129-MeV 16O lines observed from that flare was made in Ref. Kiener et al. (2006), based on the line shape calculations of Ref. Kiener et al. (2001). There, both observed lines could be very well reproduced with relatively narrow downward-directed energetic particle distributions and, for a simultaneous fit of the 4.438-MeV and 6.129-MeV lines, with an -to-proton ratio of 0.1. In particular, it could be shown that a narrow particle distribution around the flare axis as resulting from pitch-angle scattering (PAS) with a small mean free path, defined as the PAS(=30) distribution in the model of Hua et al. (1989); Murphy et al. (1990), could perfectly describe both lines, with the flare axis being perpendicular to the solar surface at the flare coordinates.
Taking the parameters of Ref. Kiener et al. (2006) for the carbon-to-oxygen ratio in the solar atmosphere and the energy spectra of the incident particles, the 4.438-MeV line shape in the present study was calculated for the PAS(=30) directional distribution and a range of energetic -to-proton ratios (). The calculation of proton and -particle reactions with 16O was done following the method described in Kiener et al. (2001). For the 16O(p,p)12C reaction, isotropic emission of proton, particle and ray perfectly reproduced measured angular distributions and line shapes below = 20 MeV. Extrapolation to higher energies and to the 16O(,2)12C reaction should be quite accurate in this case.
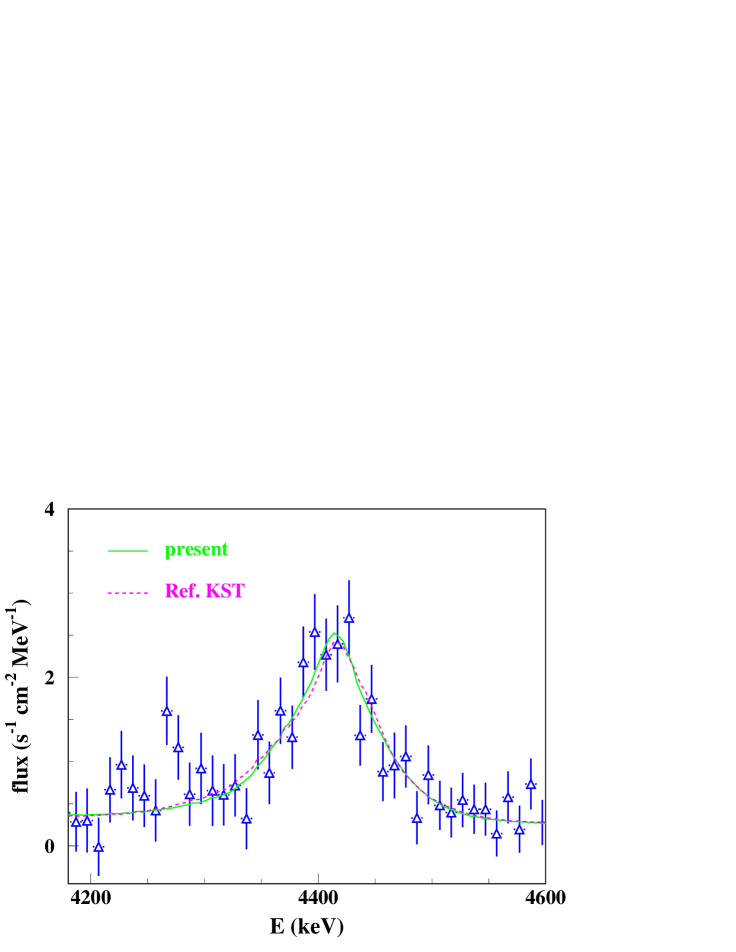
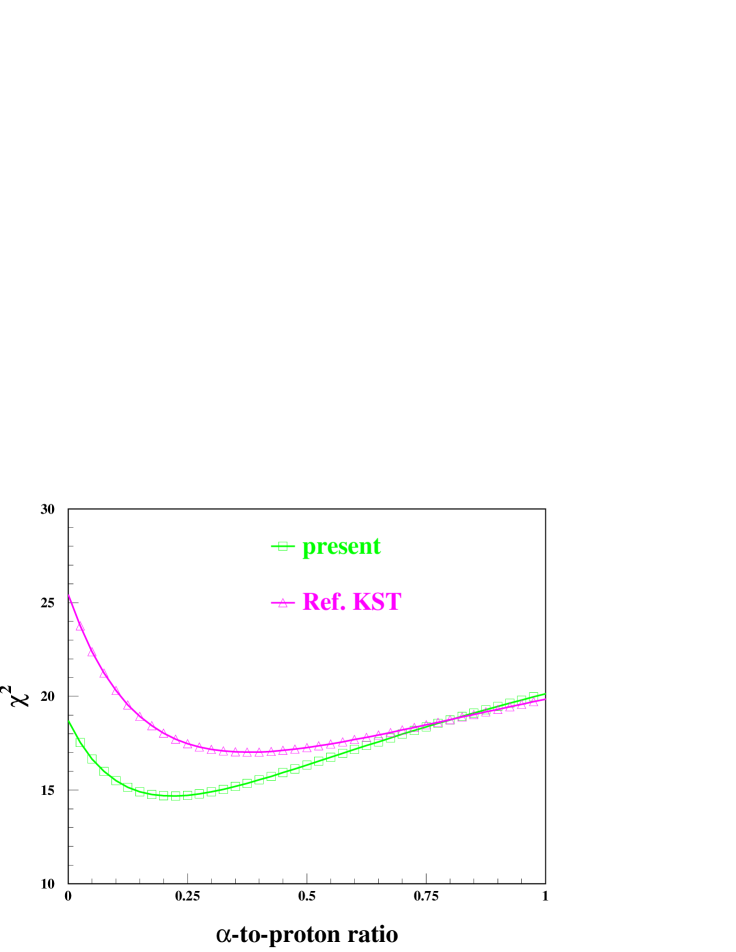
For proton inelastic scattering off 12C, the previous line shape calculations Kiener et al. (2001) and the present ones have been used. The best fit and the resulting line shapes, compared with the observed data, are shown in Fig. 10. A nearly perfect fit could be obtained with both line shape calculations with, however, significantly different . This result is in line with the findings of Ref. Kiener et al. (2006) about the directional distribution of the interacting energetic particles, but shows also the sensitivity to small differences in the line shape calculations for inelastic proton scattering. It illustrates clearly the need for accurate line-shape calculations in a wide particle energy range, as it is done for the first time in the present work.
It is worth mentioning also that in this example, -particle inelastic scattering plays a non-negligible role. Its contribution to the 4.438-MeV emission is for example about 30% for = 0.22. Still higher values of 0.5 have been proposed to prevail in impulsive solar flares Murphy et al. (1991). For the future, an improvement in the line shape calculations for -particle inelastic scattering would therefore be very appreciable for such studies.
V.2 Proton radiotherapy
Similar to solar flares, the 4.438-MeV line in human tissue during proton radiotherapy is essentially produced by inelastic scattering off 12C and reactions with 16O. Incident proton energies are in the range of about 60 MeV to 200 MeV. For an incident proton energy of = 68 MeV, typical for eye cancer treatment, there are 2.710-3 4.438-MeV rays emitted per incident proton due to inelastic scattering off 12C, and 5.610-3 per incident proton due to proton reactions with 16O and a negligible part (10-4 per incident proton) is from reactions with 14N. The calculated angular distribution and shapes of the 4.438-MeV line are shown on Fig. 11. The calculations were done with the average composition of the human body Emsley (1983), the experimental cross sections for the 4.438-MeV line production in proton inelastic scattering off 12C, the cross sections of table I in Ref. Kiener et al. (2001) for proton reactions with 16O and from the cross section compilation of Ref. Murphy et al. (2009) for proton reactions with 14N. The 4.438-MeV line yield from proton reactions with 16O is reduced by about 25% if one uses the compilation, Ref.Murphy et al. (2009) for cross sections with 16O instead of Ref. Kiener et al. (2001). The energy loss of protons in human tissue is calculated with the tables of SRIM Ziegler .
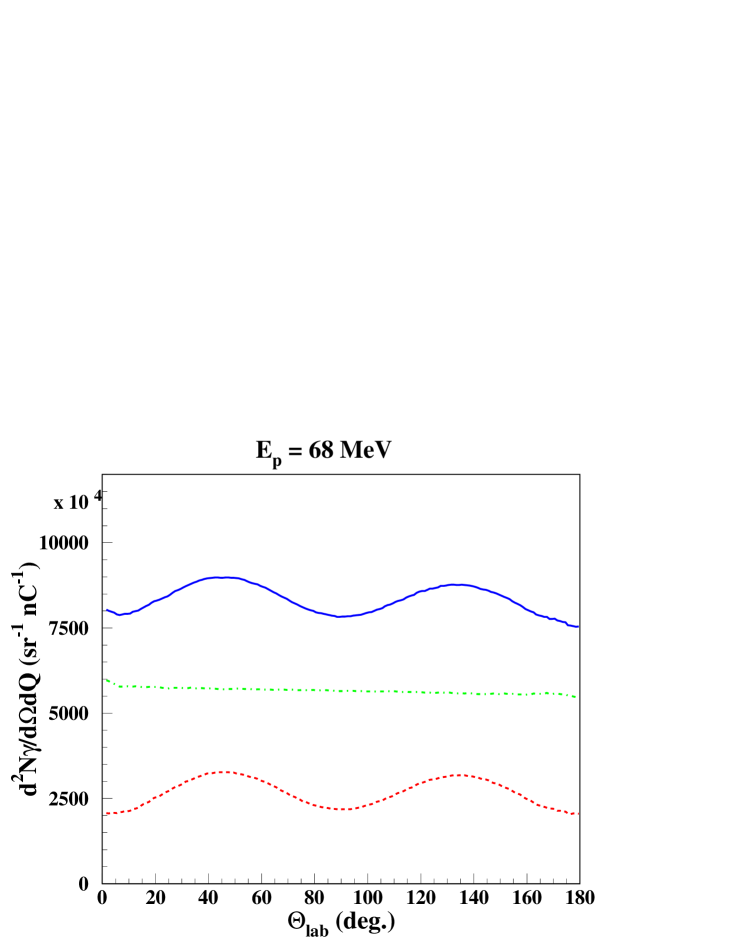
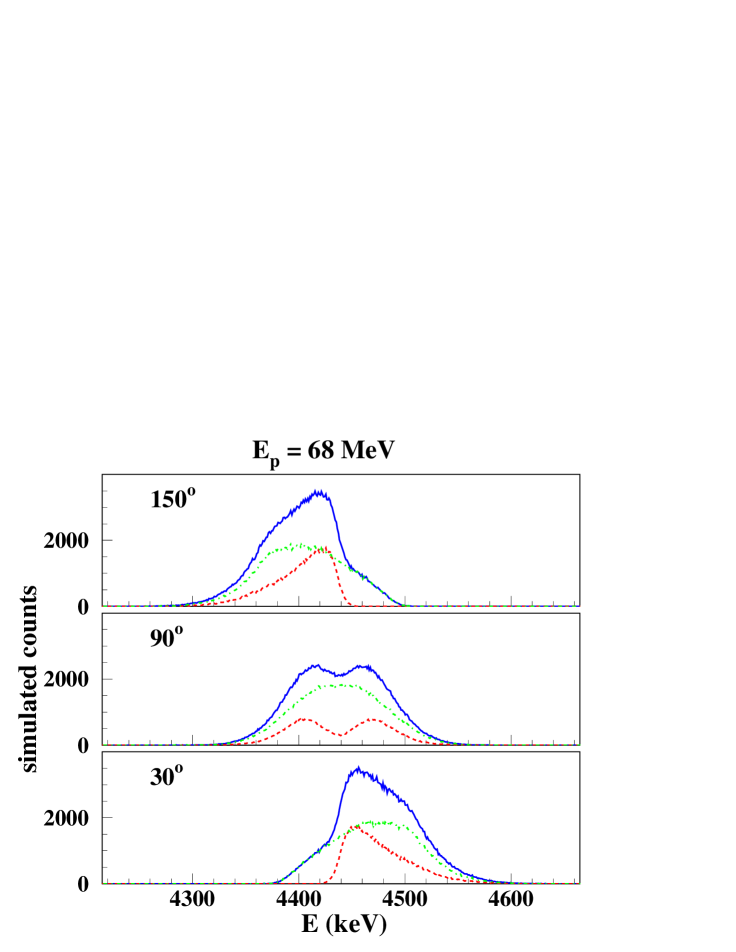
The resulting 4.438-MeV line exhibits characteristic shapes at the different observation angles. The knowledge of these shapes is essential for the extraction of the 4.438-MeV line integral in -ray spectra eventually measured by radiation monitor detectors. Inelastic scattering modulates the -ray angular distribution, with a difference of about 10-15% between the maximum at 45∘ and the minima. At this incident proton energy, slightly more than half of the -ray emission in reactions with 12C is produced for proton energies above = 25 MeV, and about 80% in reactions with 16O. The calculations are thus strongly based on extrapolations, but line shapes and angular distributions should nonetheless be quite accurate, as explained above. The present study should therefore allow a more precise monitoring of the radiation dose, independent of the position of the radiation monitor detector with respect to the beam direction. This may not hold for proton energies well above = 100 MeV, where other potentials may be needed for the inelastic scattering off 12C. More importantly, cross sections of the 4.438-MeV line emission in proton reactions with 16O have only been measured up to = 50 MeV, and there is a strong discrepancy at = 40 MeV between the data of Refs. Lang et al. (1987) and Lesko et al. (1988).
VI Summary
In this paper, a new approach leading to a detailed and accurate calculation of the 4.438-MeV -ray emission in proton inelastic scattering off 12C has been presented. It is based on results of coupled-channels calculations for the direct reaction component and angular momentum coupling theory for CN resonances. Parameters of the calculations were adjusted by comparison with a comprehensive data set of measured line shapes and -ray angular distributions in the proton energy range from threshold to = 25 MeV. All experimental data could be relatively well reproduced by a set of isolated CN resonances of definite spin and parity incoherently added to the direct reaction component. With this study, a substantial improvement with respect to previous line shape calculations, in particular in the energy range of dominating CN resonances could be obtained.
At energies above 14 MeV, where the direct reaction dominates, the data are well described by the results of coupled-channels calculations with an energy- and channel-dependent potential, that has been derived for nucleon scattering off 12C in the range up to = 100 MeV. This enables straightforward extrapolations to higher proton energies, and the scarce data available in this range, one line shape and the -ray angular distribution at = 40 MeV, are also reasonably described by these calculations. With the present results, line shapes and -ray angular distributions can be predicted with accuracy for proton inelastic scattering off 12C from threshold to at least = 100 MeV.
Applications to solar-flare -ray emission and proton radiotherapy were discussed, and differences with a previous method outlined. The 4.438-MeV -ray emission in solar flares can now be accurately calculated for not too high -to-proton ratios, but would greatly benefit from an improvement in the treatment of inelastic -particle scattering. Applications to proton radiotherapy would also benefit from new experimental data, in particular for proton reactions with 12C above = 100 MeV and 16O above = 30 MeV. Fortunately, new experimental data for p + 12C and p + 16O reactions up to = 200 MeV from the iThemba LABS cyclotron should soon be available. First results are encouraging Yahia-Cherif et al. , such that still more accurate predictions in the cited applications can be possible in the near future.
Acknowledgements.
I like to express my gratitude to I. Deloncle and V. Tatischeff for their suggestions and critical reading of the manuscript.VII Appendix
VII.1 Compound-nucleus resonances
In equation 2, the efficiency tensor of the emitted proton in the CN resonance decay for a counter with axial symmetry, can be derived from equations (2.52) and (2.78) in Ferguson Ferguson (1965). In the present calculations, the scattering plane is taken as the y - z plane of the laboratory system, thus = 0, and ideal counters for all particles are supposed. For a beam of unpolarized protons:
| (9) |
where results from the vector sum of proton spin and orbital angular momentum .
The efficiency tensor for the -ray counter , with = = for the transition and no polarization and parity mixture (eqs. (2.57) and (2.78) in Ferguson), is:
| (10) |
The term with angular couplings is:
| (11) |
where means the Wigner 9-j coefficient with indices written line by line.
The probability for inelastic scattering with scattering angle can be obtained from equation 2 with the efficiency tensor of unobserved ray and excited nucleus
| (12) |
and integration over and :
| (13) |
with of equation 9, and the sum running over , , and . The differential cross section is proportional to .
VII.2 Direct reactions
In equation 7, Satchler’s gamma-radiation parameters (eqs. (10.153) (10.154) in Satchler (1983)) are, with = 1; , = even and = 0:
| (14) |
When using the nuclear reaction code Ecis97 Raynal (1994) for OM calculations, the scattering amplitudes have to be constructed from other output, like the scattering matrix elements (see equation 16). As this construction happened to be among the more laborious tasks in the calculations, an outline is therefore given here. In the spin-orbit coupling scheme with proton spin , and for incoming (outgoing) channel:
| (15) |
they are given by eq. (5.45) in Satchler, in the scattering plane ( = 0) with the incoming beam in direction of the z-axis ( = 0) and = 0:
| (16) |
where are the spin projections of orbital angular momenta , target ground state spin and excited state spin , proton spin and coupled spins , respectively. is the phase (in Ecis97 output: phase with Coulomb) of the scattering matrix . The sum runs over , , and ; here = for = 0.
References
- Chupp et al. (1973) E. L. Chupp, D. J. Forrest, P. R. Higbie, A. N. Suri, C. Tsai, and P. P. Dunphy, Nature 241, 333 (1973).
- Murphy et al. (1997) R. J. Murphy, G. H. Share, J. E. Grove, W. N. Johnson, R. L. Kinzer, J. D. Kurfess, M. S. Strickman, and G. V. Jung, Astrophysical Journal 490, 883 (1997).
- Verstrand et al. (1999) W. T. Verstrand, G. H. Share, R. J. Murphy, D. J. Forrest, E. Rieger, E. L. Chupp, and G. Kanbach, Astrophysical Journal Supplement Series 120, 409 (1999).
- Smith et al. (2003) D. M. Smith, G. H. Share, R. J. Murphy, R. A. Schwartz, A. Y. Shih, and R. P. Lin, Astrophysical Journal 595, L81 (2003).
- Gros et al. (2004) M. Gros, V. Tatischeff, J. Kiener, B. Cordier, C. Chapuis, G. Weidenspointner, G. Vedrenne, A. von Kienlin, R. Diehl, A. Bykov, et al., in Proceedings of the 5th INTEGRAL Workshop ”The INTEGRAL Universe” (ESA Publications Division, 2004), vol. SP-552, p. 669.
- Ackermann et al. (2014) M. Ackermann, M. Ajello, A. Albert, A. Allafort, L. Baldini, et al., Astrophysical Journal 787, 15 (2014).
- Benhabiles-Mezhoud et al. (2013) H. Benhabiles-Mezhoud, J. Kiener, V. Tatischeff, and A. W. Strong, Astrophysical Journal 763, 98 (2013).
- Tatischeff et al. (2016) V. Tatischeff, M. Tavani, P. von Ballmoos, L. Hanlon, U. Oberlack, et al., in Space Telscopes and Instrumentation 2016: Ultraviolet to Gamma Ray (SPIE, 2016), vol. 9905, p. 99052N.
- Ramaty and Crannell (1976) R. Ramaty and J. C. Crannell, Astrophysical Journal 203, 766 (1976).
- Share et al. (2002) G. H. Share, R. J. Murphy, J. Kiener, and N. de Séréville, Astrophysical Journal 573, 464 (2002).
- Kiener et al. (2006) J. Kiener, M. Gros, V. Tatischeff, and G. Weidenspointner, Astronomy & Astrophysics 445, 725 (2006).
- Harris et al. (2007) M. J. Harris, V. Tatischeff, J. Kiener, M. Gros, and G. Weidenspointner, Astronomy & Astrophysics 461, 723 (2007).
- Durante and Paganetti (2016) M. Durante and H. Paganetti, Rep. Prog. Phys. 79, 096702 (2016).
- Verburg et al. (2012) J. M. Verburg, H. A. Shih, and J. Seco, Phys. Med. Biol. 57, 5459 (2012).
- Verburg et al. (2014) J. M. Verburg, , and J. Seco, Phys. Med. Biol. 59, 7089 (2014).
- Jeyasugiththan and Peterson (2015) J. Jeyasugiththan and S. W. Peterson, Phys. Med. Biol. 60, 7617 (2015).
- Ramaty et al. (1979) R. Ramaty, B. Kozlovsky, and R. E. Lingenfelter, Astrophysical Journal Supplement Series 40, 487 (1979).
- Murphy et al. (1988) R. J. Murphy, B. Kozlovsky, and R. Ramaty, Astrophysical Journal 331, 1029 (1988).
- Werntz et al. (1990) C. Werntz, F. L. Lang, and Y. E. Kim, Astrophysical Journal Supplement Series 73, 349 (1990).
- Kiener et al. (2001) J. Kiener, N. de Séréville, and V. Tatischeff, Physical Review C 64, 025803 (2001).
- Belhout et al. (2007) A. Belhout, J. Kiener, A. Coc, J. Duprat, C. Engrand, C. Fitoussi, M. Gounelle, A. Lefebvre-Schuhl, N. de Séréville, V. Tatischeff, et al., Physical Review C 76, 034607 (2007).
- Kiener et al. (1998) J. Kiener, M. Berheide, N. L. Achouri, A. Boughrara, A. Coc, A. Lefebvre, F. de Oliveira Santos, and C. Vieu, Physical Review C 58, 2174 (1998).
- Meigooni et al. (1985) A. S. Meigooni, R. W. Finlay, J. S. Peter, and J. P. Delaroche, Nuclear Physics A 445, 304 (1985).
- Satchler (1983) G. R. Satchler, Direct Nuclear Reactions (Clarendon, Oxford, 1983).
- Raynal (1994) J. Raynal, Note CEA N-272 (1994).
- Ferguson (1965) A. J. Ferguson, Angular Correlation Methods in Gamma-Ray Spectroscopy (North-Holland, Amsterdam, 1965).
- (27) P. Dyer, D. Bodansky, A. G. Seamster, E. B. Norman, and D. R. Maxson, Physical Review C 23, 1865 (1981); Angular distribution data from the experiment have been provided by R. Ramaty, private communication.
- Kolata et al. (1967) J. J. Kolata, R. Auble, and A. Galonsky, Physical Review 162, 957 (1967).
- Lang et al. (1987) F. L. Lang, C. W. Werntz, C. J. Crannell, J. I. Trombka, and C. C. Chang, Physical Review C 35, 1214 (1987).
- Dyer et al. (1981) P. Dyer, D. Bodansky, A. G. Seamster, E. B. Norman, and D. R. Maxson, Physical Review C 23, 1865 (1981).
- (31) NNDC, URL: http:www.nndc.bnl.gov.
- (32) J. F. Ziegler, The stopping and range of ions in matter, URL: http://www.srim.org.
- Perey and Perey (1976) C. M. Perey and F. G. Perey, Atomic Data and Nuclear Data Tables 17, 1 (1976).
- (34) S. P. Weppner, private communication.
- Weppner et al. (2009) S. P. Weppner, R. B. Penney, G. W. Diffendale, and G. Vittorini, Physical Review C 80, 034608 (2009).
- Koning et al. (2008) A. J. Koning, S. Hilaire, and M. C. Duijvestijn, in TALYS-1.0, Proceedings of the Int. Conf. on Nuclear Data for Science and Technology, April 22-27, 2007, Nice, France (EDP Sciences, 2008), p. 211.
- Hua et al. (1989) X.-M. Hua, R. Ramaty, and R. E. Lingenfelter, Astrophysical Journal 341, 516 (1989).
- Murphy et al. (1990) R. J. Murphy, X.-M. Hua, R. Ramaty, and R. E. Lingenfelter, Astrophysical Journal 351, 299 (1990).
- Murphy et al. (1991) R. J. Murphy, R. Ramaty, B. Kozlovsky, and D. V. Reames, Astrophysical Journal 371, 793 (1991).
- Emsley (1983) J. Emsley, Nature’s Building Blocks (Oxford University Press, New York, 1983).
- Murphy et al. (2009) R. J. Murphy, B. Kozlovsky, J. Kiener, and G. H. Share, Astrophysical Journal Supplement Series 183, 142 (2009).
- Lesko et al. (1988) K. T. Lesko, E. B. Norman, R.-M. Larimer, S. Kuhn, D. M. Meekhof, S. G. Crane, and H. G. Bussell, Physical Review C 37, 1808 (1988).
- (43) W. Yahia-Cherif, S. Ouichaoui, J. Kiener, V. Tatischeff, E. Lawrie, et al., arXiv:1507:02656.
- Pearson et al. (1972) C. A. Pearson, J. M. Covan, D. Zissermann, T. G. Miller, F. P. Gibson, et al., Nuclear Physics A 191, 1 (1972).
- Guratzsch et al. (1969) H. Guratzsch, G. Hoffmann, H. M’́uller, and G. Stiller, Nuclear Physics A 129, 405 (1969).
| (C) | (L) | 13N state | remarks | ||||||
|---|---|---|---|---|---|---|---|---|---|
| 8.6 | 0.16 | 9.8 | 0.35 | 1.0 | 23 | 9.5 | (), 10.25(15) | ||
| 9.0 | 0.15 | 10.2 | 0.35 | 1.0 | 9.2 | 6.1 | (), 10.25(15) | ||
| 9.2 | 0.15 | 10.4 | 0.66 | 1.0 | 5.3 | 7.0 | (), 10.25(15) | no line shapes | |
| 9.2 | 0.15 | 10.4 | 0.78 | 0.7 | 5.1 | 7.0 | , 10.360 | no line shapes | |
| 9.6 | 0.15 | 10.7 | 0.53 | 0.5 | 3.4 | 3.8 | , 10.833(9) | ||
| 10.0 | 0.14 | 11.1 | 0.49 | 0.3 | 3.0 | 3.5 | , 11.530(12) | ||
| 10.6 | 0.14 | 11.7 | 0.76 | 0.2 | 2.5 | 3.1 | , 11.740(40) | ||
| 11.0 | 0.13 | 12.0 | 1.00 | 0.8 | 7.0 | 6.4 | , 12.130(50) | ||
| 11.4 | 0.13 | 12.4 | 0.95 | 0.8 | 6.7 | 7.9 | , 12.130(50) | ||
| 12.0 | 0.12 | 13.0 | 0.34 | 0.4 | 10.4 | 10.2 | ( ), 12.937(24) | ||
| 12.6 | 0.02 | 13.6 | 0.08 | 0.0 | 13.6 | 10.6 | , 13.50(20) | ||
| 13.0 | 0.02 | 13.9 | 0.12 | 0.2 | 17.8 | 14.2 | , 14.050(20) | ||
| 13.6 | 0.02 | 14.5 | 0.21 | 0.4 | 13.4 | 10.2 | , 13.50(20) | ||
| 14.0 | 0.02 | 14.8 | 0.33 | 1.0 | 14.7 | 13.3 | (), 15.30(20) | ||
| 14.4 | 0.11 | 15.2 | 0.17 | 0.0 | 14.7 | 11.2 | (), 15.30(20) | ||
| 15.2 | 0.10 | 15.9 | 0.00 | 0.5 | 13.8 | 8.9 | , 15.990(30) | 15% of 16O(p,p) | |
| 16.25 | 0.01 | 16.9 | 0.13 | 1.0 | 13.8 | 7.6 | |||
| 17.25 | 0.01 | 17.9 | 0.20 | 1.0 | 8.2 | 5.1 | , 18.150(30) | ||
| 18.25 | 0.01 | 18.8 | 0.10 | 1.0 | 10.9 | 6.8 | , 19.830 | ||
| 19.75 | 0.01 | 20.2 | 0.10 | 1.0 | 11.8 | 5.8 | , 19.830 |
| (C) | (L) | 13N state | remarks | ||||||
|---|---|---|---|---|---|---|---|---|---|
| 5.44 | 0.04 | 6.9 | 0.76 | 1.0 | 0.3 | 0.09 | , 6.886(8) | ||
| 5.95 | 0.04 | 7.4 | 0.36 | 0.9 | 0.7 | 0.37 | , 7.376(9) | pot. PEA72 Pearson et al. (1972) | |
| 6.5 | 0.04 | 7.9 | 0.73 | 0.4 | 0.4 | 0.002 | , 7.900 | ||
| 7.0 | 0.04 | 8.4 | 0.57 | 0.2 | 0.4 | 0.01 | , 7.900 | pot. GUR69 Guratzsch et al. (1969) | |
| 7.6 | 0.04 | 8.9 | 0.61 | 0.5 | 3.5 | 0.46 | , 8.918(11) | pot. PEA72 Pearson et al. (1972) | |
| 8.0 | 0.04 | 9.3 | 0.44 | 0.6 | 0.3 | 0.18 | , 7.900 | ||
| 8.23 | 0.04 | 9.5 | 0.57 | 0.6 | 2.7 | 0.13 | , 7.900 | pot. PEA72 Pearson et al. (1972) | |
| 8.4 | 0.04 | 9.7 | 0.45 | 0.7 | 1.3 | 0.02 | , 7.900 | ||
| 20.0 | 0.02 | 20.4 | 0.15 | 0.4 | 3.0 | 0.13 | , 20.200 | ||
| 22.5 | 0.02 | 22.7 | 0.15 | 1.0 | 2.4 | 0.01 | , 22.4(5) | ||
| 25.0 | 0.02 | 25.0 | 0.15 | 1.0 | 3.1 | 1.5 |