Shocked water in the Cep E protostellar outflow
Abstract
Context. Previous far-infrared observations at low-angular resolution have reported the presence of water associated with low-velocity outflow shocks and protostellar envelopes.
Aims. We want to elucidate the origin of water emission in protostellar systems.
Methods. The outflow driven by the intermediate-mass class 0 protostar Cep E is among the most luminous outflows detected so far. Using the IRAM 30m telescope, we searched for and detected the p-H2O line emission at in the Cep E star-forming core. The emission arises from high-velocity gas close to the protostar, which is unresolved in the main beam of the telescope. Complementary observations at resolution with the Plateau de Bure interferometer helped establish the origin of the emission detected and the physical conditions in the emitting gas. The water line profile and its spatial distribution are very similar to those of SiO. We find that the H2O emission arises from warm (), dense () gas, and its abundance is enhanced by one to two orders of magnitude with respect to the protostellar envelope.
Results. We detect water emission in strong shocks from the high-velocity jet at 1000 AU from the protostar. Despite the large beam size of the telescope, such emission should be detectable with Herschel.
Key Words.:
Stars: formation - ISM: individual (Cep E) - ISM: jets and outflows - ISM: molecules1 Introduction
Water is a key molecule not only for oxygen chemistry in the interstellar gas, but also in the dynamical evolution of star-forming regions, because it is one of the main gas coolants (Kaufman & Neufeld, 1996; Bergin et al. 1998). Whereas its abundance is very low in dark clouds, prestellar cores, and starless regions (from less than to a few ; Bergin & Snell, 2002; Moneti et al. 2001), it can be greatly enhanced in star-forming regions, through the sputtering of frozen water from grain mantles and through high-temperature, sensitive reactions in the gas phase (Elitzur & de Jong, 1978; Ceccarelli et al. 1996; Kaufmann & Neufeld 1996). It has been proposed that such processes are driven by the heating of the nascent stars (hot core/corino region) or by shocks either in the accretion region in the inner protostellar core or in the outflow carrying away the angular momentum of the envelope. Previous observations of water lines obtained with the Infrared Space Observatory have substantially confirmed these theoretical expectations (see e.g. Giannini et al. 2001; Ceccarelli et al. 2000; van Dishoeck 2004 for a review). However, many details are still missing and the relative efficiency of these mechanisms is not known, so that the origin of the water emission in protostellar regions remains a puzzle to be solved. One obstacle is indeed the relatively low spatial resolution of these observations.
Most of the H2O lines cannot be observed from ground because of strong atmospheric absorption. The para-H2O line at 183.3 GHz is an exception since it can be enhanced by the masing effect even in regions of moderate excitations. Using the IRAM 30m telescope, Cernicharo et al. (1990,1994) detected large-scale p-H2O line emission in giant molecular clouds and star-forming regions and they showed that this line can be used to investigate the spatial distribution of H2O in protostellar environments at an angular resolution comparable to the size of the protostellar cores ( at the IRAM 30m telescope). Observing the low-mass protostellar outflows HH 7-11 and L1448, Cernicharo et al. (1996) detected water line emission arising from shocks associated with the Herbig-Haro objects in the outflows.
In this Letter, we report on observations of the p-H2O line in the star-forming core Cep E with the IRAM 30m telescope111Based on observations carried out with the IRAM 30m Telescope. IRAM is supported by INSU/CNRS (France), MPG (Germany), and IGN (Spain). Located at 730pc, it is a relatively nearby intermediate-mass Class 0 source of and a mass of , intensively studied at mm and IR wavelengths (Moro-Martin et al. 2001; Noriega-Crespo et al. 2004; Lefloch et al. 1996, hereafter L96). The protostar drives an exceptionally powerful outflow, whose southern lobe is terminated by the Herbig-Haro object HH 377. Far-infrared observations at low spectral and angular resolution with ISO have revealed large amounts of water, which Giannini et al. (2001) interpret as arising from low-velocity shocks, whose far-infrared luminosity amounts to .
Observations of the millimeter lines of SiO observations reveal the presence of strong shocks along the outflow (L96). Because it is usually undetected in the cold, quiescent molecular gas, SiO is a particularly good tracer of shocks that are strong enough to release refractory elements from grain cores. Recent Herschel observations suggest that SiO is also a good tracer of the water-emitting shock regions (Lefloch et al. 2010; Nisini et al. 2010). We present observations of the high-excitation SiO line towards the protostar.
2 Observations

2.1 Water observation
We observed the line of para-H2O at 183.3 GHz at the IRAM 30m telescope in January 2009, near the transit of Cep E between and of elevation. Both receivers at 2mm were used simultaneously. Observations were carried out in wobbler switching mode with a throw of . Filterbanks with 1MHz spectral resolution and an autocorrelator providing a spectral resolution of 1.25 MHz (2 km/s) were used as spectrometers. Weather conditions were very good and stable, with an atmospheric optical depth along the line of sight. Calibration was carefully monitored every 4 minutes between two integration scans on Cep E. Water vapor and system temperatures were found to remain stable, in the range . Any fluctuation of the sky emissivity between the on and off positions would result in a poor spectroscopic baseline and detection of the mesospheric water line, which is not the case in the present observations. Pointing was checked against nearby quasars every hour and has an accuracy of . At the frequency of the H2O line, the main-beam efficiency of the telescope is 0.63 and the half-power beamwidth is . We did a small oversampled map at sampling of the southern lobe of the outflow, centered on the nominal position of the protostar (J2000). The typical rms is 100mK per velocity interval of .
2.2 SiO observations
The SiO transition at 347.33006 GHz was observed towards the protostar at the JCMT in August 2005. The weather conditions were good with an average system temperature . Observations were carried out with a nutating secondary, adopting a throw of . The DBS was used as spectrometer, providing a spectral resolution of 625kHz. The resolution was degraded to 3.75 MHz, corresponding to a final velocity resolution of about . At the frequency of the SiO line, the main-beam efficiency of the telescope is about 0.60 and the half-power beamwidth is , very similar to the telescope parameters of the p-H2O observations. Complementary interferometric observations at resolution with the Plateau de Bure in the SiO transition provide us with the spatial distribution of the emission and its excitation conditions. These observations will be presented and discussed in detail in a forthcoming paper (Lefloch et al. in prep.).
3 Results and discussion
3.1 Water emission in Cep E
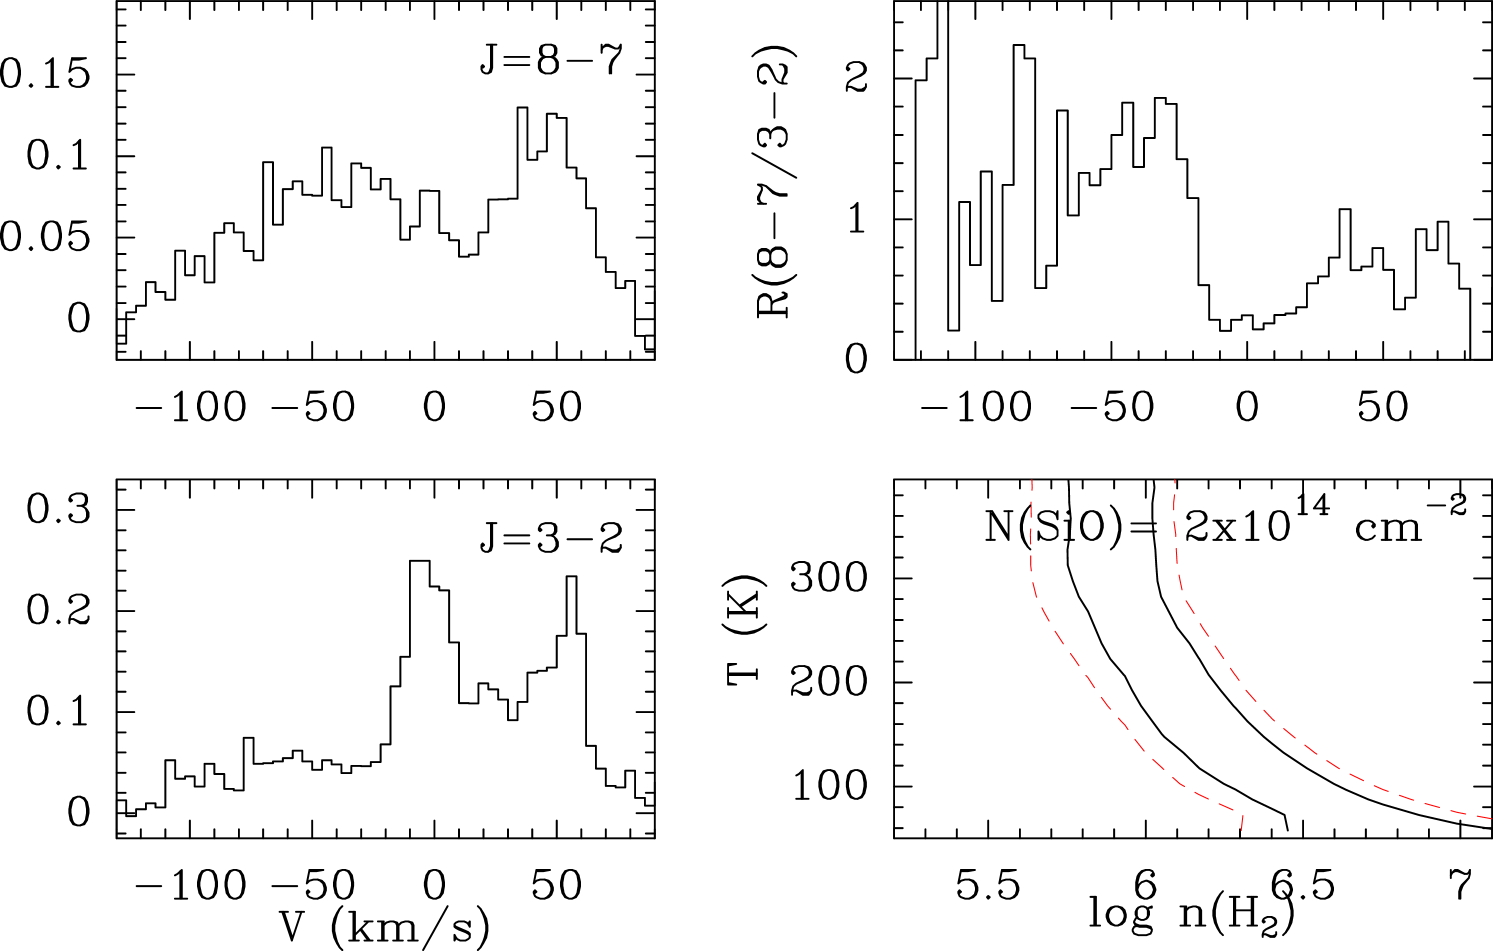
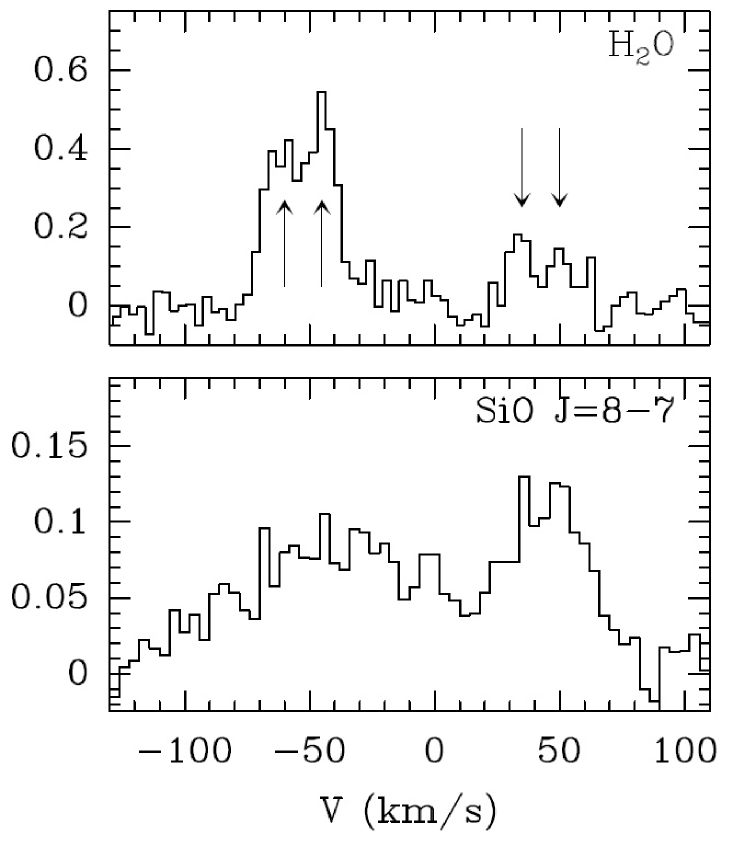
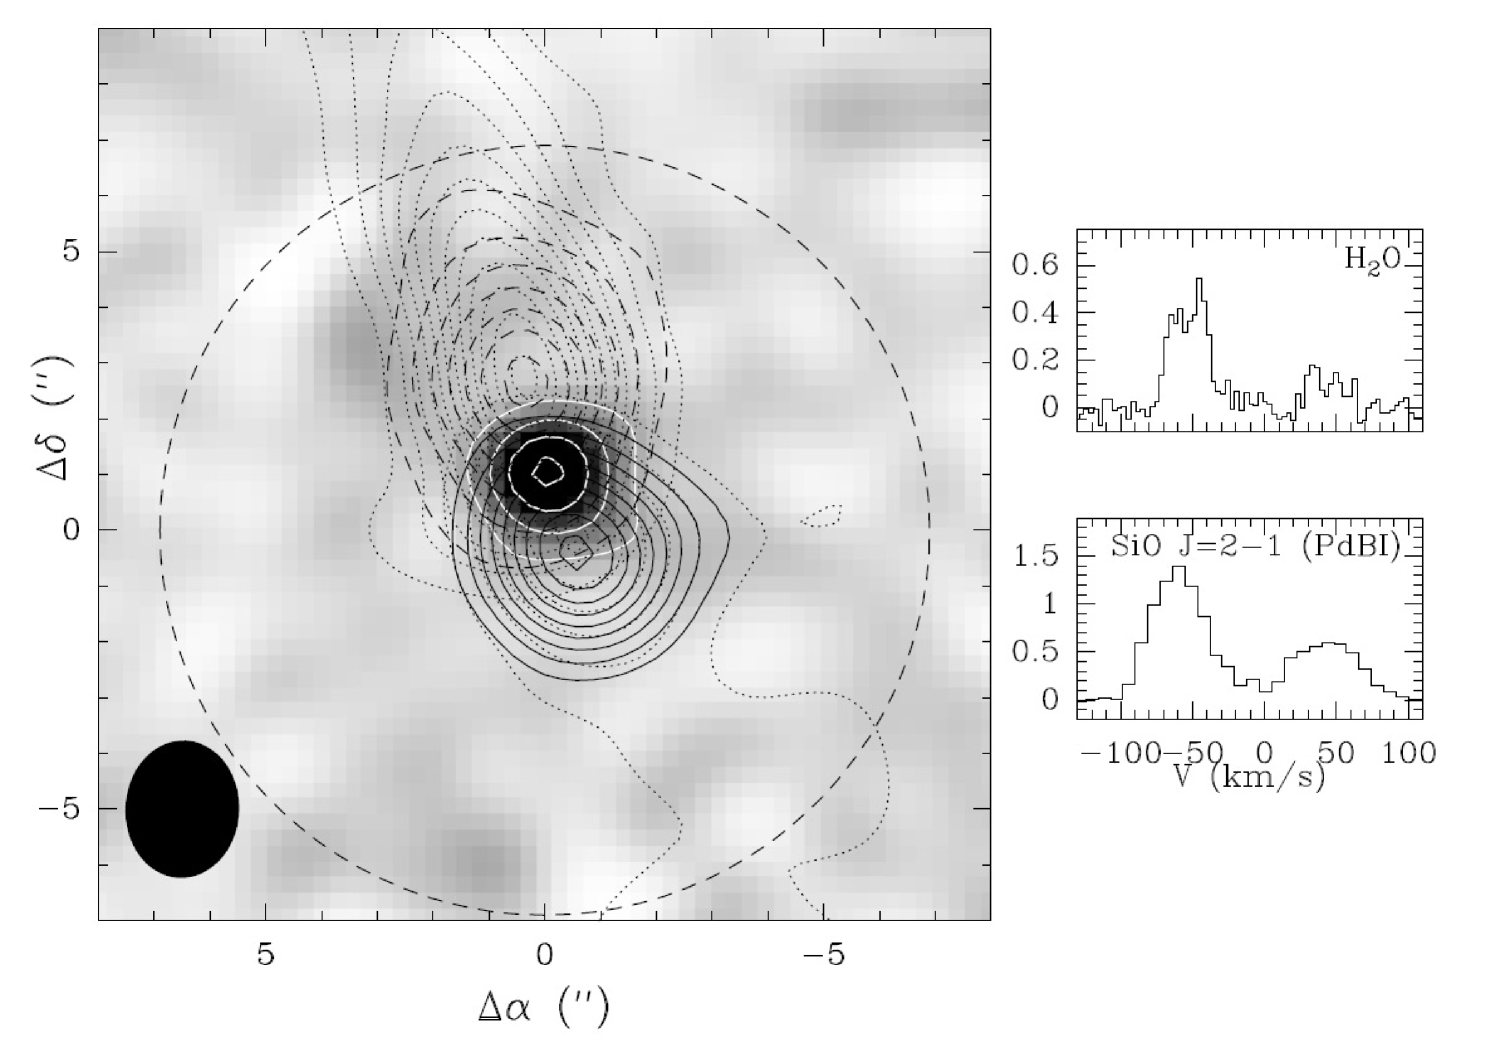
The map of the p-H2O emission in Cep E is displayed in the left panel of Fig. 1. Emission is detected only towards the protostellar core, in a region unresolved by the main beam of the IRAM 30m telescope. In particular, we do not detect any H2O emission towards HH77, the southern bowshock at offset position (, ), associated with bright emission in the lines of SiO and H2 (L96). To improve the signal-to-noise ratio of the data, we averaged the emission of the water line over the inner core, in the range [] []. The averaged spectrum is displayed in the right panel of Fig. 1, and the final rms noise is 30mK () per interval of .
Two bright components () with broad linewidths () are detected at about and in the direction of the protostar. Two other, weaker, H2O components are detected at approximately symmetric (redshifted) velocities and . We do not detect any emission at the velocity of the protostellar envelope (; L96), hence excluding any contribution from the hot corino to the water emission. The presence of both blue- and redshifted components in the water line spectrum indicates that the emission arises from the central protostellar region. This is because there is barely any overlap in the plane of the sky between the blue and redshifted wings of the Cep E outflow, except in the central protostellar region as a consequence of the limited angular resolution of the observations (see Figs. 1-2; also L96).
The spectrum of the SiO emission in the direction of the protostar is displayed in Fig. 1 and looks very similar to the p-H2O line spectrum. Resemblance between both emissions is even more striking when comparing the water spectrum with the emission observed with the PdBI (Fig. 2). This suggests that the emission of both tracers arises from the same region. Observations of the transition with the PdBI of the central protostellar regions (Lefloch et al. in prep) show that the SiO emission arises from two compact clumps, in the blue- and redshifted gas, respectively, located at from the protostar. They have a typical size of (), and a transverse size of (Fig. 2). Their similar physical properties (size, velocity, distance) suggest they are related to an episodic ejection phenomenon. In what follows, we assume that both the H2O and the SiO emissions have the same size.
3.2 Physical conditions
The gas kinetic temperature in the redshifted, high-velocity jet was previously determined by Hatchell et al. (1999) from JCMT observations of the CO and lines. Unfortunately, their analysis is biased by a highly overestimated value of the main-beam efficiency of the observations, poorly known at that time, leading to an underestimate of (). Based on their observations and adopting a standard value consistent with the subsequent determinations from point-like calibrators222http://www.jach.hawaii.edu/JCMT/spectralline/Standards/, , we obtain the jet kinetic temperature and column density, and , respectively (see also L96). Adopting a standard CO abundance in the gas, we then derive the source-averaged gas column-density . We adopt these values of and N(CO) for both water-emitting clumps at blue- and redshifted velocities.
The gas density and column density in the water-emitting clumps were derived from modeling the H2O and SiO line brightness temperatures in the large-velocity gradient (LVG) approach. We adopted the collisional coefficients of Faure et al. (2007) and Dayou & Balança (2006), respectively. The gas density can be constrained reasonably well from the ratio of the SiO to brightness temperatures. This ratio was computed using the SiO observations in the Cep E protostellar core obtained by L96 (see also Fig. 3). We note that the source is unresolved by the single-dish JCMT and IRAM 30m observations; therefore, we approximated the ratio of the line brightness temperatures by the ratio of the main-beam brightness temperatures corrected for the difference of main-beam solid angles . A description of the radiative transfer code and the procedure applied to deal with the masing effect is presented in Cernicharo et al. (1994) and González-Alfonso & Cernicharo (1993).
The top right panel of Fig. 3 displays the variations of . The ratio varies little in the low-velocity gas and is about 0.2. It increases as a function of velocity and reaches values up to 0.7 and 1.5 in the redshifted and blueshifted gas, respectively. The variations of as a function of and were computed for a typical column density and a linewidth , and they are displayed in Fig. 3. With the constraint , it comes out that must be about in order to account for the line intensity ratio in the redshifted gas . The density in the blueshifted gas is slightly higher . These calculations show that the ratio depends weakly on above . For these values of and the kinetic temperature estimated above, we estimate the source-averaged column density necessary to account for the line intensity for gas at in the blue- and redshifted components. Under such physical conditions both SiO transitions are optically thin, so that R(8-7/3-2) depends weakly on the adopted value of the gas column density. From comparison with N(CO) and assuming a standard abundance , we obtain the relative SiO abundance in the shock : [SiO]/[, similar to the abundances measured in other Class 0 protostellar outflows (Lefloch et al. 1998).
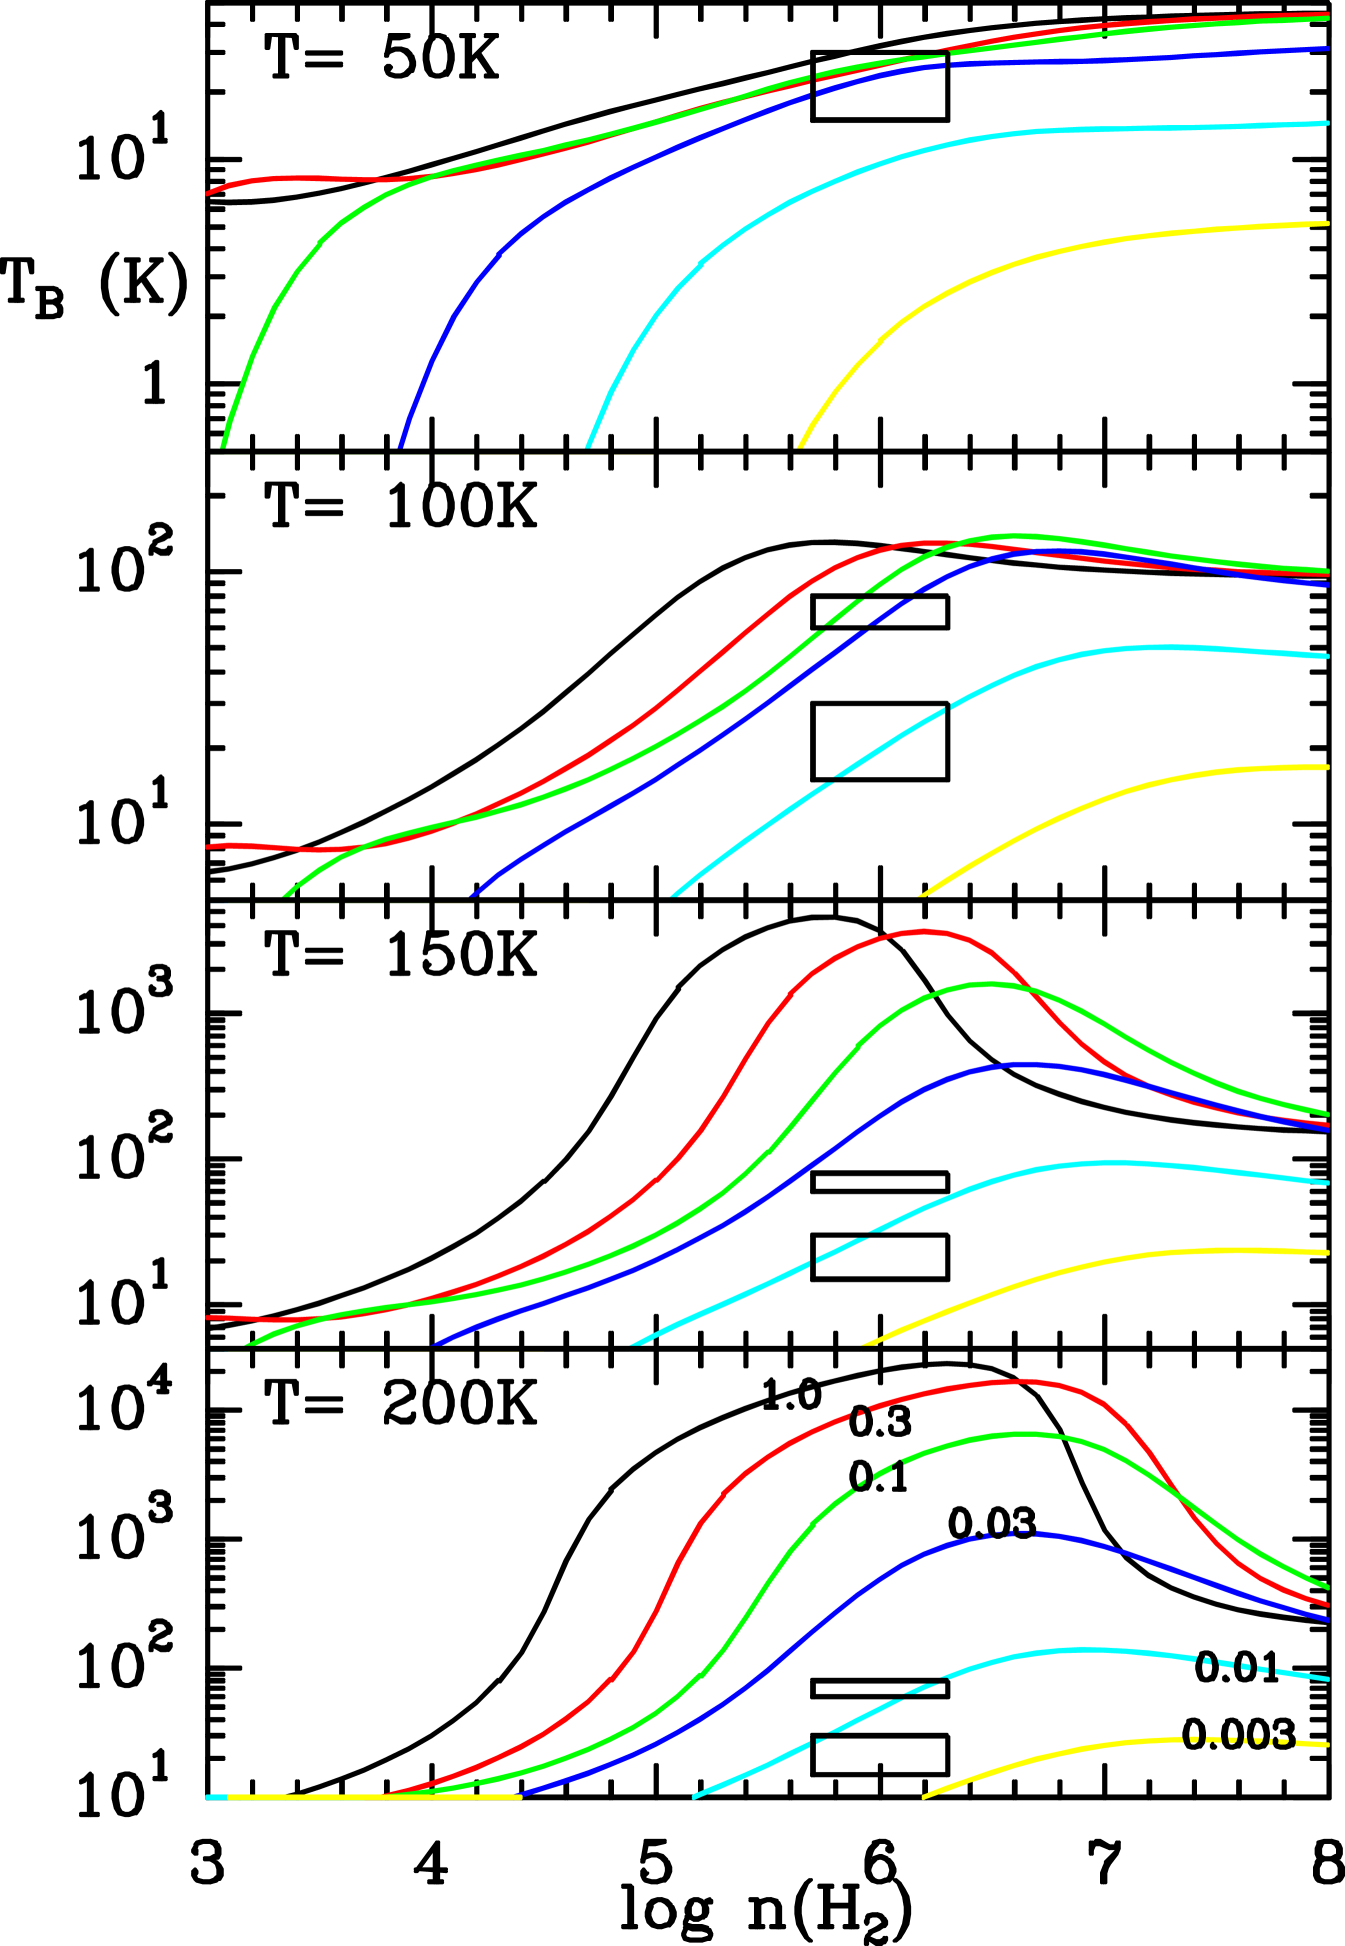
The para-water (source-averaged) column density was determined from modeling the line brightness temperature . The latter was derived from the main-beam brightness temperature , where the filling factor was obtained assuming that the H2O and SiO emitting regions have similar sizes, in agreement with Sect. 3.1. We find and in the blueshifted and redshifted gas, respectively. The brightness temperature of the p-H2O line was computed for a wide range of physical conditions, adopting a typical linewidth : between 50 and , in the range and in the range to . The results of the calculations are presented in Fig. 4.
It comes out that the kinetic temperature has to be higher than to account for brightness temperatures of . Our calculations indicate a p-H2O column density in the range for . Assuming an ortho-to-para ratio of 3, we derive , and using the H2 column density derived in the high-velocity clumps, we obtain the water abundance . In this range of physical conditions, the line optical depth is small and shows evidence for the weak masing amplification of p-H2O line. Suprathermal excitation of the line would require much higher H2O column densities. This is possible if the emission arises from a small region of subarsec size (see e.g. Cernicharo et al. 1994) and is very sharp. The line would then look weaker as a result of the dilution in the channels of the spectrometer.
Moro-Martin et al. (2001) analyzed the far-infrared emission lines of CO and H2O in Cep E, as observed with ISO. Like Giannini et al. (2001), they found that the line emission can be accounted for by an extended component of low-density gas () at . They show that the CO and H2O lines could be reproduced equally well by ”warm” gas at a much lower temperature () and higher density (). The physical conditions we derive for the p-H2O emitting region are actually in rather good agreement with this ”warm” solution and inconsistent with the low-density ”hot” solution.
3.3 Shocked water in Cep E
Crimier et al. (2010) determined the physical conditions in the protostellar envelope of Cep E envelope and found and , respectively, at the location of the water-emitting clumps, i.e. 1000 AU () from the protostar. No p-H2O emission is detected from the envelope at the level (). From Fig. 4, we conclude that in the inner protostellar envelope, and the water abundance is enhanced by 1 to 2 orders of magnitude in the high-velocity clumps. The authors estimate a radius of for the hot corino region, and the density is predicted very high ; again, no masing effect is to be expected, in agreement with our observations.
The water-emitting clumps are located along the high-velocity jet, which suggests that they are closely related with the jet (Fig. 2). One possibility is that these clumps are tracing the jet/envelope interaction. However, the density of the protostellar envelope, as estimated by Crimier et al. (2010) at the location of the water emitting-clumps (), is about one order of magnitude higher than the density measured in the shocked gas (), in apparent contradiction with this hypothesis. The structure of the envelope could be actually more complex than the simple power-law distribution derived by Crimier et al. (2010), as proposed that multiple protostars are embedded inside the core (Ladd & Hodapp, 1997). Direct observational evidence for several condensations is still missing, however. Alternatively, we speculate that the water emission could arise from internal shocks in the entrained material of the flow. Interferometric observations at subarcsec scale in the inner core ( AU) are needed to determine the gas density and velocity field in order to determine the location and the origin of the water-emitting shocks, as well as their relation with the jet.
Simple calculations in the LVG approximation predict that the H2O emission from the high-velocity clumps should be easily detected in several ortho- and para-H2O transitions with the high-resolution spectrometer HIFI onboard Herschel. Such observations will allow us to better constrain the shock physical conditions (see e.g. Flower & Pineau des Forets, 2010).
Acknowledgements.
We thank an anonymous referee and the Editor for comments that helped to improve the manuscript a lot. This project was supported by the research grant SAB2009-0011 of the Spanish Ministry of Education.References
- (1) Bergin, E.A., Neufeld, D.A., Melnick, G.J., 1998, ApJ, 499, 777
- (2) Bergin, E.A., Snell, R.L., 2002, ApJ, 581, L105
- (3) Ceccarelli C., Hollenbach D., Tielenas A.G.G.M., 1996, ApJ, 471, 400
- (4) Ceccarelli C., Castets A., Caux E., et al., 2000, ApJ, 355, 1129
- (5) Cernicharo J., Thum C., Hein H., et al., A&A, 1990, 231, L15
- (6) Cernicharo J., Gonzalez-Alfonso, E., Alcolea, J., 1994, 432, L59
- (7) Cernicharo J., Bachiller R., Gonzalez-Alfonso, E., 1996, A&A, 305, L5
- (8) Crimier N., Ceccarelli C., Alonso-Albi T., et al., 2010, A&A, 516, 102
- (9) Dayou, F., Balança, C., 2006, A&A, 459, 297
- (10) Eisloeffel, J., Smith, M.D., Davis, C.J., 1996, AJ, 112, 2086
- (11) Elitzur, M., de Jong, T., 1978, A&A, 67, 323
- (12) Faure, A., Crimier, N., Ceccarelli, C., et al., 2007, A&A, 472, 1029
- (13) Flower, D.R., Pineau des Forets, G., 2010, MNRAS, 406, 1745
- (14) Giannini, T., Nisini B., Lorenzetti D., 2001, ApJ, 555, 40
- (15) Kaufman, M., Neufeld, D., 1996, ApJ, 456, 611
- (16) Ladd, E.F., Hodapp, K.-W., 1997, ApJ, 475, 749
- (17) Lefloch B., Eisloeffel, J., Lazareff B., 1996, A&A, 313, L17 (L96)
- (18) Lefloch B., Castets A., Cernicharo J., et al., 1998, A&A, 504, L109
- (19) Moneti A., Cernicharo J., Pardo J.R., 2001, ApJ, 549, L203
- (20) Moro-Martín, A., Noriega-Crespo, A., Molinari, S., et al., 2001, ApJ, 555, 146
- (21) Nisini B., et al., 2010, A&A, 518, L120
- (22) Noriega-Crespo, A., Moro-Martin, A., Carey, S., 2004, ApJS, 154, 402
- (23) Turner, B.E., Chan, Kin-Wing, Green, S., et al., 1992, ApJ, 399, 114
- (24) van Dishoeck, E.F., 2004, ARA&A, 42, 119