Sparse polynomial chaos expansions of frequency response functions using stochastic frequency transformation
Abstract
Frequency response functions (FRFs) are important for assessing the behavior of stochastic linear dynamic systems. For large systems, their evaluations are time-consuming even for a single simulation. In such cases, uncertainty quantification by crude Monte-Carlo simulation is not feasible. In this paper, we propose the use of sparse adaptive polynomial chaos expansions (PCE) as a surrogate of the full model.
To overcome known limitations of PCE when applied to FRF simulation, we propose a frequency transformation strategy that maximizes the similarity between FRFs prior to the calculation of the PCE surrogate. This strategy results in lower-order PCEs for each frequency. Principal component analysis is then employed to reduce the number of random outputs. The proposed approach is applied to two case studies: a simple 2-DOF system and a 6-DOF system with 16 random inputs. The accuracy assessment of the results indicates that the proposed approach can predict single FRFs accurately. Besides, it is shown that the first two moments of the FRFs obtained by the PCE converge to the reference results faster than with the Monte-Carlo (MC) methods.
Keywords: Polynomial chaos expansions – Frequency response functions – Stochastic frequency-transformation – Uncertainty quantification – Principal component analysis
1 Introduction
Interest towards working with large engineering systems is increasing recently, but long simulation time is one of the main limiting factors. Although the development of the computational power of modern computers has been very fast in recent years, increasing model complexity, more precise description of model properties and more detailed representation of the system geometry still result in considerable execution time and memory usage. Model reduction (Khorsand Vakilzadeh et al., 2012; Rahrovani et al., 2014), efficient simulation (Yaghoubi et al., 2016; Avitabile and O’Callahan, 2009; Liu et al., 2012) and parallel simulation methods (Yaghoubi et al., 2015; Tak and Park, 2013) are different strategies to address this issue.
Consequently, uncertainty propagation in these systems cannot be carried out by classical approaches such as crude Monte-Carlo (MC) simulation. More advanced methods such as stochastic model reduction (Amsallem and Farhat, 2011) or surrogate modeling (Frangos et al., ) are required to replace the computationally expensive model with an approximation that can reproduce the essential features faster. Of interest here are surrogate models. They can be created intrusively or non-intrusively. In intrusive approaches, the equations of the system are modified such that one explicit function relates the stochastic properties of the system responses to the random inputs. The perturbation method (Schuëller and Pradlwarter, 2009) is a classical tool used for this purpose but it is only accurate when the random inputs have small coefficients of variation (COV). An alternative method is intrusive polynomial chaos expansion (Ghanem and Spanos, 2003). It was first introduced for Gaussian input random variables (Wiener, 1938) and then extended to the other types of random variables leading to generalized polynomial chaos (Xiu and Karniadakis, 2002; Soize and Ghanem, 2004).
In non-intrusive approaches, already existing deterministic codes are evaluated at several sample points selected over the parameter space. This selection depends on the methods employed to build the surrogate model, namely regression (Blatman and Sudret, 2010; Berveiller et al., 2006) or projection methods (Gilli et al., 2013; Knio et al., 2001). Kriging (Fricker et al., 2011; Jones et al., 1998) and non-intrusive PCE (Blatman and Sudret, 2011a) or combination thereof (Kersaudy et al., 2015; Schöbi et al., 2015) are examples of the non-intrusive approaches. The major drawback of PCE methods, both intrusive and non-intrusive, is the large number of unknown coefficients in problems with large parameter spaces, which is referred to as the curse of dimensionality (Sudret, 2007). Sparse (Blatman and Sudret, 2008) and adaptive sparse (Blatman and Sudret, 2011b) polynomial chaos expansions have been developed to dramatically reduce the computational cost in this scenario.
To propagate and quantify the uncertainty in a Quantity of Interest (QoI) of a system, its response should be monitored all over the parameter space. This response could be calculated in time, frequency or modal domain. For dynamic systems, the frequency response is important because it provides information over a frequency range with a clear physical interpretation. This is the main reason of the recent focus on frequency response functions (FRF) for uncertainty quantification of dynamic systems and their surrogates (Fricker et al., 2011; Goller et al., 2011; Kundu et al., 2014; Adhikari, 2011; Chatterjee et al., 2016).
Several attempts have been made to find a surrogate model for the FRF by using modal properties or random eigenvalue problems. Pichler et al. (2009) proposed a mode-based meta-model for the frequency response functions of stochastic structural systems. Yu et al. (2011) used Hermite polynomials to solve the random eigenvalue problem and then employed modal assurance criteria (MAC) to detect the phenomenon of modal intermixing. Manan and Cooper (2010) used non-intrusive polynomial expansions to find the modal properties of a system and predict the bounds for stochastic FRFs. They implemented the method on models with one or two parameters and COV 2%.
Very few and recent papers addressed the direct implementation of PCE on the frequency responses of systems. Kundu and Adhikari (2015) proposed to obtain the frequency response of a stochastic system by projecting the response on a reduced subspace of eigenvectors of a set of complex, frequency-adaptive, rational stochastic weighting functions.
Pagnacco et al. (2013) investigated the use of polynomial chaos expansions for modeling multimodal dynamic systems using the intrusive approach by studying a single degree of freedom (DOF) system. They showed that the direct use of the polynomial chaos results in some spurious peaks and proposed to use multi-element PCE to model the stochastic frequency response but, to the knowledge of the authors, they did not publish anything on more complex systems yet. Jacquelin et al. (2015b) studied a 2-DOF system to investigate the possibility of direct implementation of PCE for the moments of the FRFs and they also reported the problem of spurious peaks. They showed that the PCE converges slowly on the resonance parts. They accelerate the convergence of the first two statistical moments by using Aitken’s method and its generalizations (Jacquelin et al., 2015a).
In general, there are two main difficulties to make the PCE surrogate model directly for the FRFs: their non-smooth behavior over the frequency axis due to abrupt changes of the amplitude that occur close to the resonance frequencies. At such frequencies, the amplitudes are driven by damping (Craig and Kurdila, 2006). In Adhikari and Pascual (2016), Adhikari and Pascal investigated the effect of damping in the dynamic response of stochastic systems and explain why making surrogate models in the areas close to the resonance frequencies is very challenging. the frequency shift of the eigenfrequencies due to uncertainties in the parameters. This results in very high-order PCEs even for the FRFs obtained from cases with 1 or 2 DOFs. The main contribution of this work is to propose a method that can solve both problems.
The proposed approach consists of two steps. First, the FRFs are transformed via a stochastic frequency transformation such that their associated eigenfrequencies are aligned in the transformed frequency axis, called scaled frequency. Then, PCE is performed on the scaled frequency axis.
The advantage of this procedure is the fact that after the transformation, the behavior of the FRFs at each scaled frequency is smooth enough to be surrogated with low-order PCEs. However, since PCE is made for each scaled frequency, this approach results in a very large number of random outputs. To solve this issue, an efficient version of principal component analysis is employed. Moreover, the problem of the curse of dimensionality is resolved here by means of adaptive sparse PCEs.
The outline of the paper is as follows. In Section 2, the required equations for deriving the FRFs of a system are presented. In Section 3, all appropriate mathematics for approximating a model by polynomial chaos expansion are presented. The main challenges for building PCEs for FRFs are elaborated and the proposed solutions are presented. In Section 4, the method is applied to two case studies, a simple case and a case with a relatively large number of input parameters.
2 Frequency response function (FRF)
Consider the spatially-discretized governing second-order equation of motion of a structure as
| (1) |
where for an -DOF system with system inputs and system outputs, is the displacement vector, is the external load vector which is governed by a Boolean transformation of stimuli vector ; with . Real positive-definite symmetric matrices are mass, damping and stiffness matrices, respectively. The state-space realization of the equation of motion in Eq. (1) can be written as
| (2) |
where , , , and . is the state vector, and is the system output. and are related to mass, damping and stiffness as follows
| (3) |
The output matrix , which has application dependent elements, linearly maps the states to the output and is the associated direct throughput matrix. The frequency response of the model (2) can be written as
| (4) |
where and . stands for the transpose of the matrix. It should be mentioned that the eigenvalues of are the poles of the system. They are complex and their imaginary parts can be approximated as the frequencies, in rad/s, at which the maximum amplitude occurs.
3 Methodology
This section first, briefly reviews polynomial chaos expansion for real-valued responses. Then, the method of stochastic frequency transformation is explained in conjunction with the proposed method as well as its application to the complex-valued FRF responses.
3.1 Polynomial chaos expansions
Let be a computational model with M-dimensional random inputs = and a scalar output . Further, let us denote the joint probability distribution function (PDF) of the random inputs by defined in the probability space (,, ).
Assume that the system response is a second-order random variable, i.e. and therefore it belongs to the Hilbert space of -square integrable functions of with respect to the inner product:
| (5) |
where is the support of . Further assume that the input variables are independent, i.e. . Then the generalized polynomial chaos representation of reads (Xiu and Karniadakis, 2002):
| (6) |
in which is a set of unknown deterministic coefficients, is a multi-index set which indicates the polynomial degree of in each of the M input variables. s are multivariate orthonormal polynomials with respect to the joint PDF , i.e. :
| (7) |
where is the Kronecker delta. Since the input variables are assumed to be independent, these multivariate polynomials can be constructed by a tensorization of univariate orthonormal polynomials with respect to the marginal PDFs, i.e. . For instance, if the inputs are standard normal or uniform variables, the corresponding univariate polynomials are Hermite or Legendre polynomials, respectively.
In practice, the infinite series in Eq. (6) has to be truncated. Given a maximum polynomial degree , the standard truncation scheme includes all polynomials corresponding to the set where is the total degree of polynomial . The cardinality of the set increases rapidly by increasing the number of parameters M and the order of polynomials . However, it can be controlled with suitable truncation strategies such as -norm hyperbolic truncation (Blatman and Sudret, 2010), that drastically reduce the number of unknowns when is large.
The estimation of the vector of coefficient can be done non-intrusively by projection (Ghanem and Ghiocel, 1998; Ghiocel and Ghanem, 2002) or least square regression methods (Blatman and Sudret, 2010; Berveiller et al., 2006). The latter is based on minimizing the truncation error via least square as follows:
| (8) |
This can be formulated as
| (9) |
Let and be an experimental design with space-filling samples of and the corresponding system responses, respectively. Then, the minimization problem (9) admits a closed form solution
| (10) |
in which is the matrix containing the evaluations of the Hilbertian bases, that is .
The accuracy of PCE will be improved by reducing the effect of over-fitting in least square regression. This can be done by using sparse adaptive regression algorithms proposed in Hastie et al. (2007); Efron et al. (2004). In particular, the Least Angle Regression (LAR) algorithm has been demonstrated to be effective in the context of PCE by Blatman and Sudret (2011a).
3.2 Vector-valued response
In the case of vector-valued response, i.e. , the presented approach may be applied componentwise. This can make the algorithm computationally cumbersome for models with large number of random outputs. To decrease the computational cost, one can extract the main statistical features of the vector random response by principal component analysis (PCA). The concept has been adapted to the context of PCE by Blatman and Sudret (2013).
To perform sample-based PCA, let us rewrite the as the combination of its mean and covariance matrix as follows:
| (11) |
where the ’s are the eigenvectors of the covariance matrix:
| (12) |
and the ’s are vectors such that
| (13) |
One can approximate by the -term truncation:
| (14) |
Since and are the mean and the eigenvectors of the system responses, respectively, they are independent of the realization. Therefore, PC expansion can be applied directly on the auxiliary variables . Besides, acknowledging the fact that the PCA is an invertible transform, the original output can be retrieved directly from Eq. (14) for every new prediction of .
3.2.1 Vector-valued data with extremely large output size
Assume , has an extremely large and . Then is exceptionally large and solving the eigenvalue problem numerically may be unfeasible. To address this issue, the following well-known theorem and the associated corollary is presented.
Theorem 1.
(Singular value decomposition) Let and then there exist two orthogonal matrices, and and two diagonal matrices and such that in which , , and . Furthermore, this decomposition can be written as eigenvalue decomposition as and .
Corollary 1.
The nonzero eigenvalues of and are equal. Furthermore, U and V are related to each other by
| (15) |
The proof of the theorem can be found in any matrix analysis book, e.g. Laub (2004) and the corollary directly follows from the theorem.
3.3 Stochastic frequency transformation
In this section, the method of stochastic frequency transformation is developed to address the challenge of frequency shift at eigenfrequencies due to uncertainty in the parameters. The idea is basically to apply a transformation to the system responses to maximize their similarity before building PCE, as first proposed by Mai and Sudret (2015). Here, the technique is extended and adopted into the frequency domain to obtain PCEs of the FRFs.
To this end, the following algorithm is proposed. First, an experimental design and the corresponding model responses are evaluated. Each system response will be called a trajectory in the remainder of this paper. Let the frequency range of interest be discretized to equidistant frequencies . Then, the required system responses are matrices and . The matrix is obtained by evaluating Eq. (4) at frequencies . The matrix consists of all the resonance and antiresonance frequencies of the system’s input-output relations for one system realization, as follows:
| (16) |
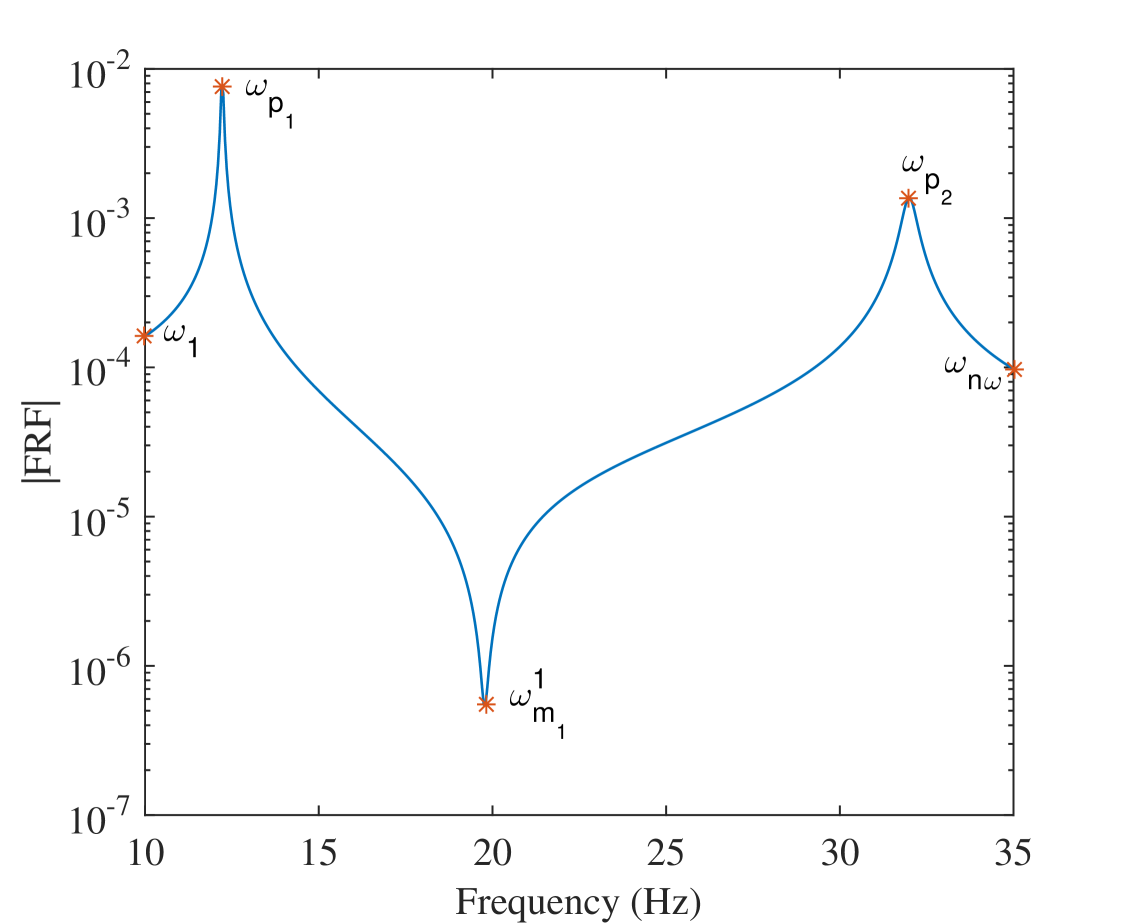
in which is the number of eigenvalues of the system. Furthermore, are the resonant frequencies and are frequencies between each two consecutive resonant frequencies at which the minimum amplitude occurs. Throughout the paper, these important frequencies, shown by red asterisks in Figure 1 for a typical frequency response, will be referred to as selected frequencies. Their number is assumed to be constant across different realizations of the system inputs. includes all the selected frequencies for the input-output relation.
For the next step of the algorithm, let be selected randomly among the sample points in the ED to have its associated trajectory as the reference, i.e. :
Then, the other trajectories are transformed in the frequency axis so as to have the peaks and valleys as close to the corresponding locations in the reference trajectory as possible i.e. :
| (17) |
where , and is the transformed frequency axis called scaled frequency. The transform consists of a continuous piecewise linear transform of the intervals between the identified selected frequencies that align them to the corresponding ones of the reference trajectory as follows,
| (18) |
where
and . This transformation results in the FRFs which are similar to the reference one in the scaled frequency domain:
| (19) |
where the set consists of the discretized scaled frequencies which are non-equidistantly spread over the frequency range of interest.
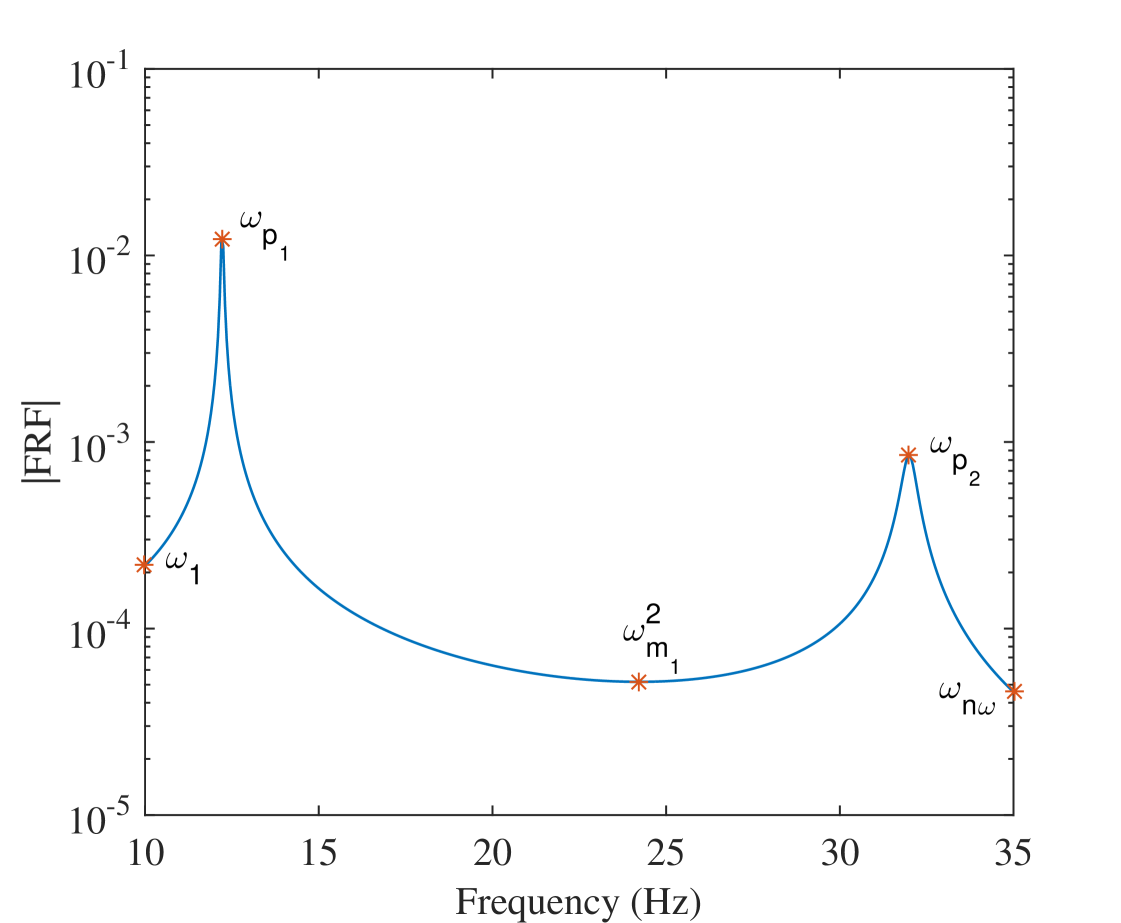
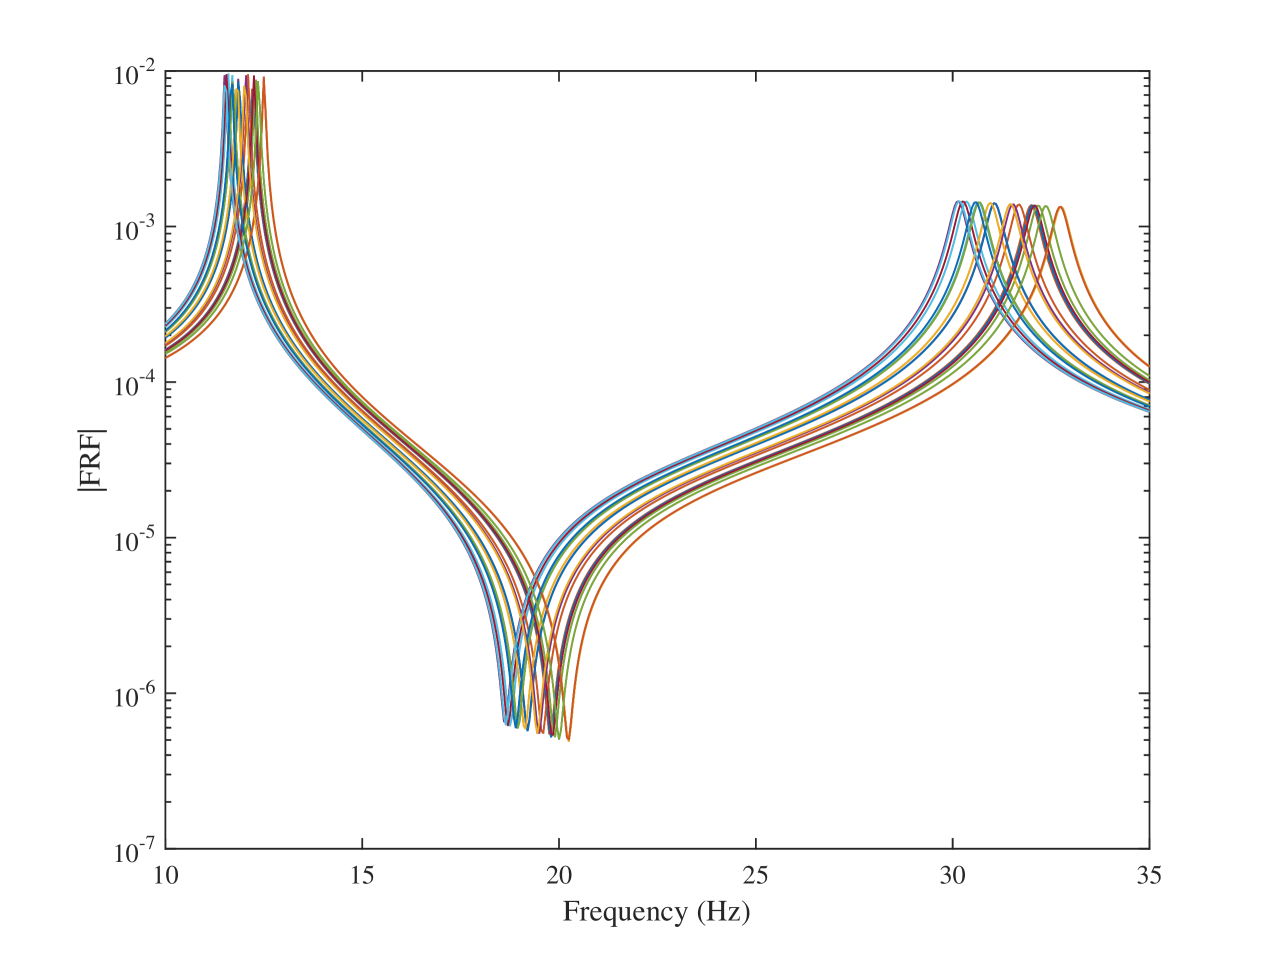
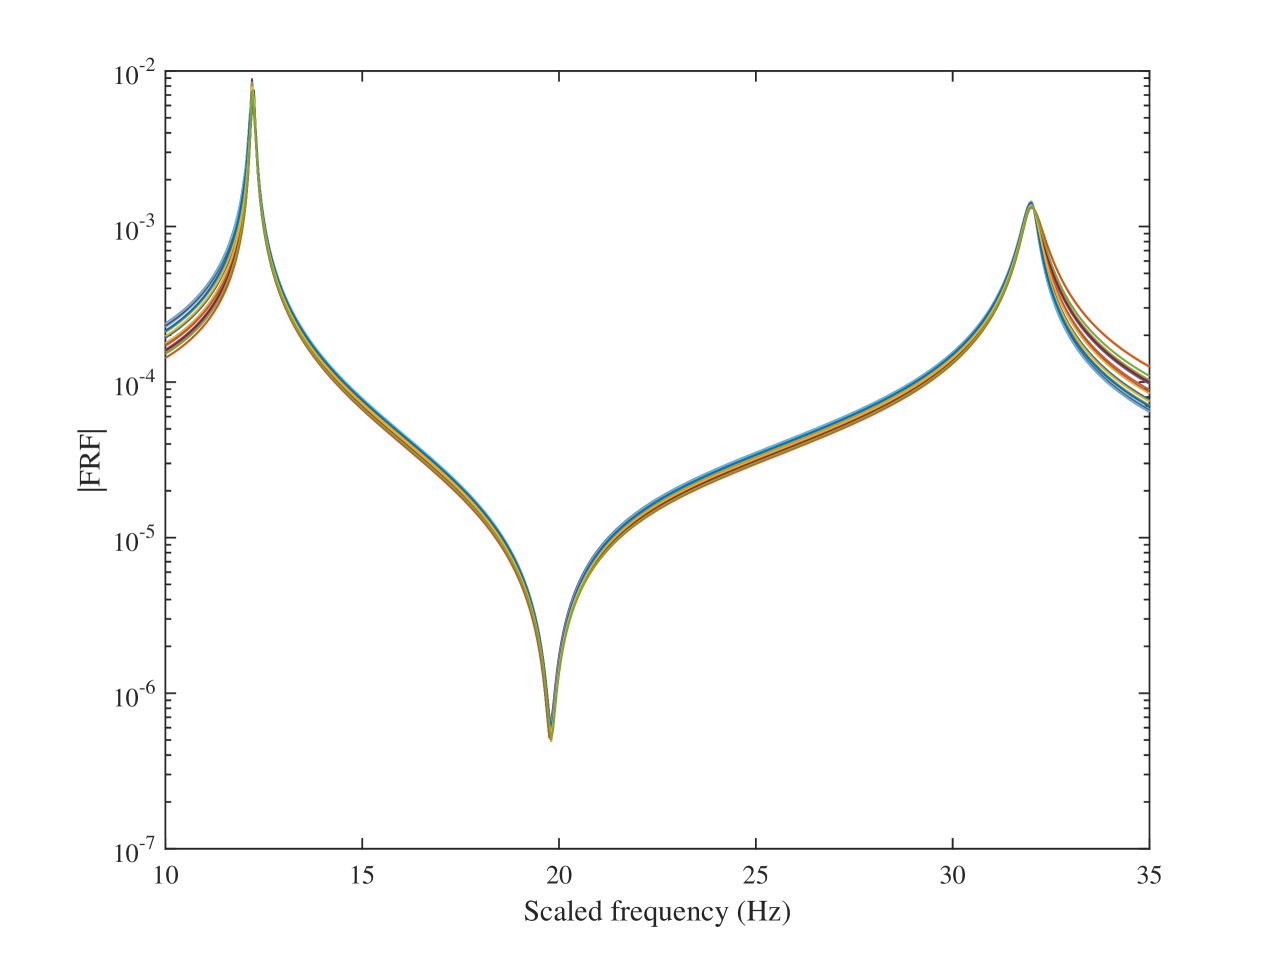
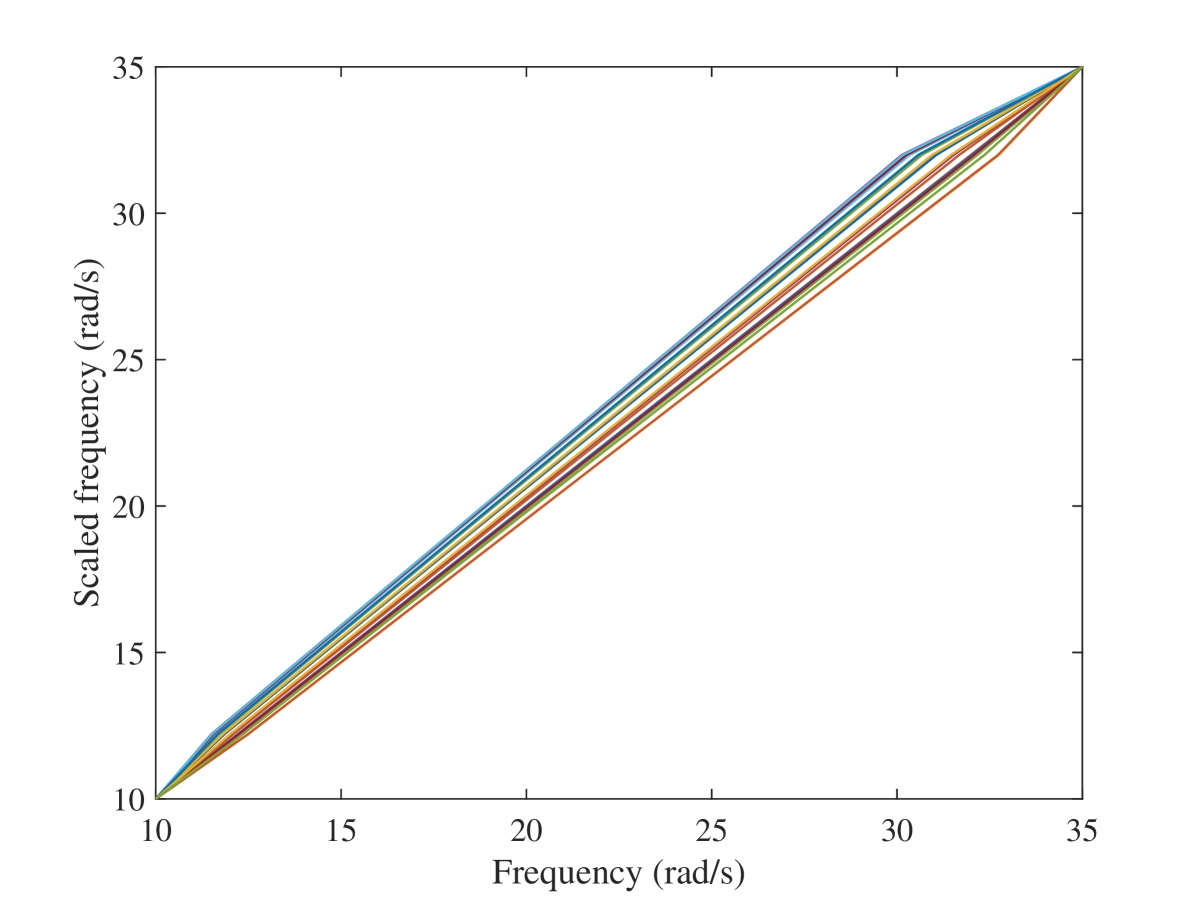
Figures 2(a) and 2(b) illustrate the FRFs of a 2-DOF system versus frequency and scaled frequency, respectively. An example of such a transform used for transforming the FRFs of a 2-DOF is presented in Figure 3.
One should notice that since contains the non-equidistant scaled frequencies, a final interpolation is required to obtain a common discretized scaled frequency between the reference and all other trajectories. To reduce interpolation error in the system response, small frequency steps should be selected. The proposed approach for preprocessing the FRFs is summarized in Algorithm 1.
3.4 Polynomial chaos representation
The non-smooth behavior of the FRFs makes their surrogation by polynomials a problematic task. To solve this issue, one PCE could be calculated for each scaled frequency. This means that to compute PCEs for the FRFs, two sets of PCEs are required. The first set is to predict the selected frequencies, collected in the matrix (16), which are required for performing the stochastic transformation as explained in Section 3.3. This matrix includes eigenfrequencies of the system, therefore by obtaining this set of PCEs, the problem of random eigenvalue calculation is solved by the use of PCE as a byproduct. This problem has been addressed in some recent works, e.g. Pichler et al. (2012). Since the number of random outputs for this set is not very large, PCE can be applied to each of the selected frequencies separately, i.e. for and
| (20) |
The second set of PCE is for the system response at each individual scaled frequency. To this end, let , defined in Algorithm 1, be a matrix of trajectories at scaled frequencies. Since the FRFs have complex-valued responses, whereas the PCEs are defined for real-valued functions only111Limited literature is available on the use of PCE for complex-valued functions, see e.g. Soize and Ghanem (2004)., separate PCEs need to be performed for real and imaginary parts of the FRFs. Therefore, the matrix is the response matrix for which the PCE should be built.
The number of random outputs for this set, , can be extremely large. As discussed in Section 3.2, the PCEs are therefore applied directly to the principal components of , yielding:
| (21) |
| (22) |
where and are respectively the vectors of coefficients of the PCEs made for the real and imaginary parts of the FRFs.
3.5 Surrogate response prediction
To predict the surrogate model response at a new sample point , several steps need to be taken to transform the PCE predictors in Eqs. (21) and (22) from the scaled frequency axis to the original frequency axis . The matrices and are obtained by evaluating the second set of PCEs in Eqs. (21) and (22), respectively. Then, the FRFs at the scaled frequencies can be obtained at the new sample point by the inverse vectorization of where . To obtain the FRF at the original frequency the following transformation is used,
| (23) |
where is obtained by evaluating Eq. (18) at which is the matrix of selected frequencies at the new sample point evaluated by Eq. (20). Besides, is a set of discretized frequencies which are non-equidistantly spread over the frequency rage of interest. In order to provide the frequency response at the desired frequencies , interpolation is inevitable. The algorithm for predicting the system response at a new sample point is briefly presented in Algorithm 2.
4 Examples
4.1 Introduction
In this section, the proposed method will be applied to two case studies. The first one is a simple 2-DOF system to illustrate how the method works. The second one is a 6-DOF system with a relatively large (16-dimensional), parameter space. For the sake of readability, only results for one output (the output for the 2-DOF and the output for the 6-DOF system) are shown for each case while the results for the other outputs are reported for completeness in the Appendices.
To assess the accuracy of the surrogate models quantitatively, the following measure based on the root mean square (rms) error of the vectors is defined.
| (24) |
in which is the vector of interest. and represent results obtained by running the true and surrogate models, respectively. This error aims at measuring the relative difference between vectorial data, such as one FRF or the mean and standard deviation of several FRFs. For the mean and standard deviation of the data, the reference results are obtained by evaluating the true model at 10,000 Monte-Carlo samples and the approximations are calculated by the PCE surrogate at the same 10,000 points.
4.2 Simple 2-DOF system (Jacquelin et al., 2015b)
As the first example, the simple 2-DOF system shown in Figure 4 is selected to highlight the steps of the proposed method. In this system, stiffness is assumed to be uncertain
| (25) |
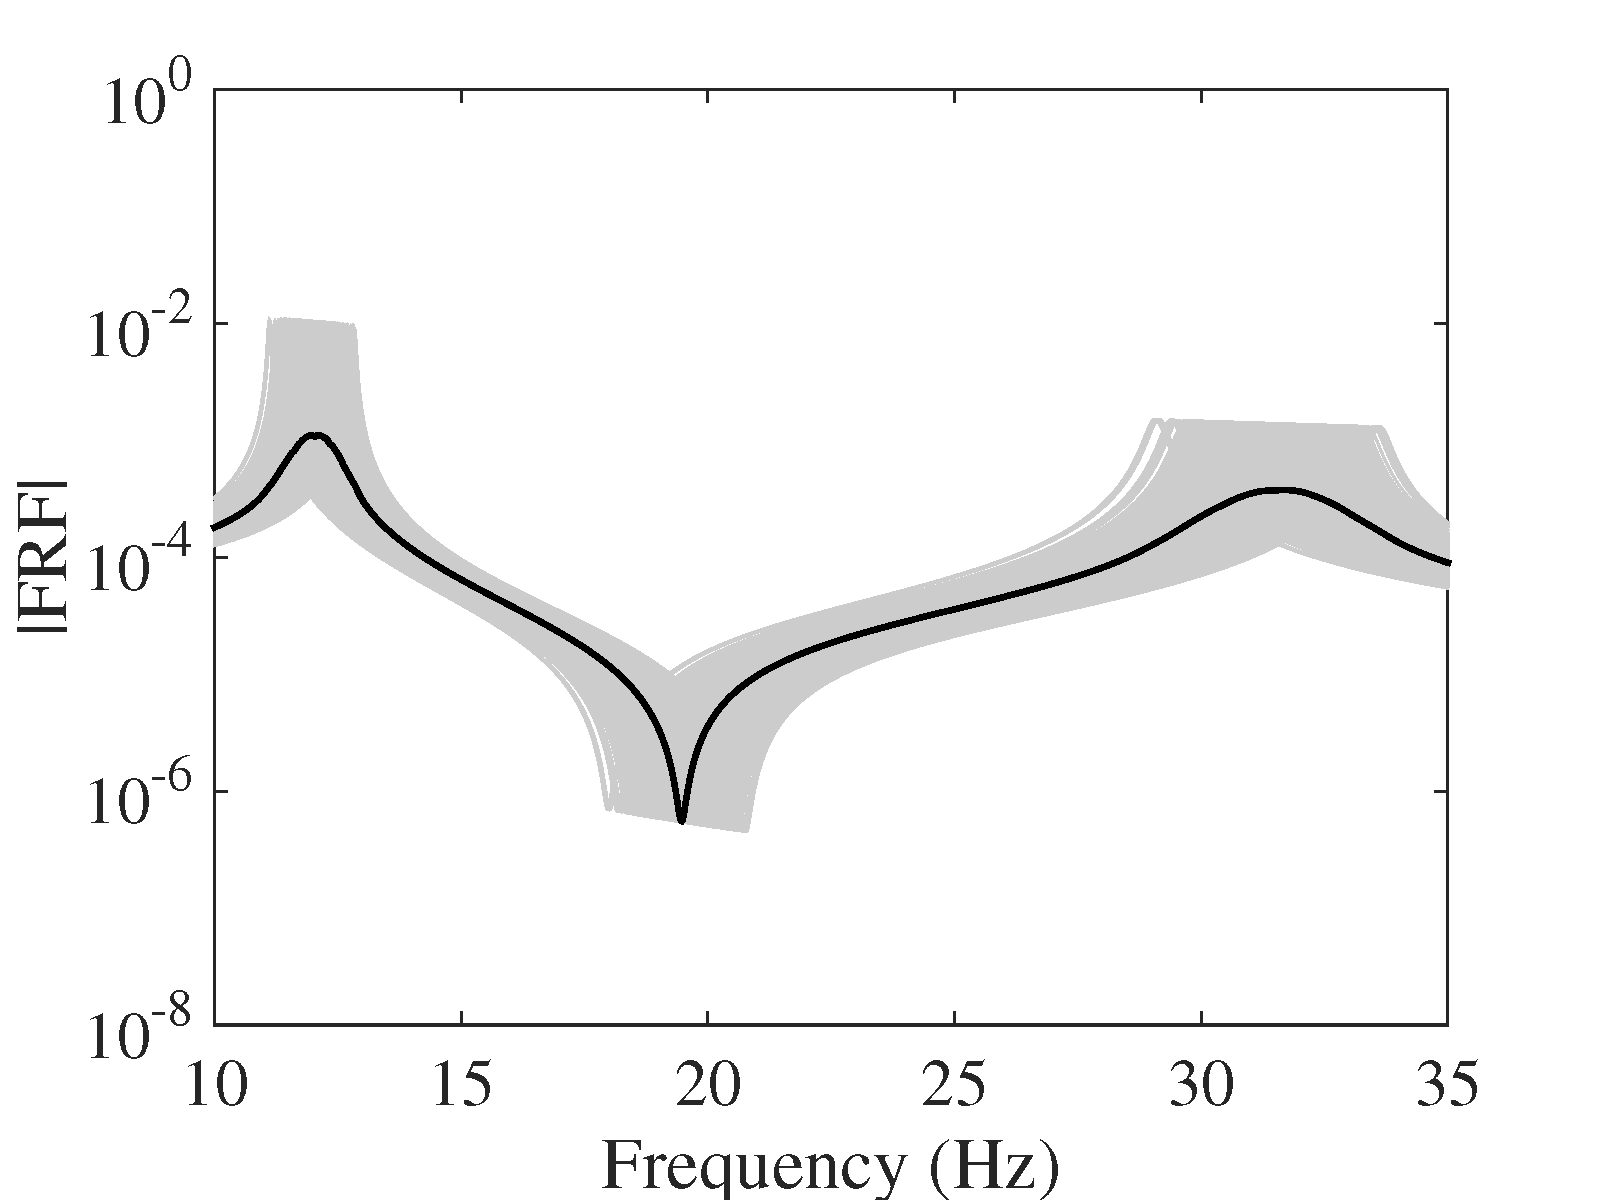
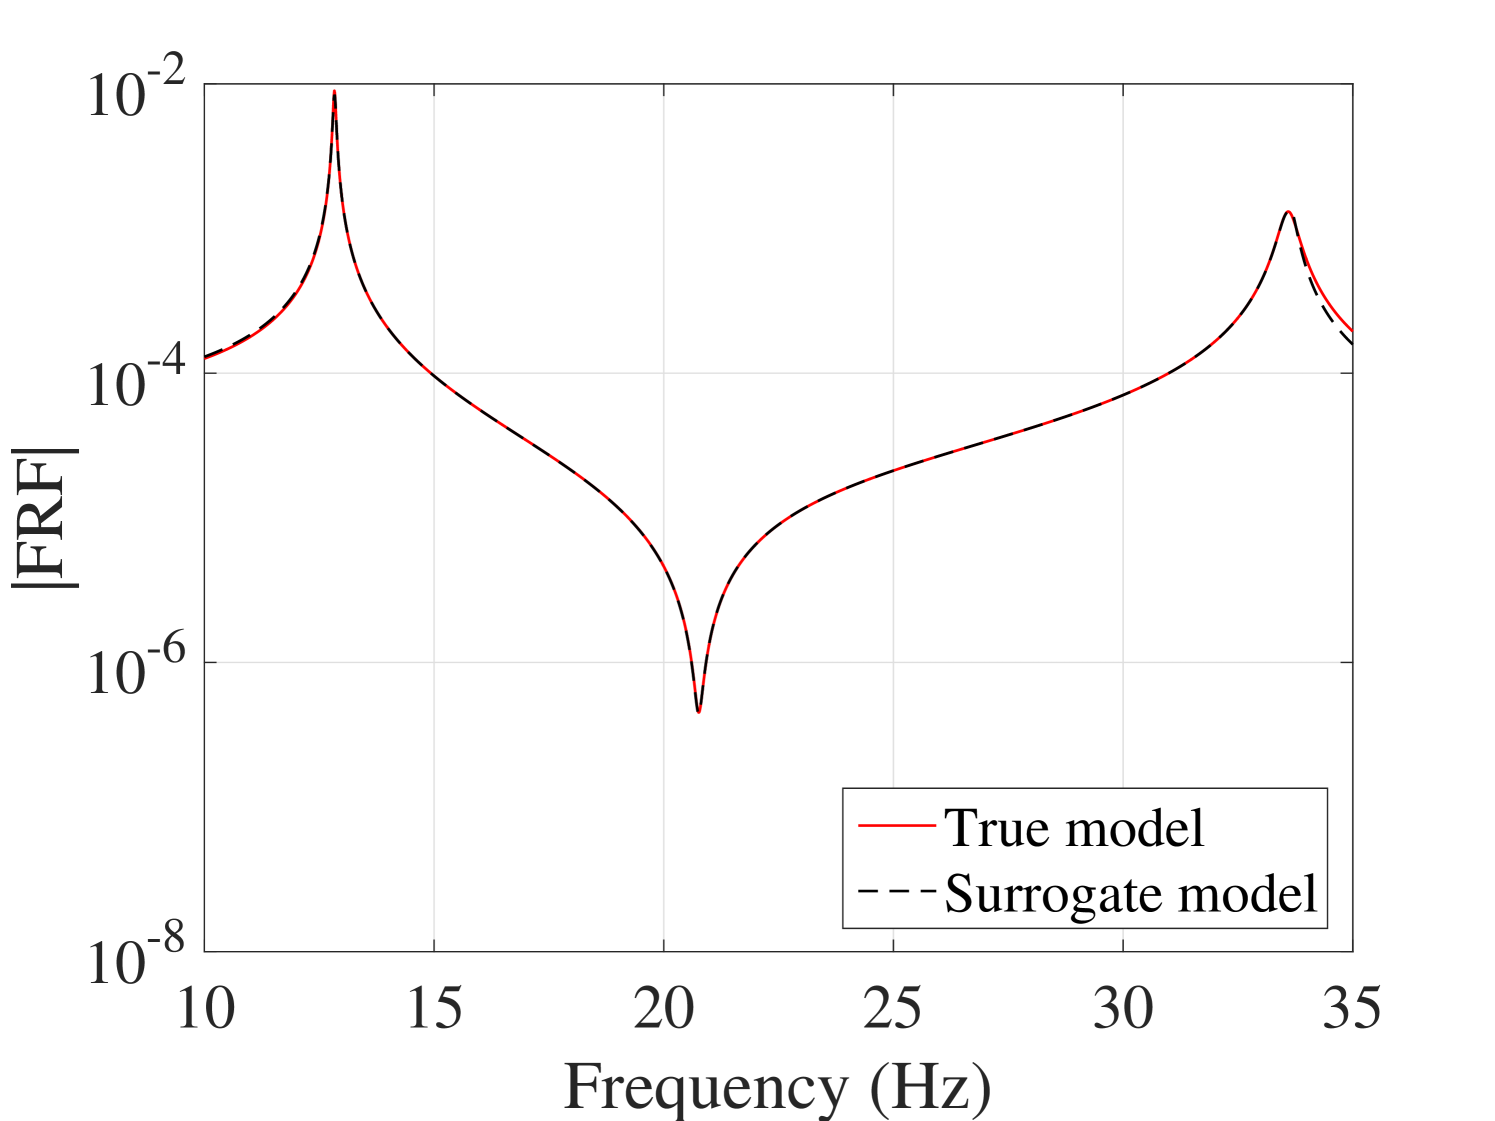
where is a standard normal random variable. Other properties of the system are listed in Table 1. The system has one input force at mass 1, two physical outputs and and thus, two FRFs. The FRFs of the system are obtained in the range of 10 to 35 Hz with a frequency step of 0.01 Hz, as shown in Figure 1. The selected frequencies are also shown in the figure with red asterisks.
40 points are sampled in the parameter space using Latin Hypercube Sampling (LHS) to form an experimental design (ED) and the model is evaluated at these points to find the system responses of interest, namely the FRFs, , and the selected frequencies .
| Characteristics | m (kg) | (Nm-1) | c (Nm-1s | |
|---|---|---|---|---|
| Value | 1 | 15000 | 1 | 5% |
Figure 2(a) shows the FRFs of the system evaluated at . To find the transformed FRFs, i.e. FRFs at scaled frequencies , one trajectory was selected randomly as the reference and the others were scaled such that their peaks and valleys were at the same scaled frequencies as that of the reference trajectory. The transformed FRFs are shown in Figure 2(b) and the corresponding continuous piecewise-linear transformations in Figure 3.
The next step is to find a suitable basis and the associated coefficients for the polynomial chaos expansion. In this case, since the random variable is Gaussian, the basis of the polynomial chaos consists of Hermite polynomials. The LARS algorithm (Blatman and Sudret, 2011b) is employed here to calculated a sparse PCE with adaptive degree.
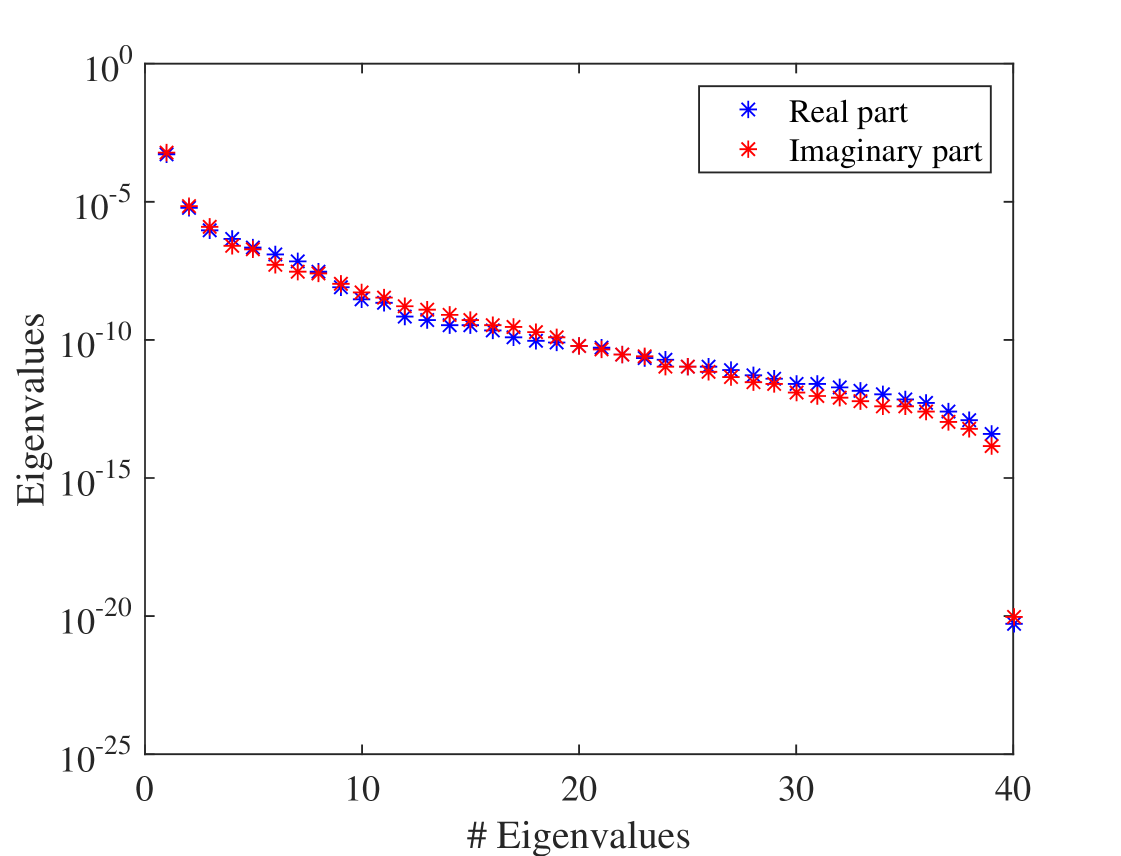
The first set of expansion consists of 10 PCEs to surrogate the selected frequencies , shown in Figure 1 by red asterisks. As the second set of expansions, PCE is made for the dominant components of as explained in Section 3.2.1. To do so, the largest principal components are selected such that the sum of their associated eigenvalues amounts to of the sum of all the eigenvalues, i.e. in which ’s are the eigenvalues of the covariance matrix of either or . By this truncation, the number of random outputs is reduced from 2501 2 2 to 6 components, namely 3 components for the real part and 3 components for the imaginary part. The spectra of the eigenvalues of the covariance matrix of the and are displayed in Figure 5. All the PCEs used to make this surrogate model, including those for the selected frequencies and those for the dominant components have orders between 3 and 8.
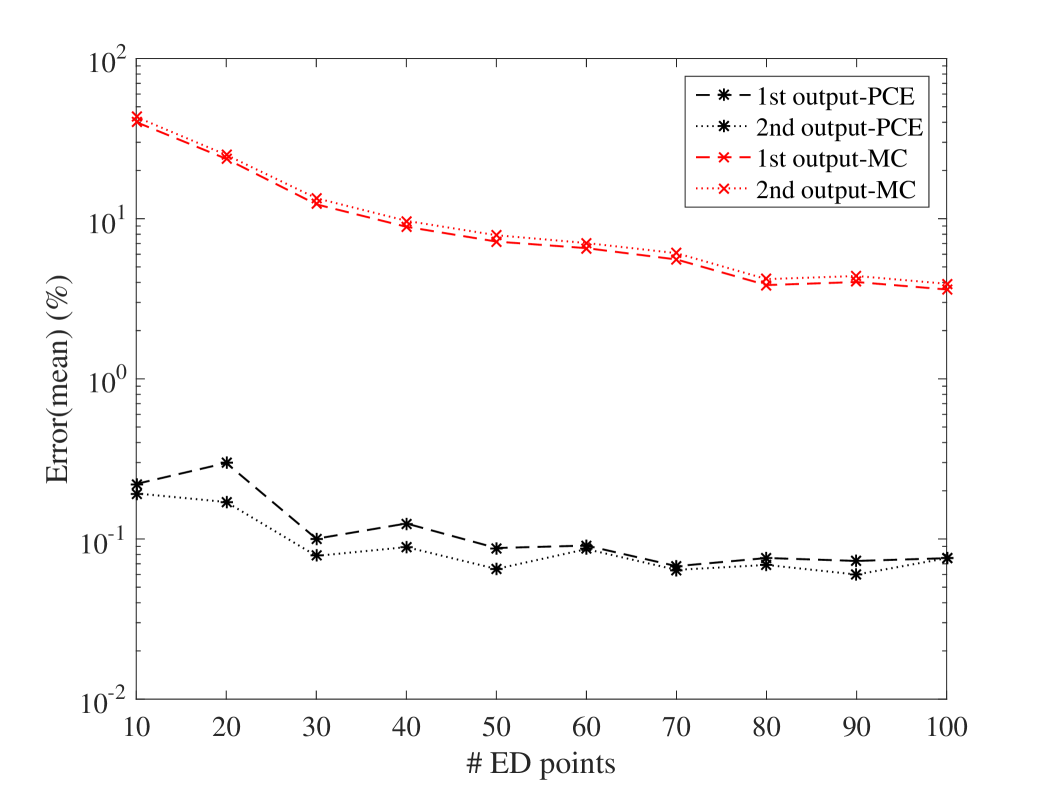
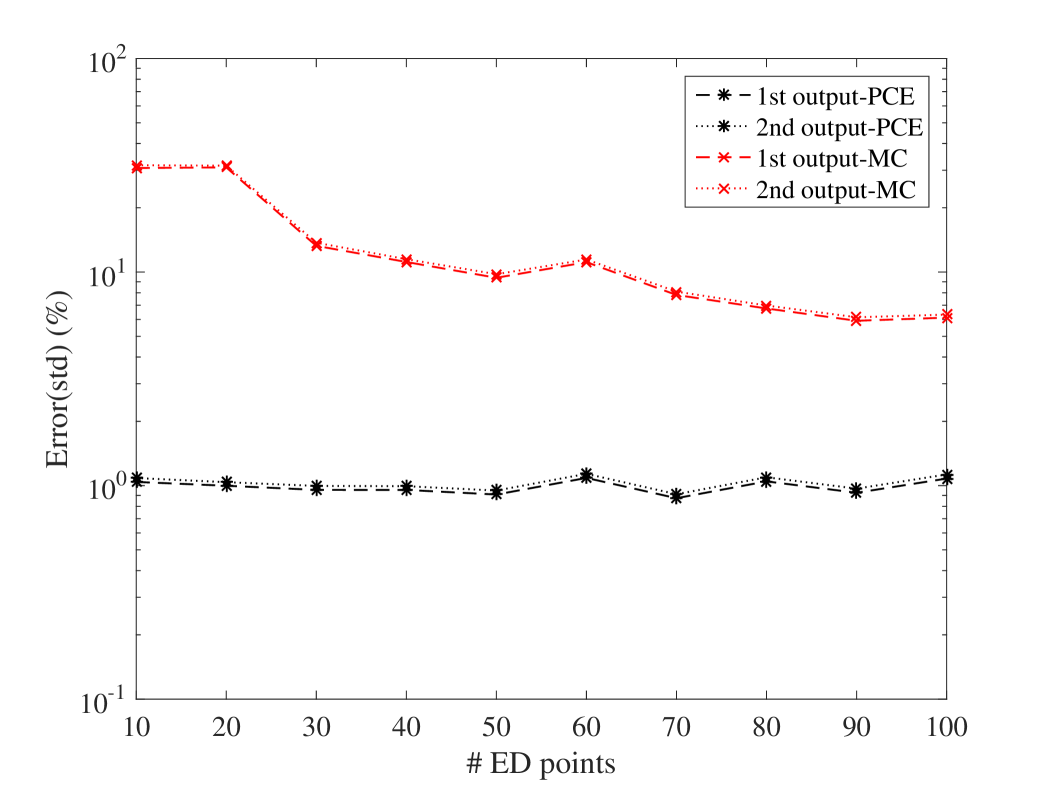
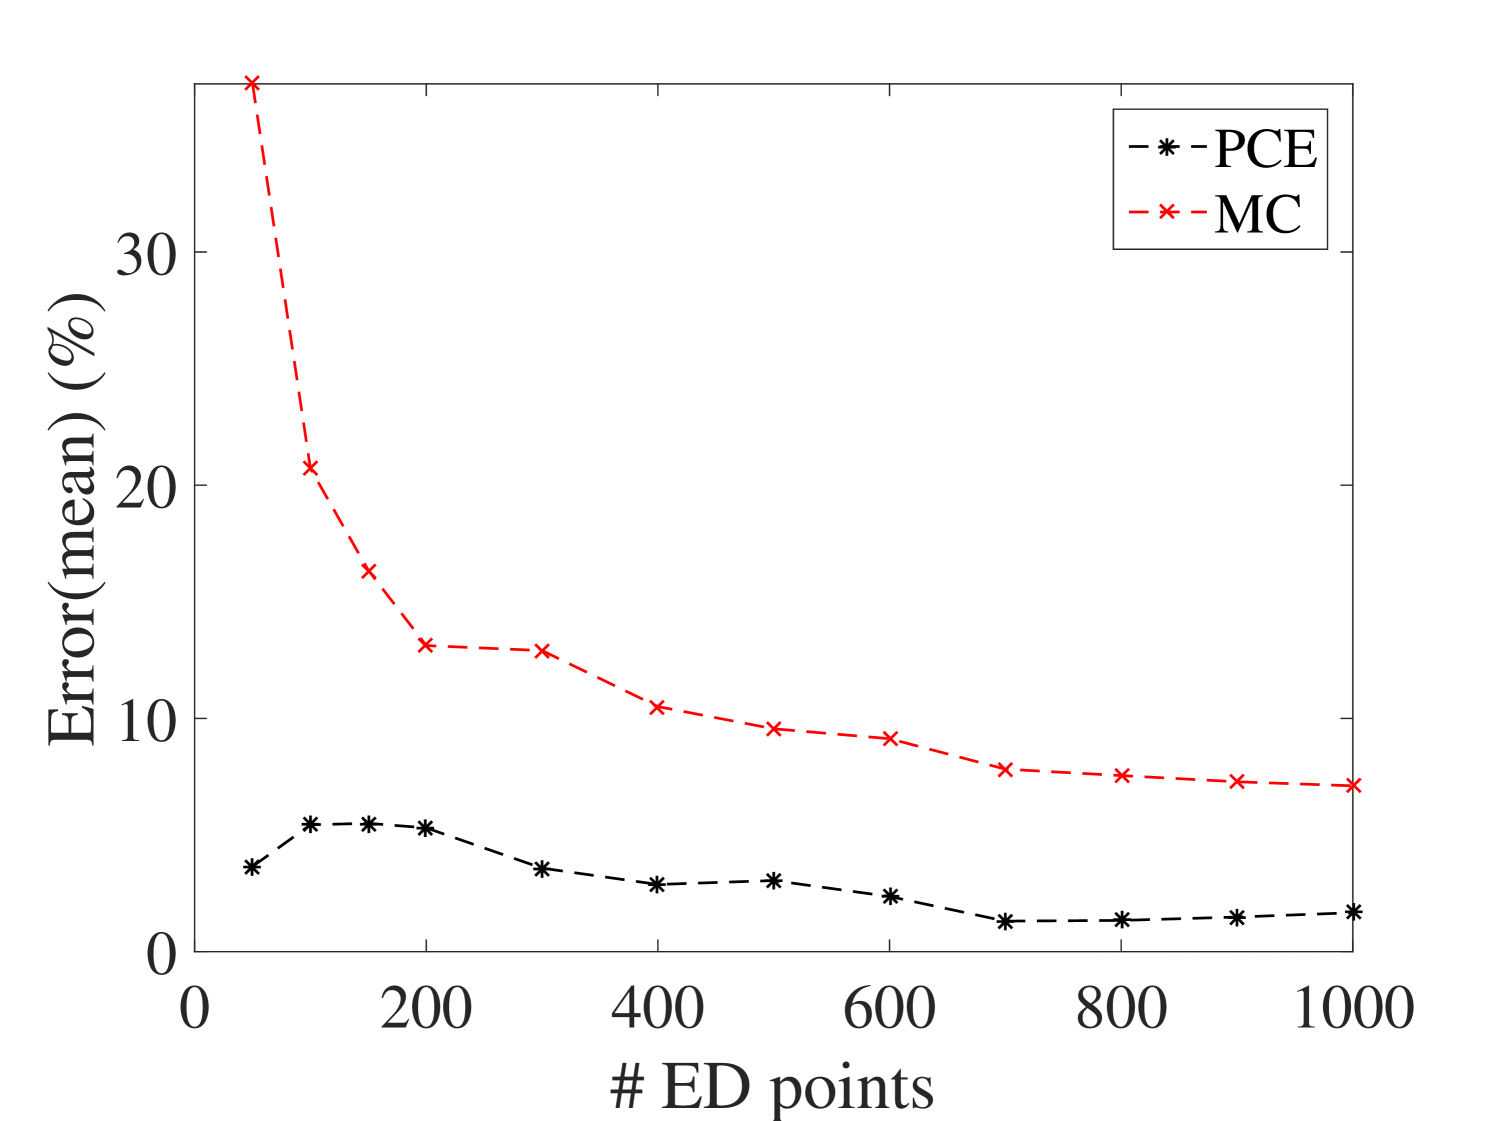
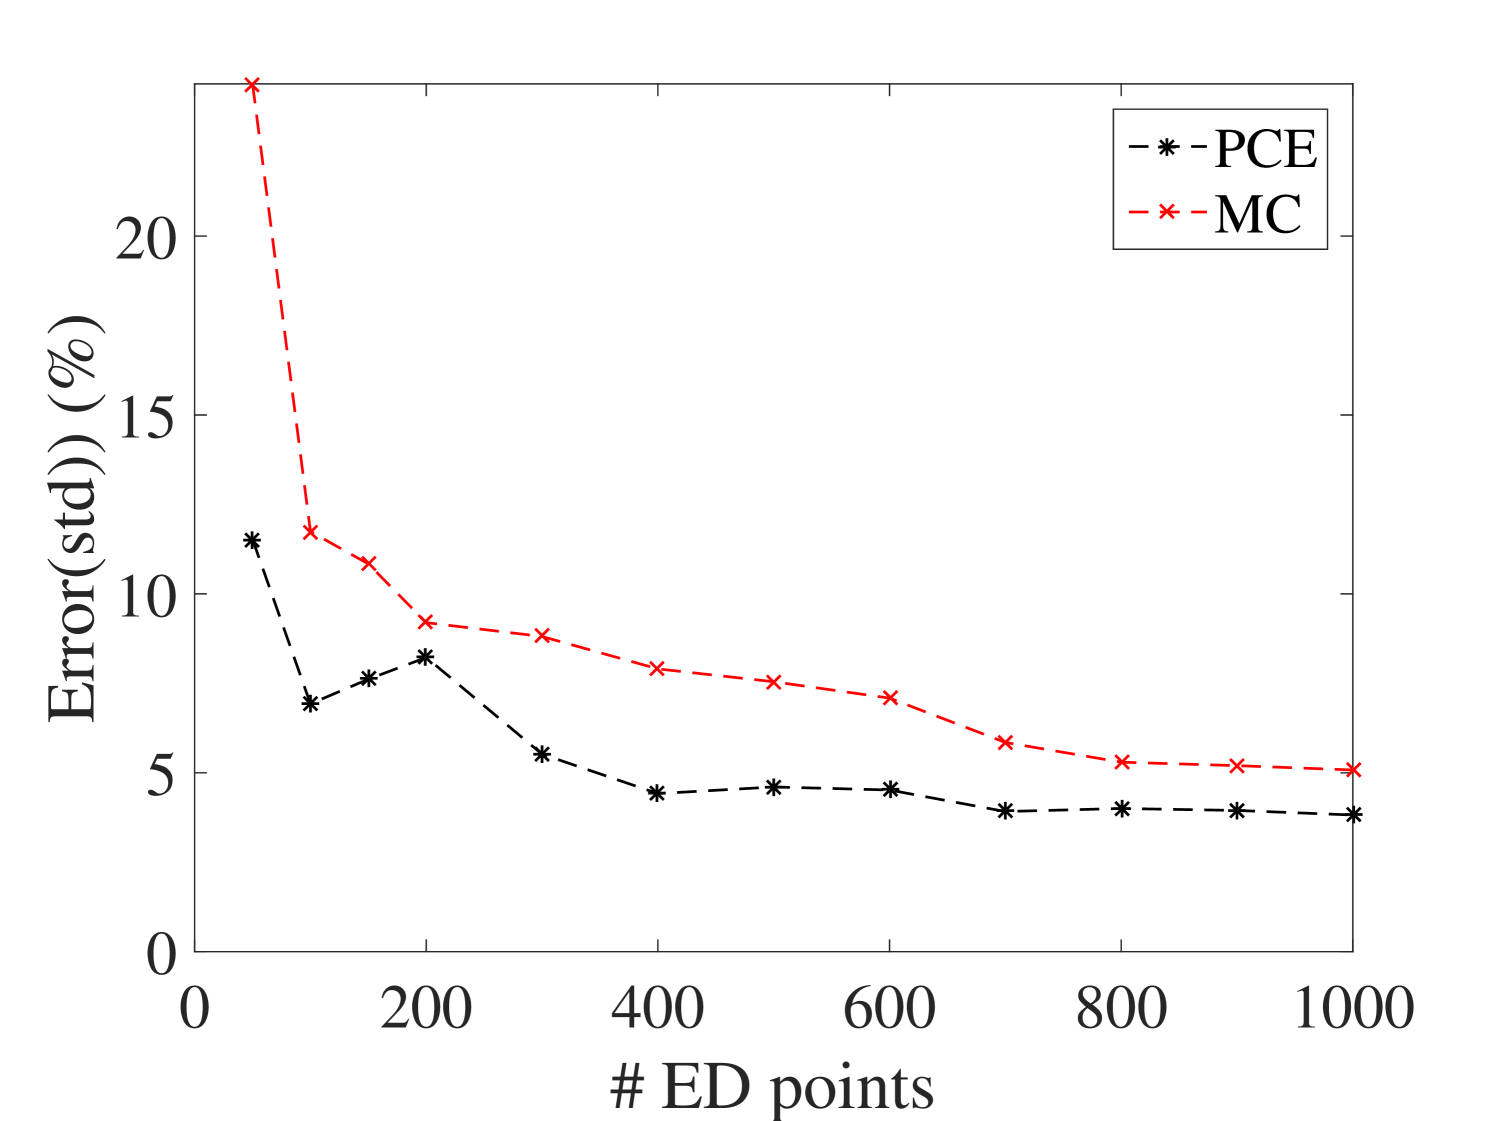
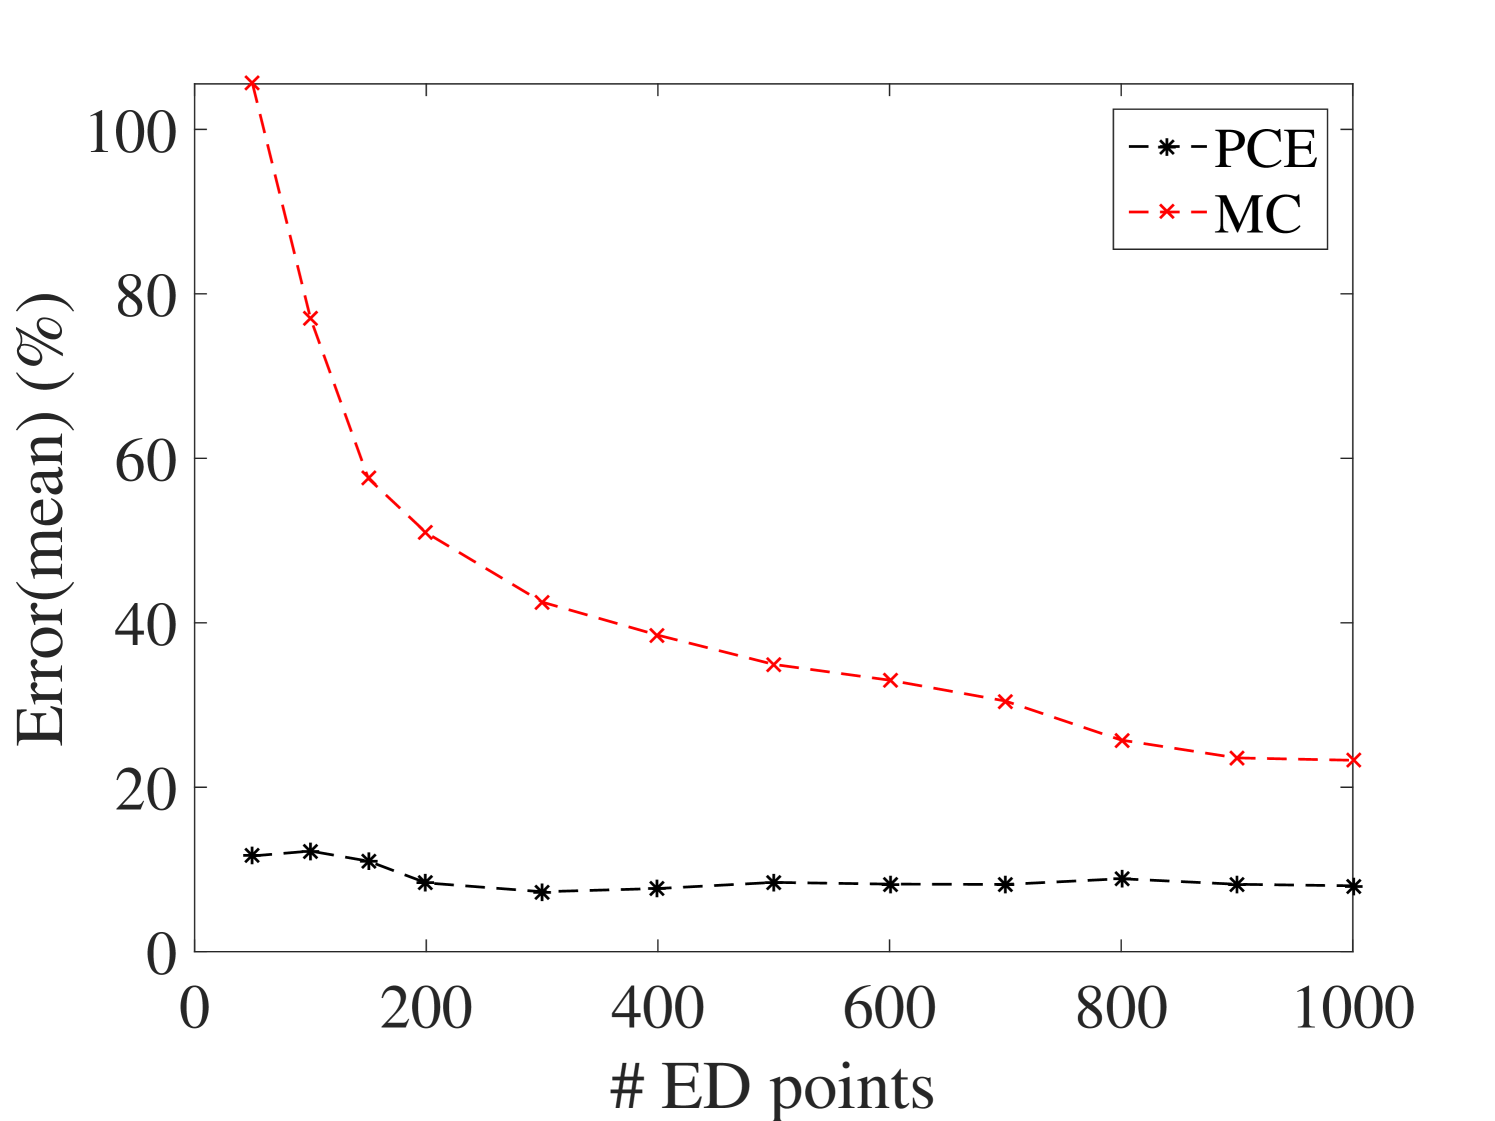
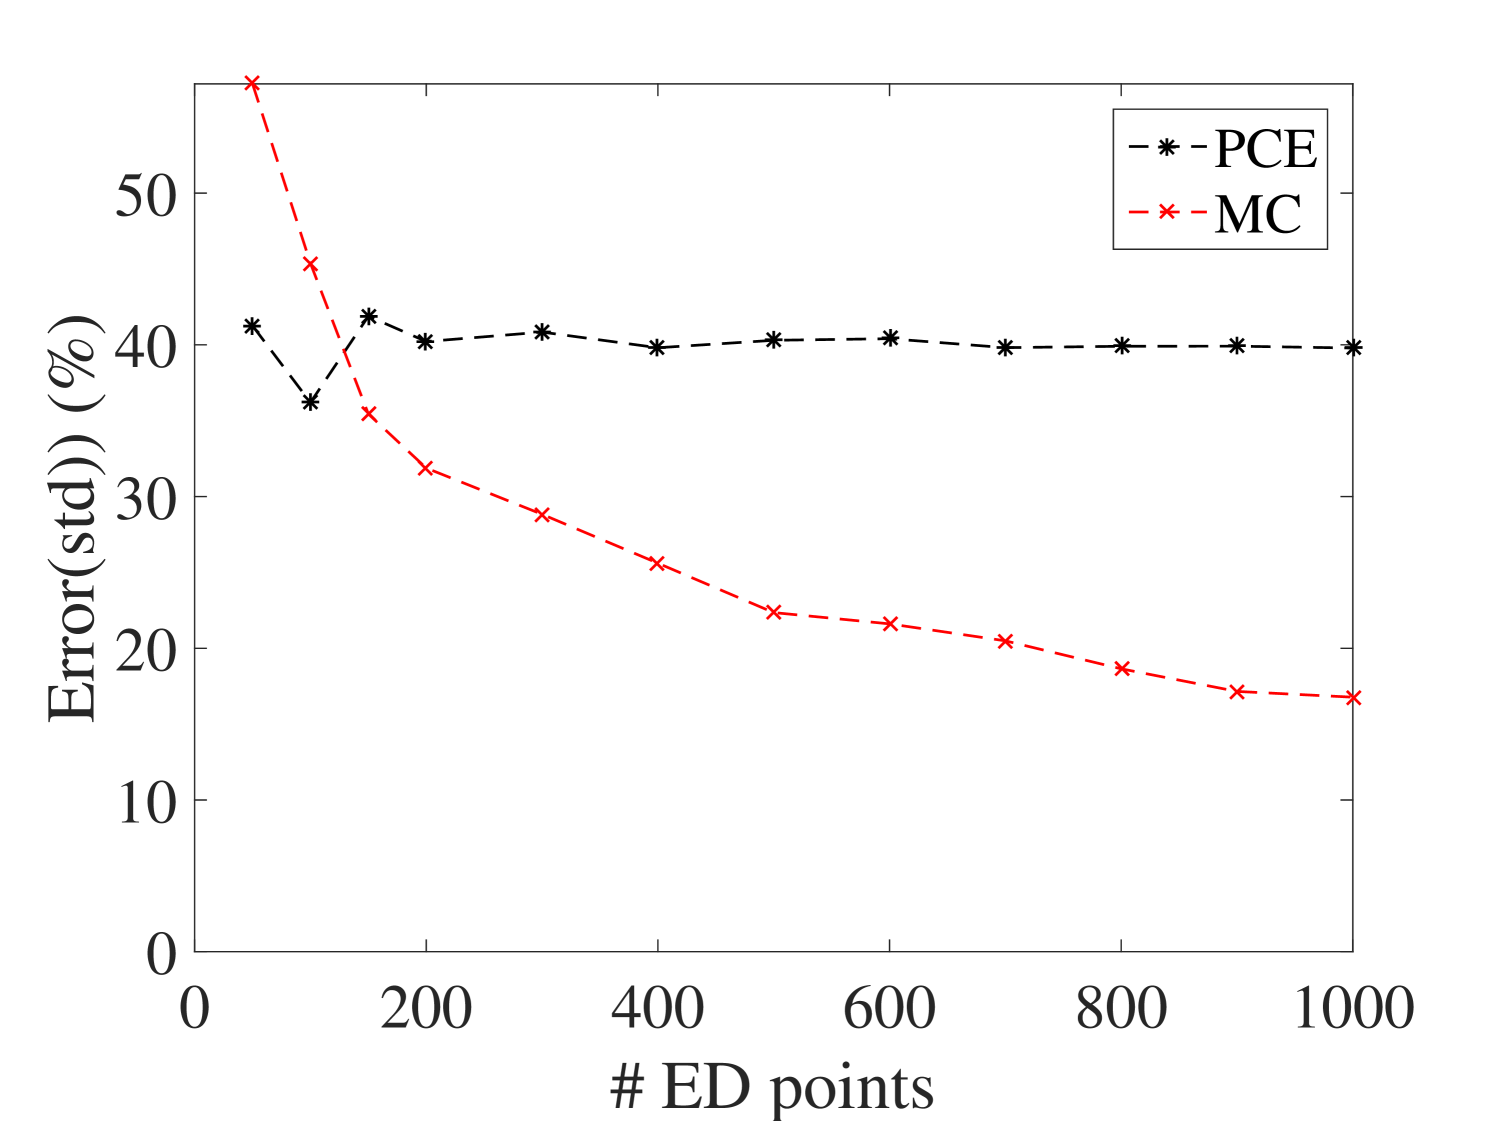
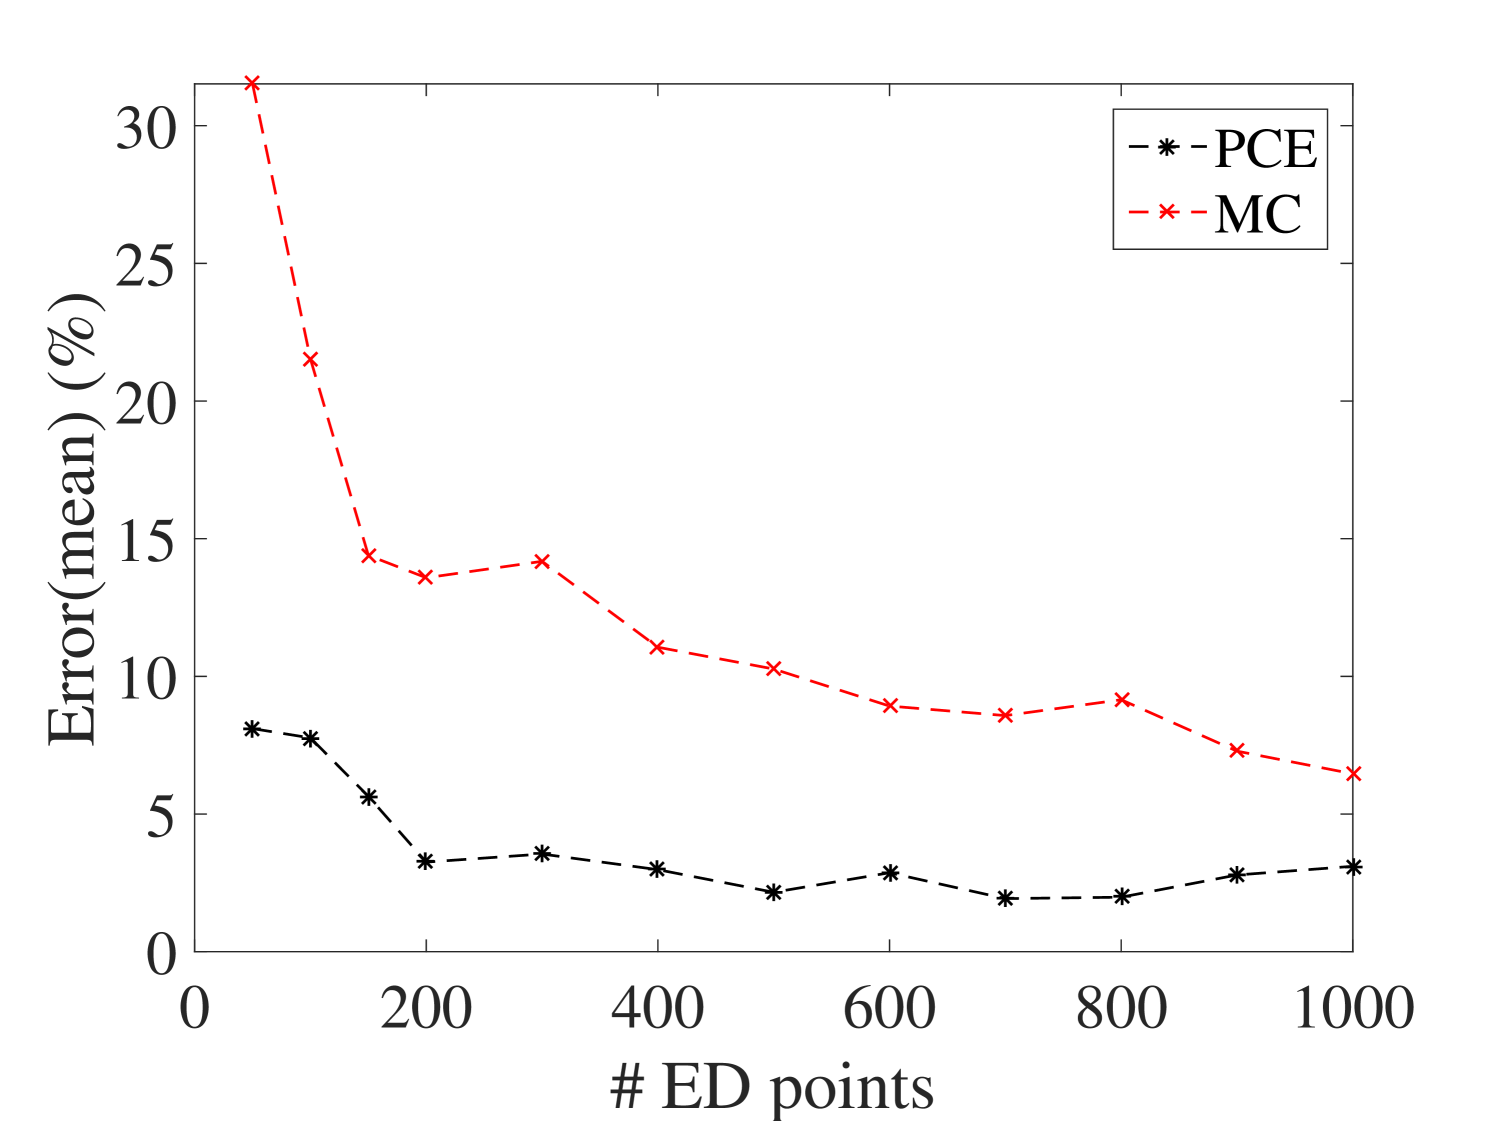
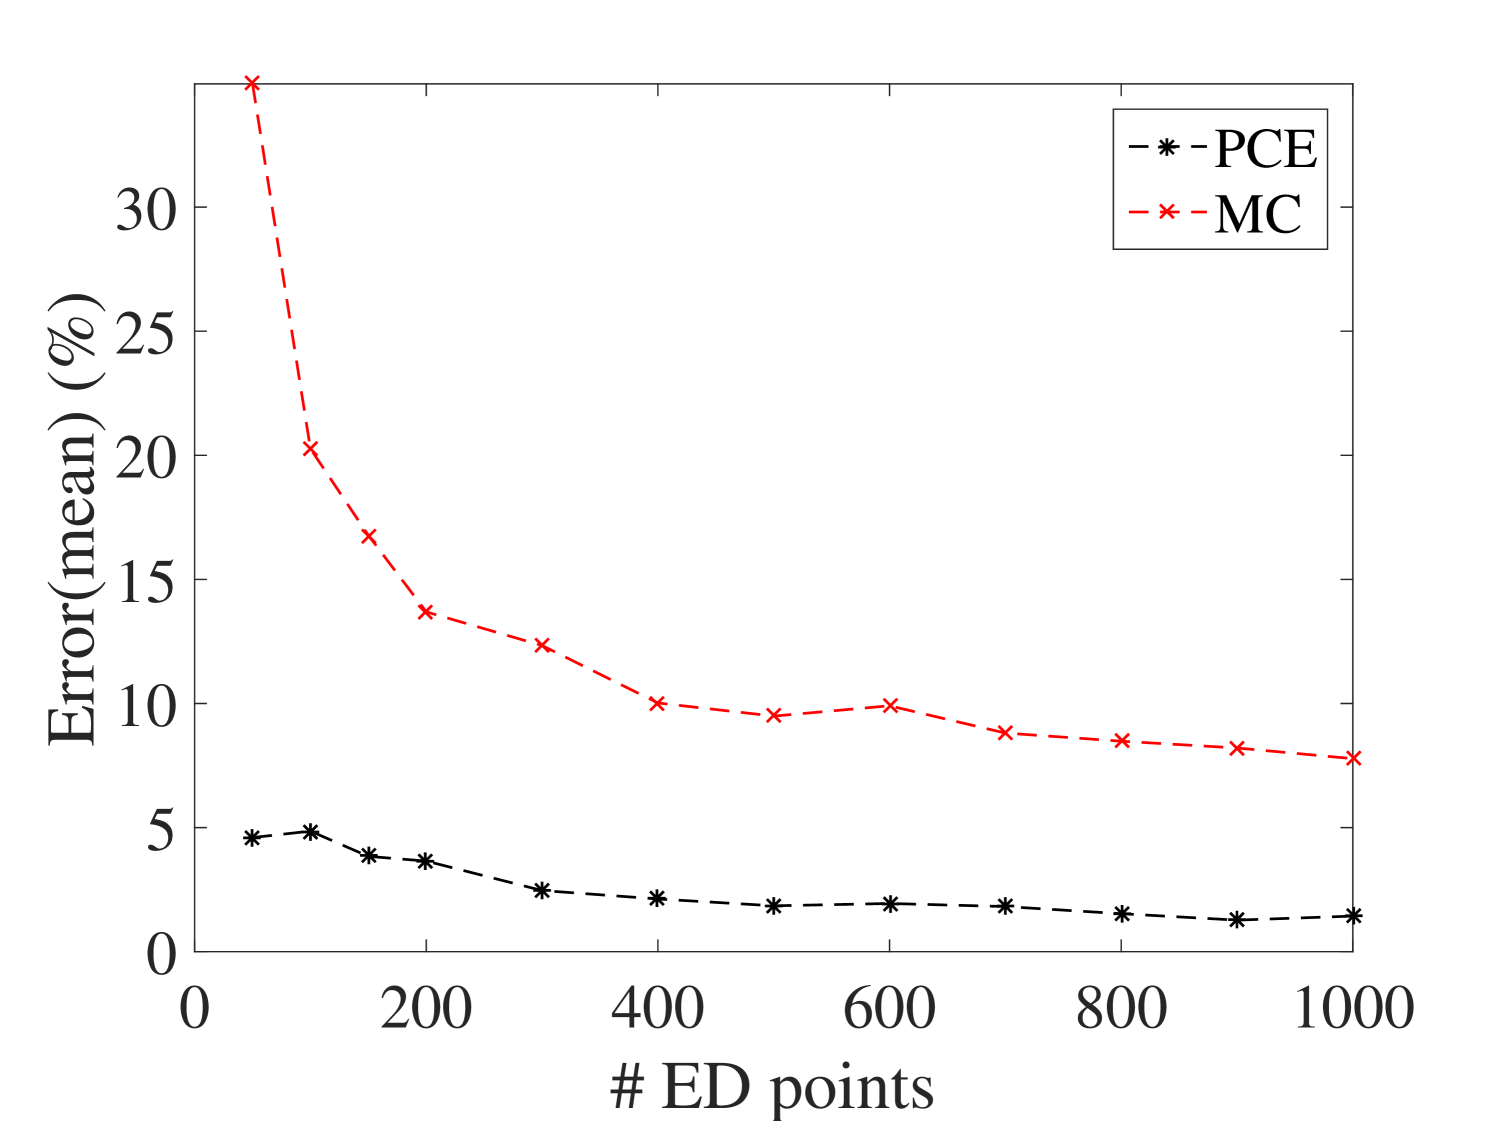
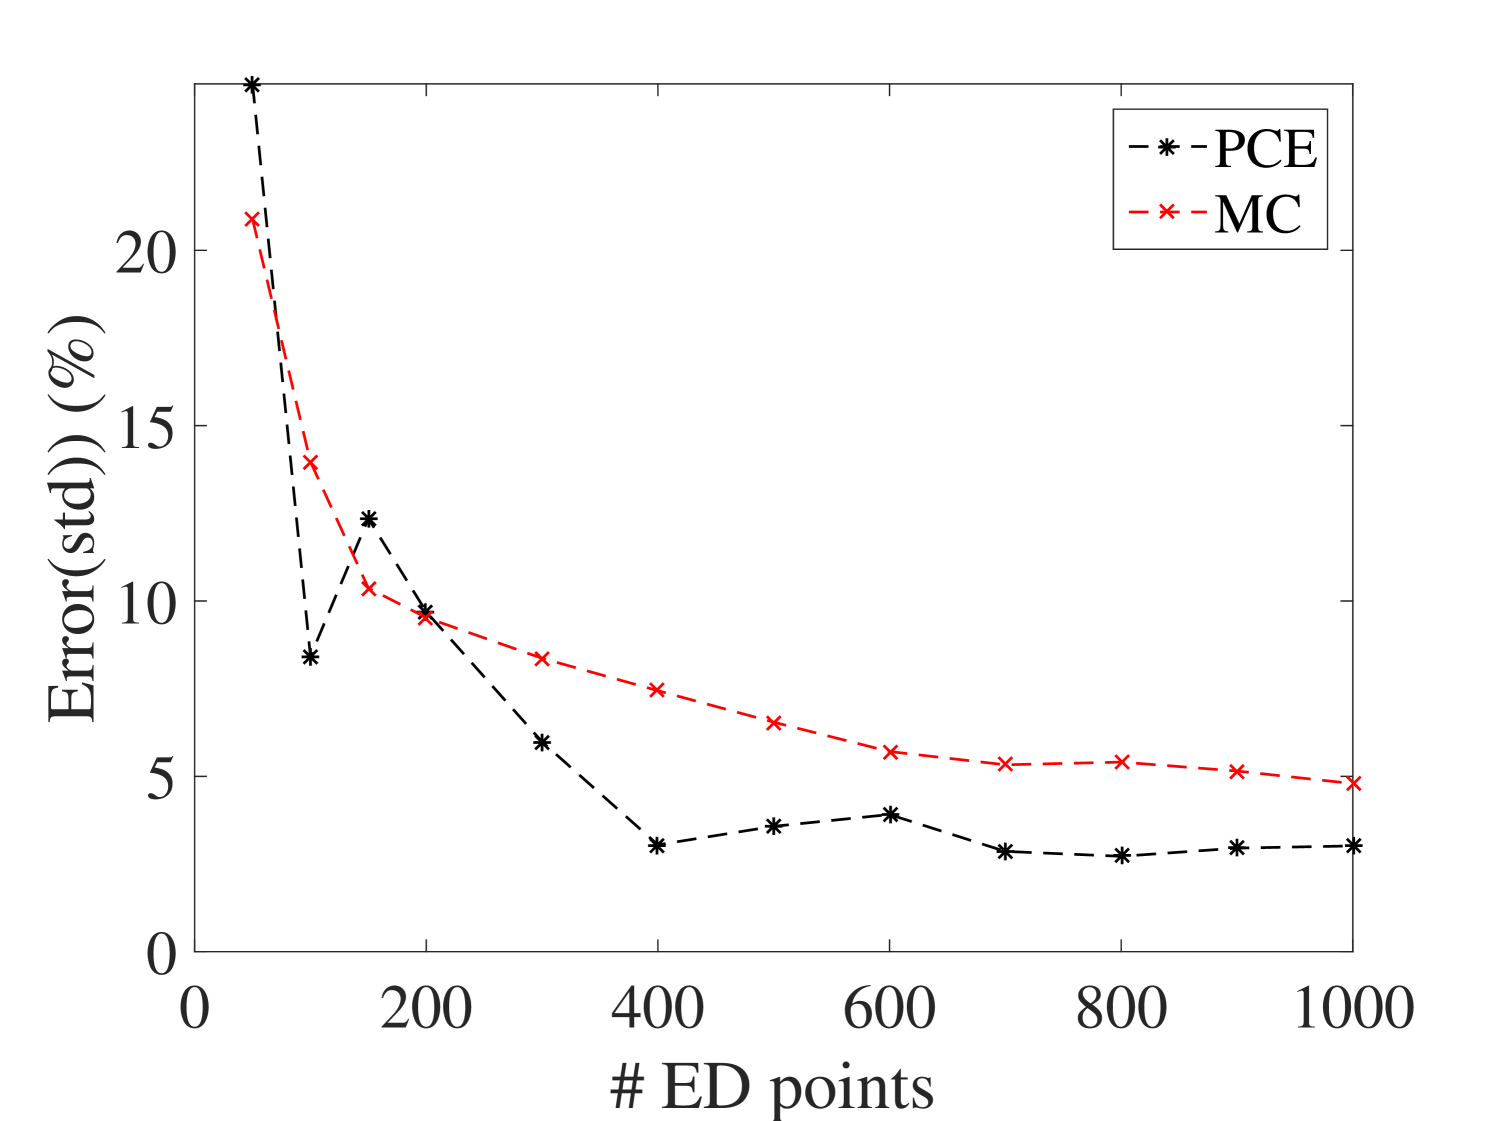
The efficiency of the proposed approach is assessed by comparing the prediction accuracy of the surrogate model on a large reference validation set (10,000 samples calculated with the full model). PCE estimate of the mean and standard deviation of the surrogate model are compared to their Monte-Carlo estimators on experimental designs of increasing size. The resulting convergence curves are given in Figure 6.
They indicate that the PCE converges faster to the reference results for the mean and standard deviation. Their estimates are approximately two and one order of magnitude more accurate than those from the MC estimators. In addition, one can conclude that 40 points are enough for the ED in this example, since for larger sizes the accuracy does not improve significantly.
It is worth mentioning that the coefficient of variation (COV) of the parameters and the level of damping are among the criteria that can affect the size of the ED. Therefore, larger COV and lower levels of damping are not obstacles for the proposed method provided a sufficiently large ED is used.
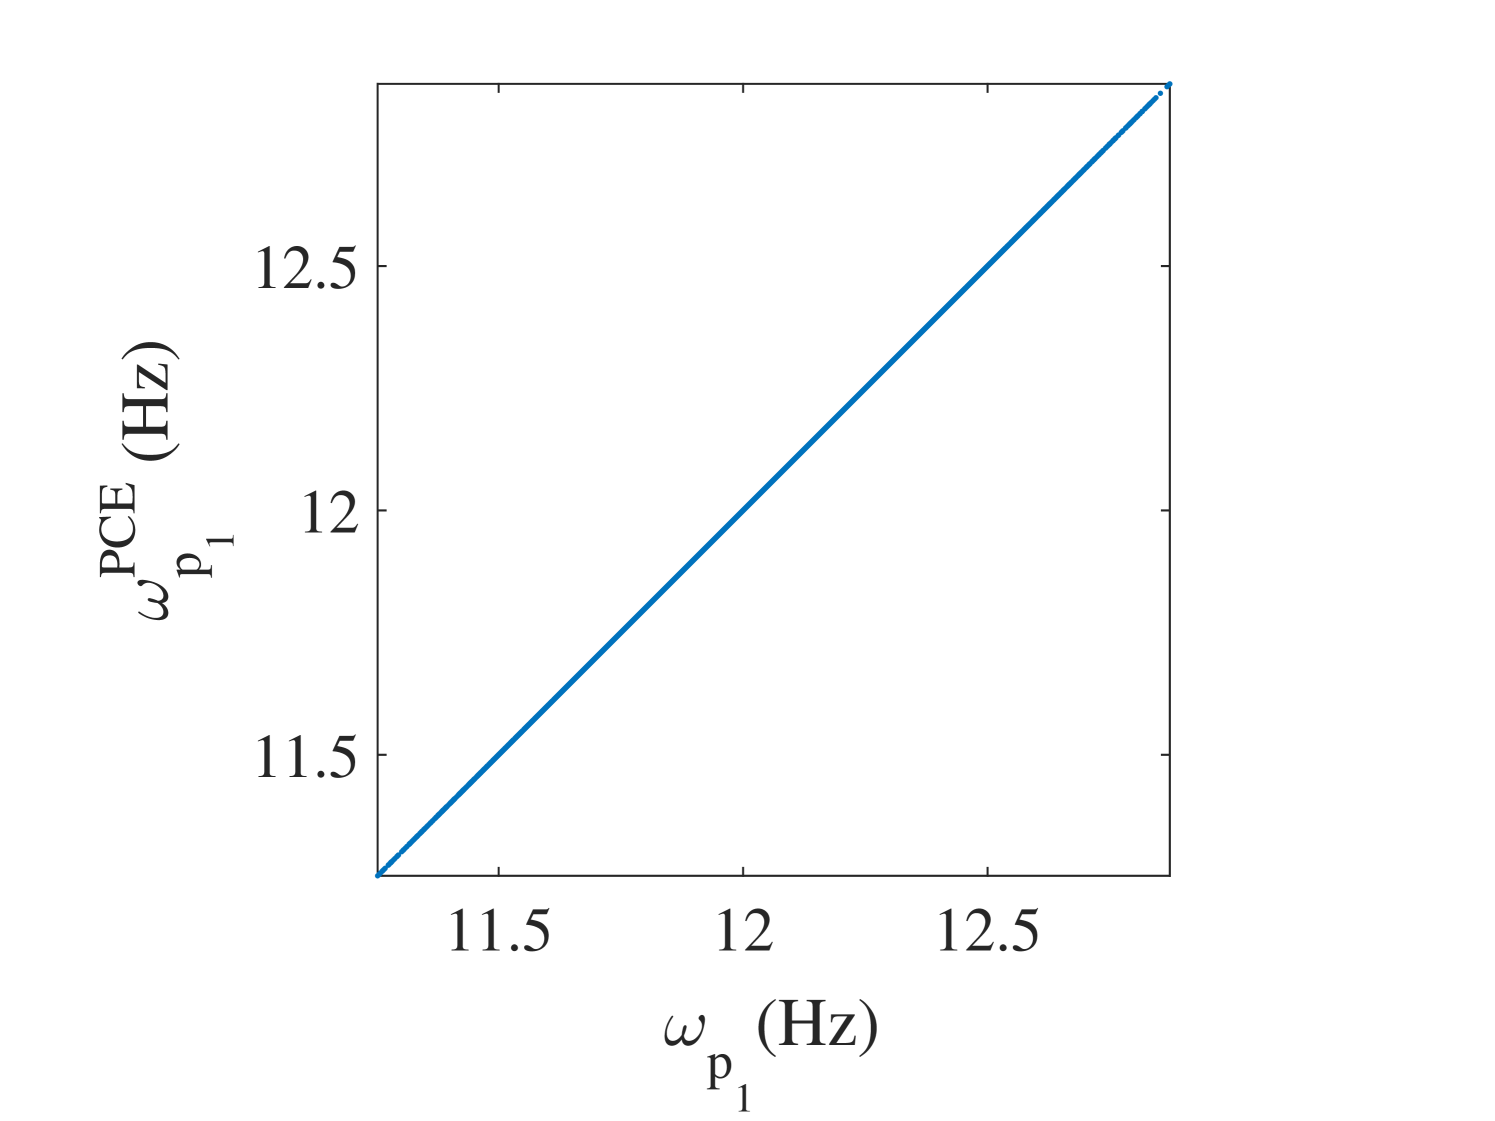
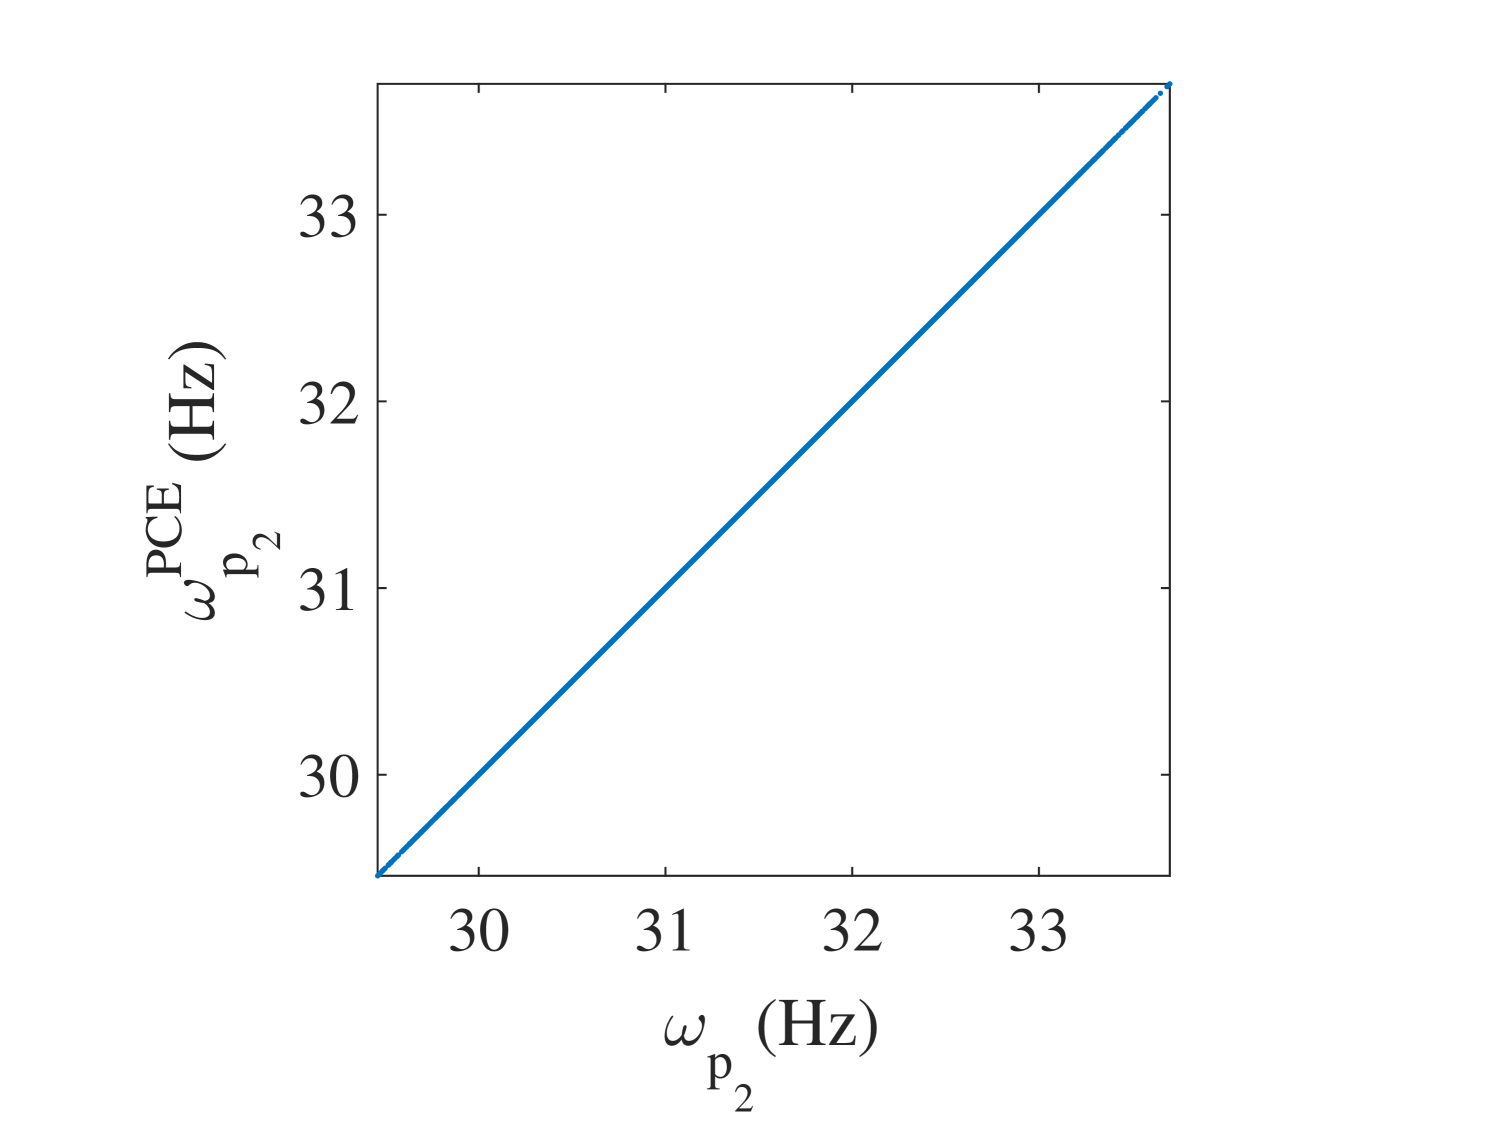
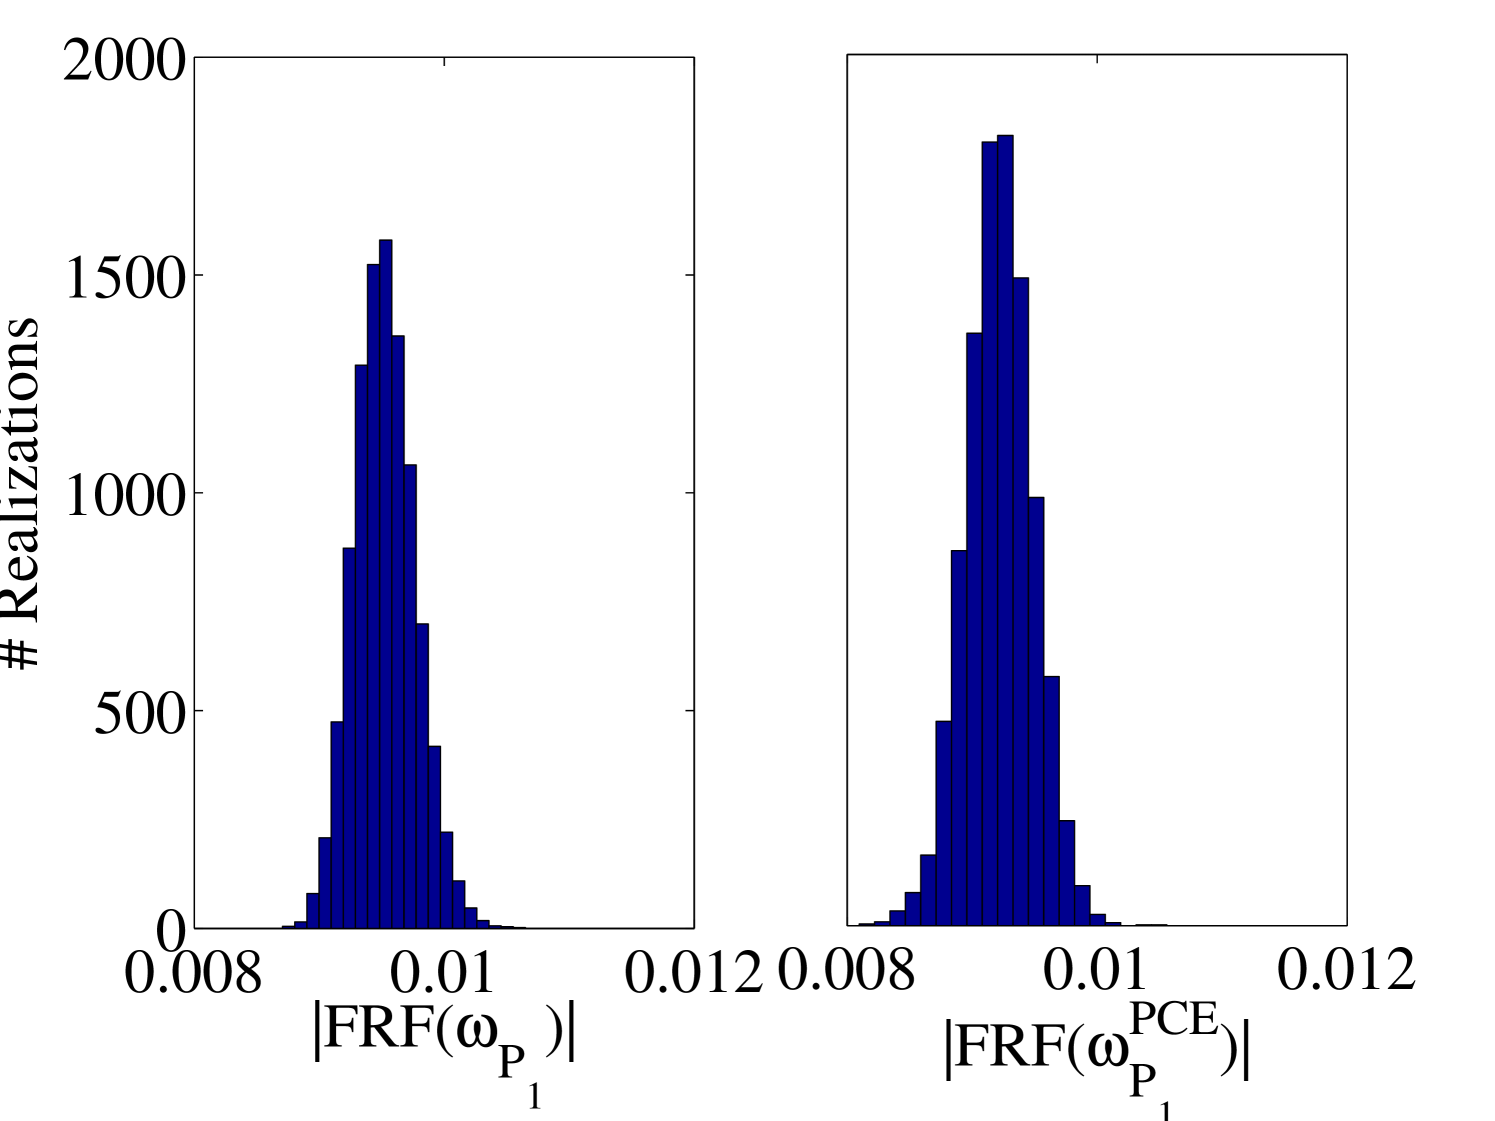
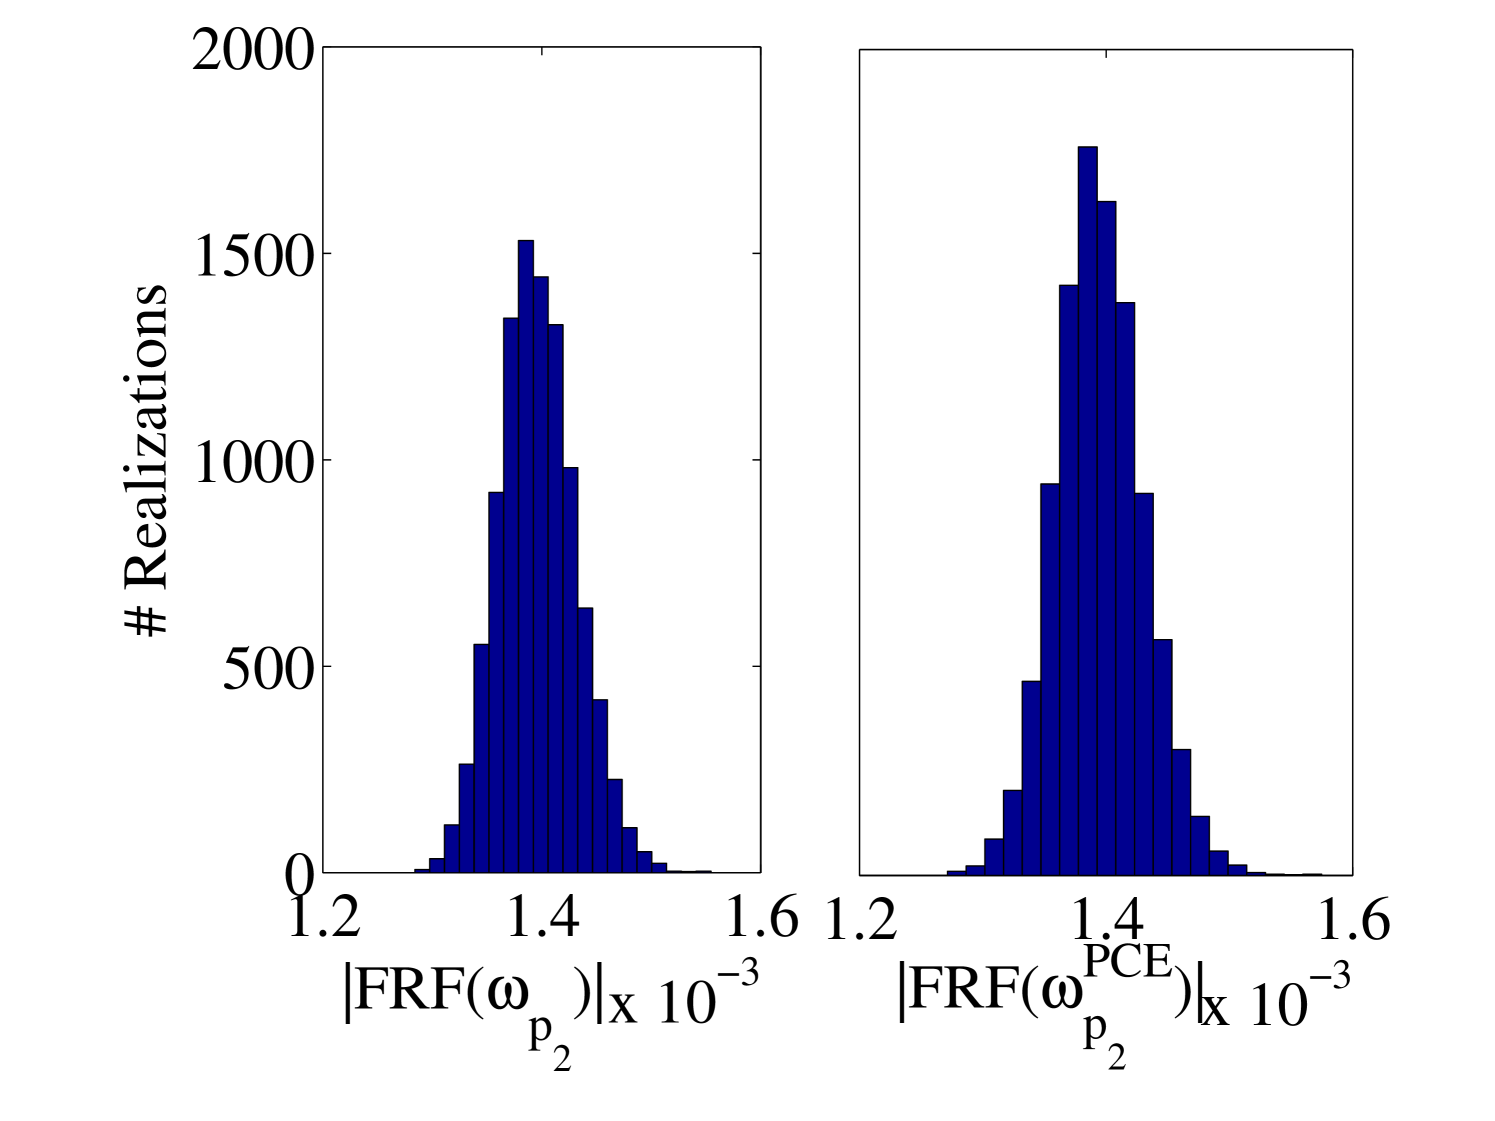
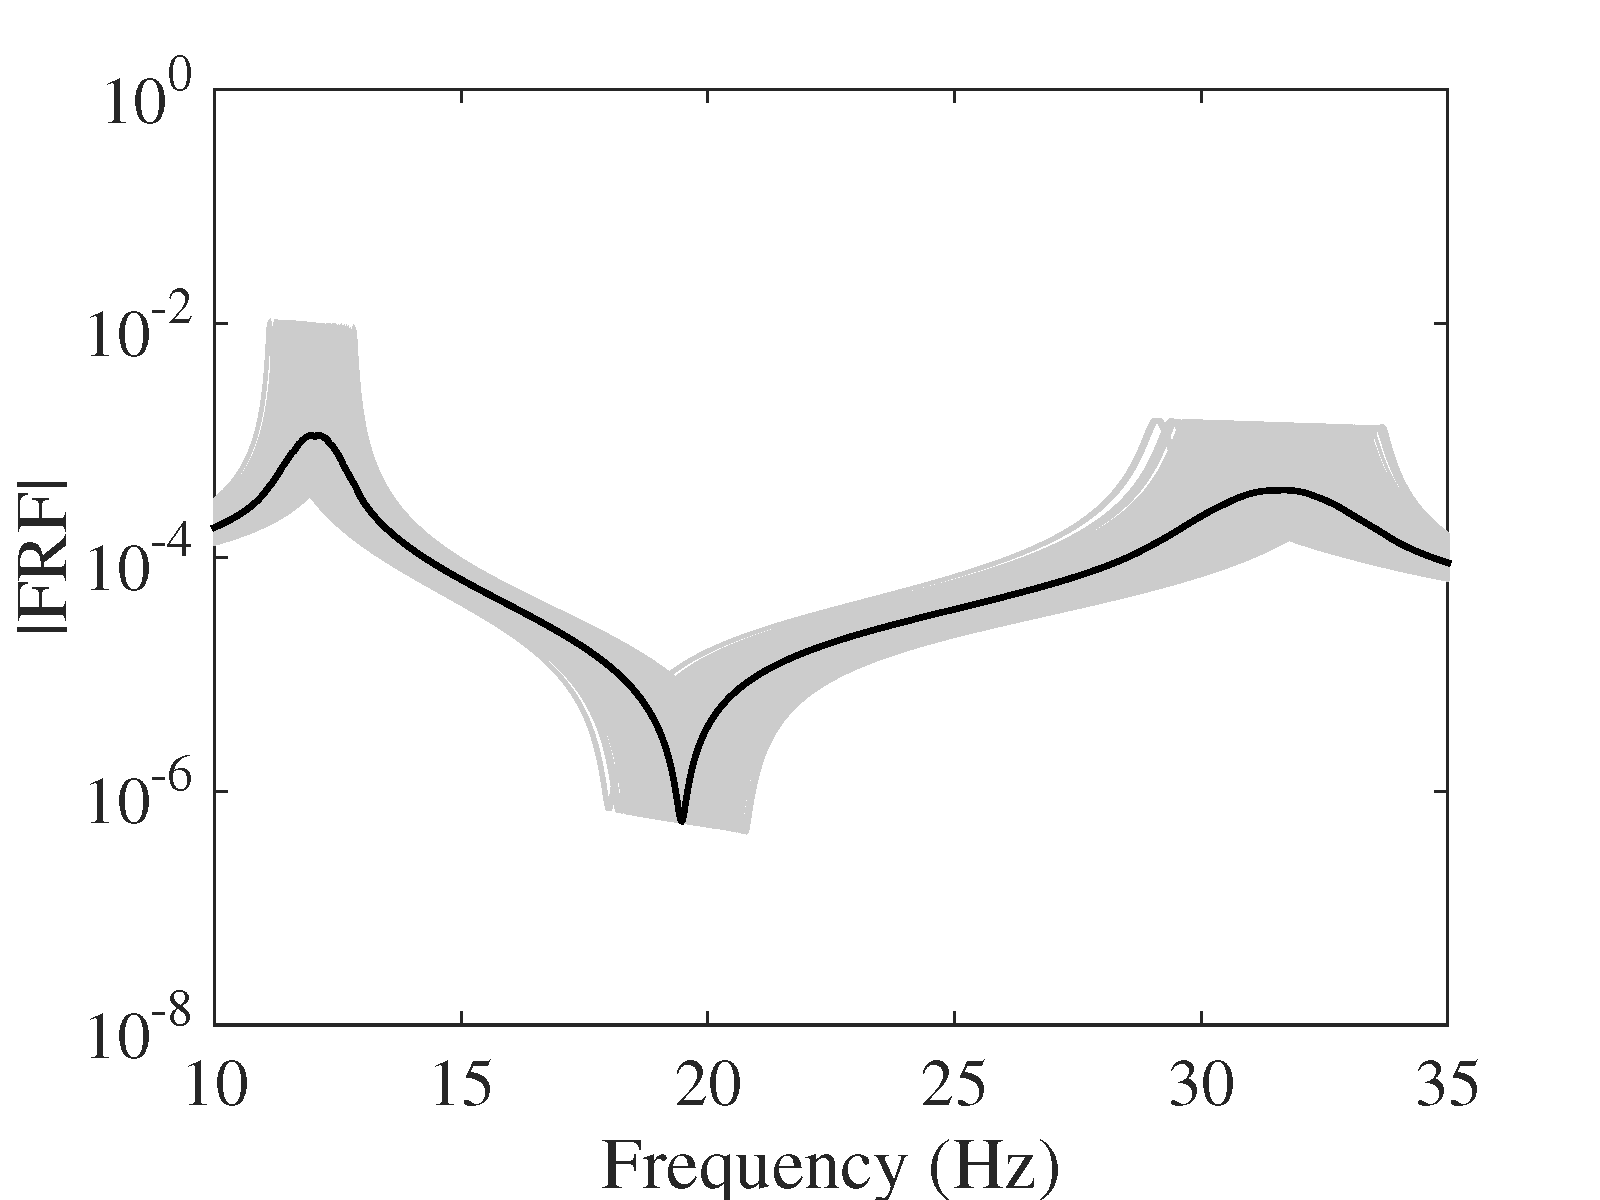
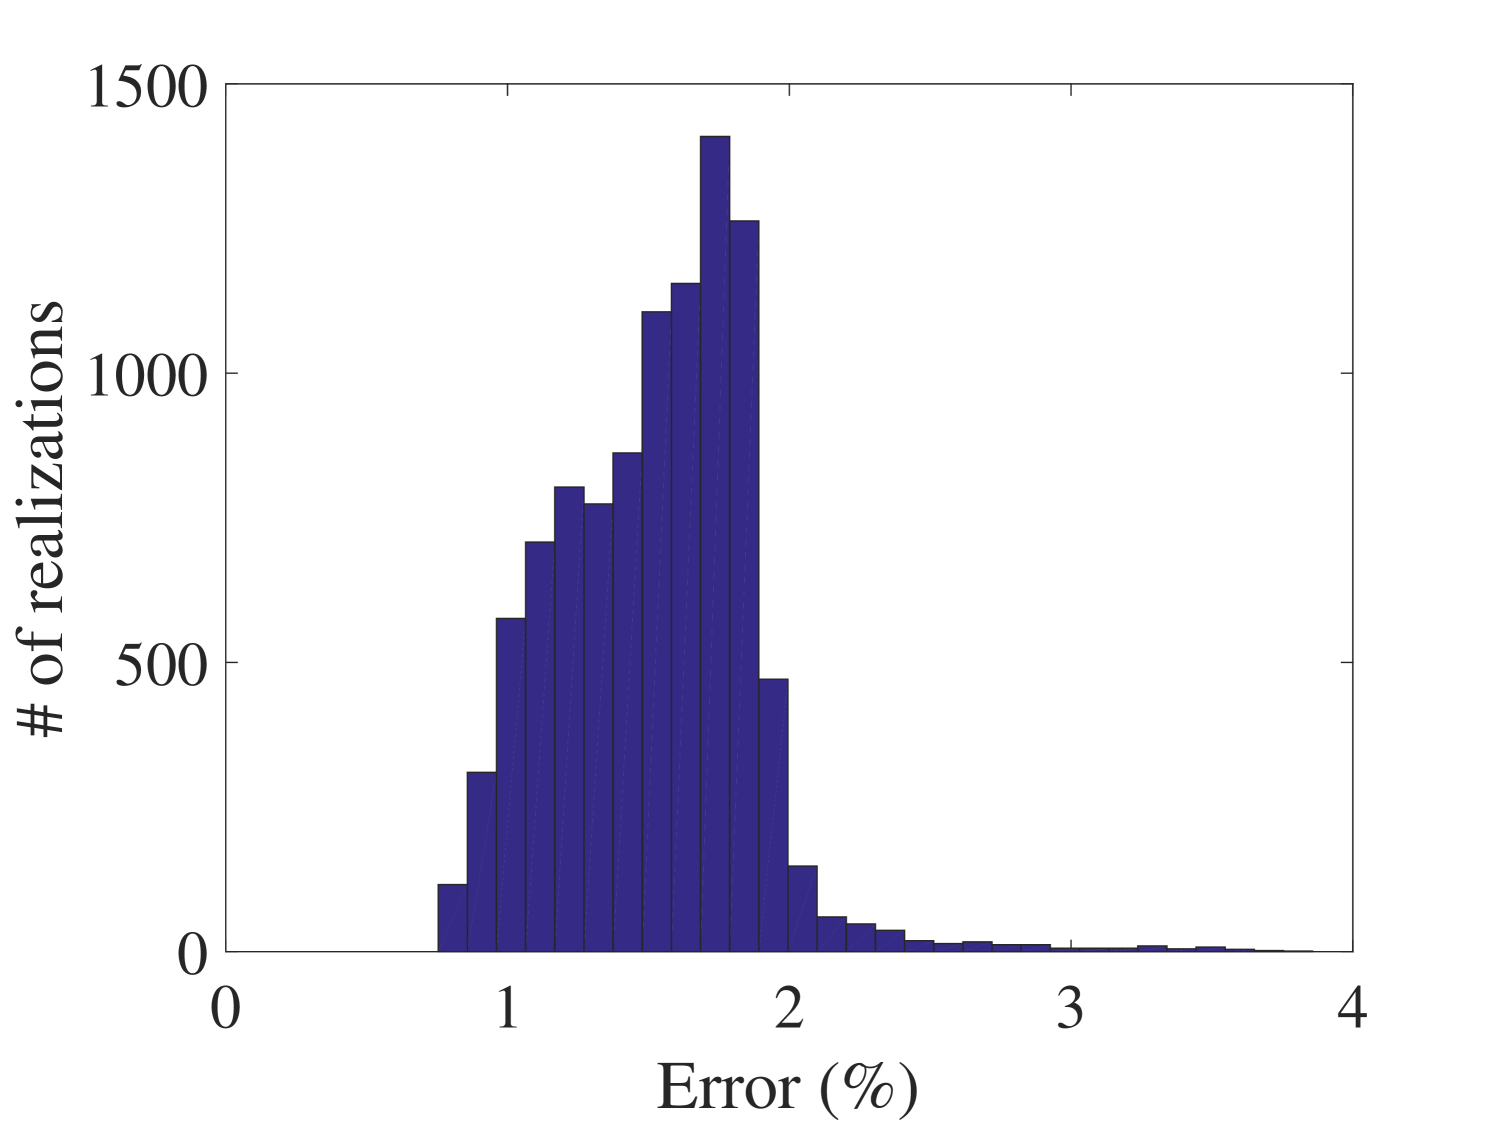
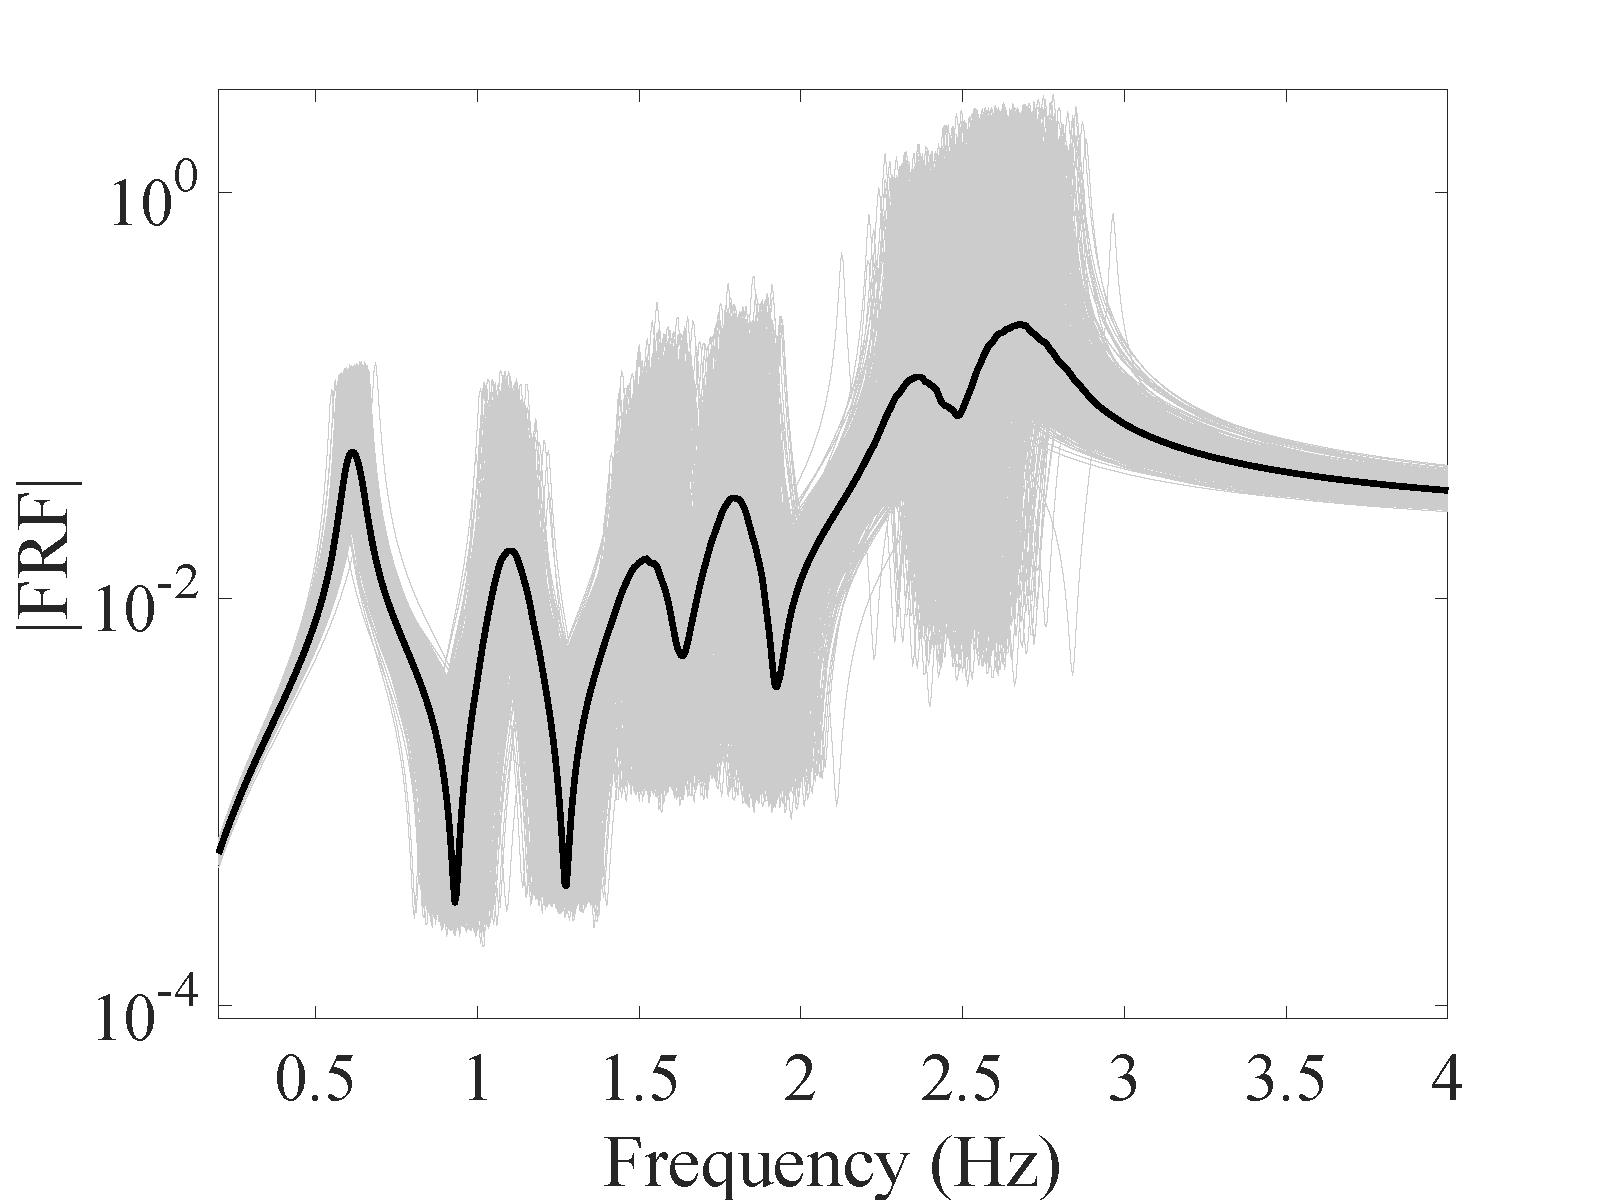
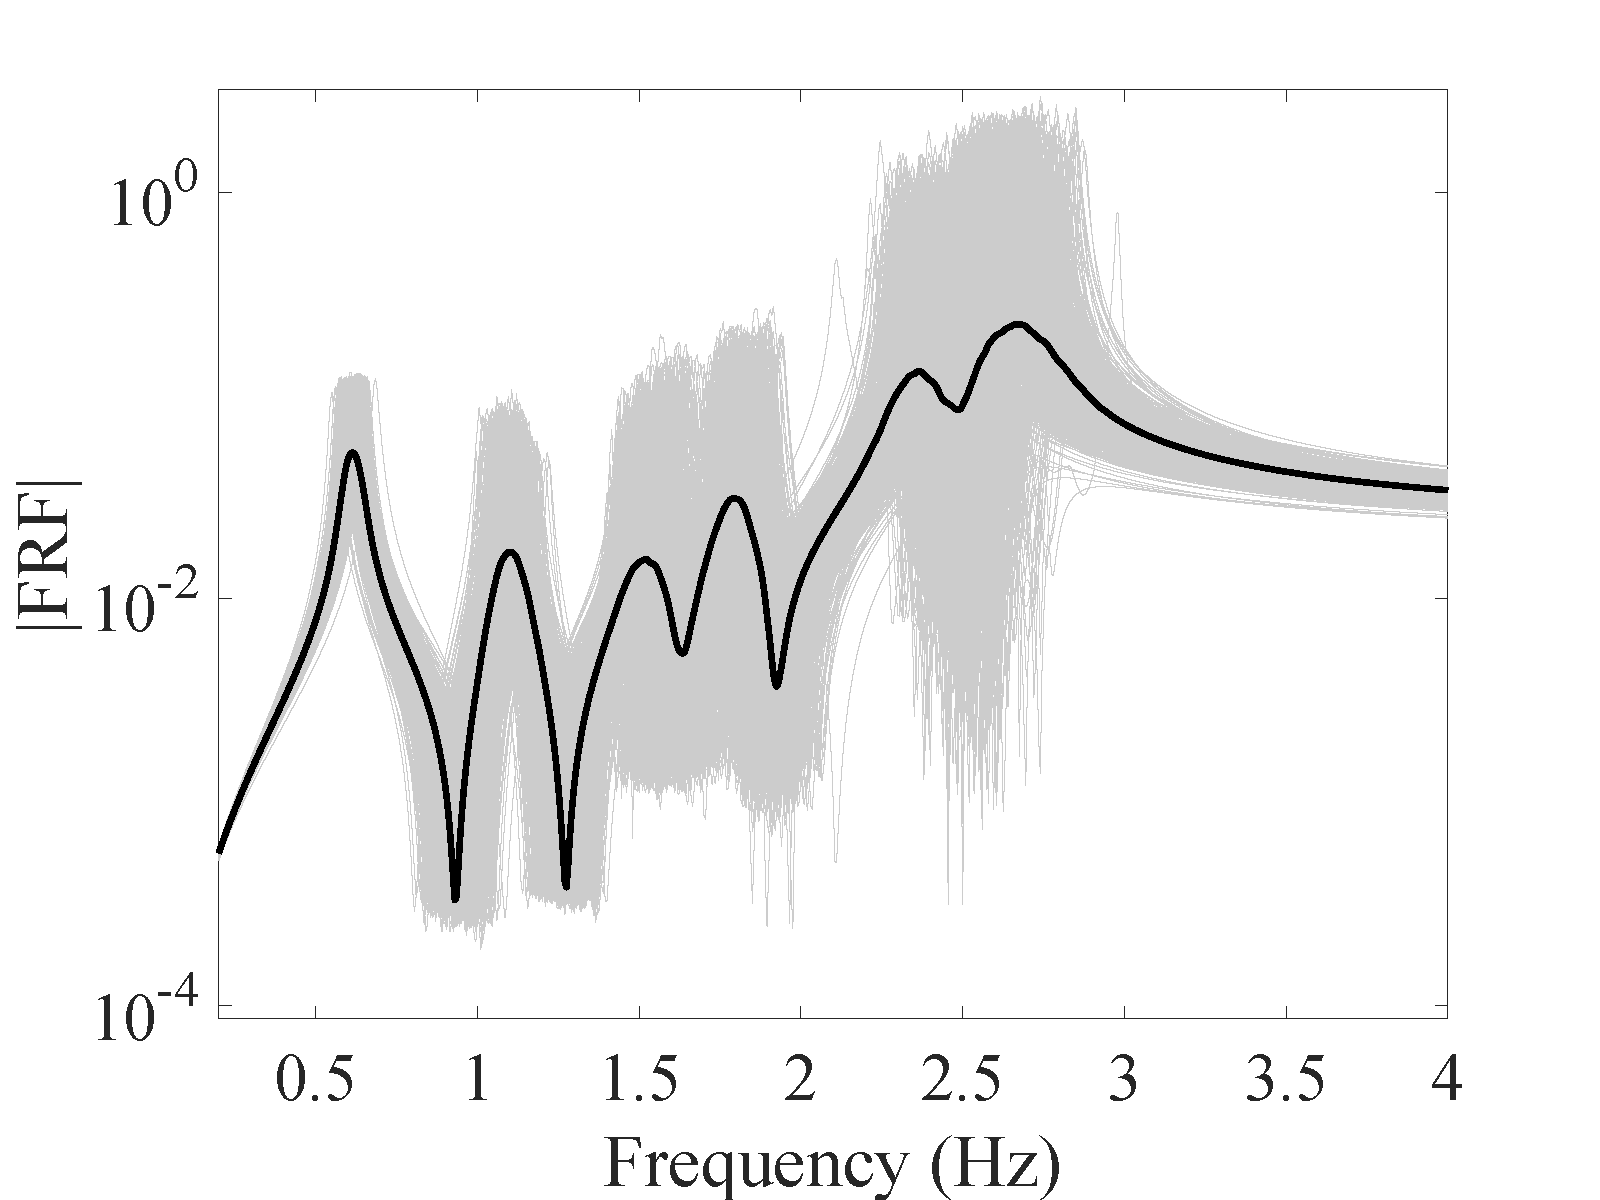
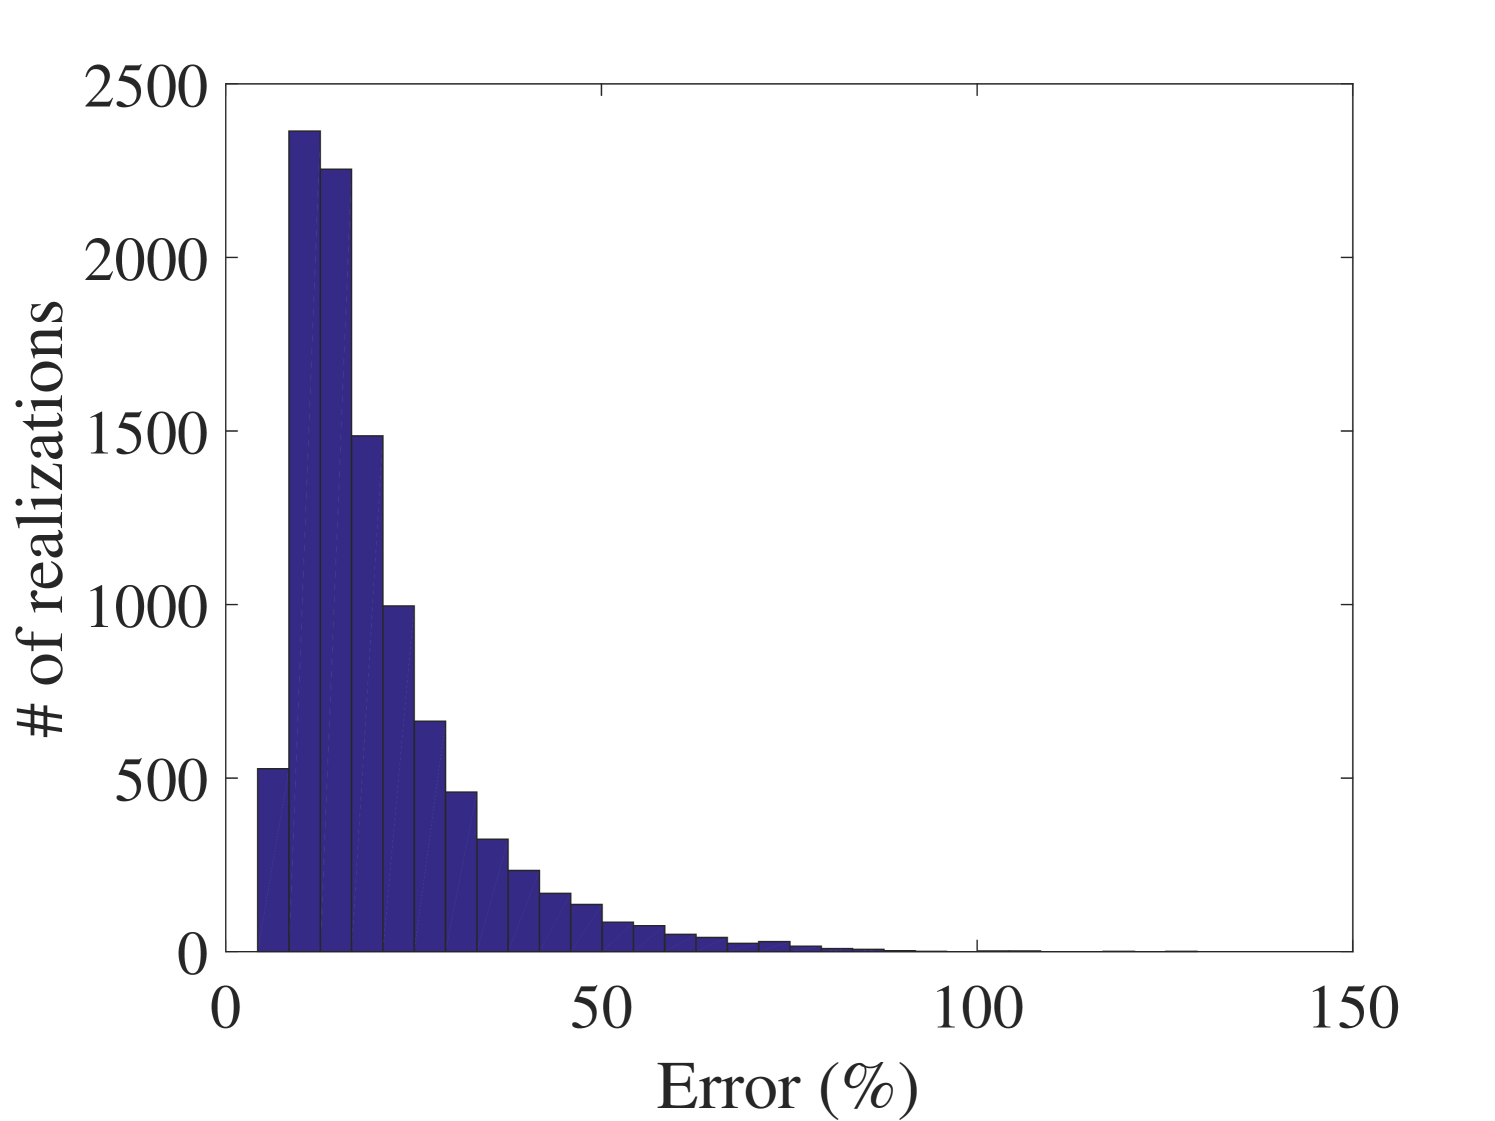
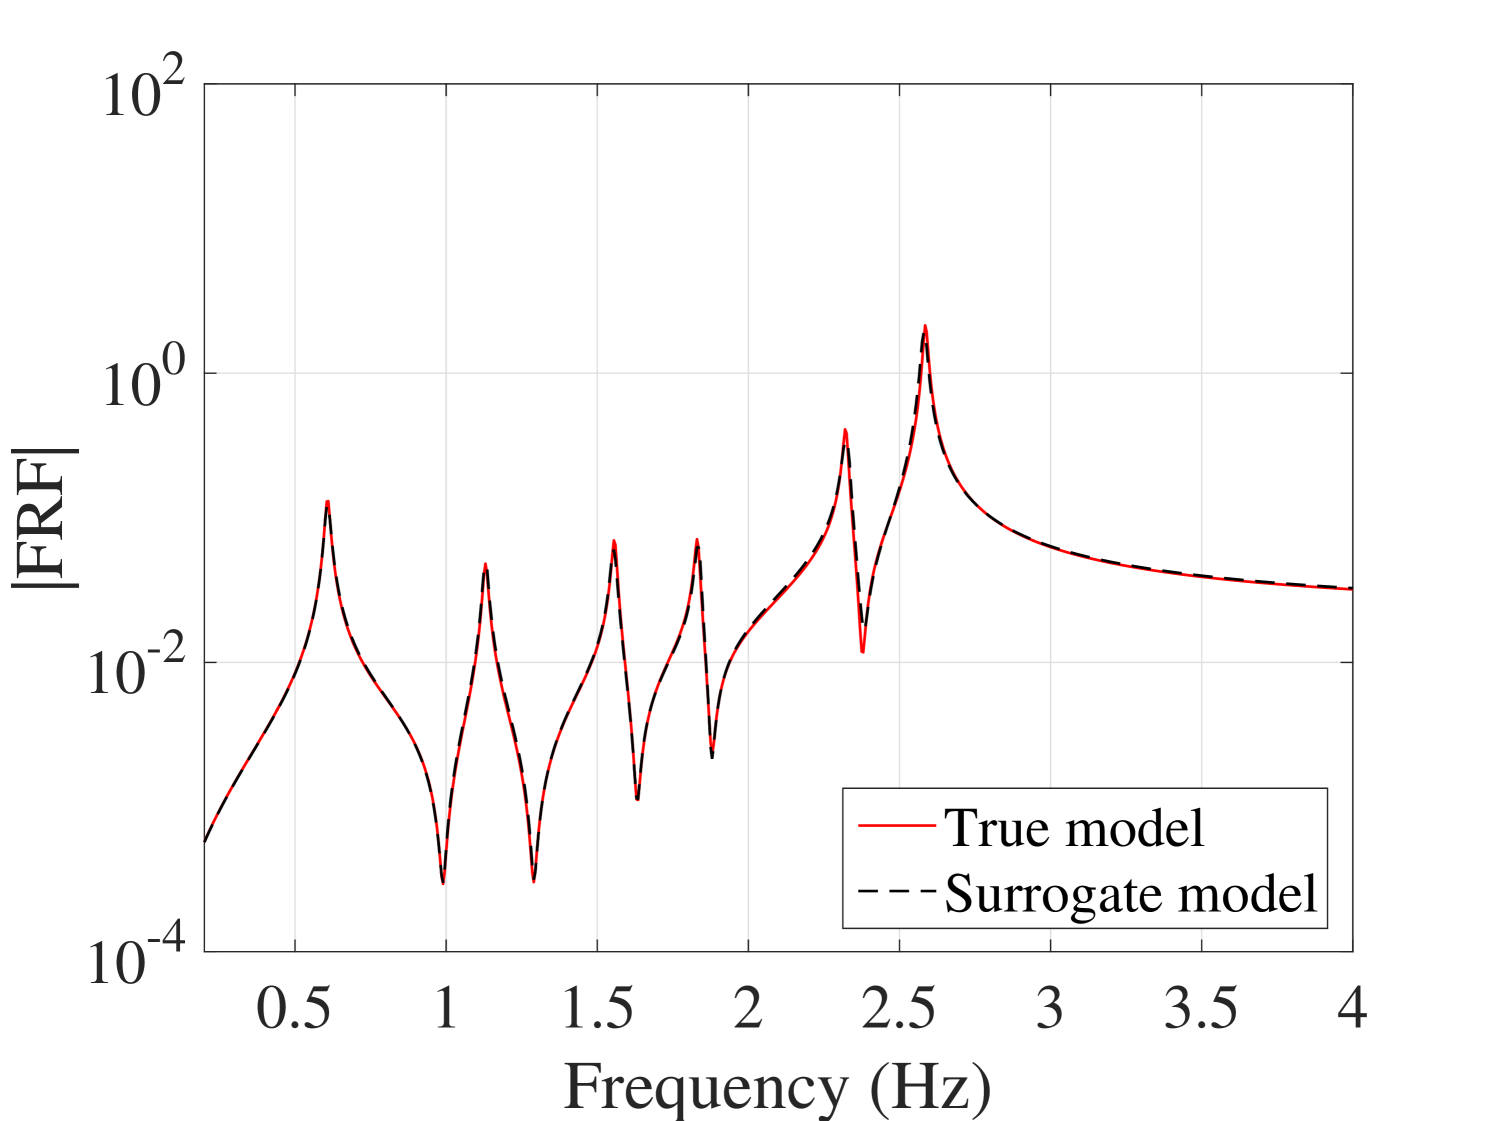
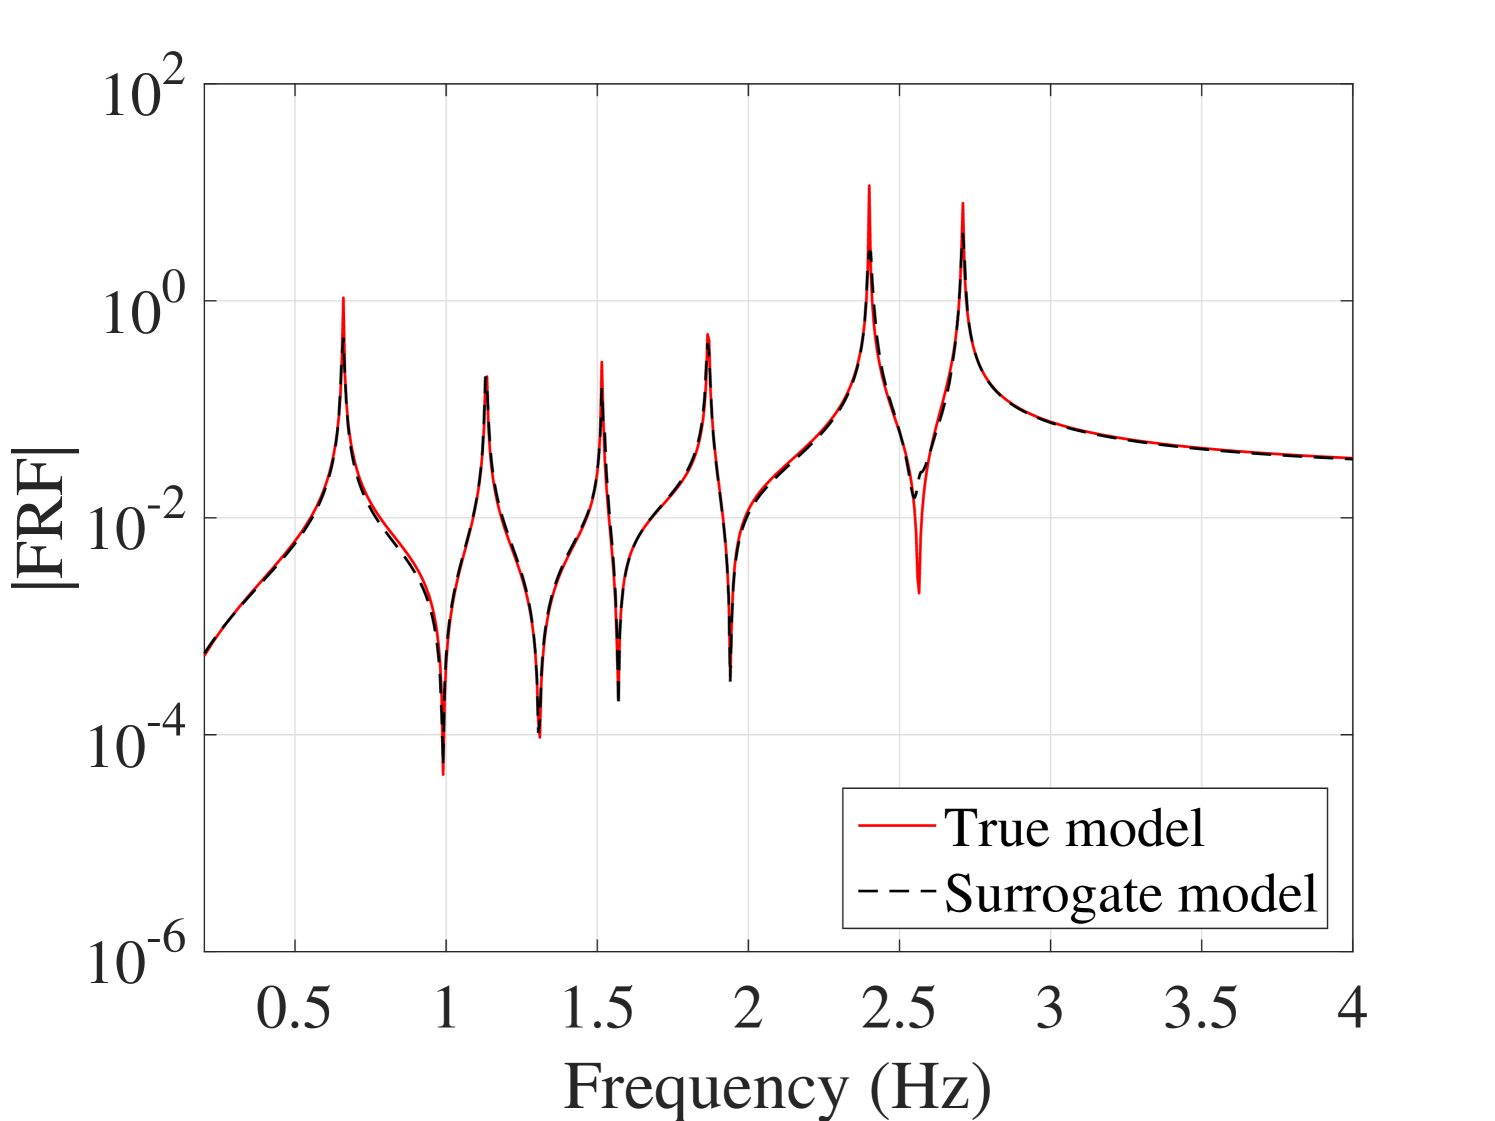
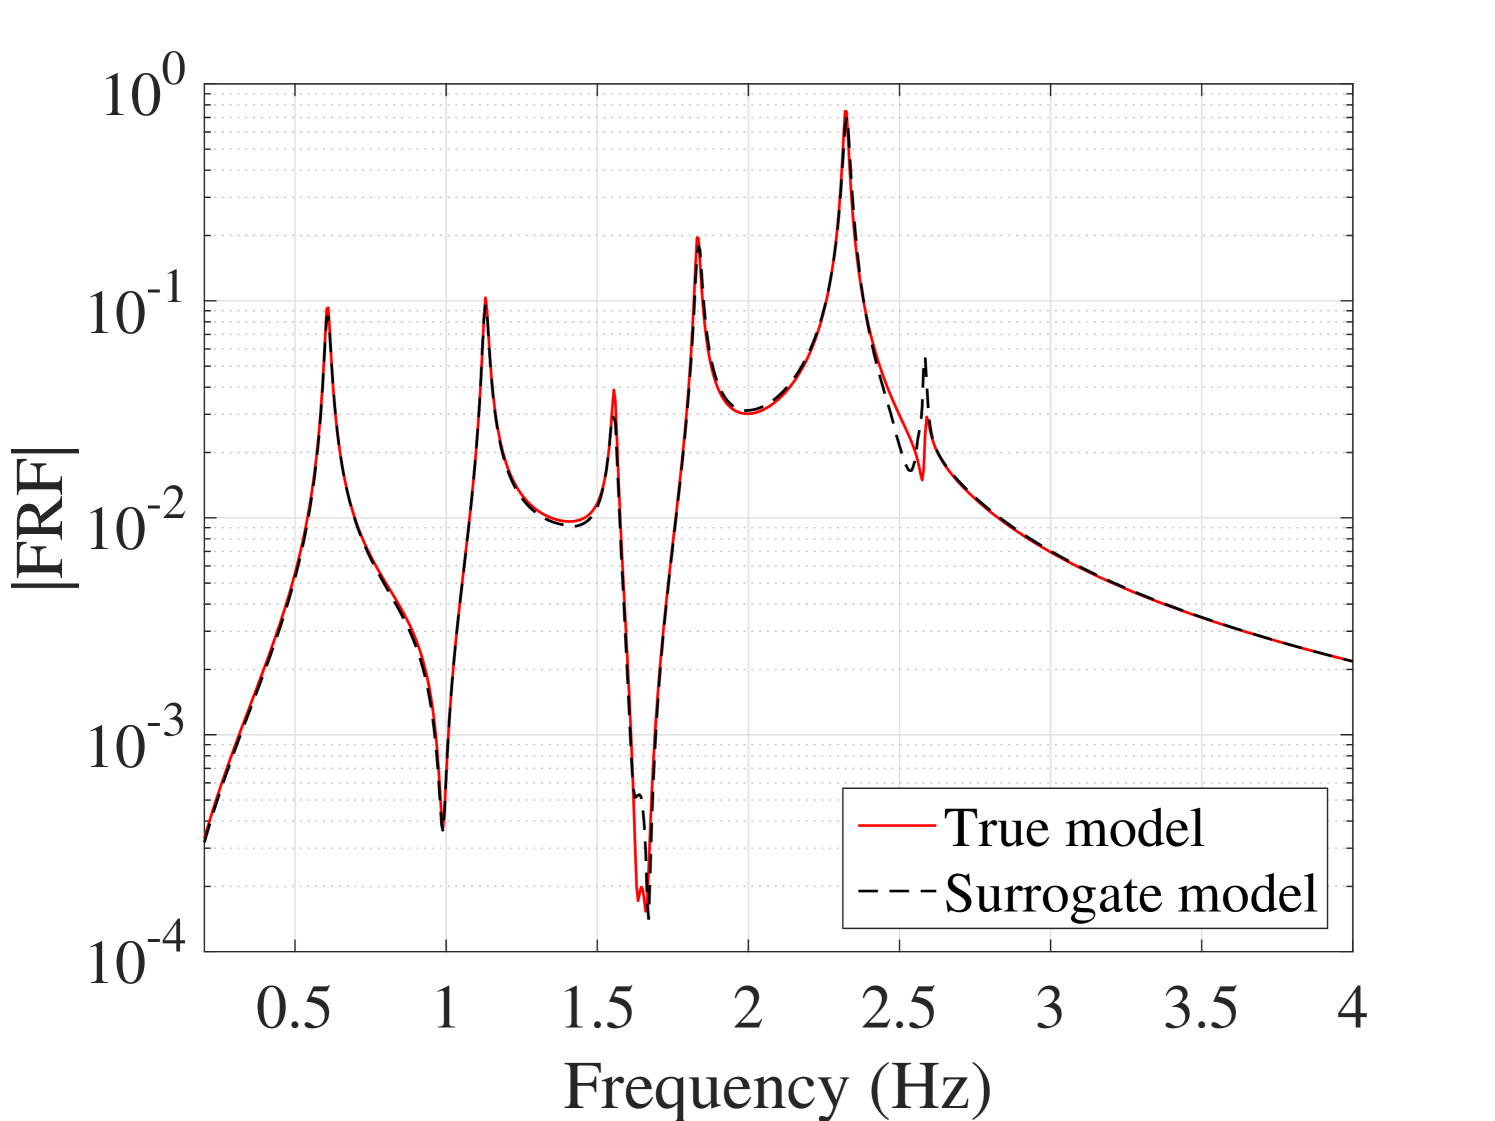
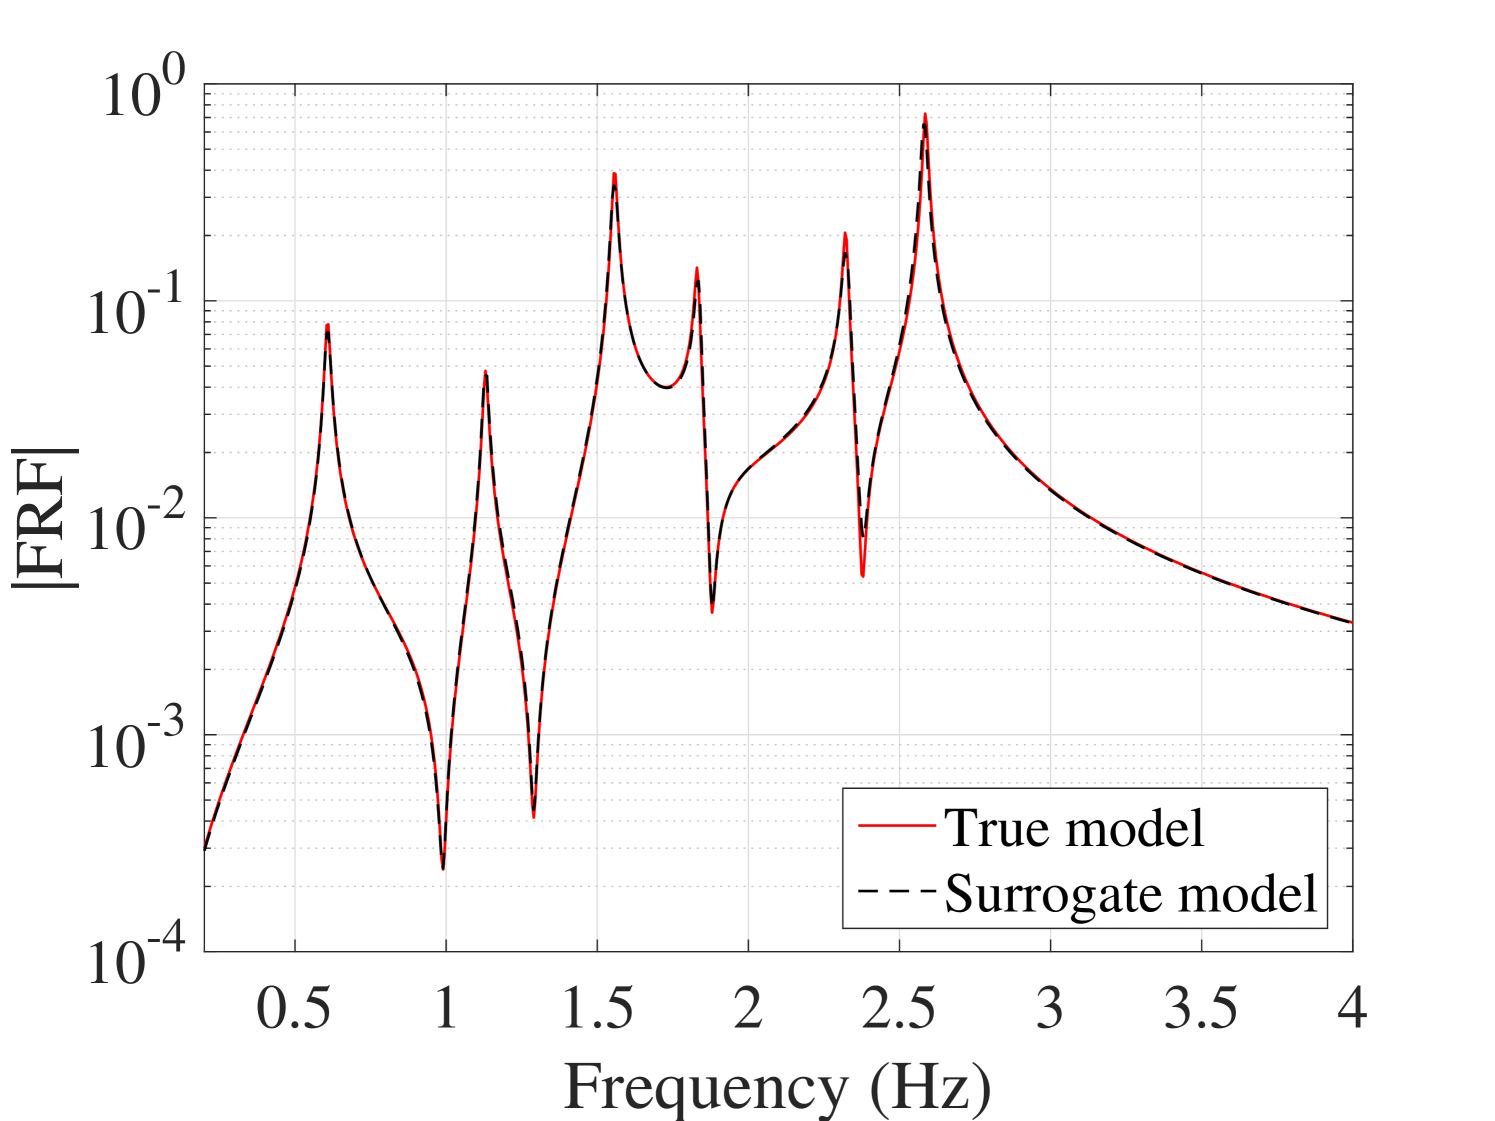
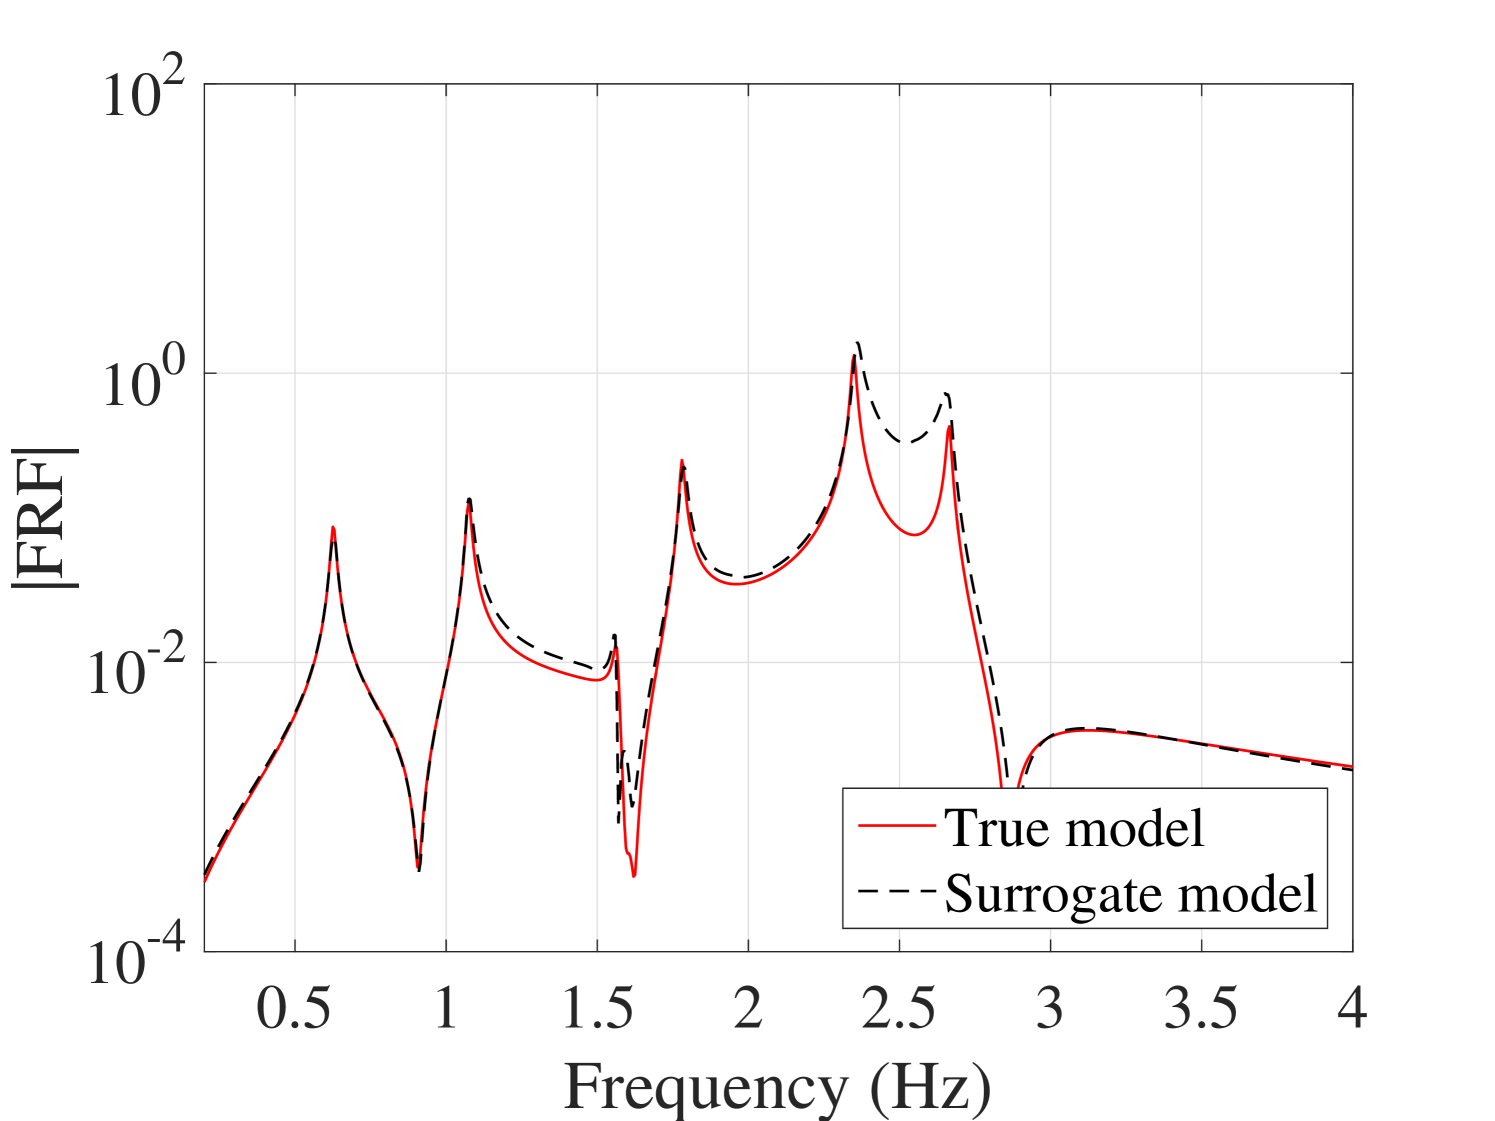
The 10,000 model evaluations used to produce the convergence curves in Figure 6 are also used to provide a detailed validation of the performance of the PCE surrogates on various quantities of interests. The results are presented in the following figures. In Figure 7, the selected frequencies obtained by the PCE are shown versus the true ones. The results show that the PCE model accurately predicts the selected frequencies. Since the amplitudes at the resonant frequencies are the most sensitive parts of the FRFs and contains most of crucial information about the system, it is one of the most interesting parts of the FRFs for the researcher. Figure 8 shows the histograms of these amplitudes obtained by the true and the surrogate models at at all 10,000 validation points. Moreover, in Figure 9, the whole FRFs at the validation points are depicted and compared. Their associated means are also shown by black lines. The results indicate accurate prediction of the amplitude at the resonant frequencies as well as the whole FRFs. A quantitative accuracy analysis for the whole FRF was done by using Eq. (24) and its histogram presented in Figure 10 confirms the high accuracy of the surrogate model.
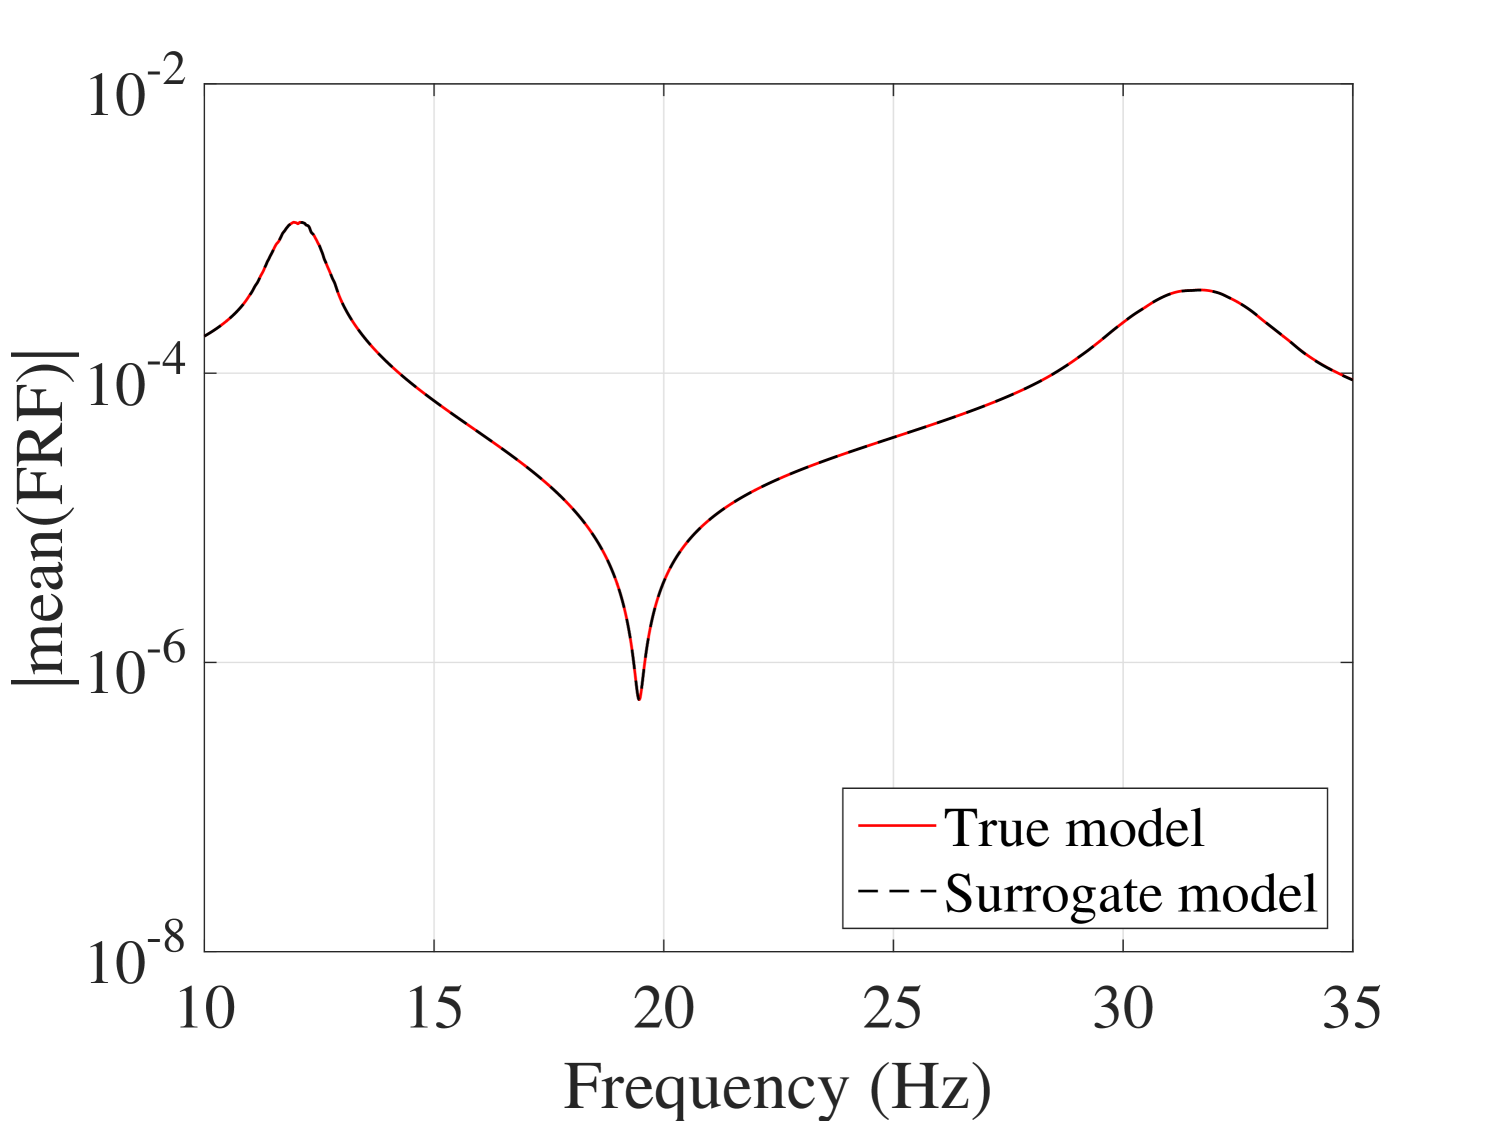
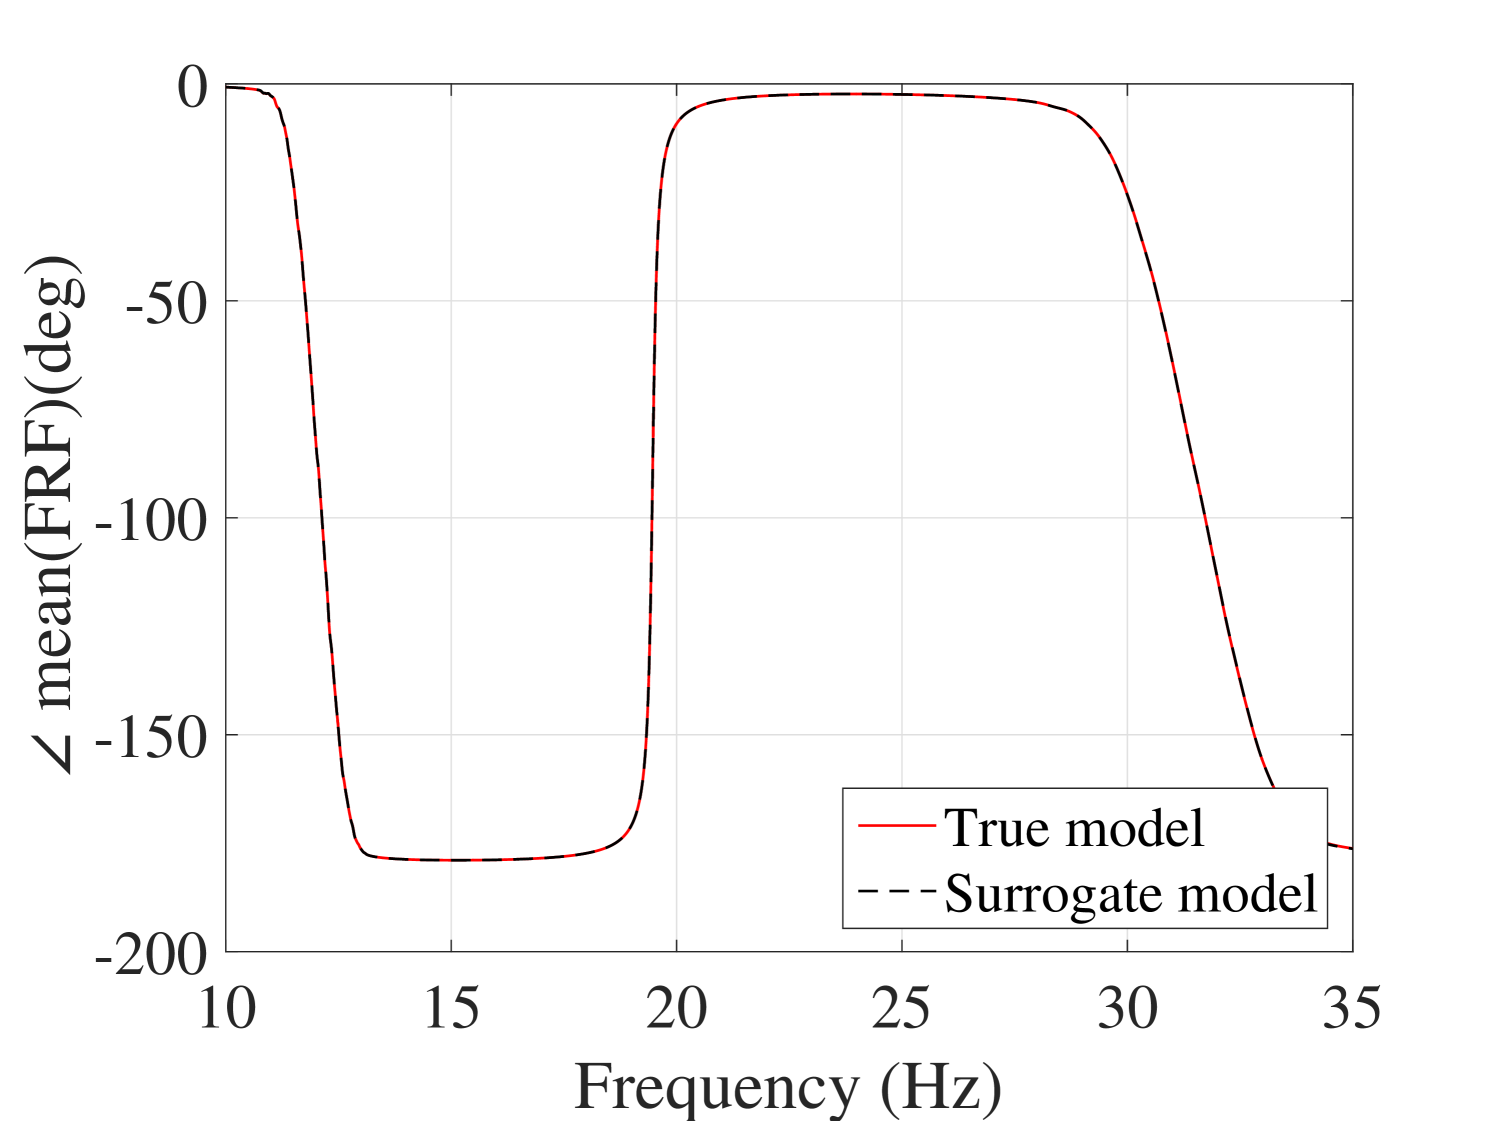
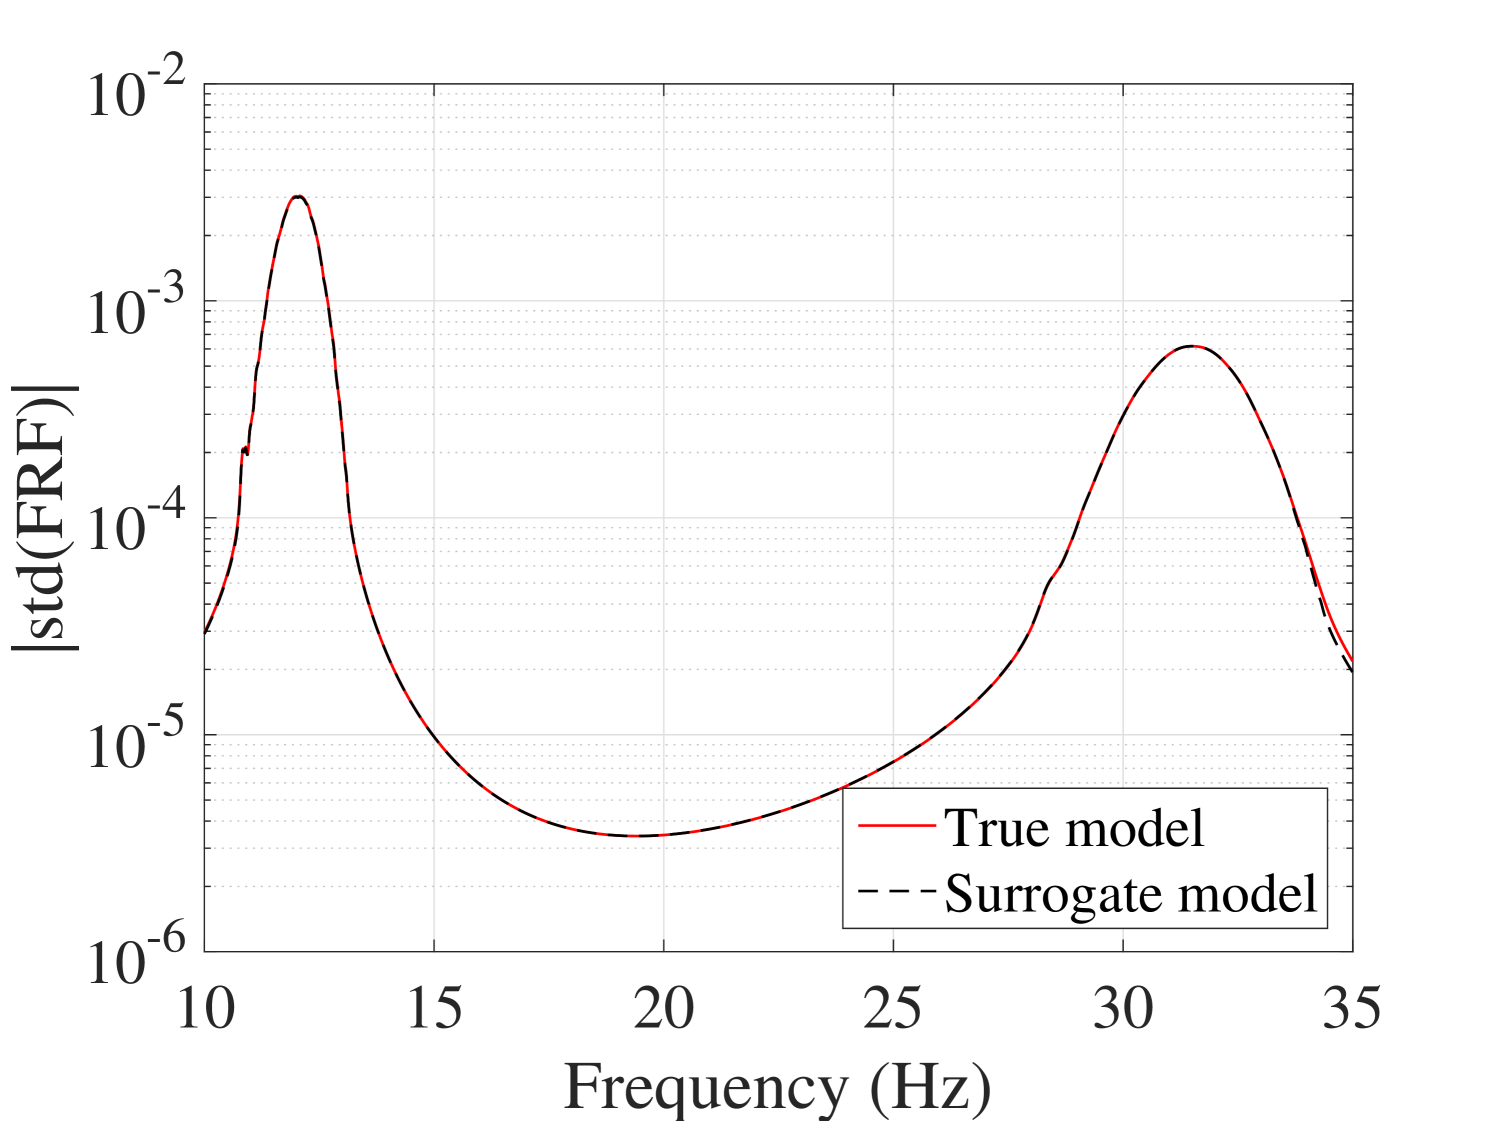
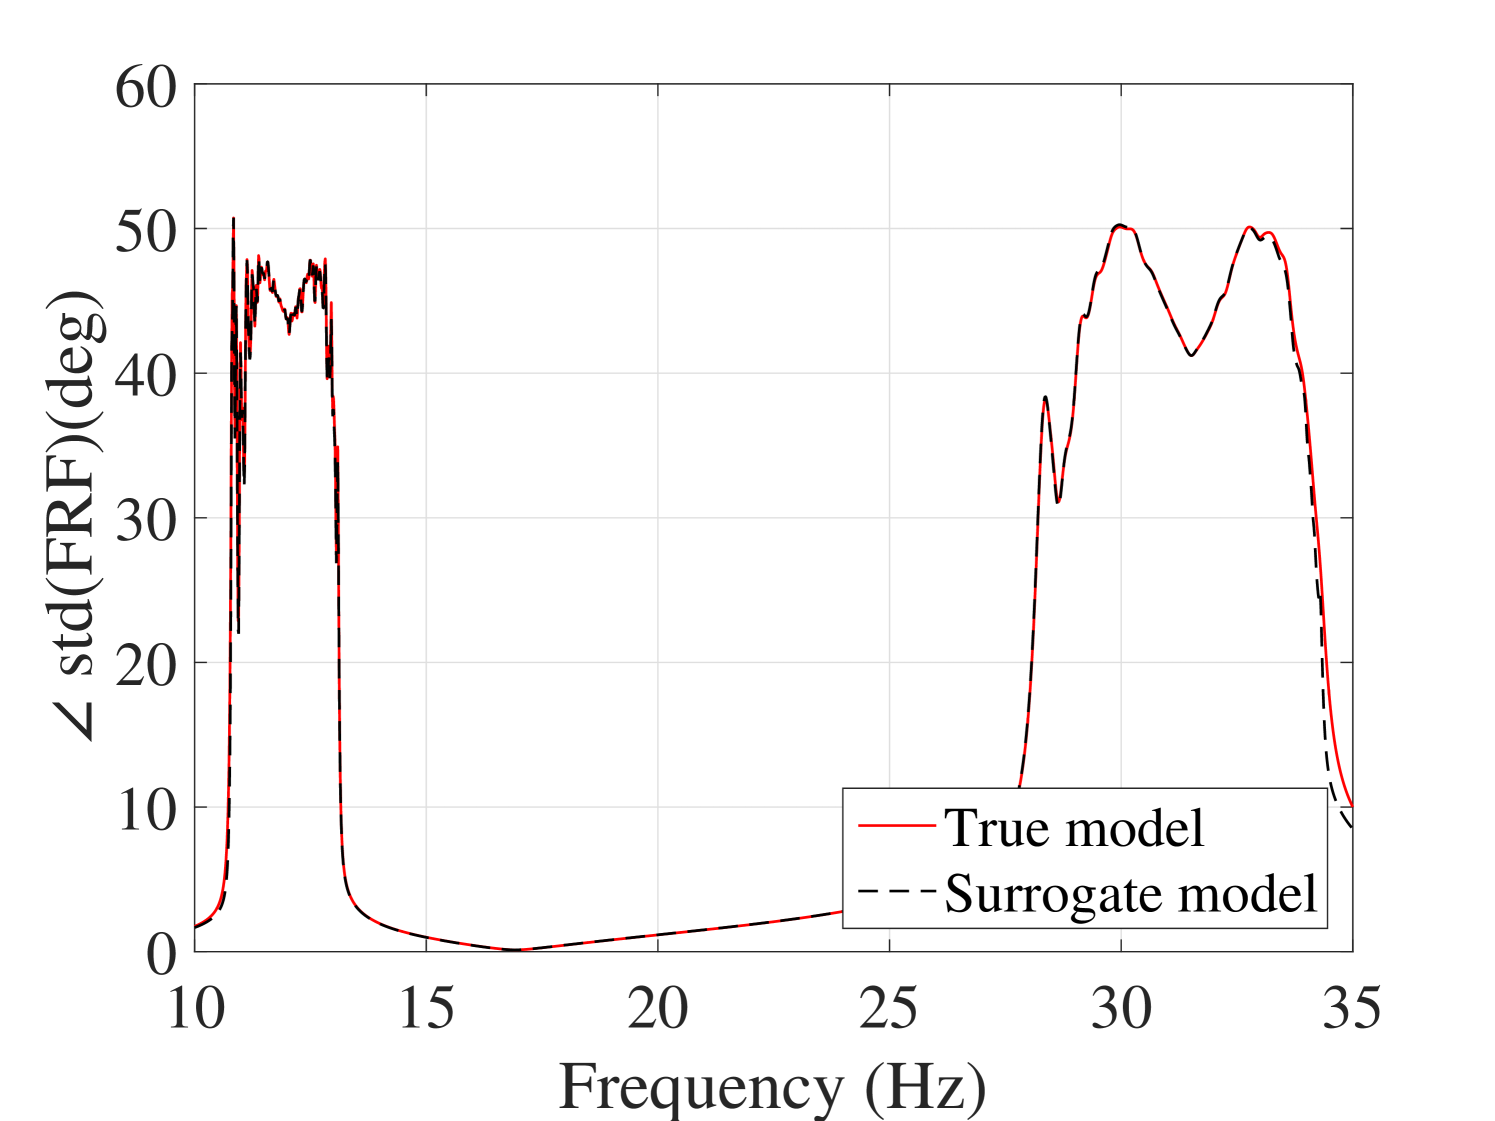
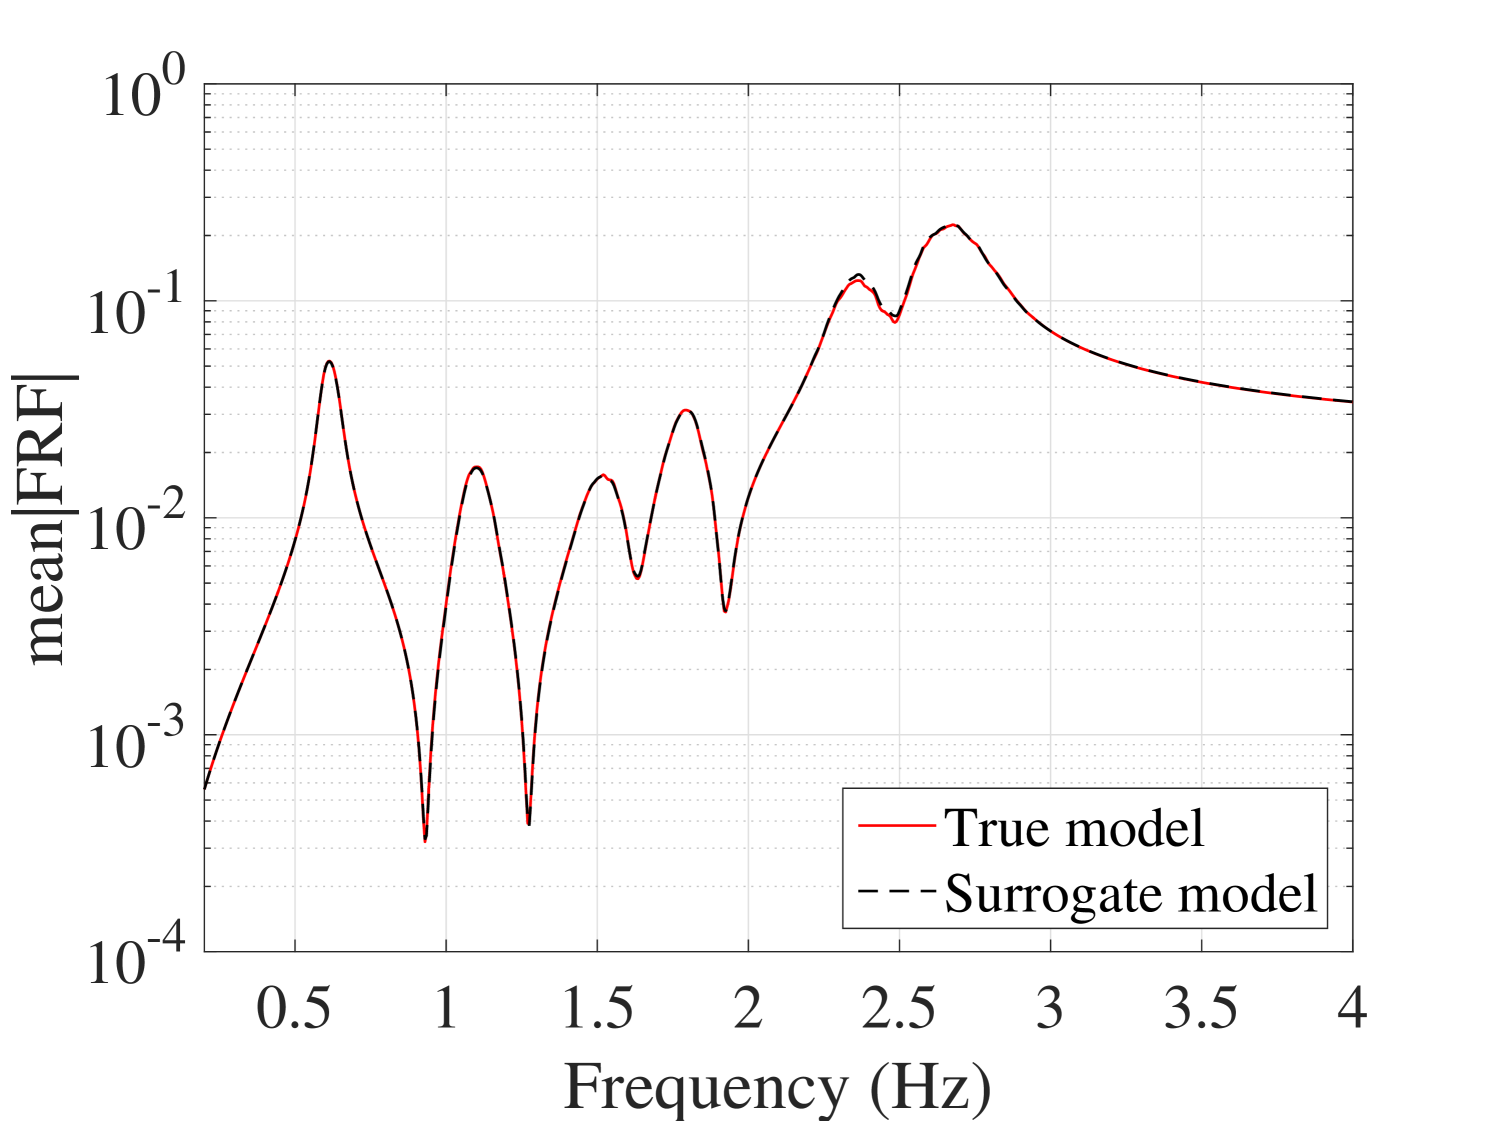
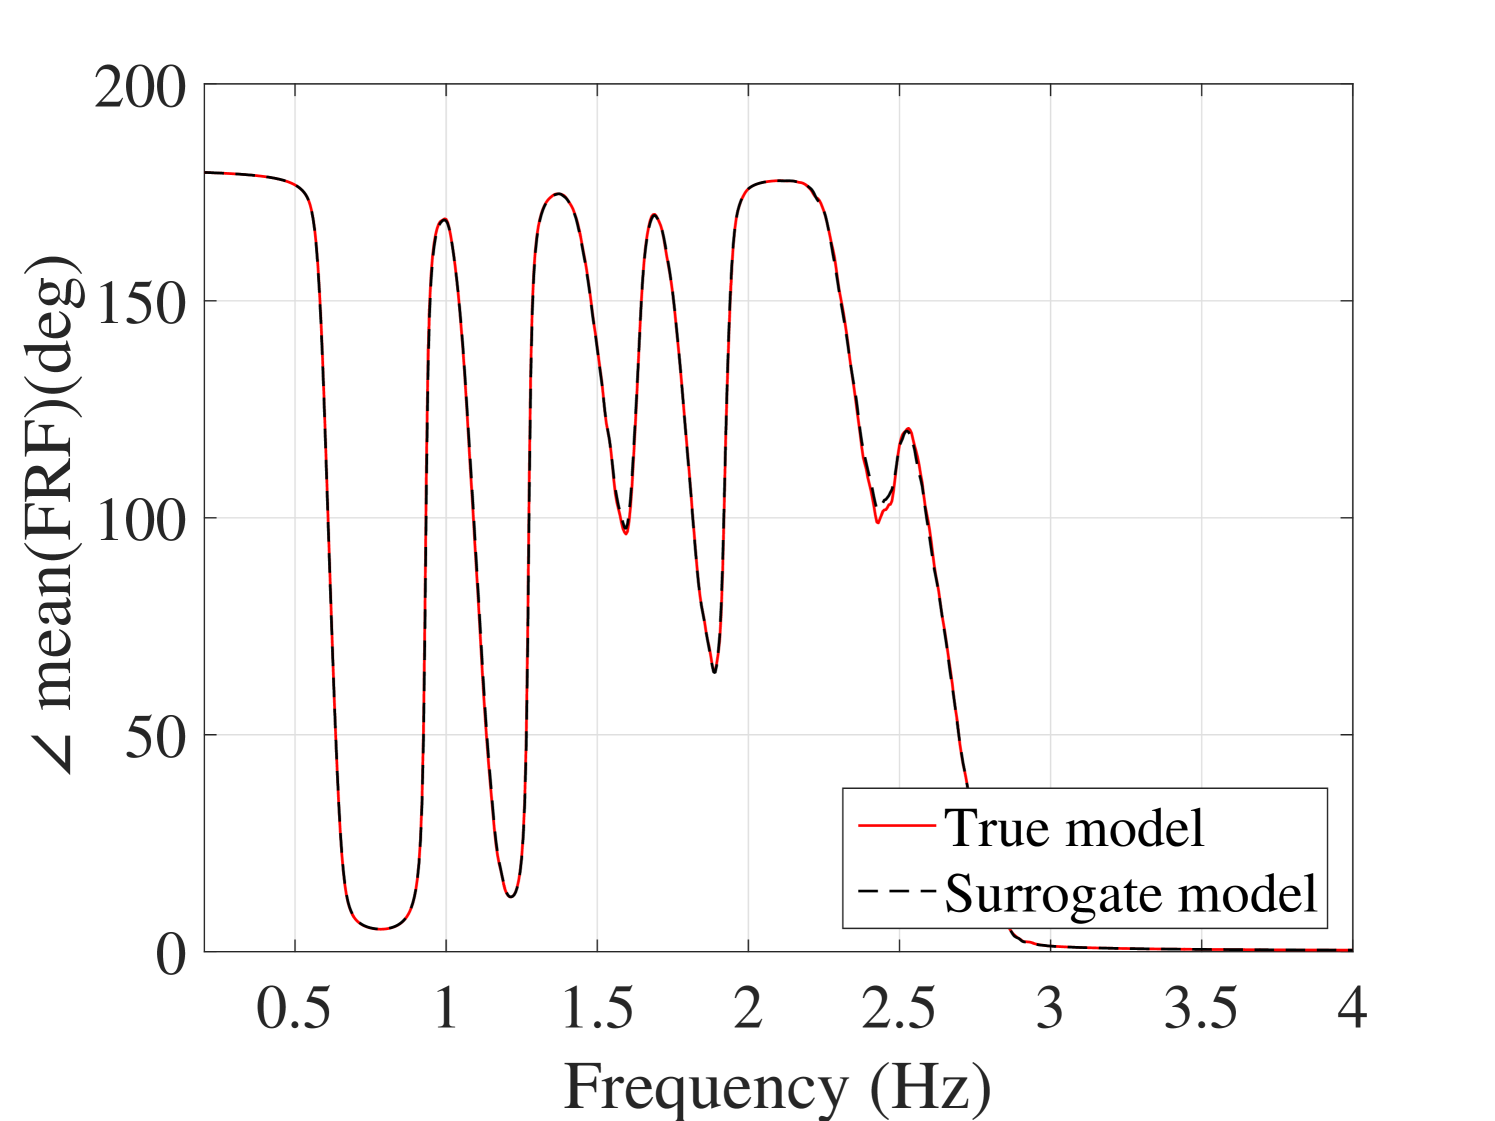
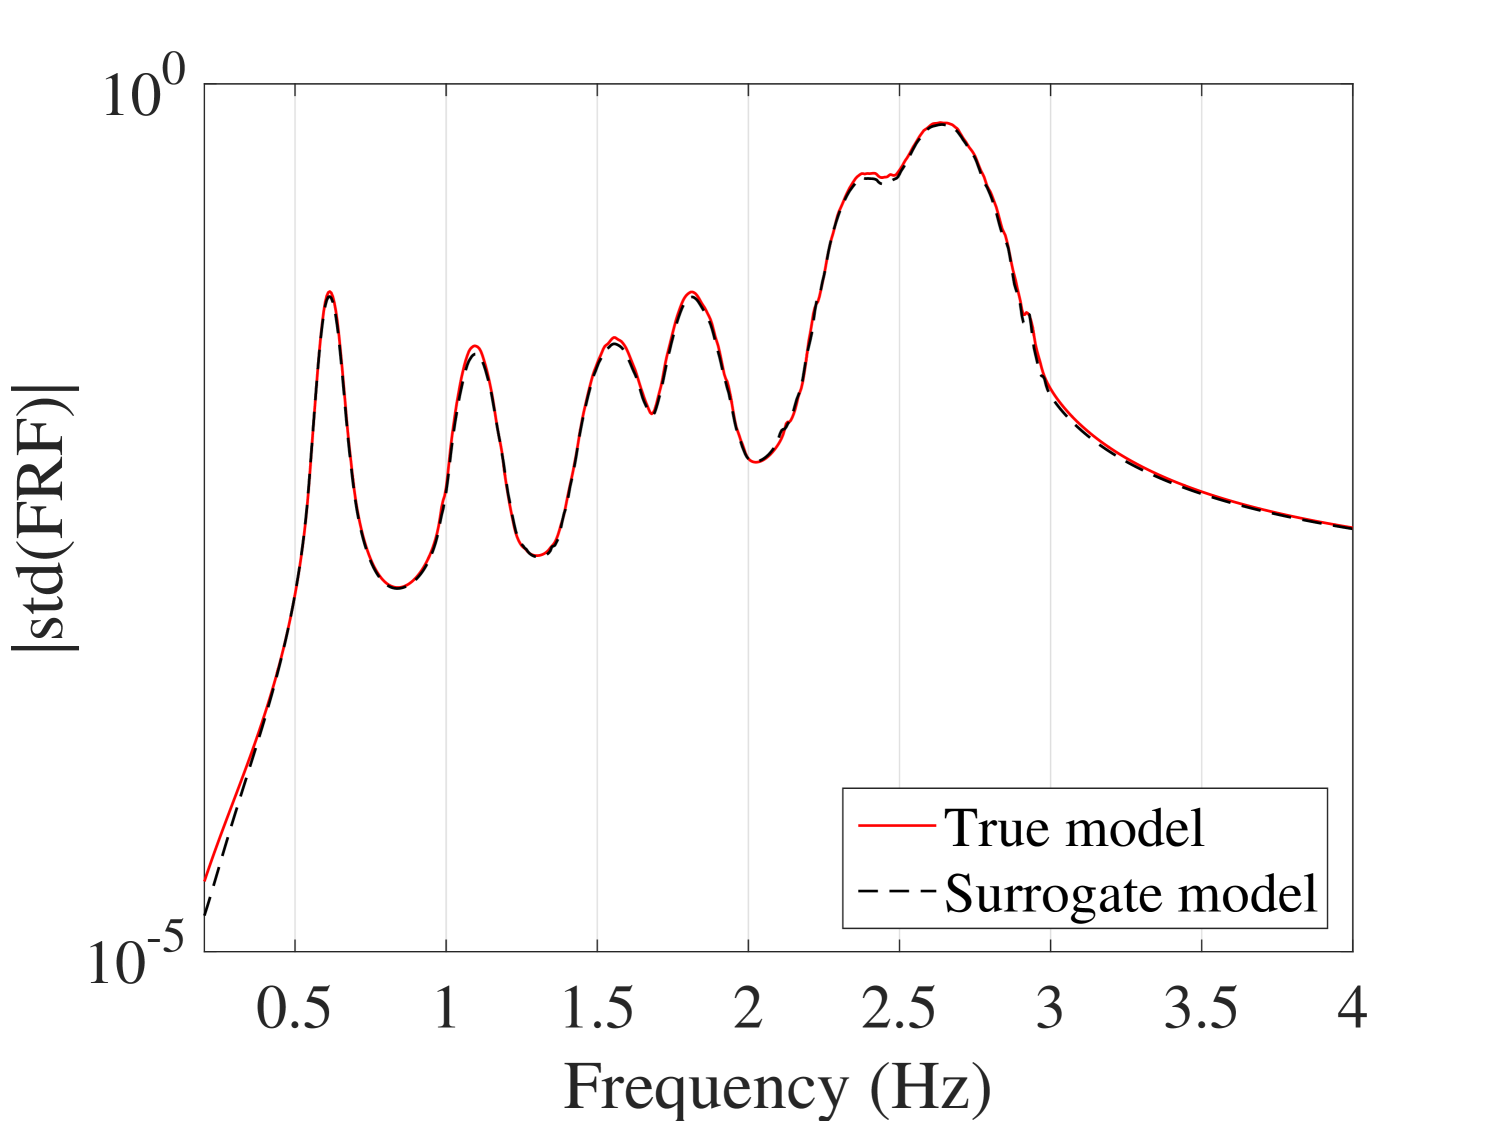
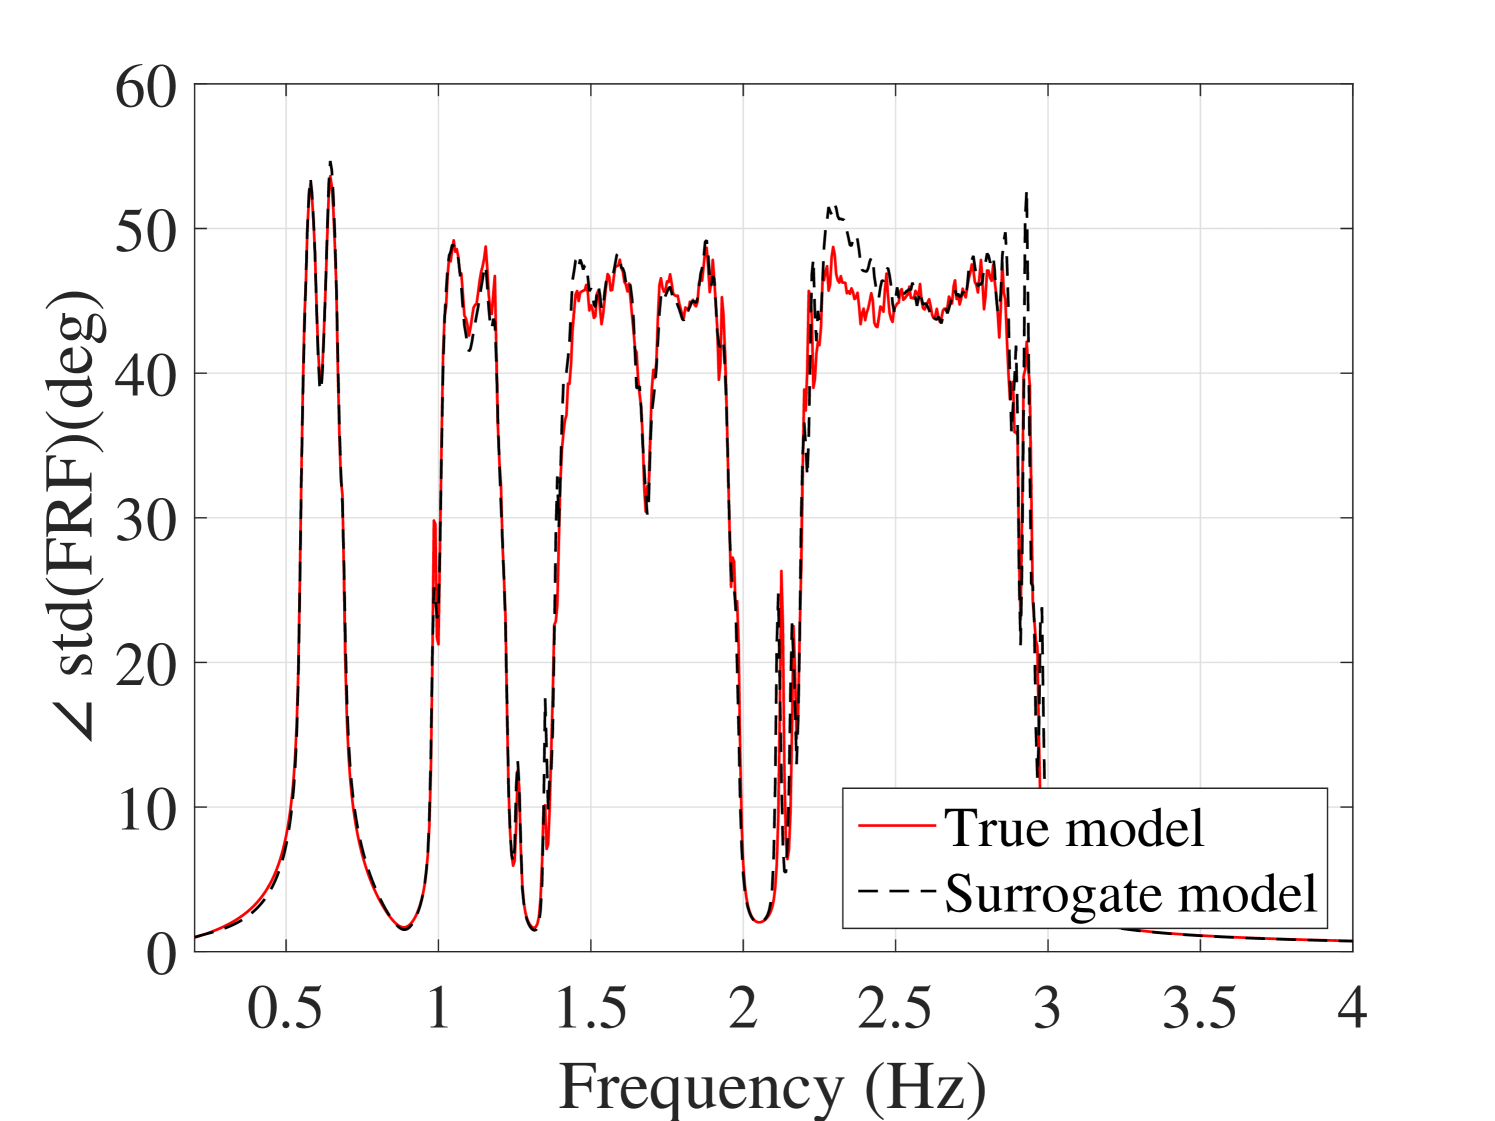
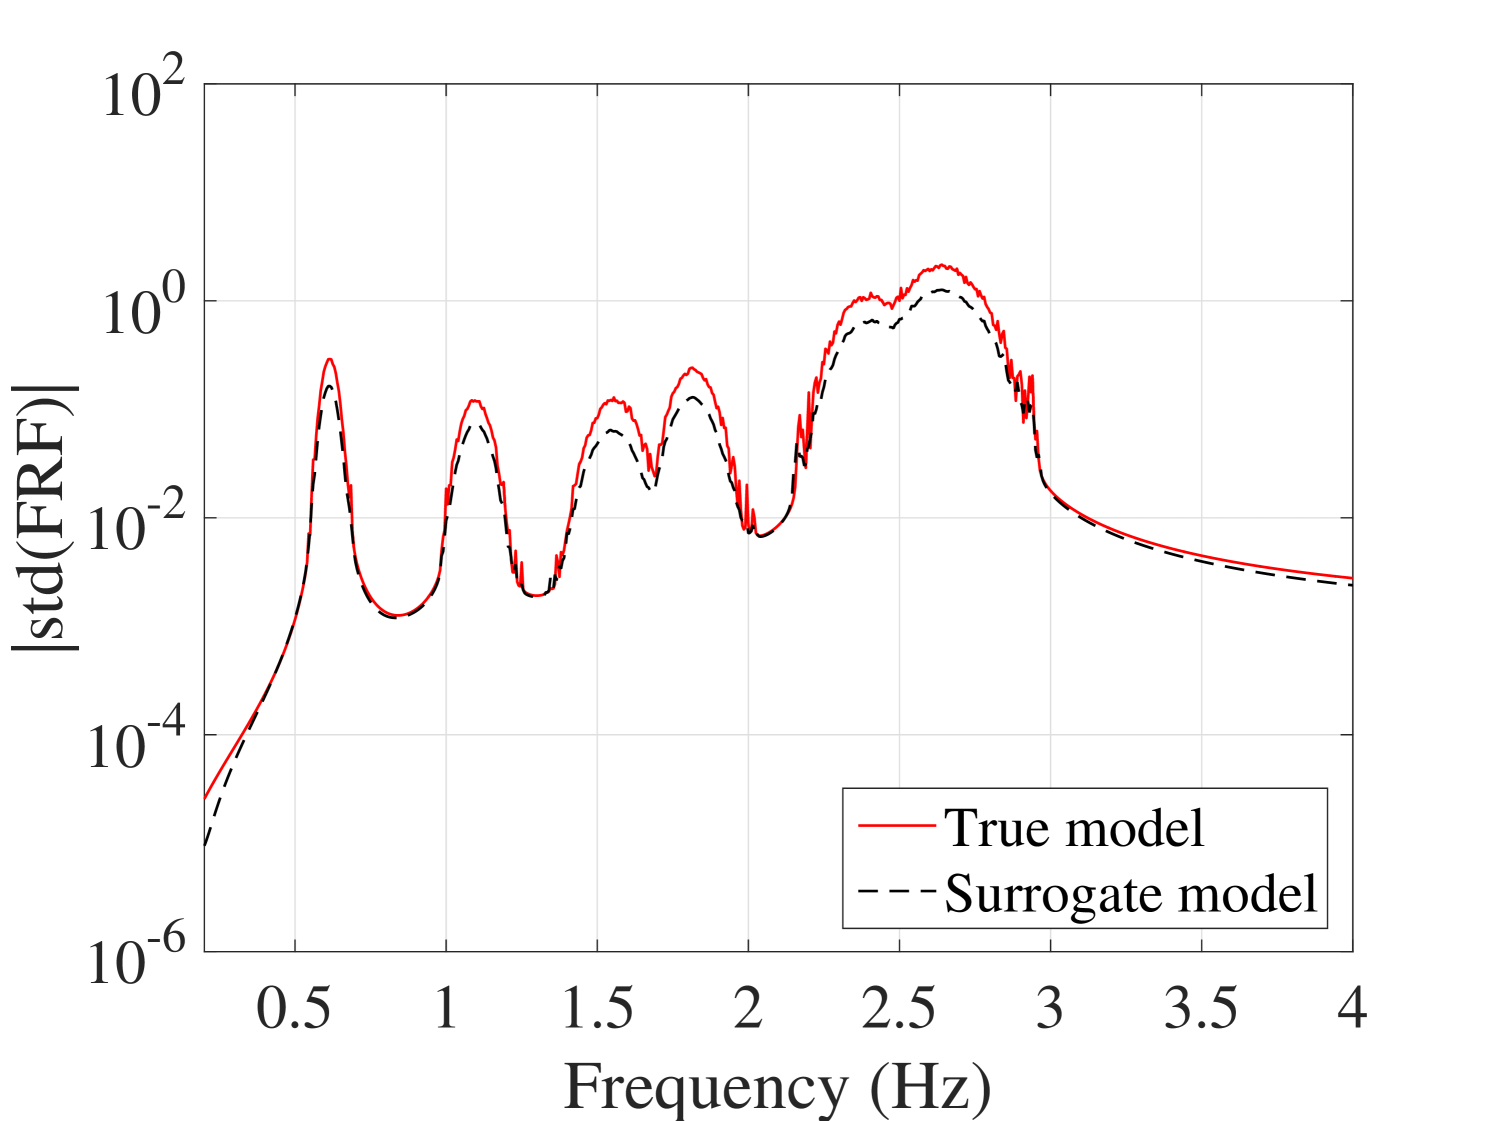
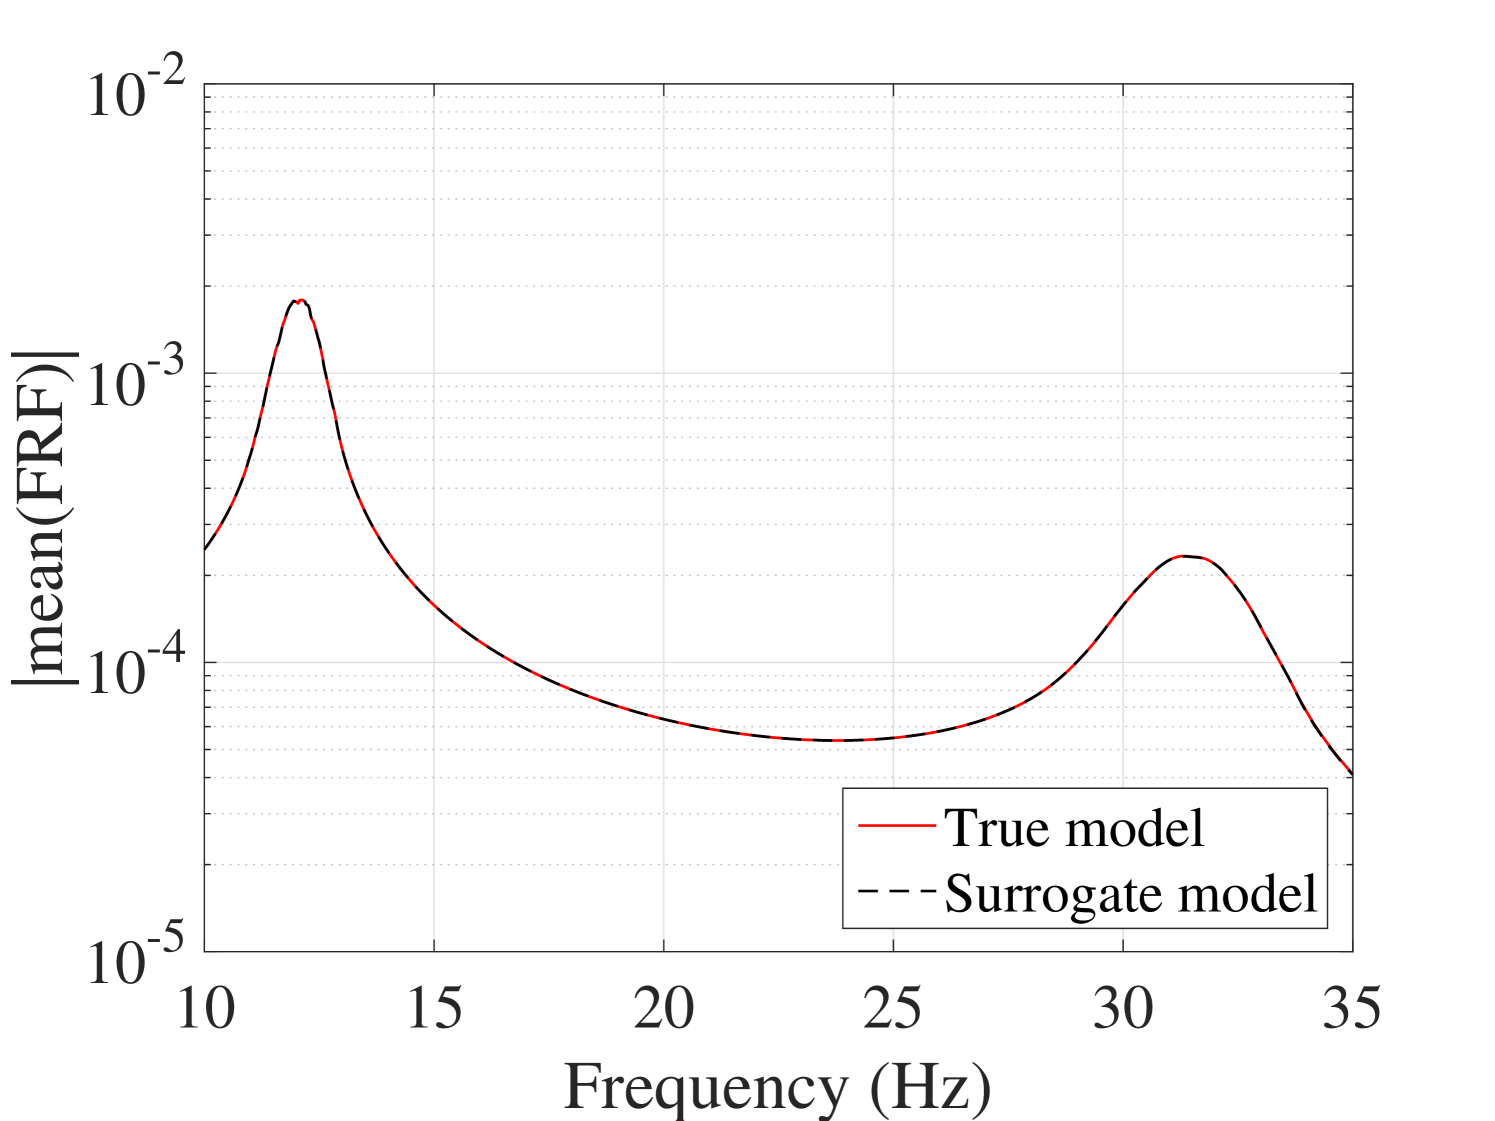
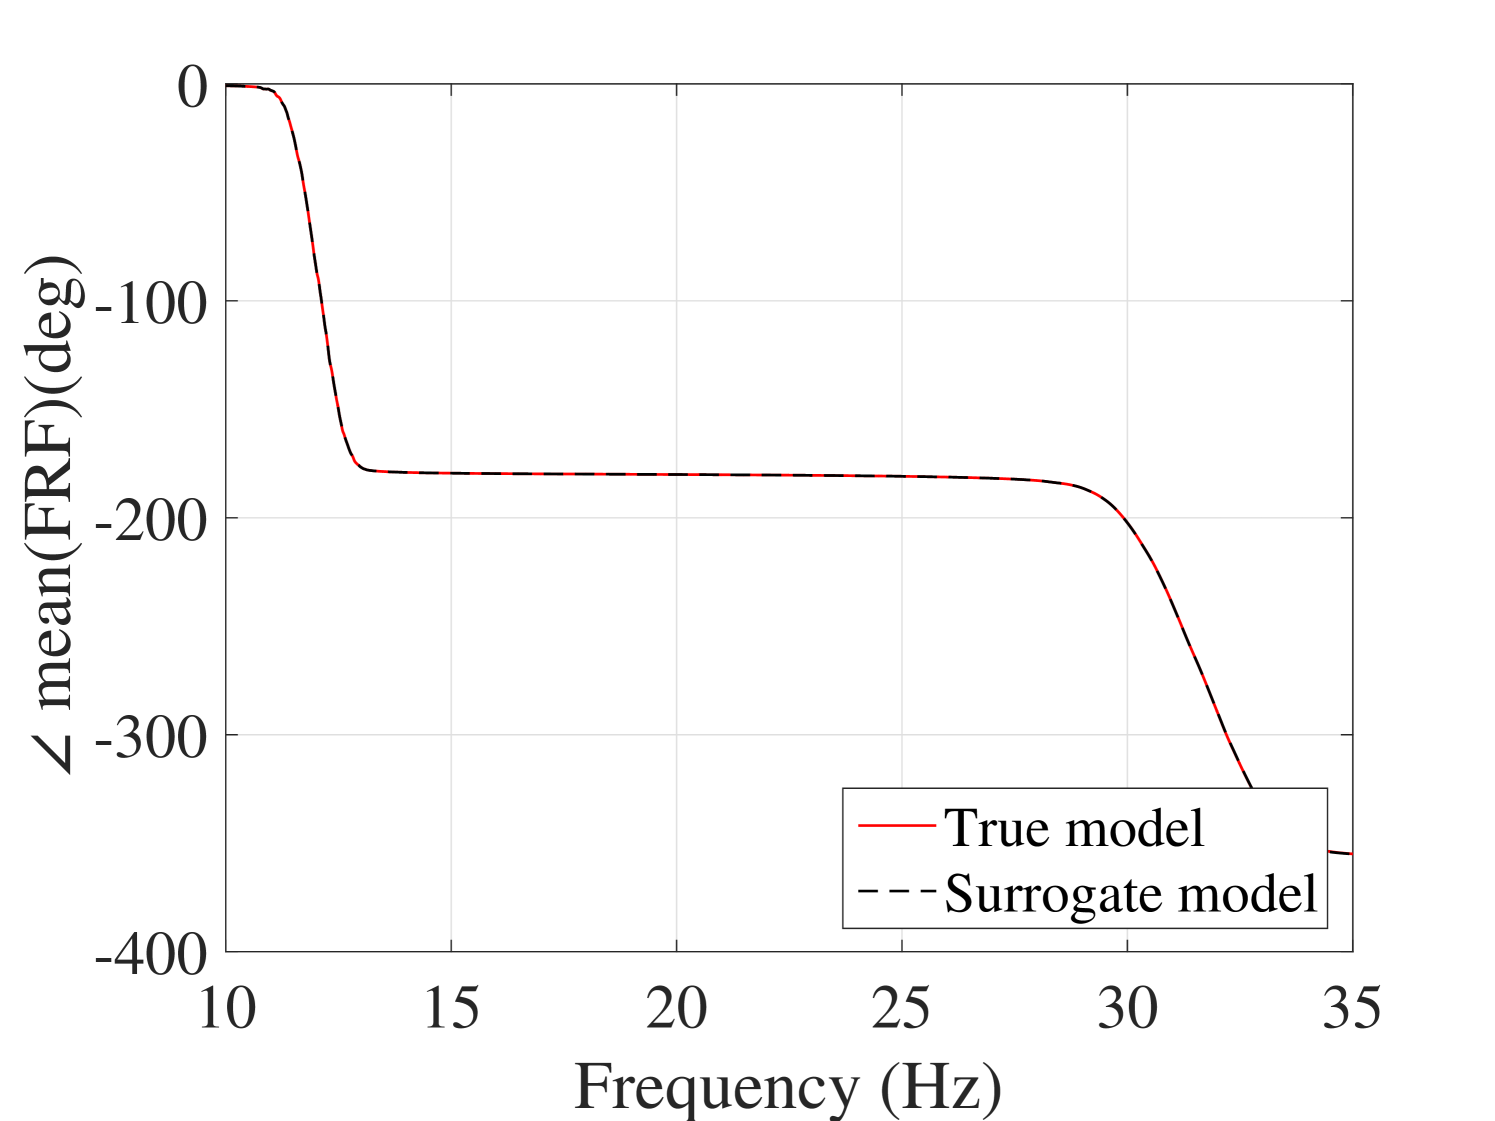
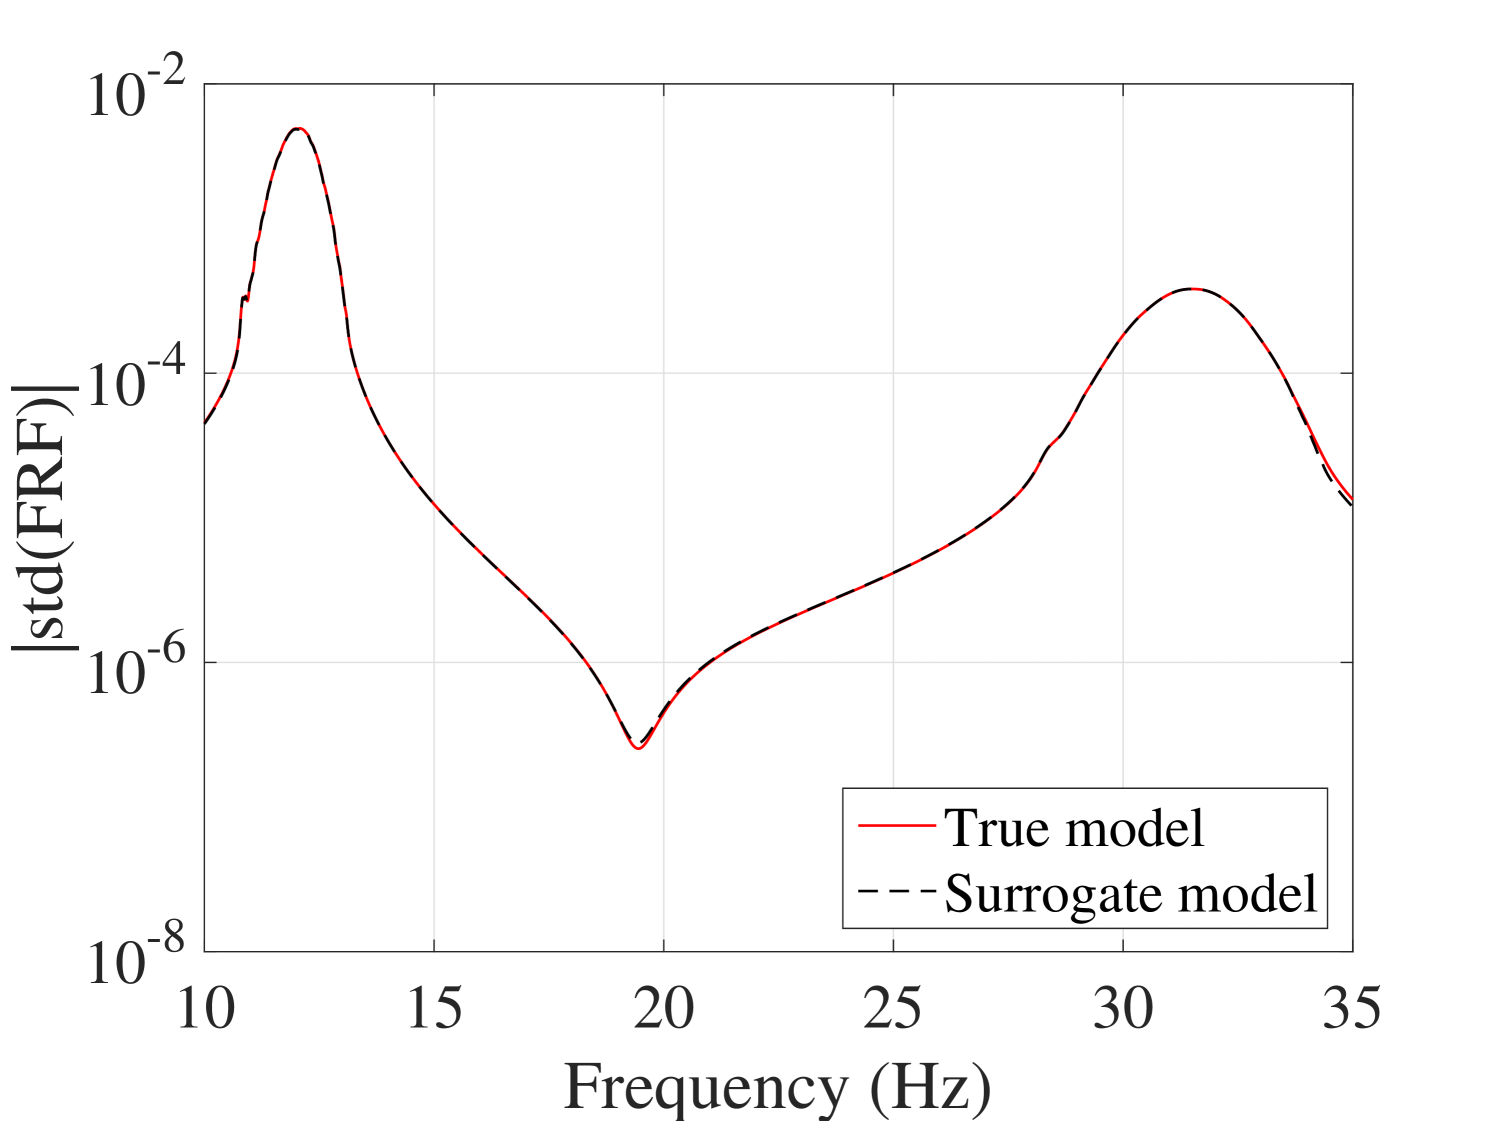
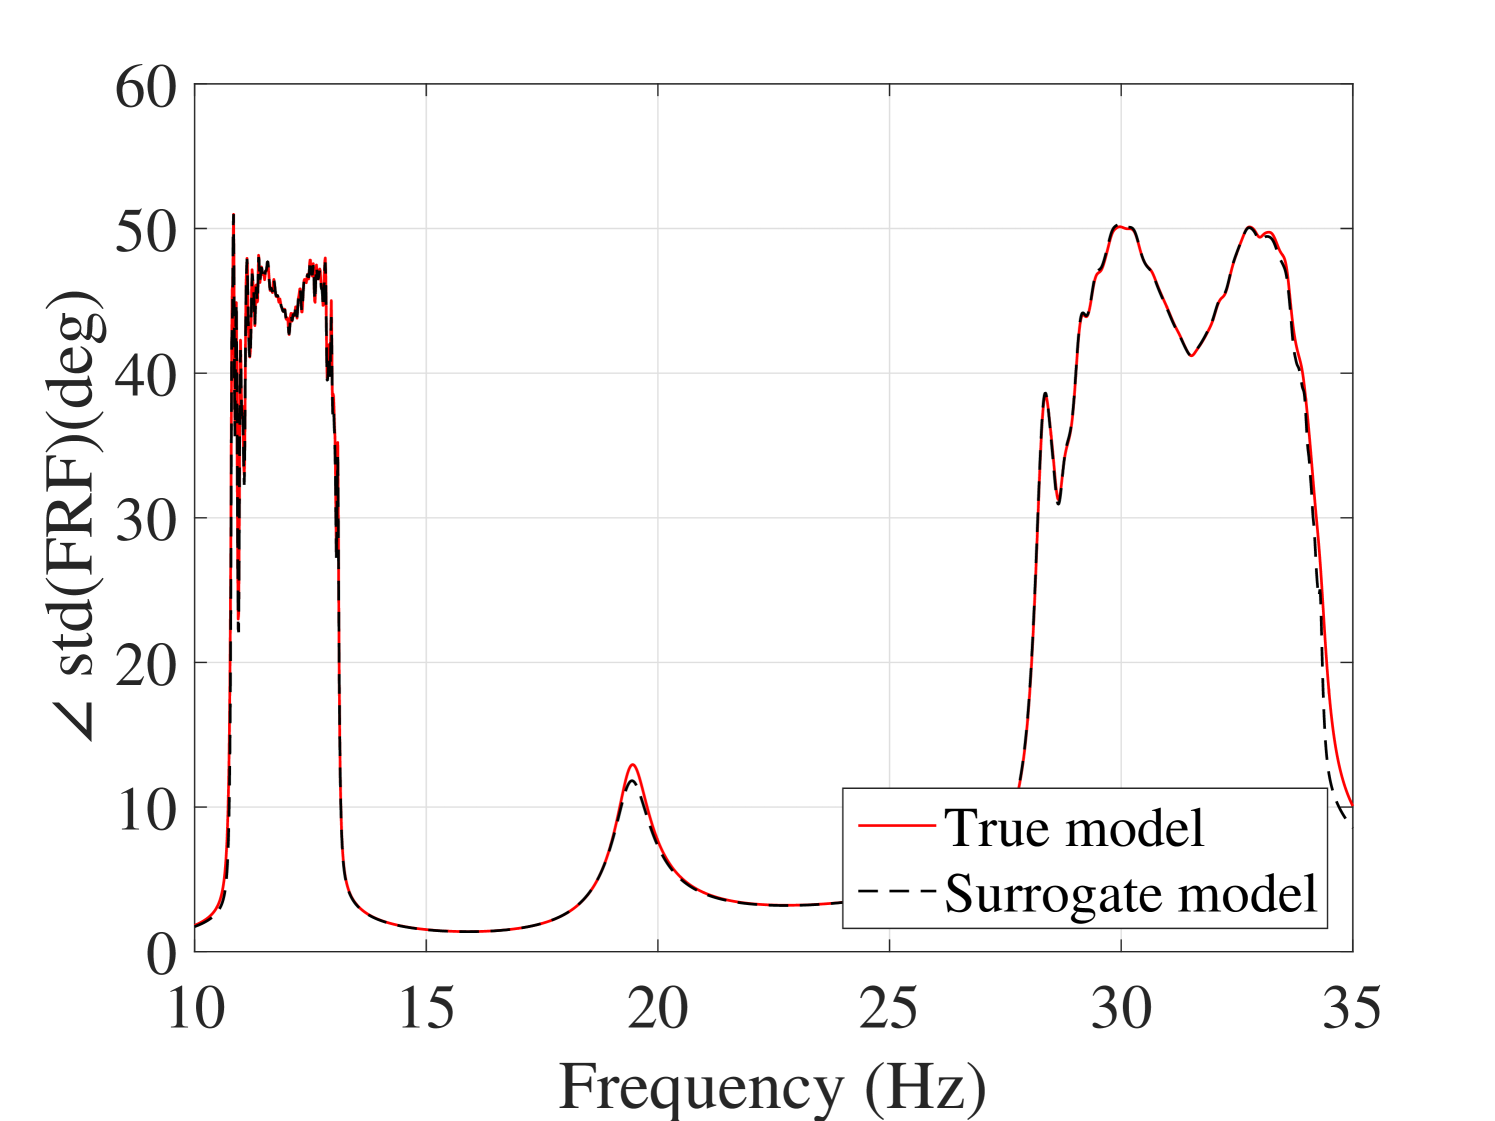
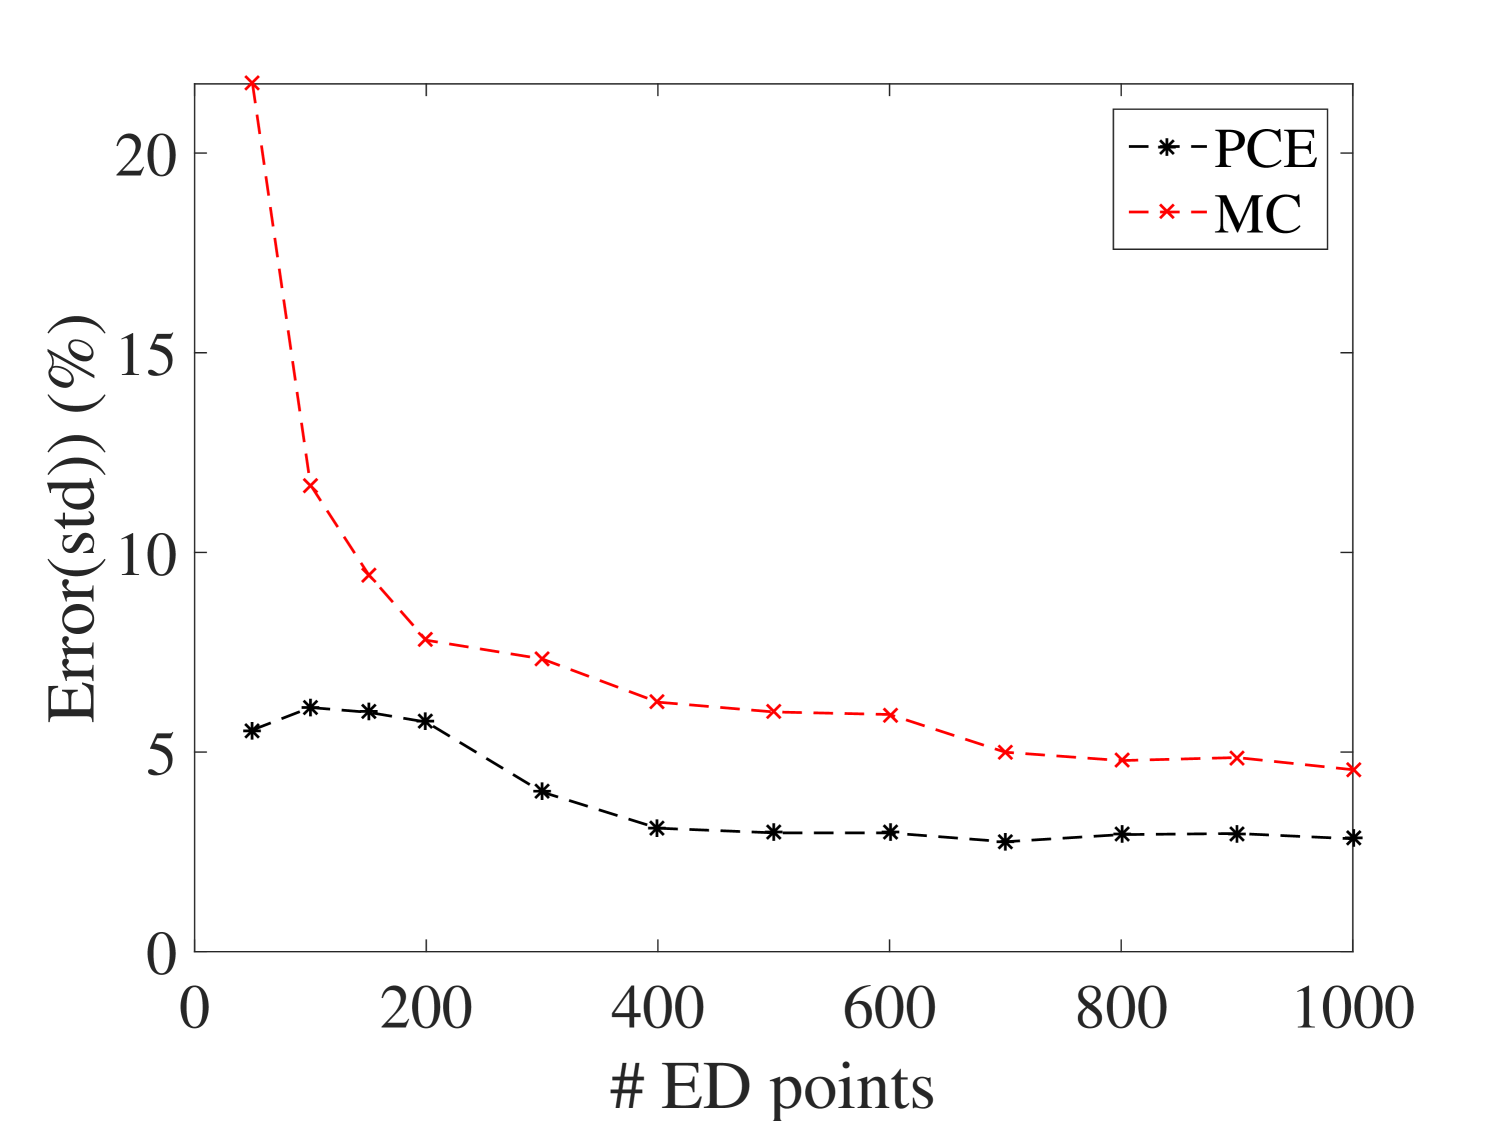
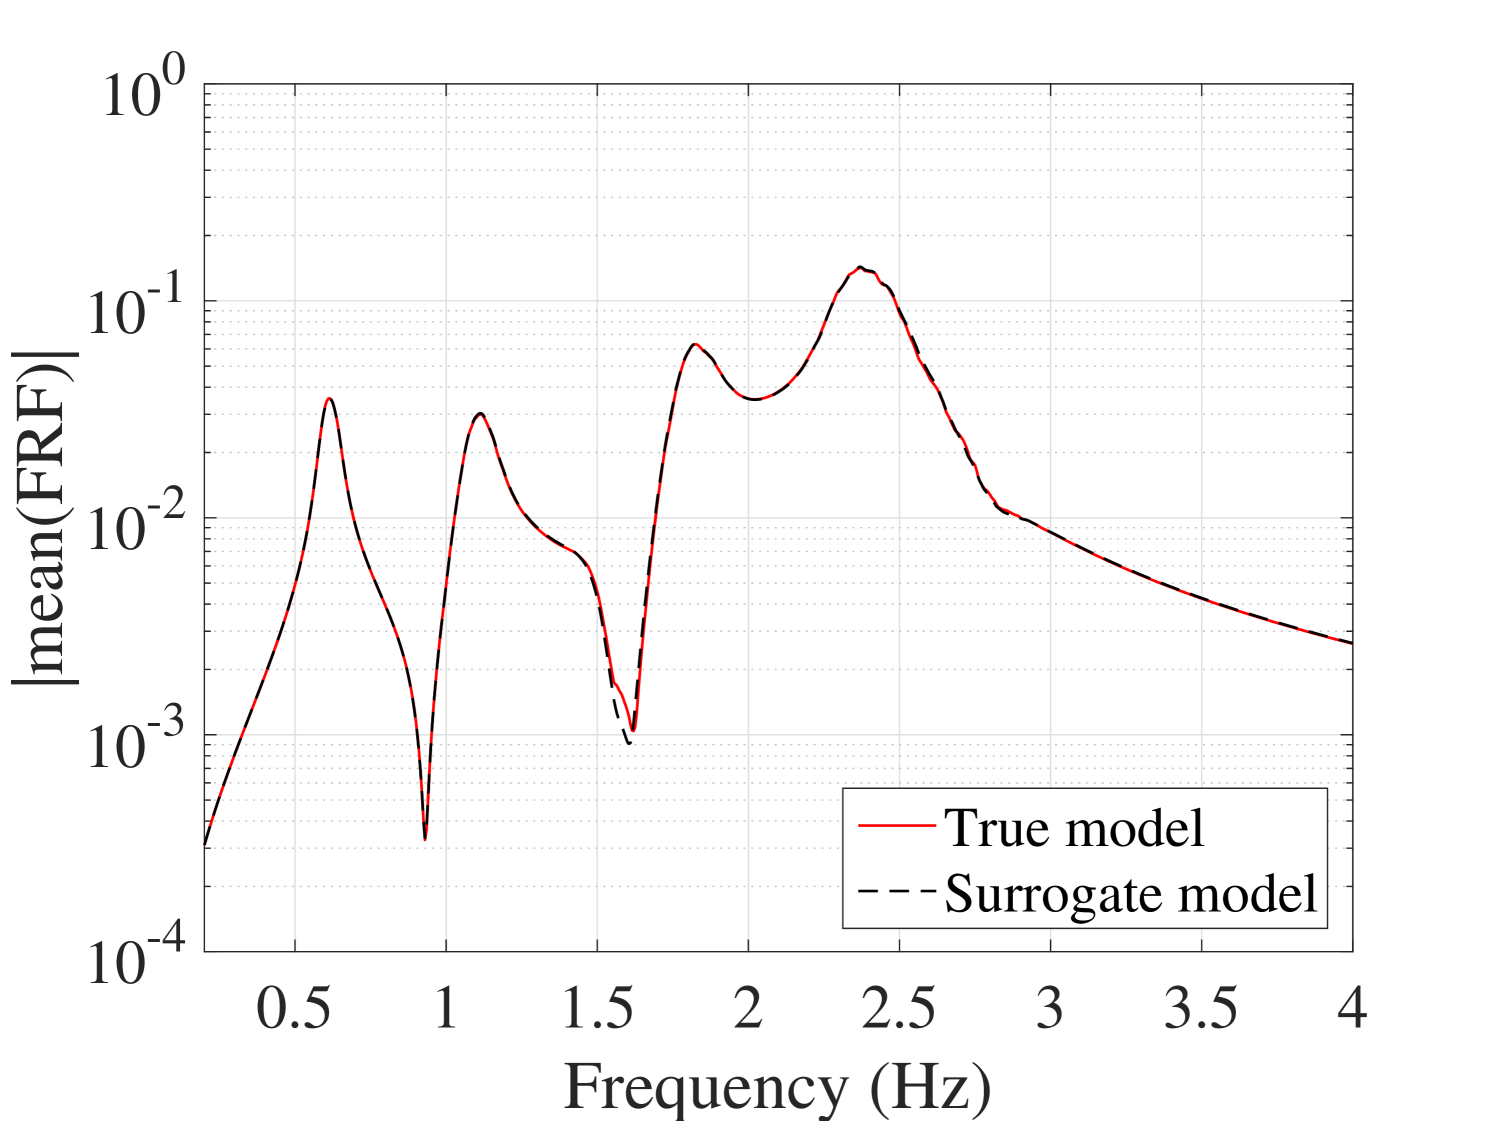
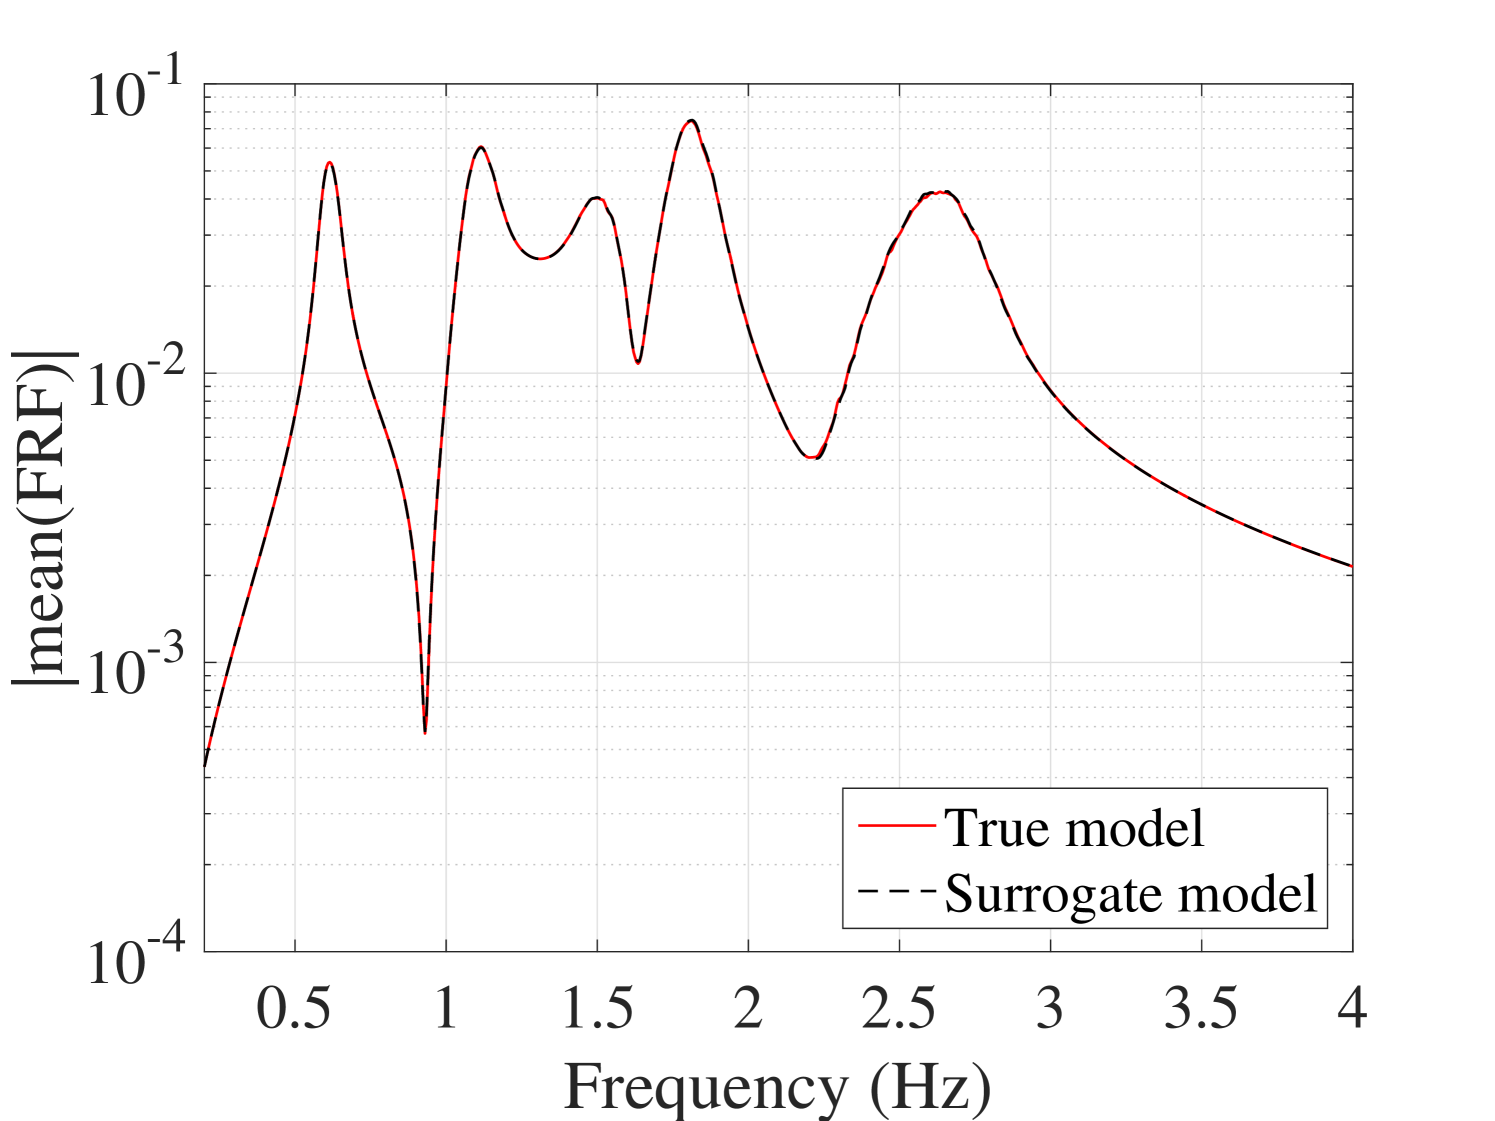
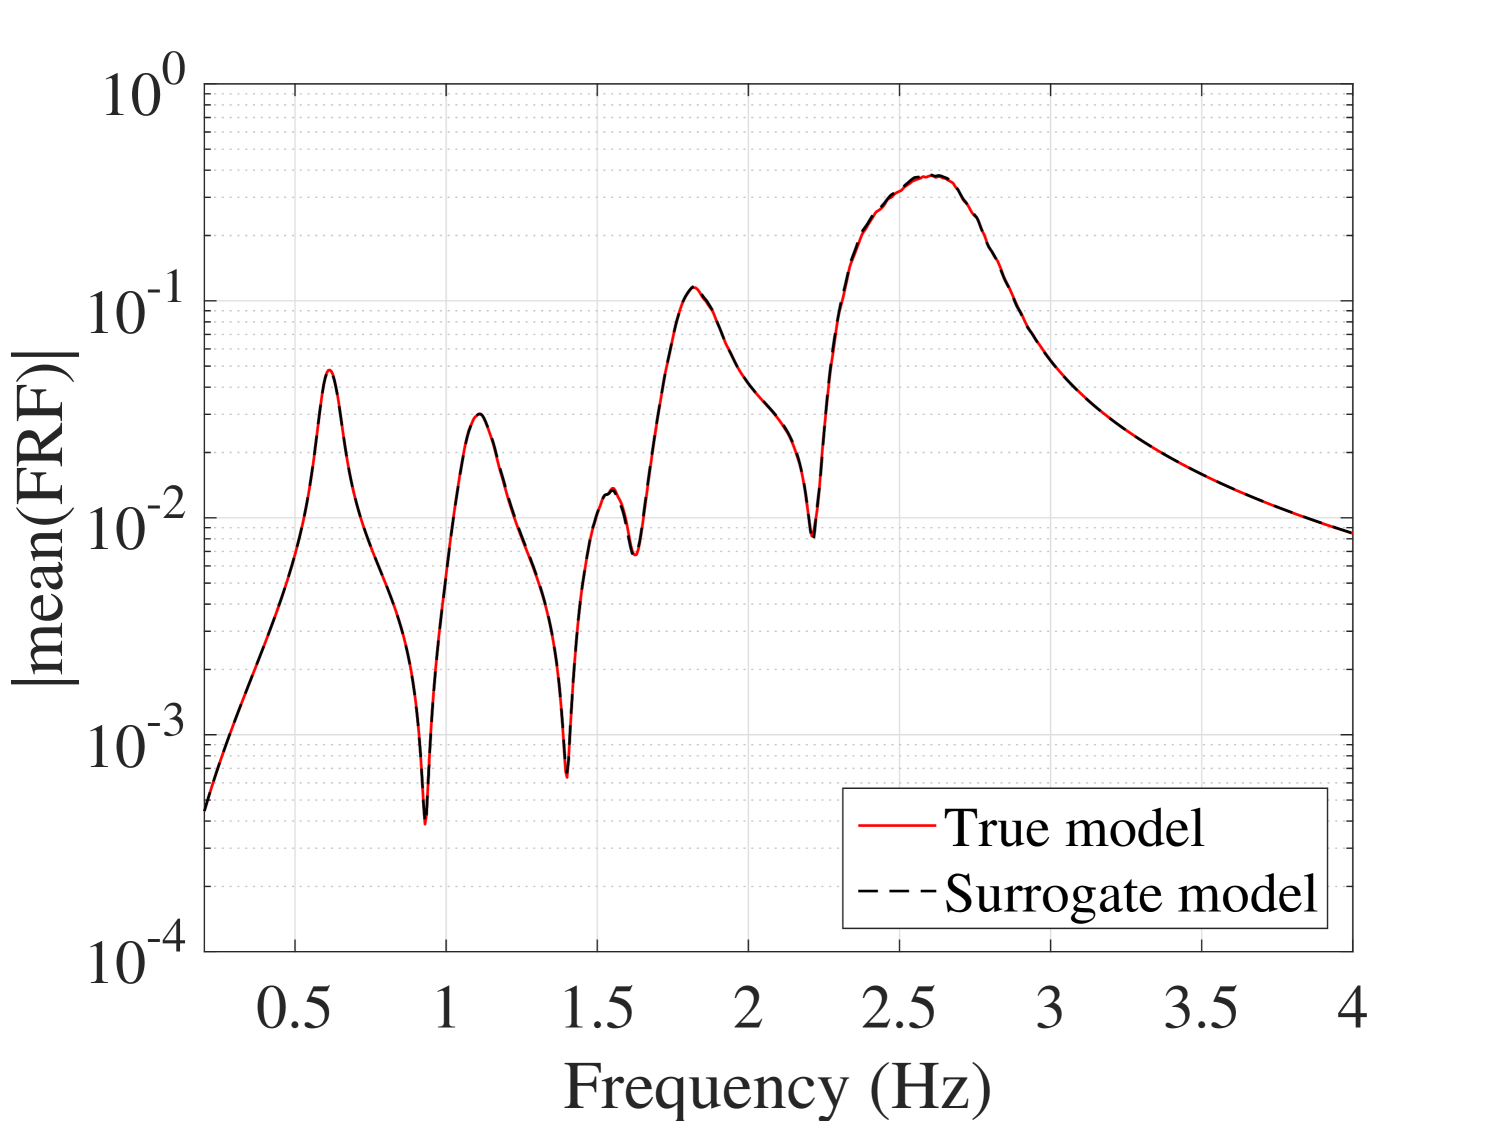
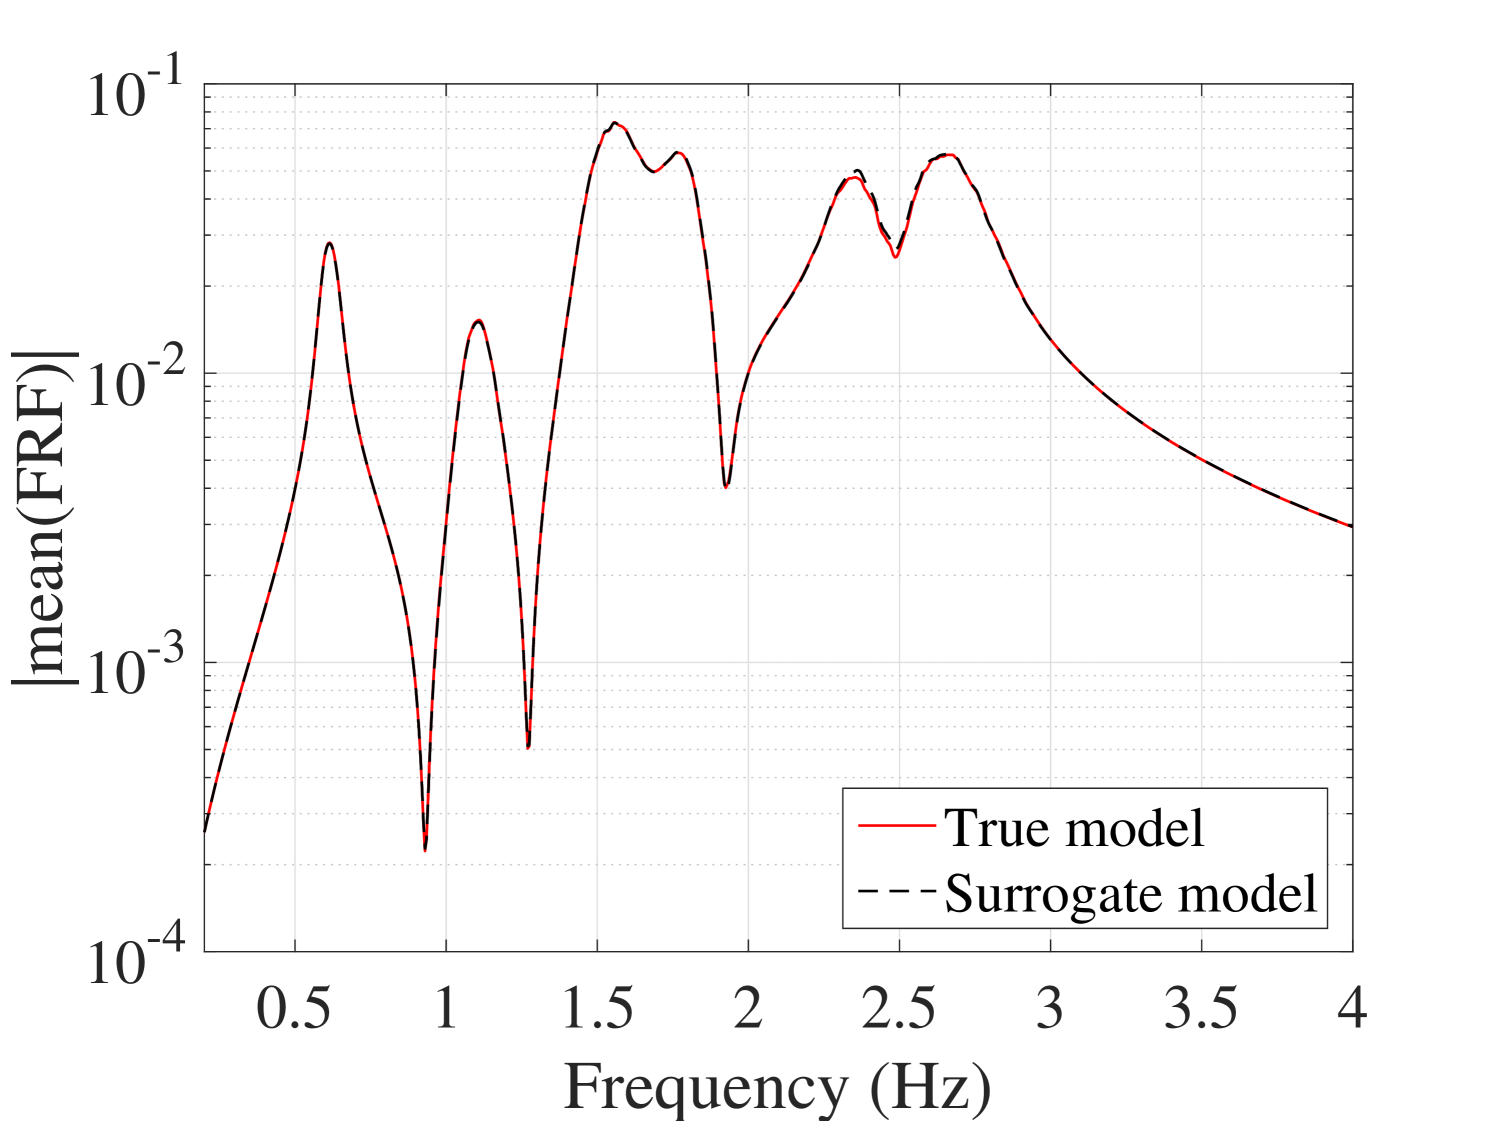
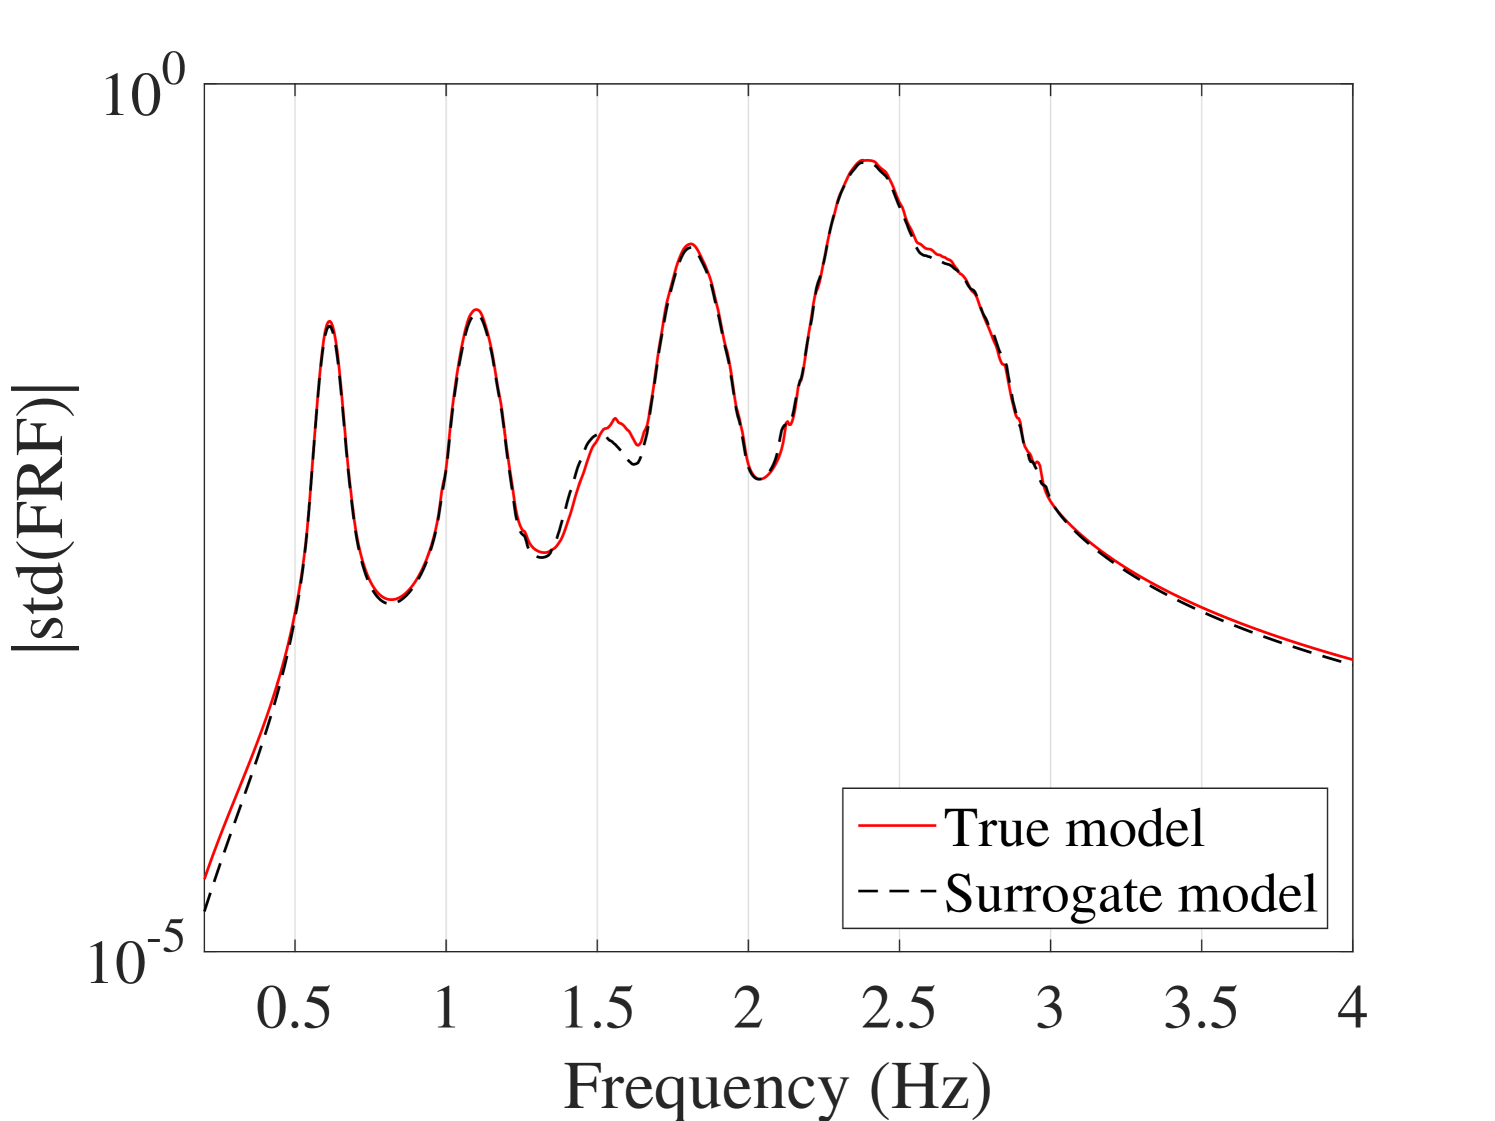
Another accuracy test is given by the comparison between the first two moments of the FRFs. The mean and standard deviation of the trajectories obtained by the true model and the surrogate model are compared in Figure 11 for the output and in A.1 for the output. They reveal the accuracy of the proposed surrogate model in predicting the first two moments of the FRFs.
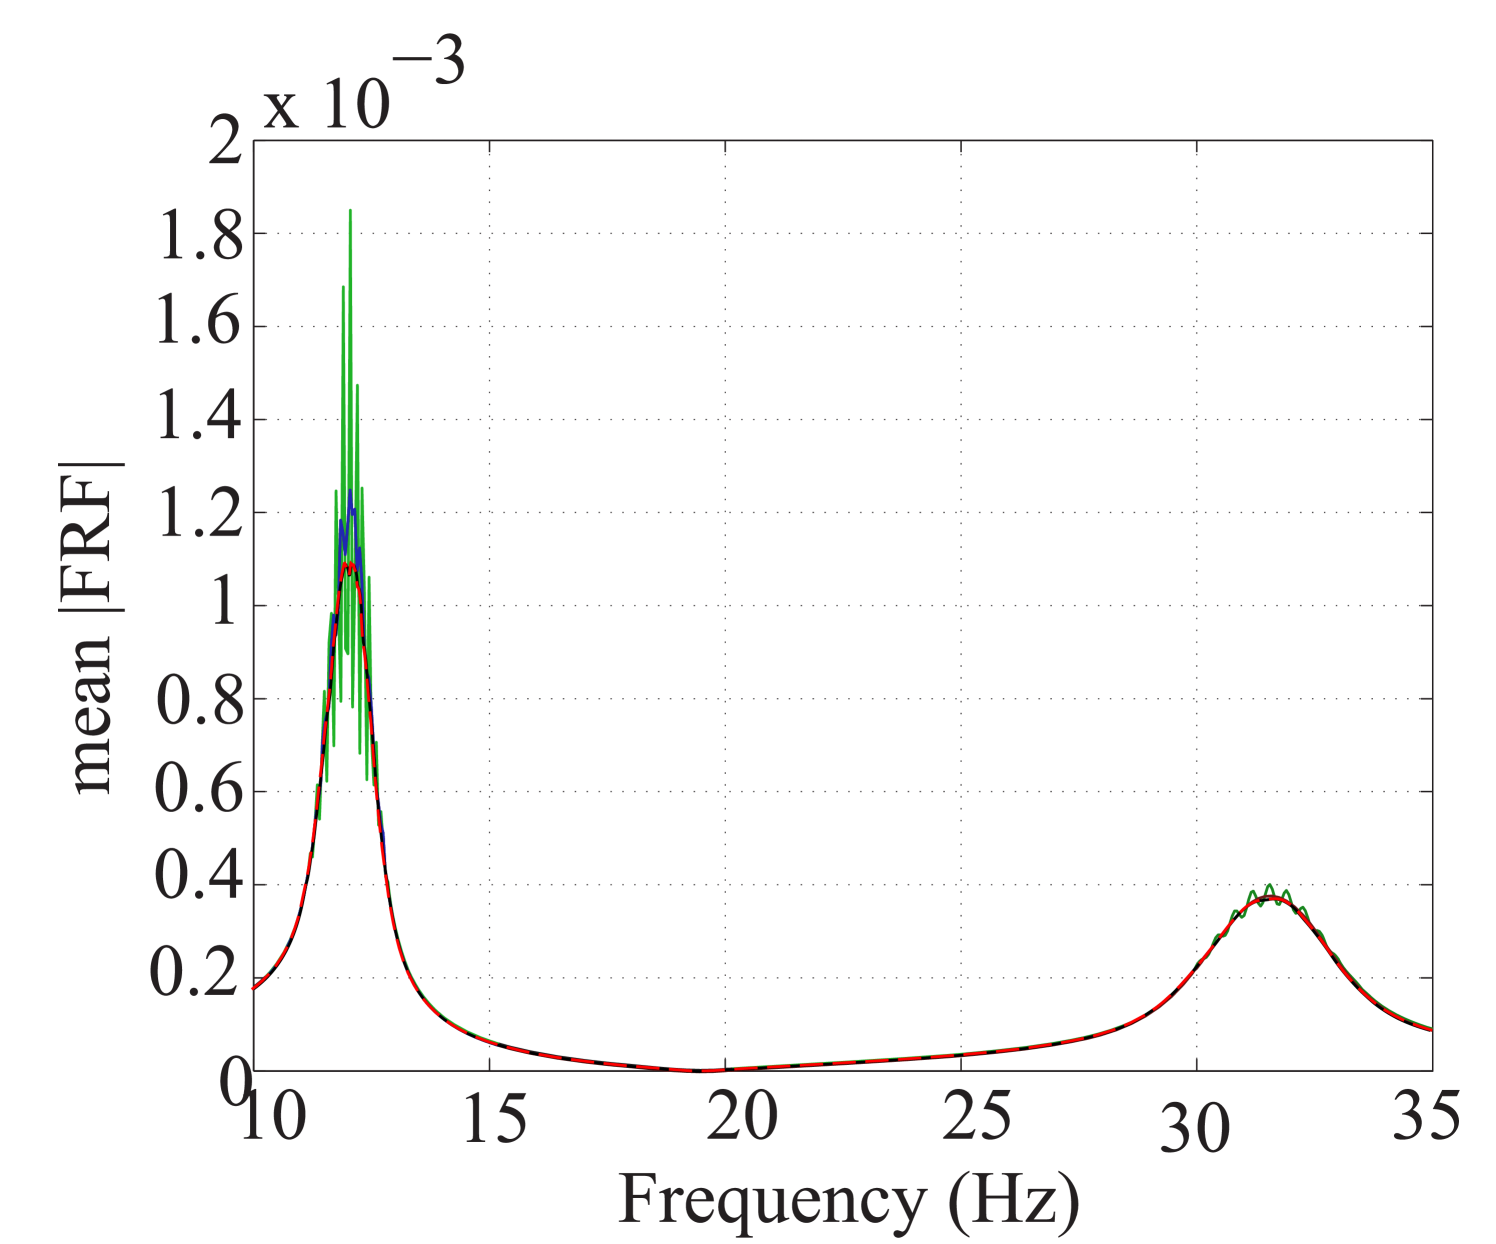
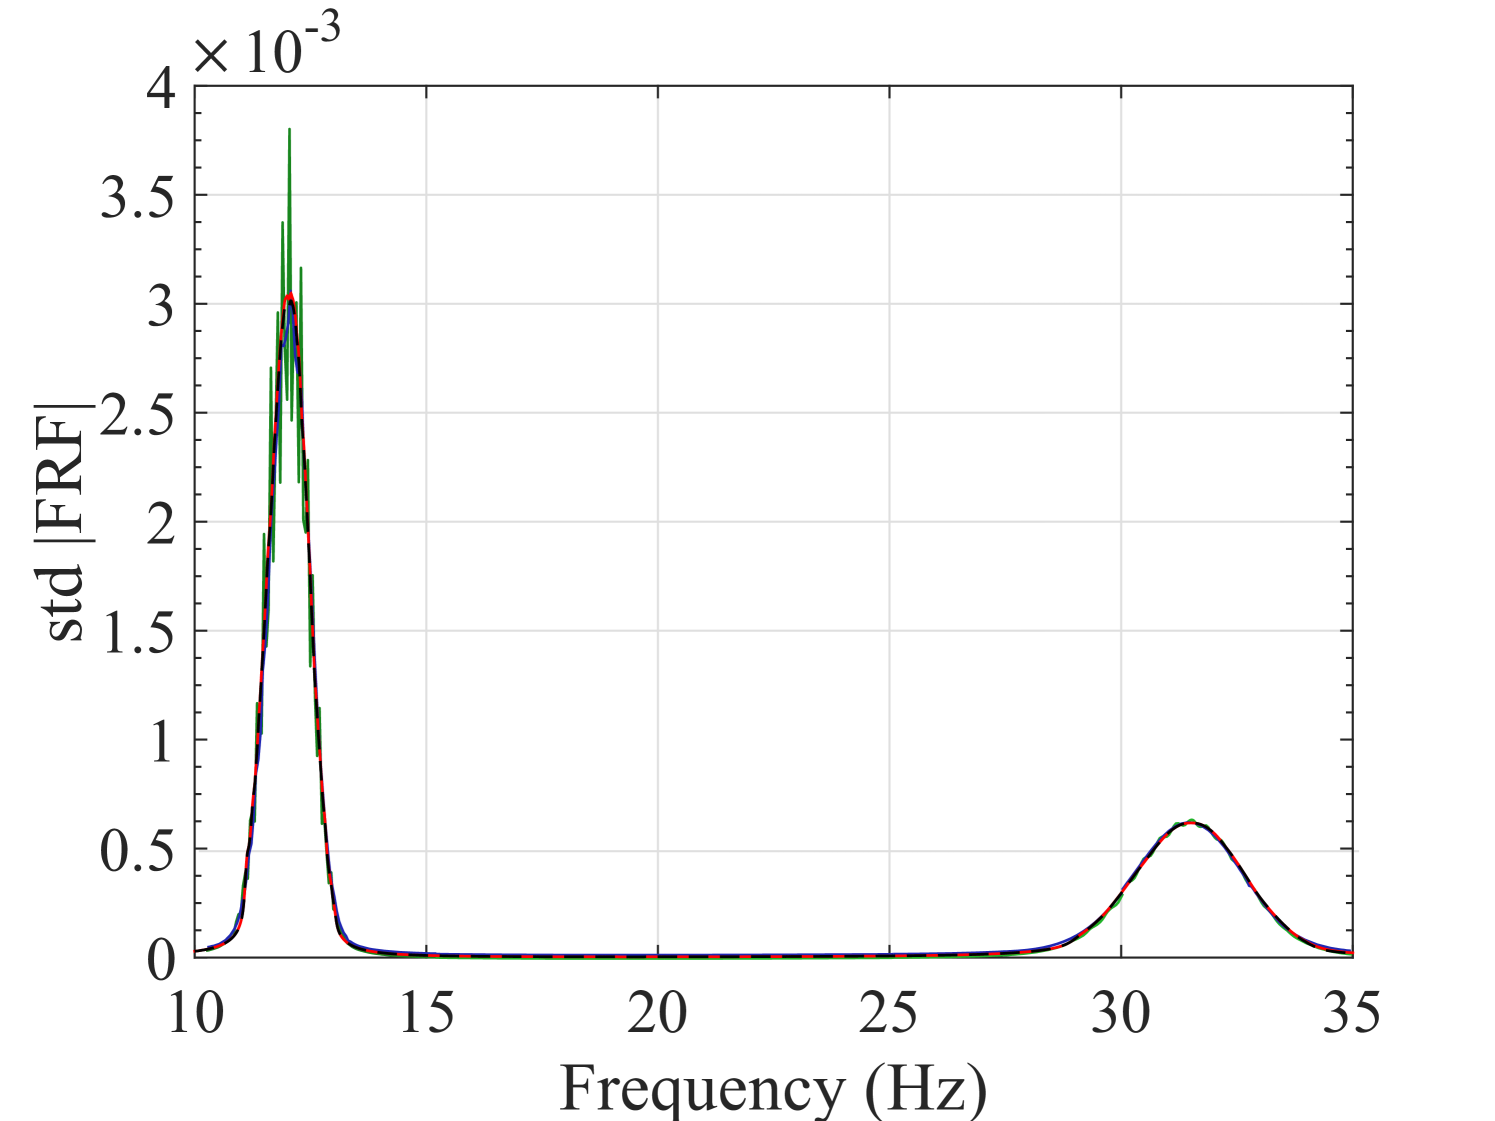
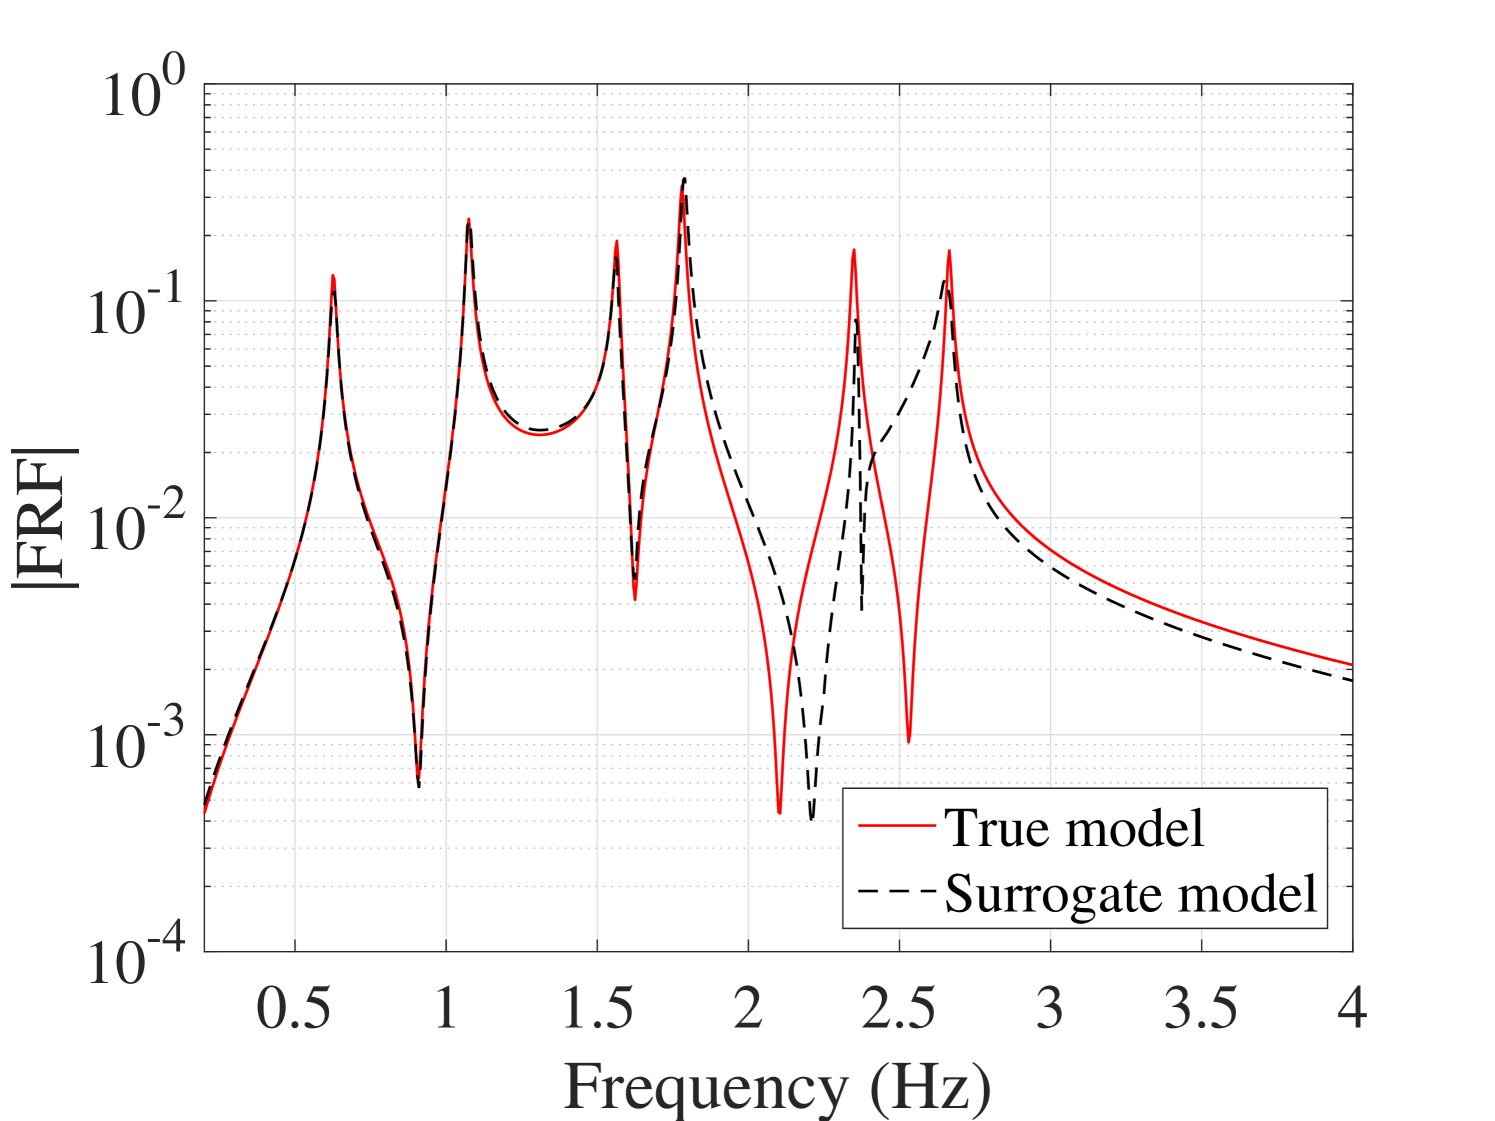
To show the feasibility of the proposed method to estimate the statistics of the FRFs, the results obtained here are compared to their counterparts in two of the most recent works available in the literature. The first study (Jacquelin et al., 2015a) directly uses high-order PCE for estimating the first two moments of the FRF, whereas the second method (Jacquelin et al., 2015b) proposes to use Aitken’s transformation in conjunction with PCEs, Both methods use PCEs of order 50 and tend to produce spurious peaks around the resonance region. The use of Aitken’s transformation slightly improves convergence. Their results for the mean and standard deviation are shown in Figures 12(a) and 12(b), respectively. For comparison, the results from our approach in Figures 11(a) and 11(c) are reproduced in Figure 12 with a scaling similar to the other panels. They indicate that the stochastic frequency transformation approach proposed here, significantly improves the estimation accuracy of the PCE surrogate, as no spurious peaks are visible in this case.
As far as individual comparison between the true and the predicted FRF are concerned, the worst predicted FRF, the one with the maximum error, is presented in Figure 13. They indicate that even for the worst-case, the presented approach results in prediction of the FRFs with excellent accuracy.
4.3 6-DOF system: large parameter space
The second example is chosen to illustrate the application of the proposed method to a problem with a relatively large parameter space. The system, shown in Figure 14, consists of 10 springs and 6 masses which are modeled by random variables with lognormal distributions. Their mean values are listed in Table 2. The uncertainty on the springs (resp. masses) has a COV = 10% (resp. COV = 5%). The damping matrix is , where is the matrix of the mean value of the system masses. Table 3 provides its corresponding mean of modal dampings evaluated over 10,000 samples.
The system has one input force at mass 6 and 6 system outputs, one for each mass. The FRF of the system is evaluated at a frequency range from 1 to 25 rad/s with the step of 0.01 rad/s.
In this example, the ED consists of 400 points sampled from the parameter space using LHS. The marginal distributions of the input vectors consists of lognormal distributions. Therefore, the chosen PCE basis consists of Hermite polynomials on the reduced variable . Eq. (6) thus, can be written as
The LARS algorithm has been employed to build sparse PCEs with adaptive degree for both the selected frequencies and the principal components of the scaled FRF.
For the second set of PCEs, PCA has been performed and the dominant components are selected such that . This truncation reduced the number of random outputs from 761 6 2 to 102 components. Since the dimension of the input parameter space is large, to reduce the unknown coefficients of the PCEs and avoid the curse of dimensionality, a hyperbolic truncation with -norm of 0.7 was used before the LARS algorithm. Besides, only polynomials up to rank 2 were selected here (i.e. polynomials that depend at most on 2 of the 16 parameters). It should be mentioned that all the PCEs used for the surrogate model have eventually maximum degrees less than 10.
| Variables | mean | Coeff. of variation (%) | |
|---|---|---|---|
| Masses (Kg) | 50 | 5 | |
| 35 | 5 | ||
| 12 | 5 | ||
| 33 | 5 | ||
| 100 | 5 | ||
| 45 | 5 | ||
| Stiffnesses (N/m) | 3000 | 10 | |
| 1725 | 10 | ||
| 1200 | 10 | ||
| 2200 | 10 | ||
| 1320 | 10 | ||
| 1330 | 10 | ||
| 1500 | 10 | ||
| 2625 | 10 | ||
| 1800 | 10 | ||
| 850 | 10 | ||
| Damping | Mean of modal dampings (%) | |||||
|---|---|---|---|---|---|---|
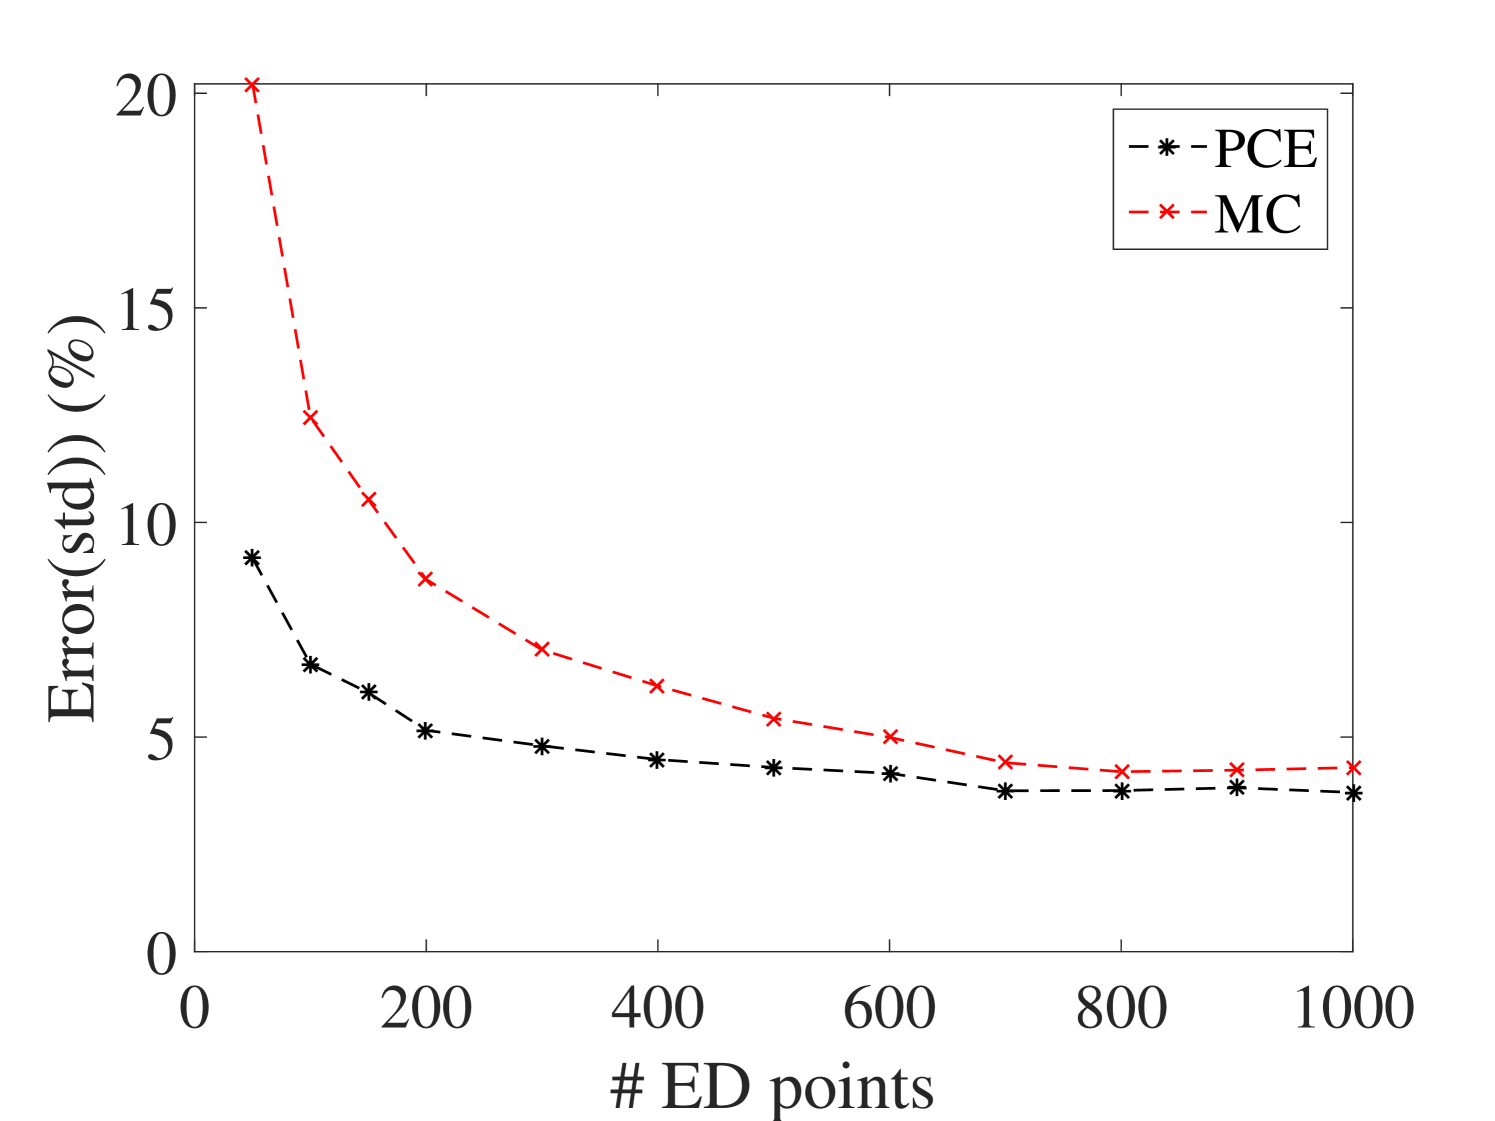
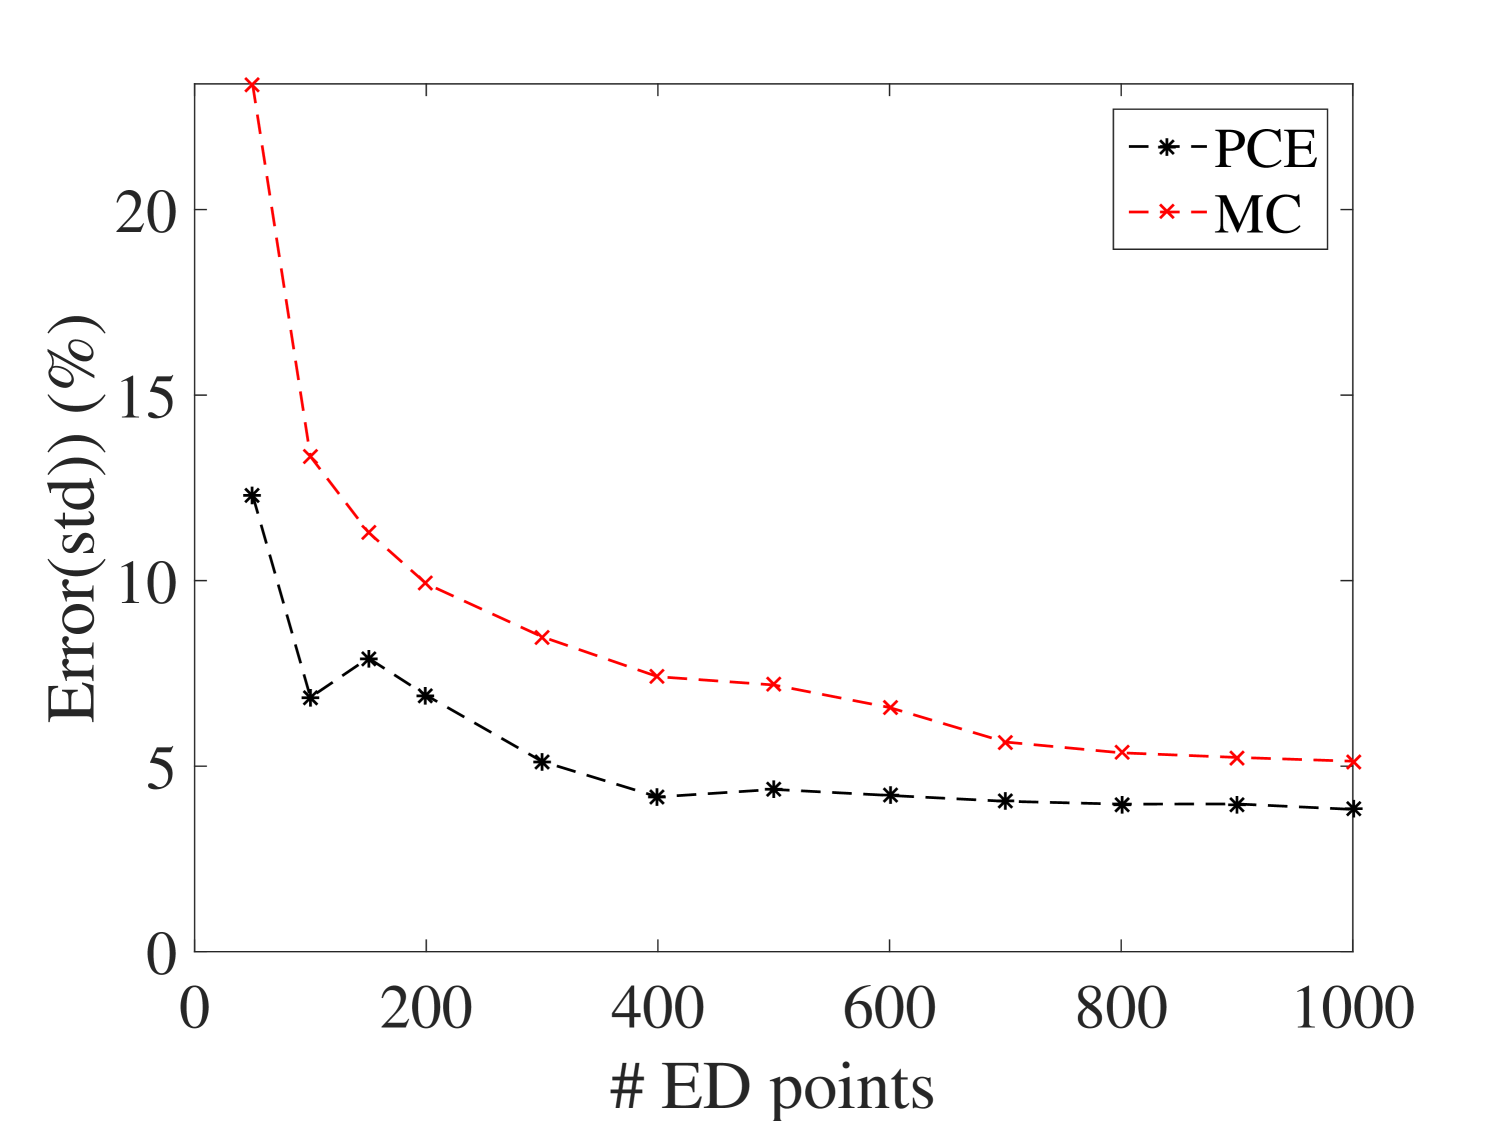
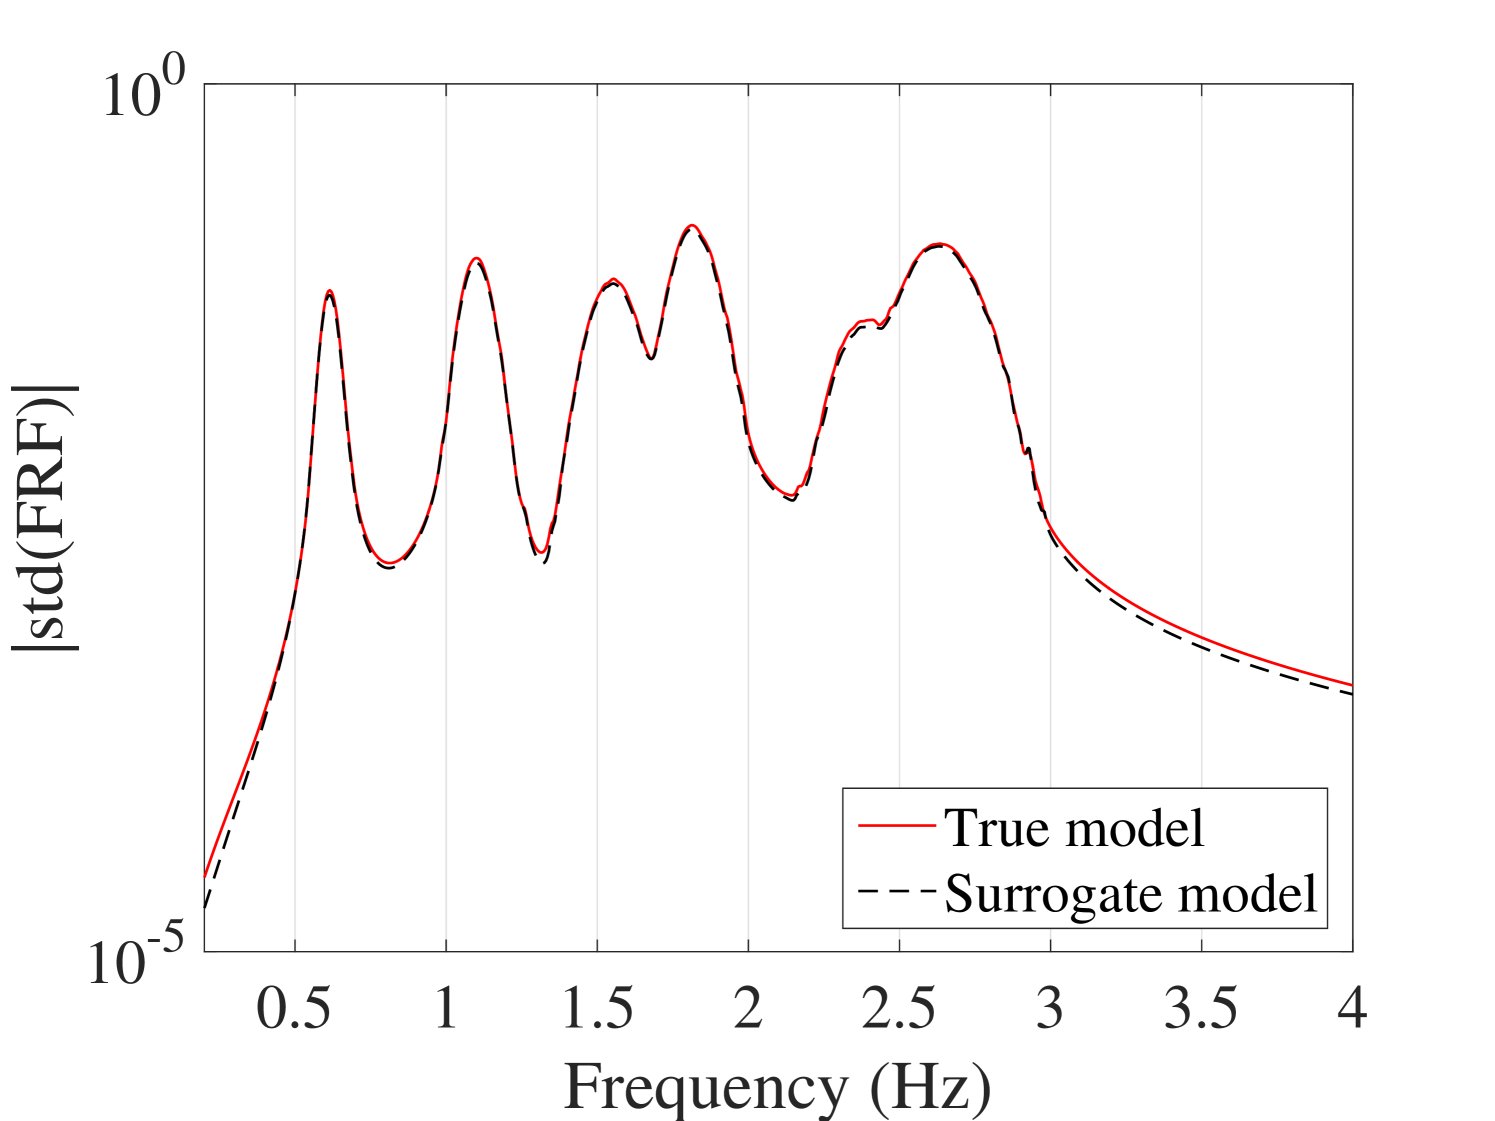
The efficiency of the proposed method is assessed by comparing the PCE estimates of the first two moments of the surrogate model with the plain Monte-Carlo estimators on experimental designs of increasing size. The reference validation set is obtained by 10,000 points sampled from the parameter space by LHS at which the full model is evaluated. The results are shown in Figure 15 for the mean and standard deviation at output. The results for the other outputs are presented in B.1. They indicate that both mean and standard deviation evaluated by the surrogate model converge faster than those of the Monte-Carlo simulations. Besides, it can be inferred that 400 points are enough for the ED.
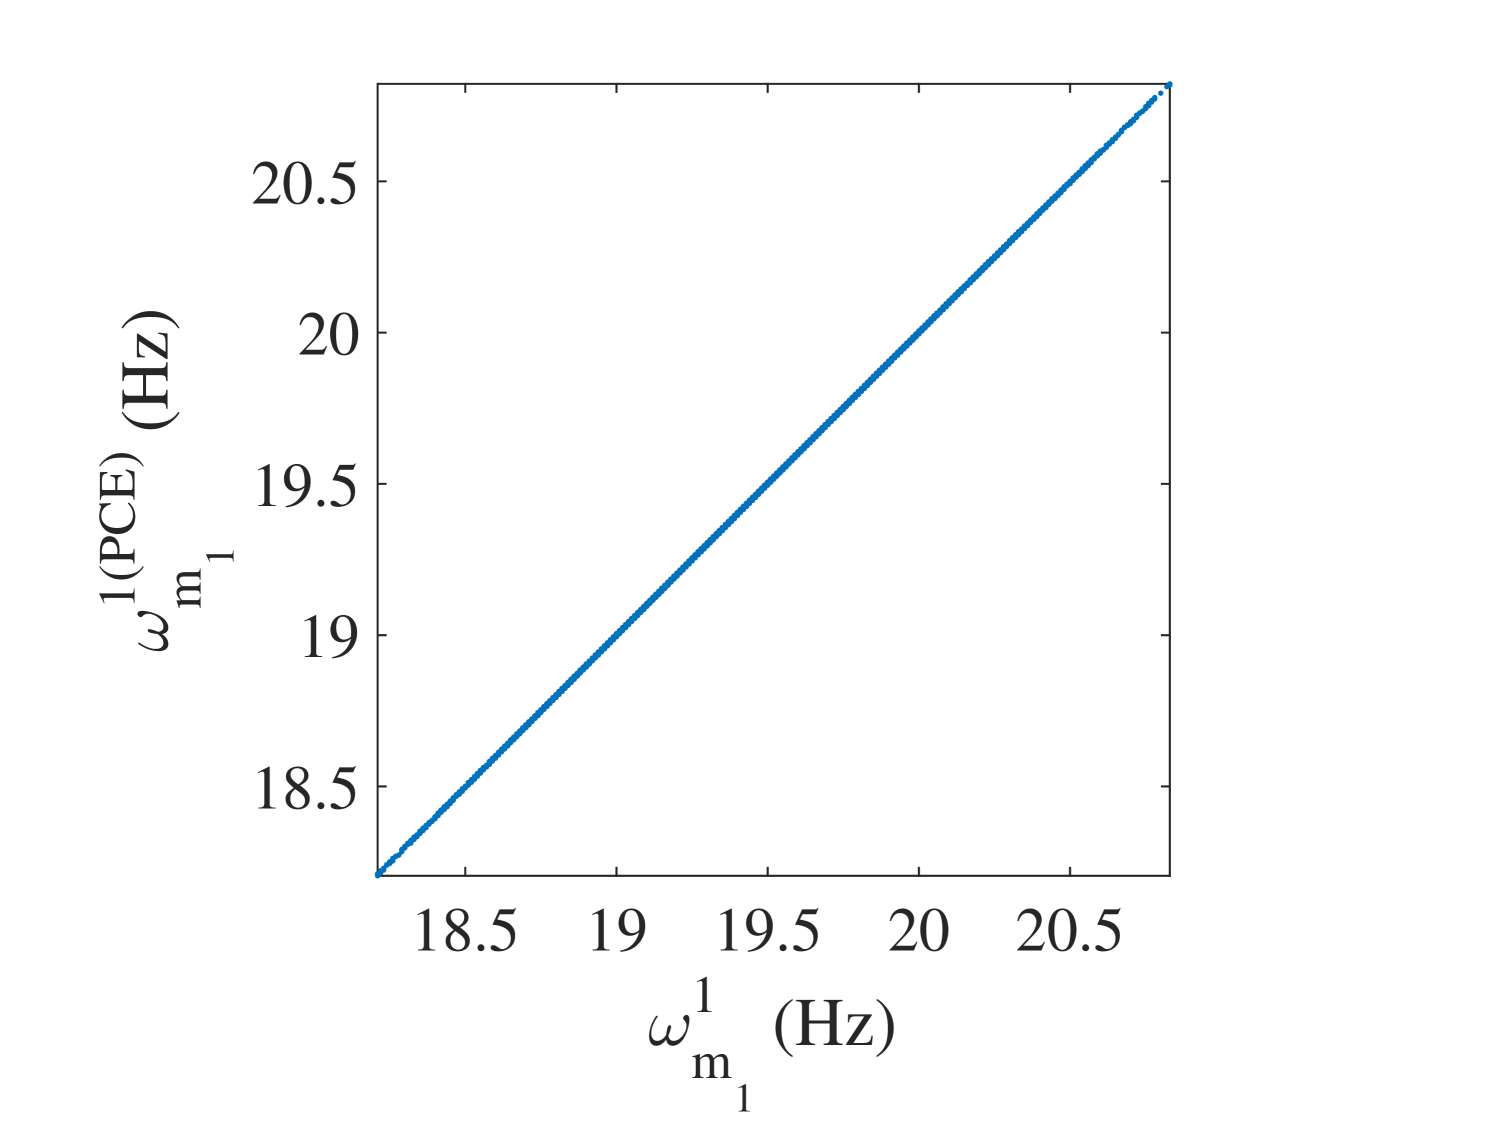
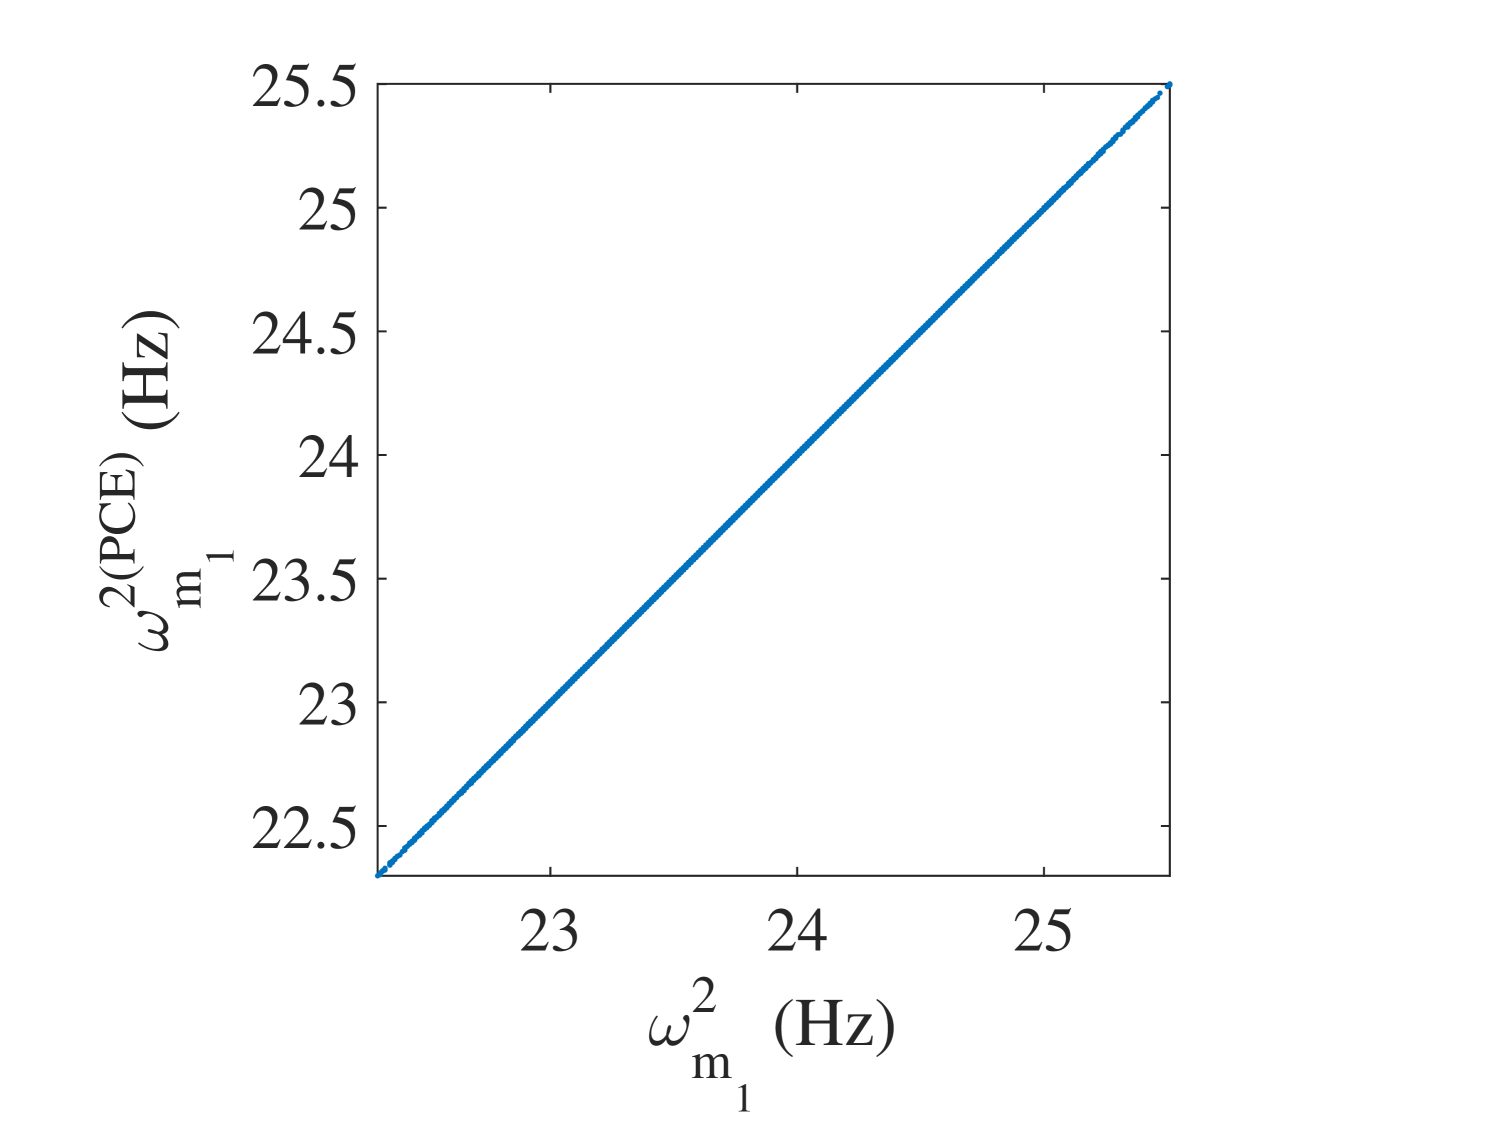
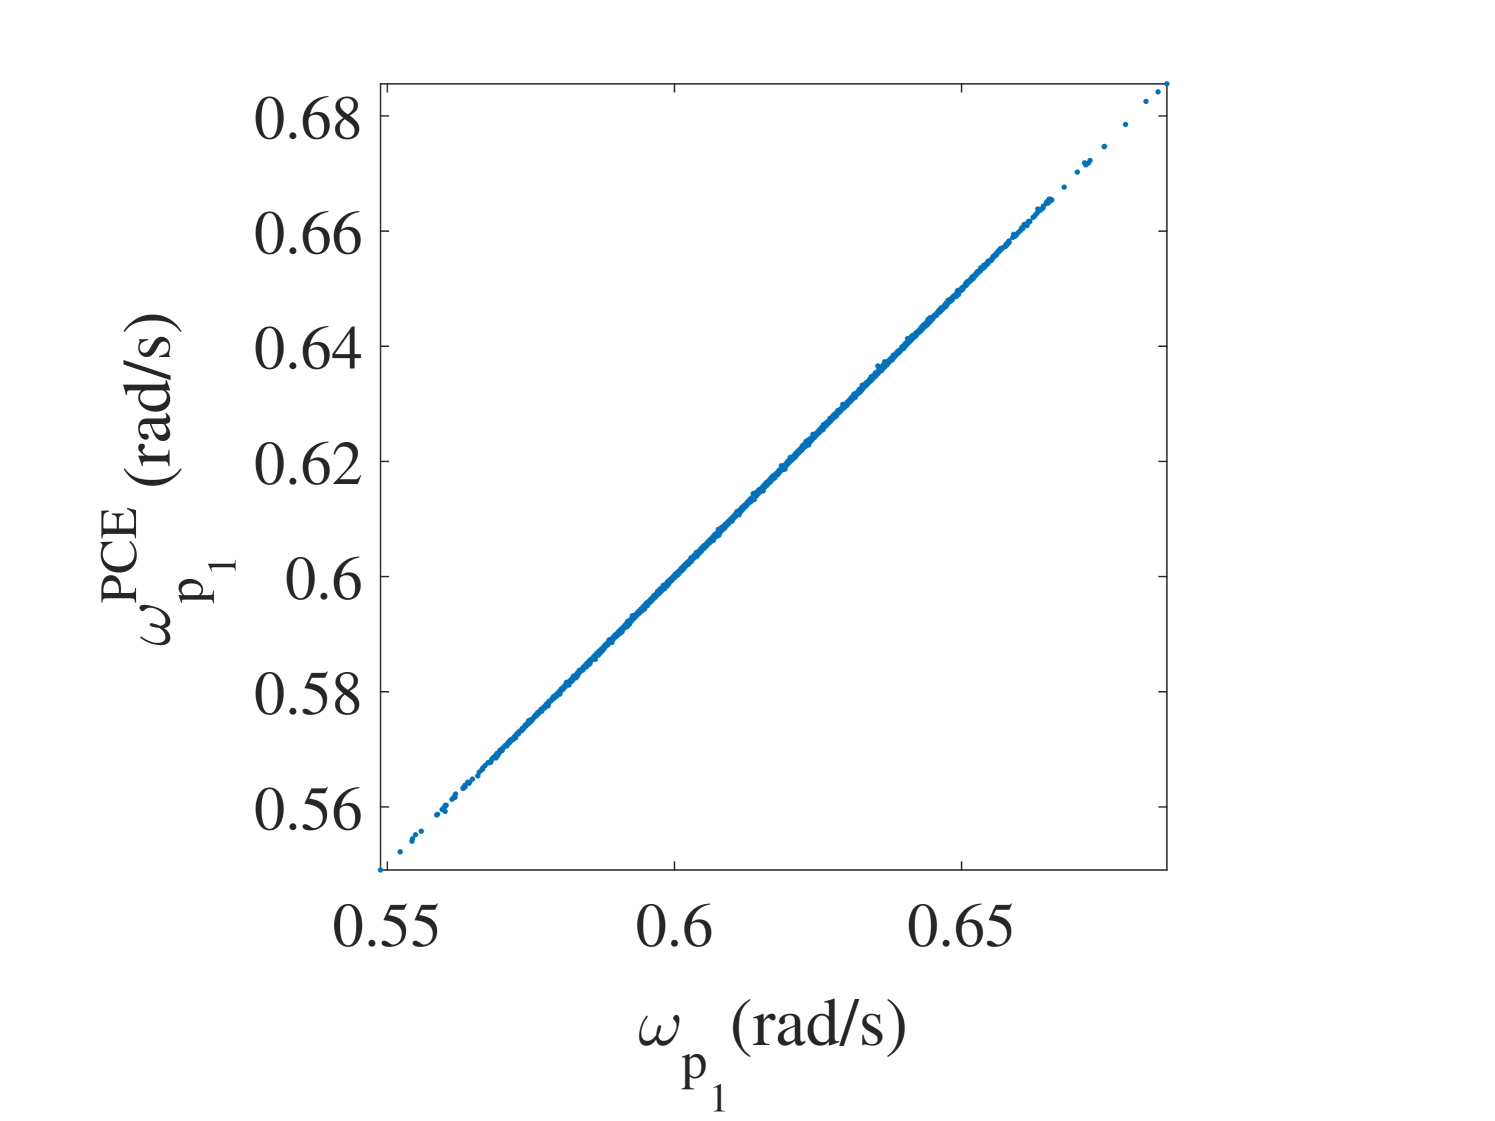
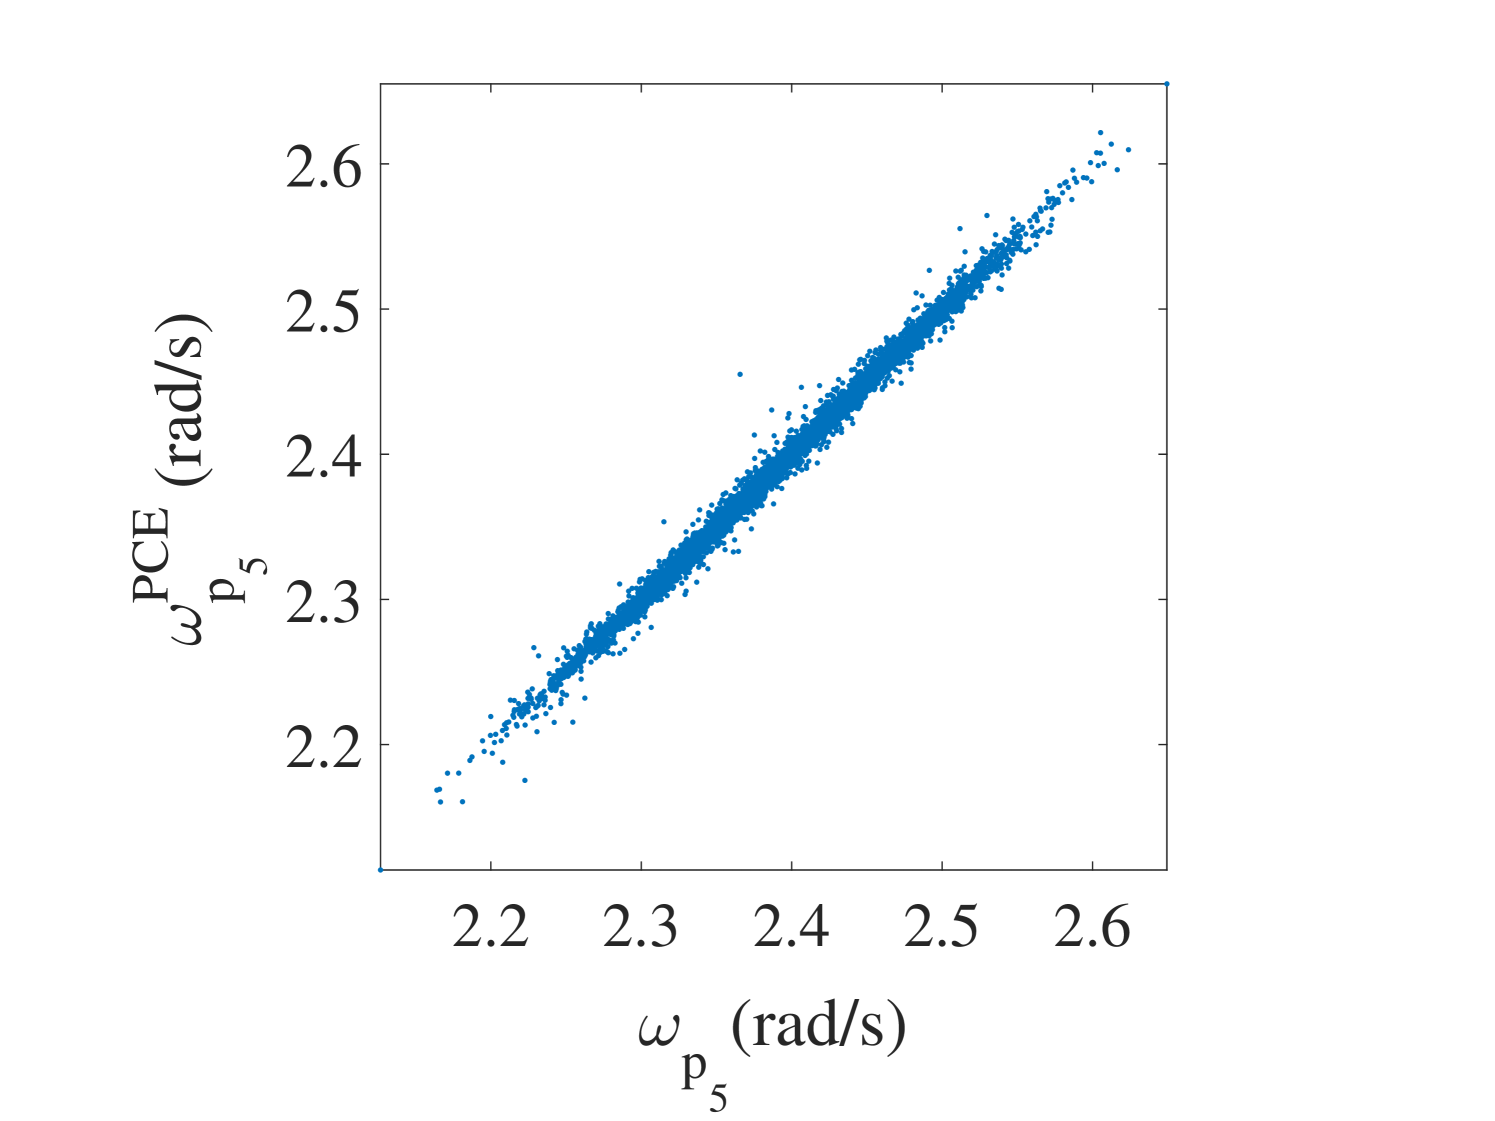
In order to assess the accuracy of the surrogate model in estimating various quantities of interests, the same 10,000 points used as the reference validation set to study the convergence are used here. Figure 16 illustrates two of the predicted selected frequencies versus the true ones, namely the best and worst predicted eigenfrequency, so that the accuracy of the surrogate model in this step can be inferred. While the overall accuracy is very good for all frequencies, it tends to degrade somewhat at higher frequencies.
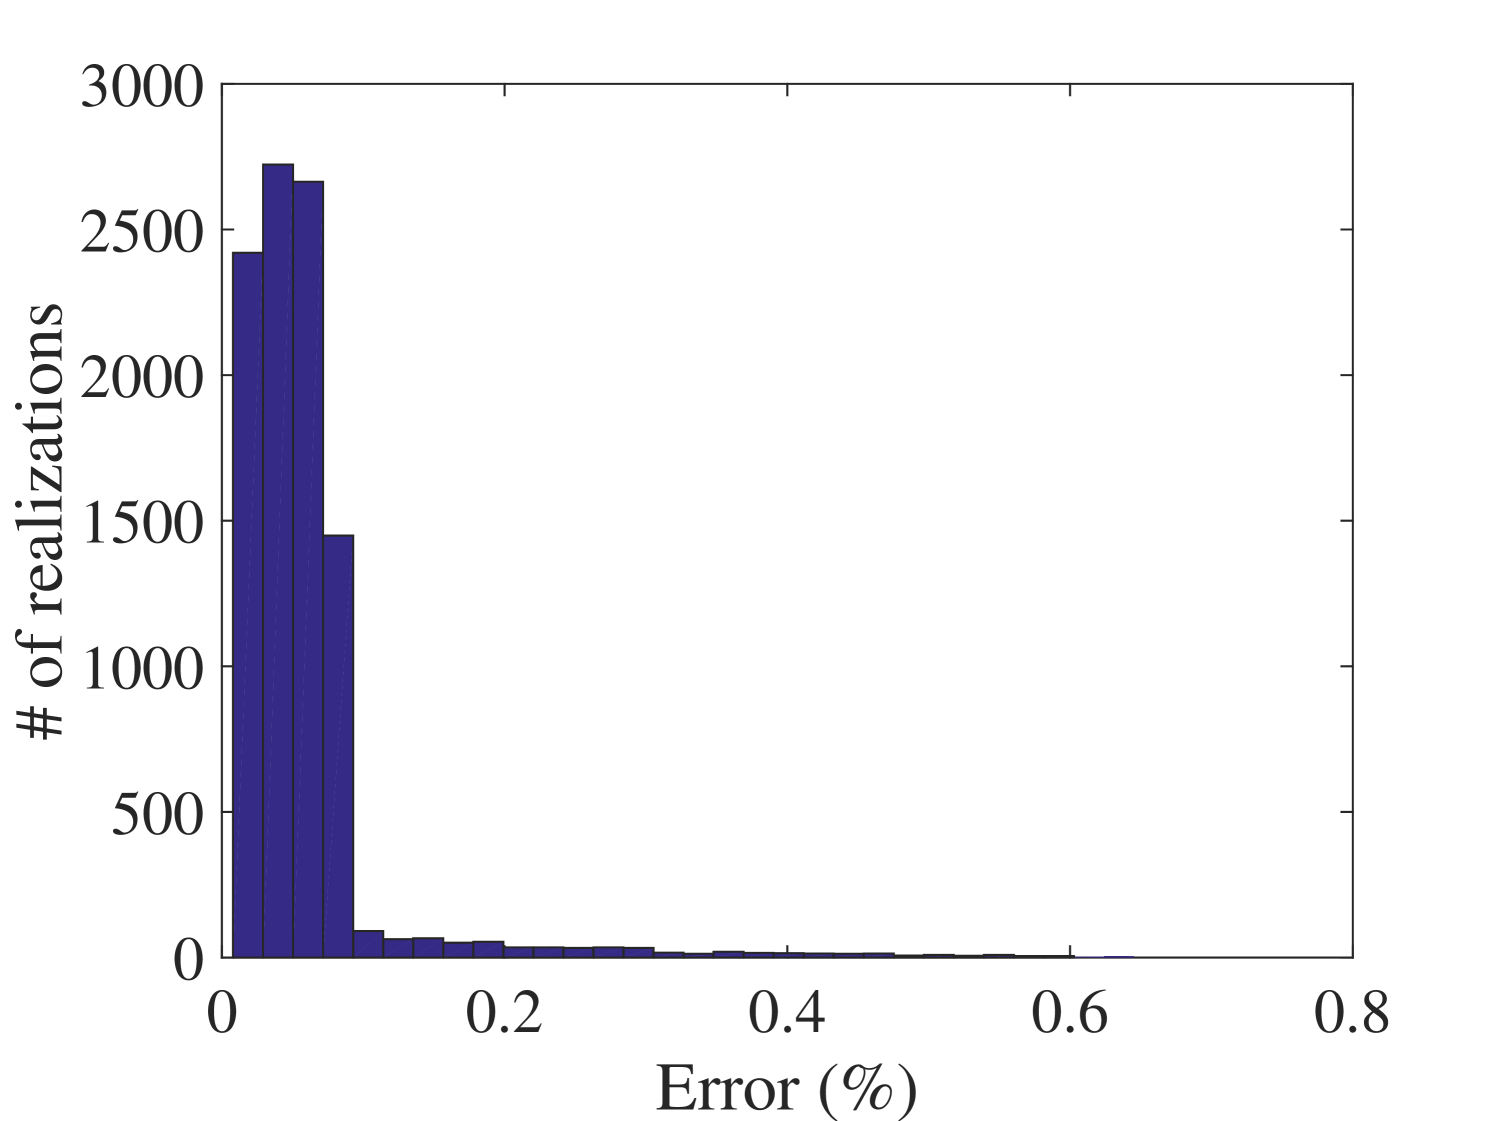
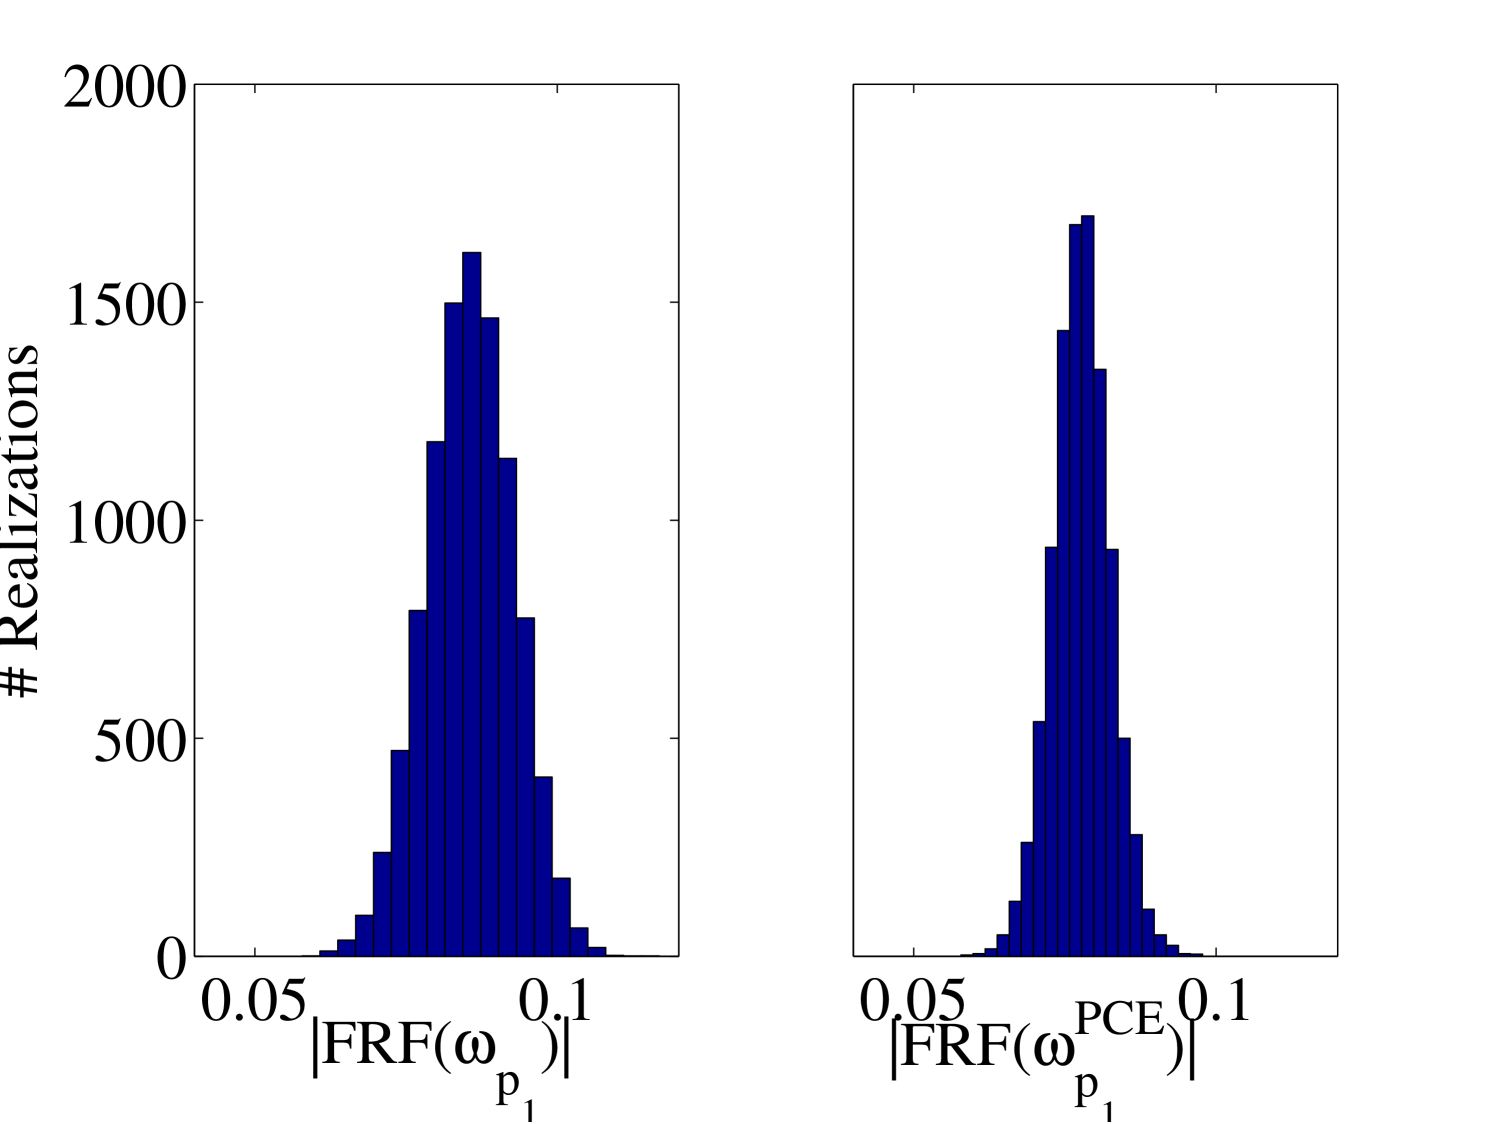
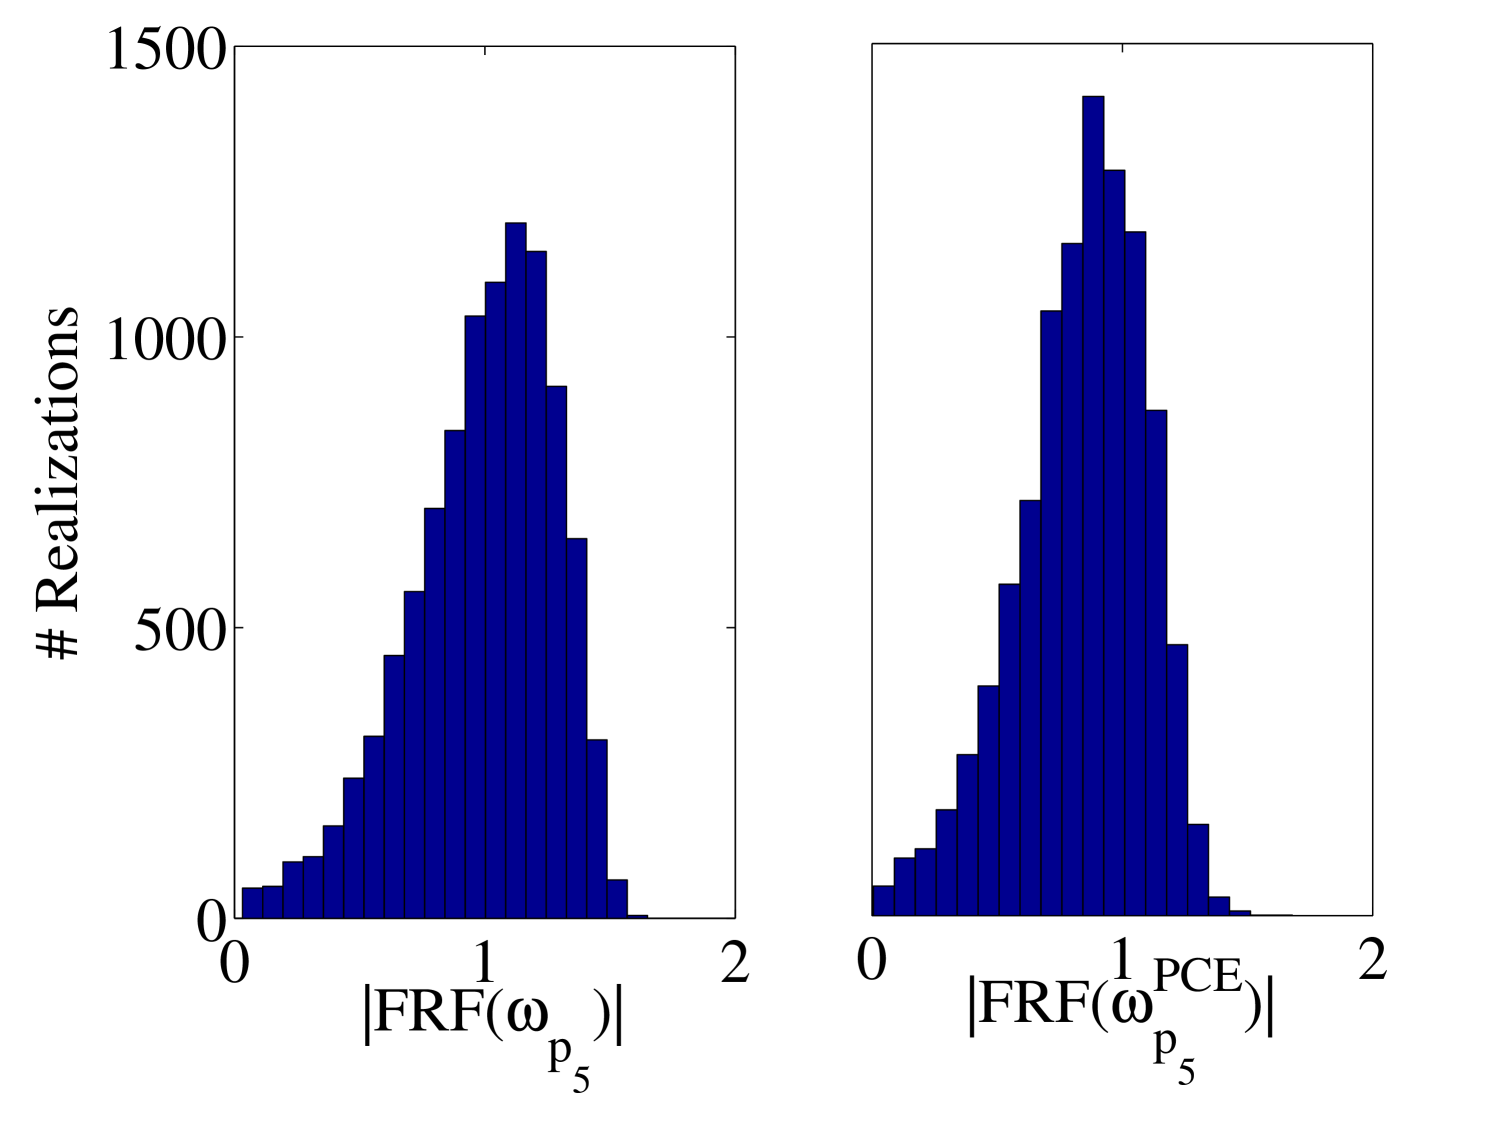
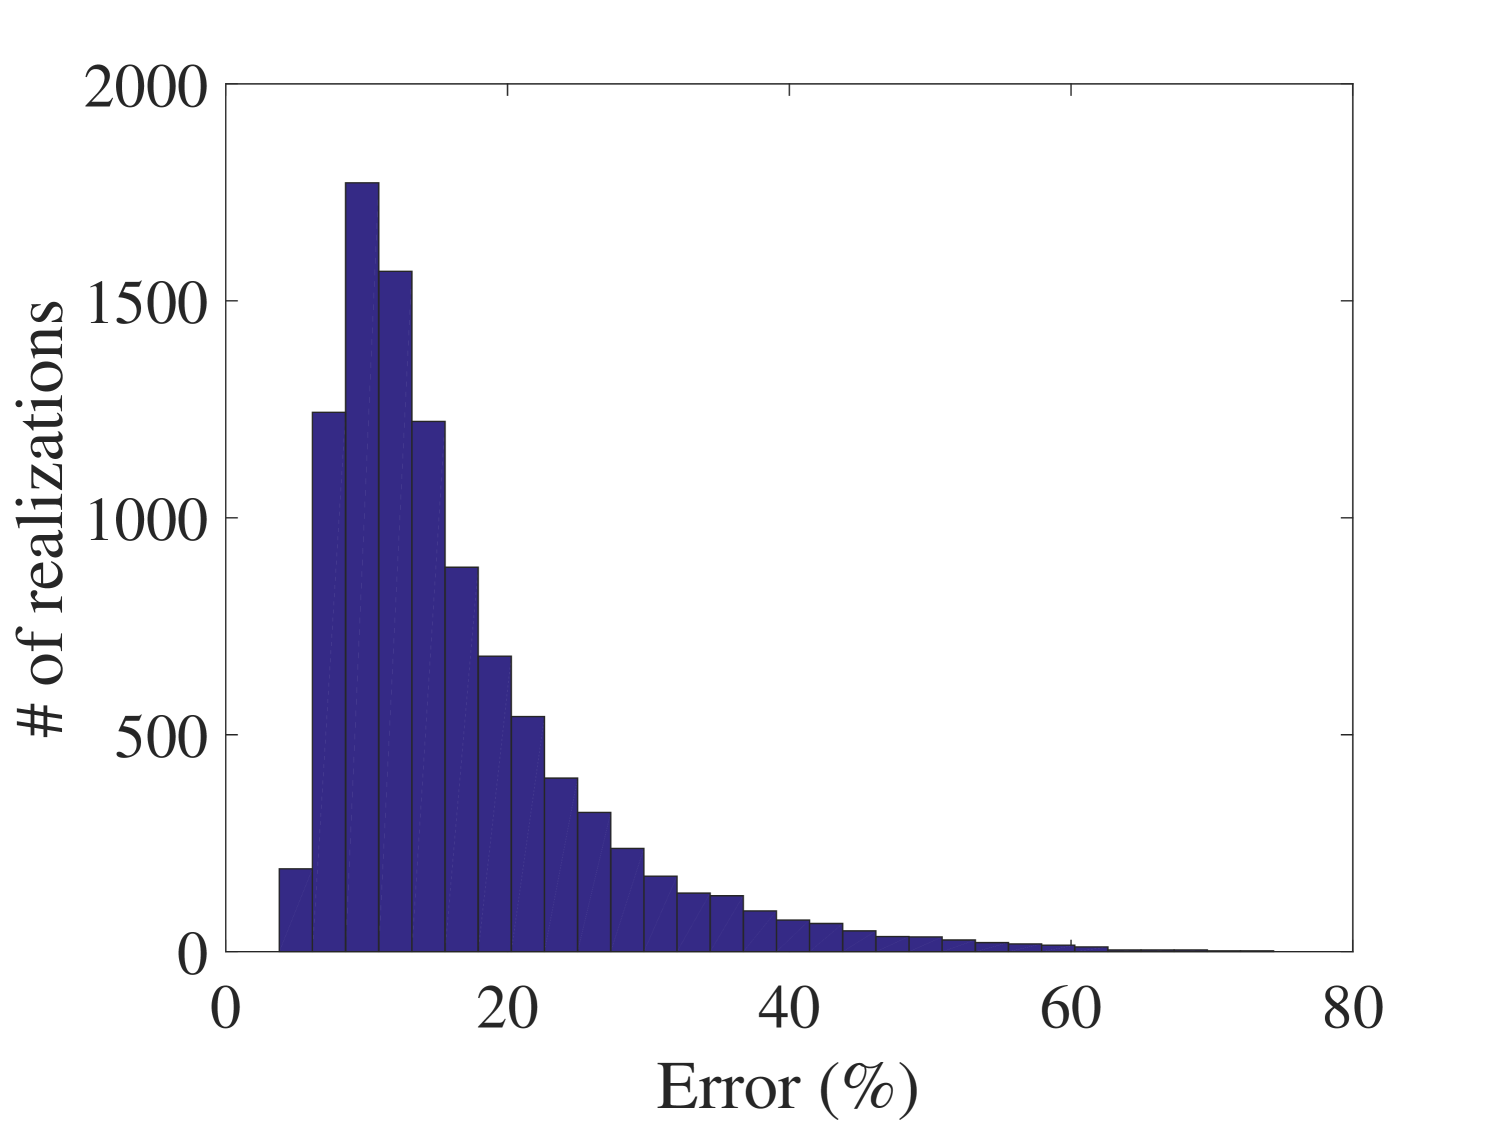
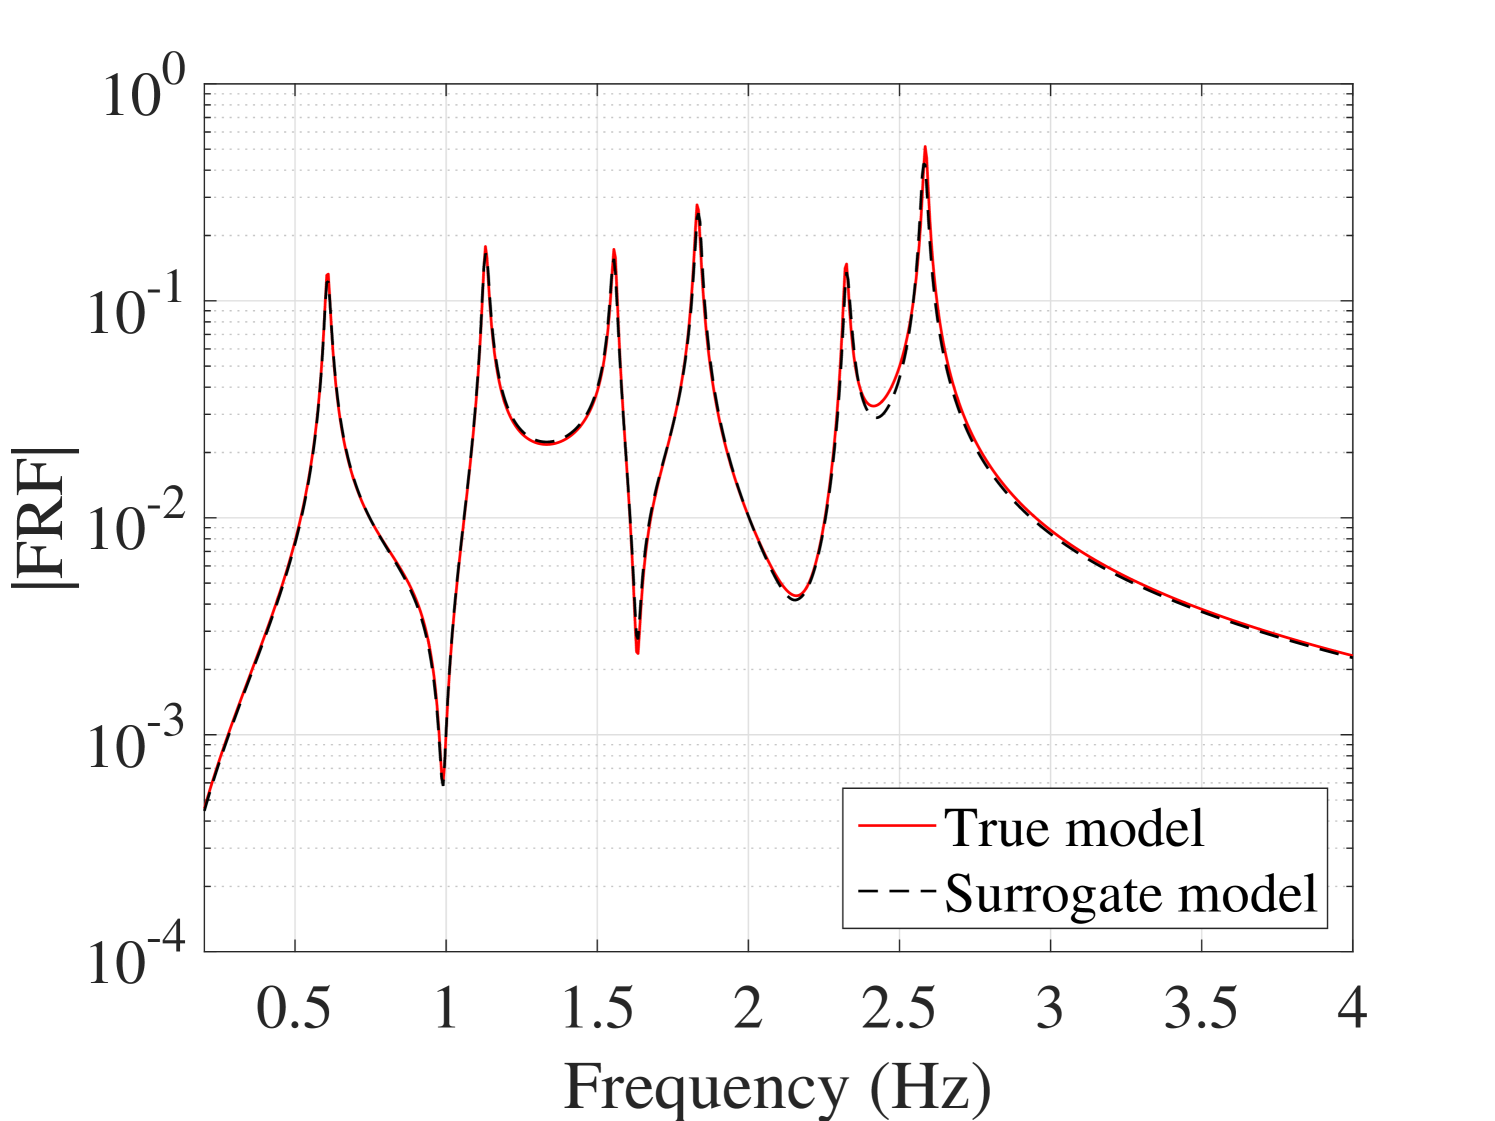
Besides, at all the validation points the FRFs are calculated by both the true model and the surrogate model. The variation of the amplitudes at the first and fifth resonant frequencies are shown as histograms in Figure 17. Plots of the individual FRFs are reported in Figure 18 for output. In order to assess the error quantitatively, each response of the surrogate model has been compared with the corresponding one of the true model in the root-mean-square sense. This error is evaluated using Eq. (24) and the corresponding results are presented in Figure 19. They indicate the high accuracy of the proposed surrogate model in predicting the FRFs.
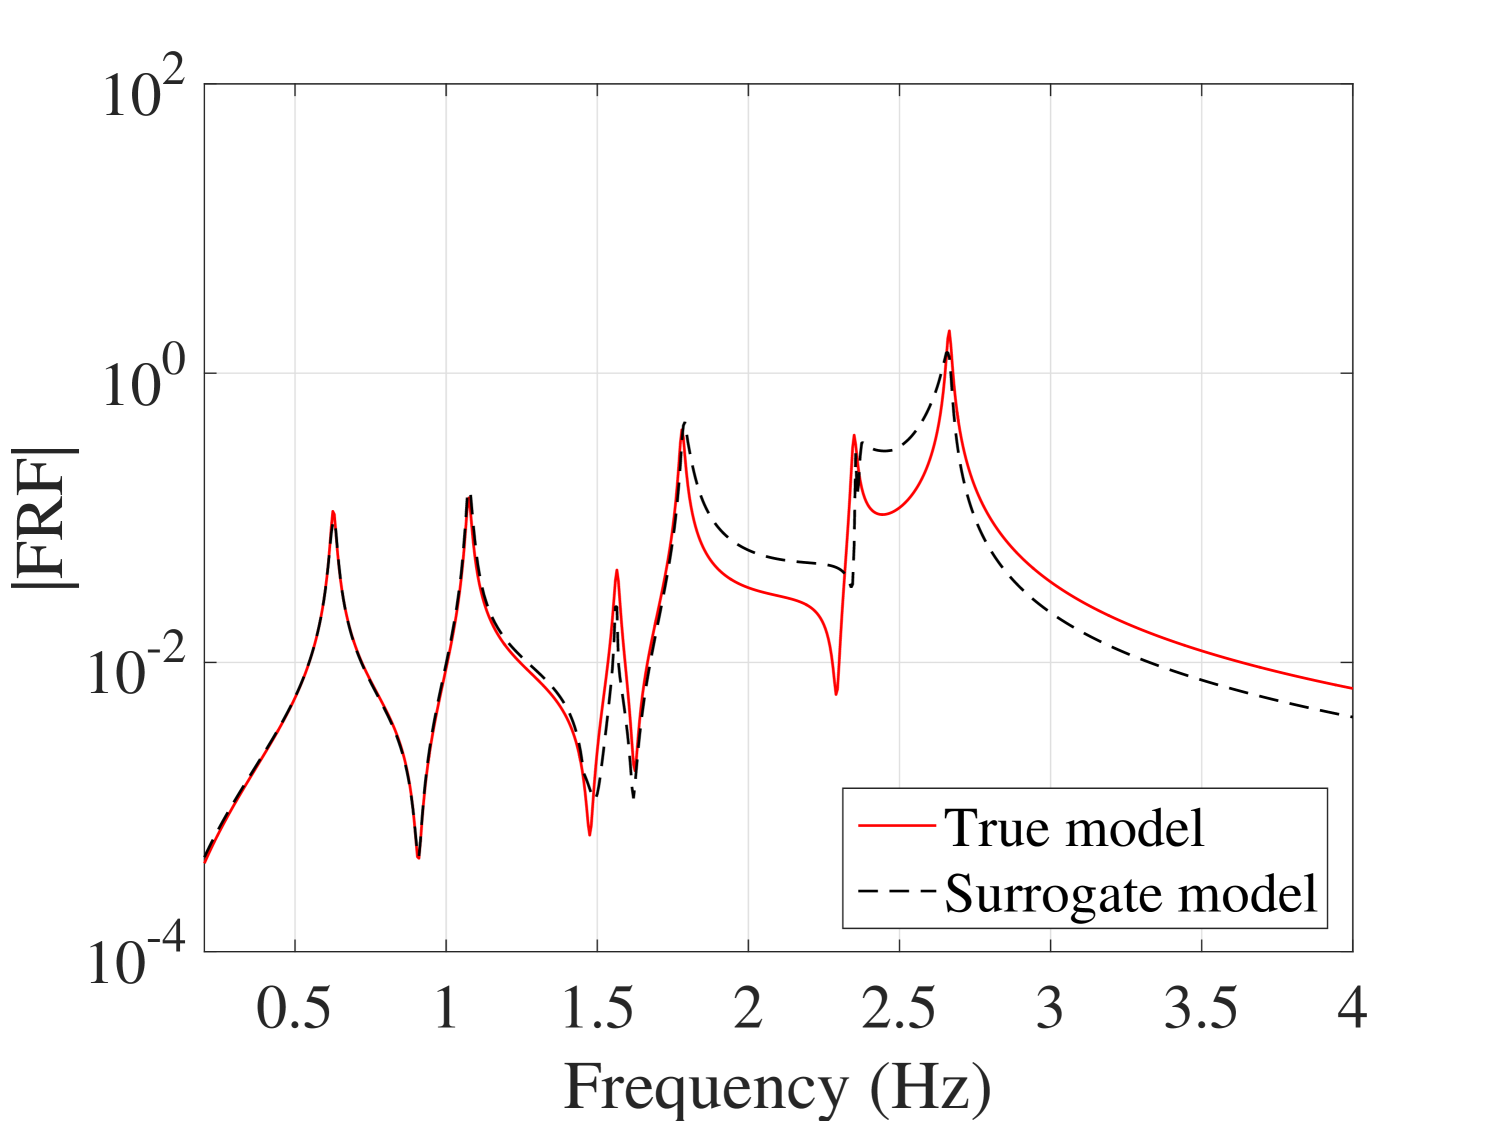
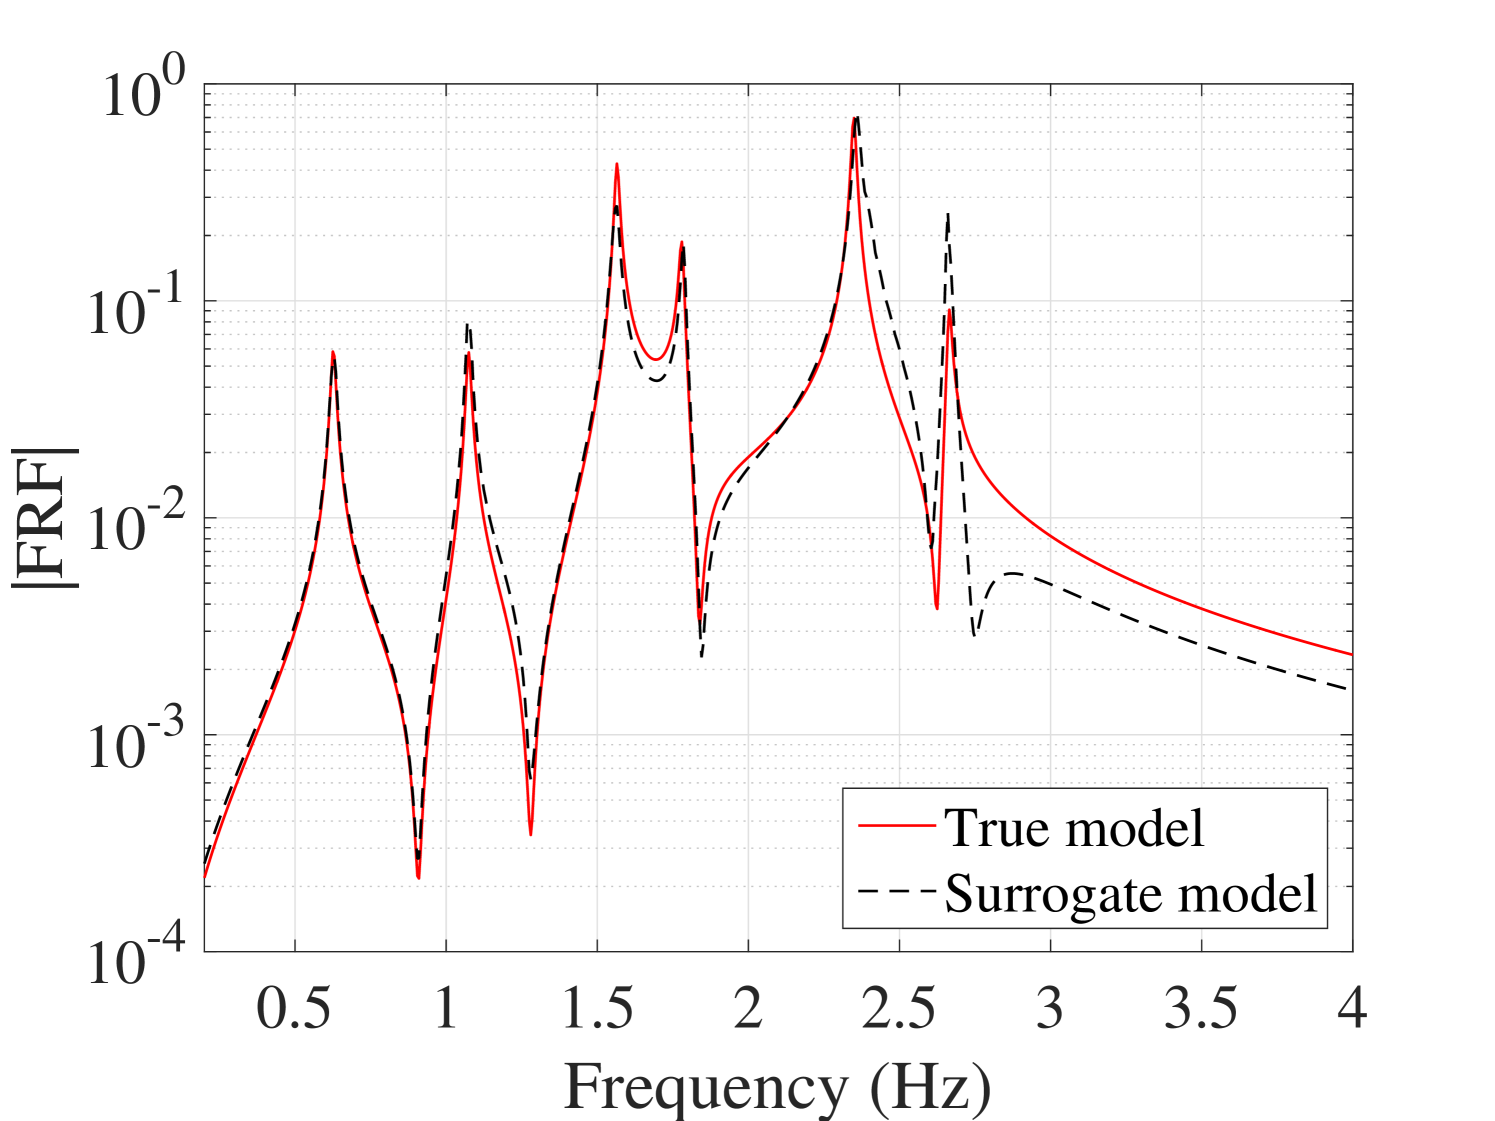
As an individual comparison between the true FRFs and predicted by the surrogate model, two cases are considered: one case with an average and one with the maximum overall error, are selected and their output are demonstrated in Figure 20. The other outputs are presented in B.3.
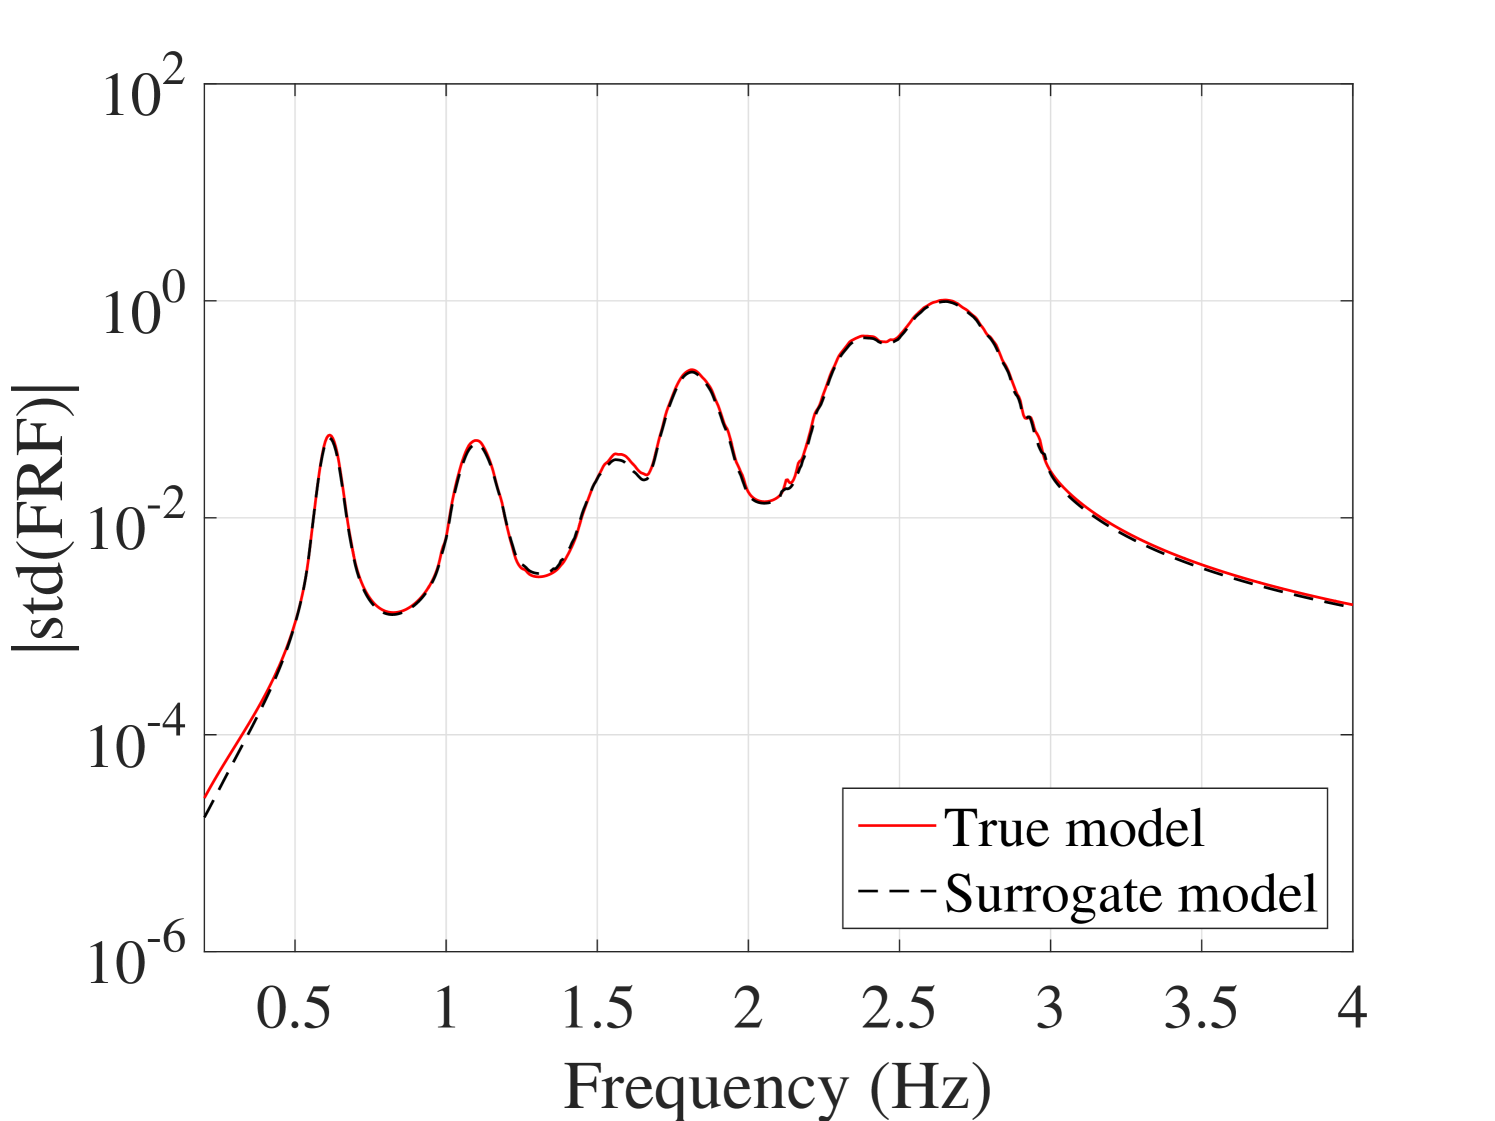
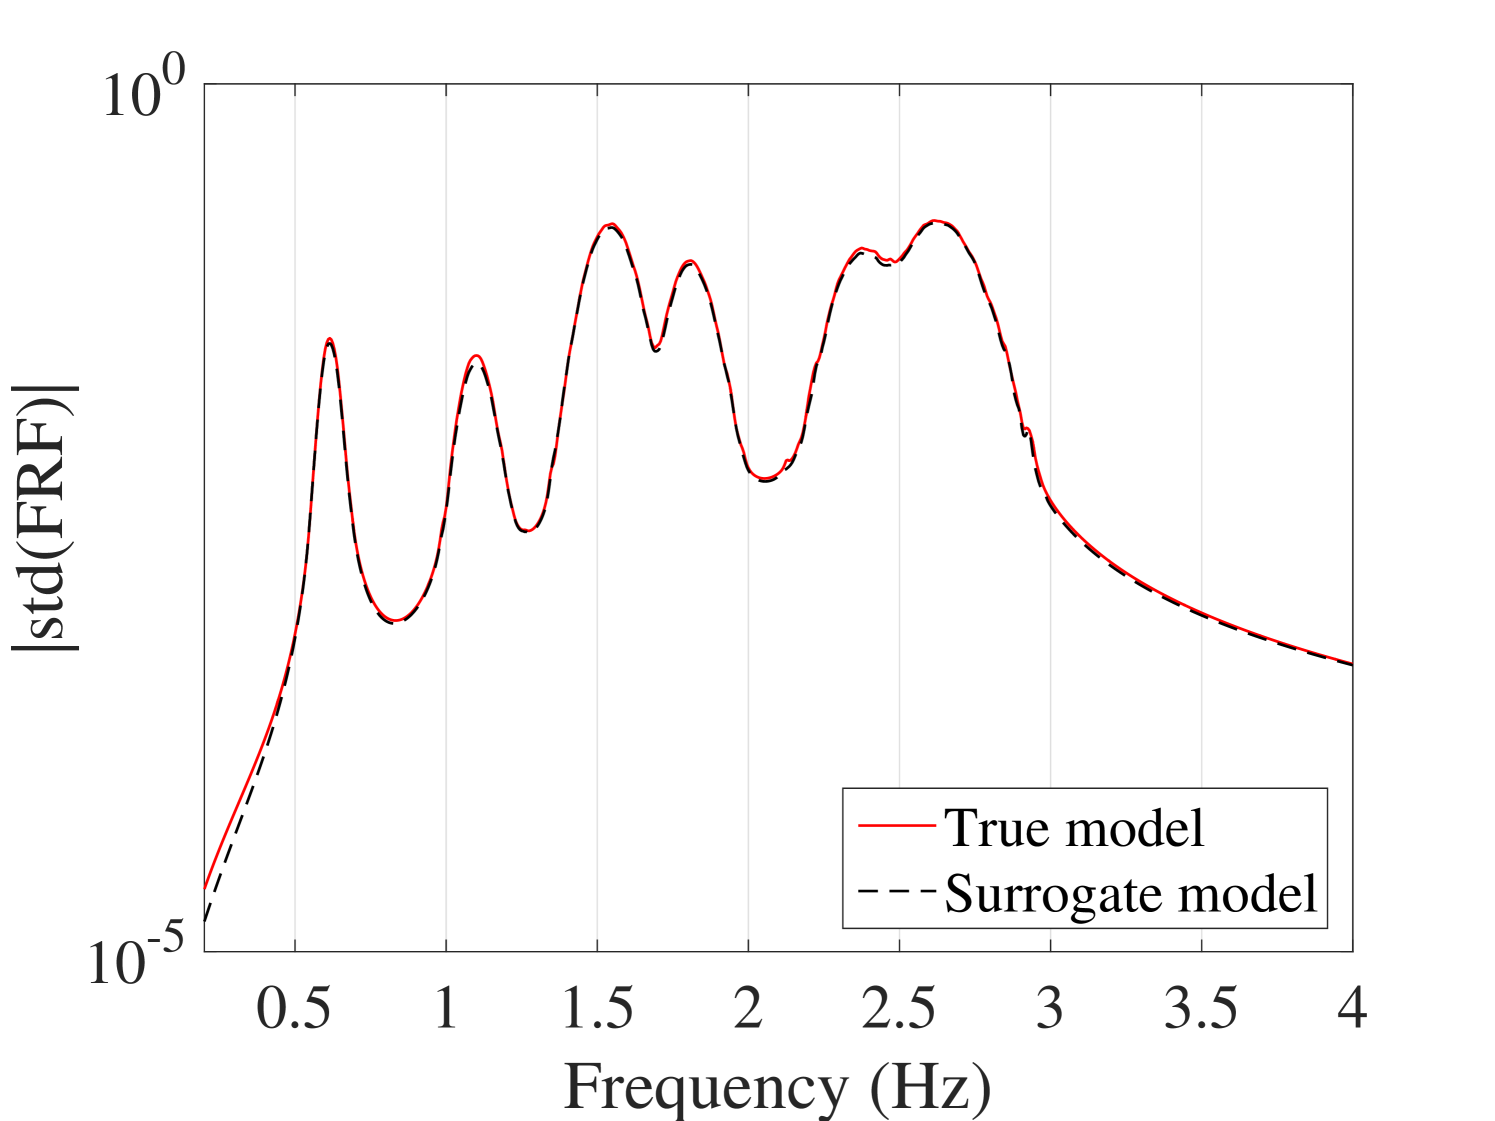
The mean and standard deviations of the FRFs were compared with the reference ones. The results for output are plotted in Figure 21. The other outputs are plotted in B.2. They indicate that although both the mean and the standard deviation match with their reference, the standard deviation presents minor mismatch at the peaks.
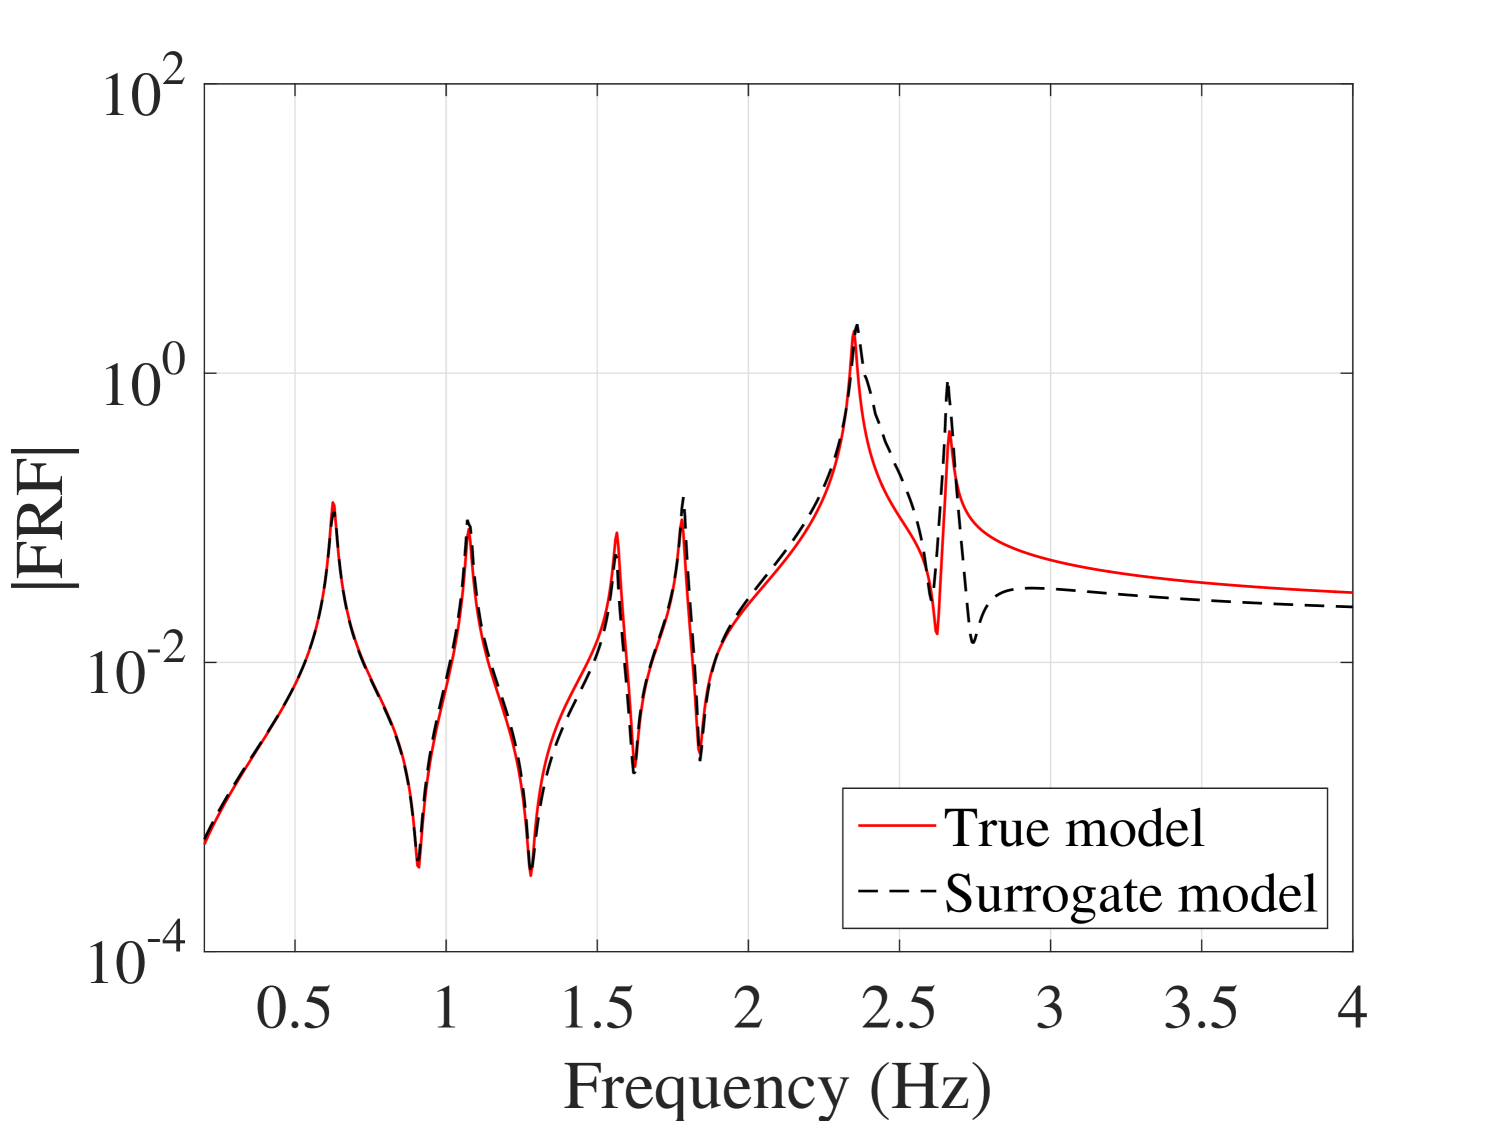
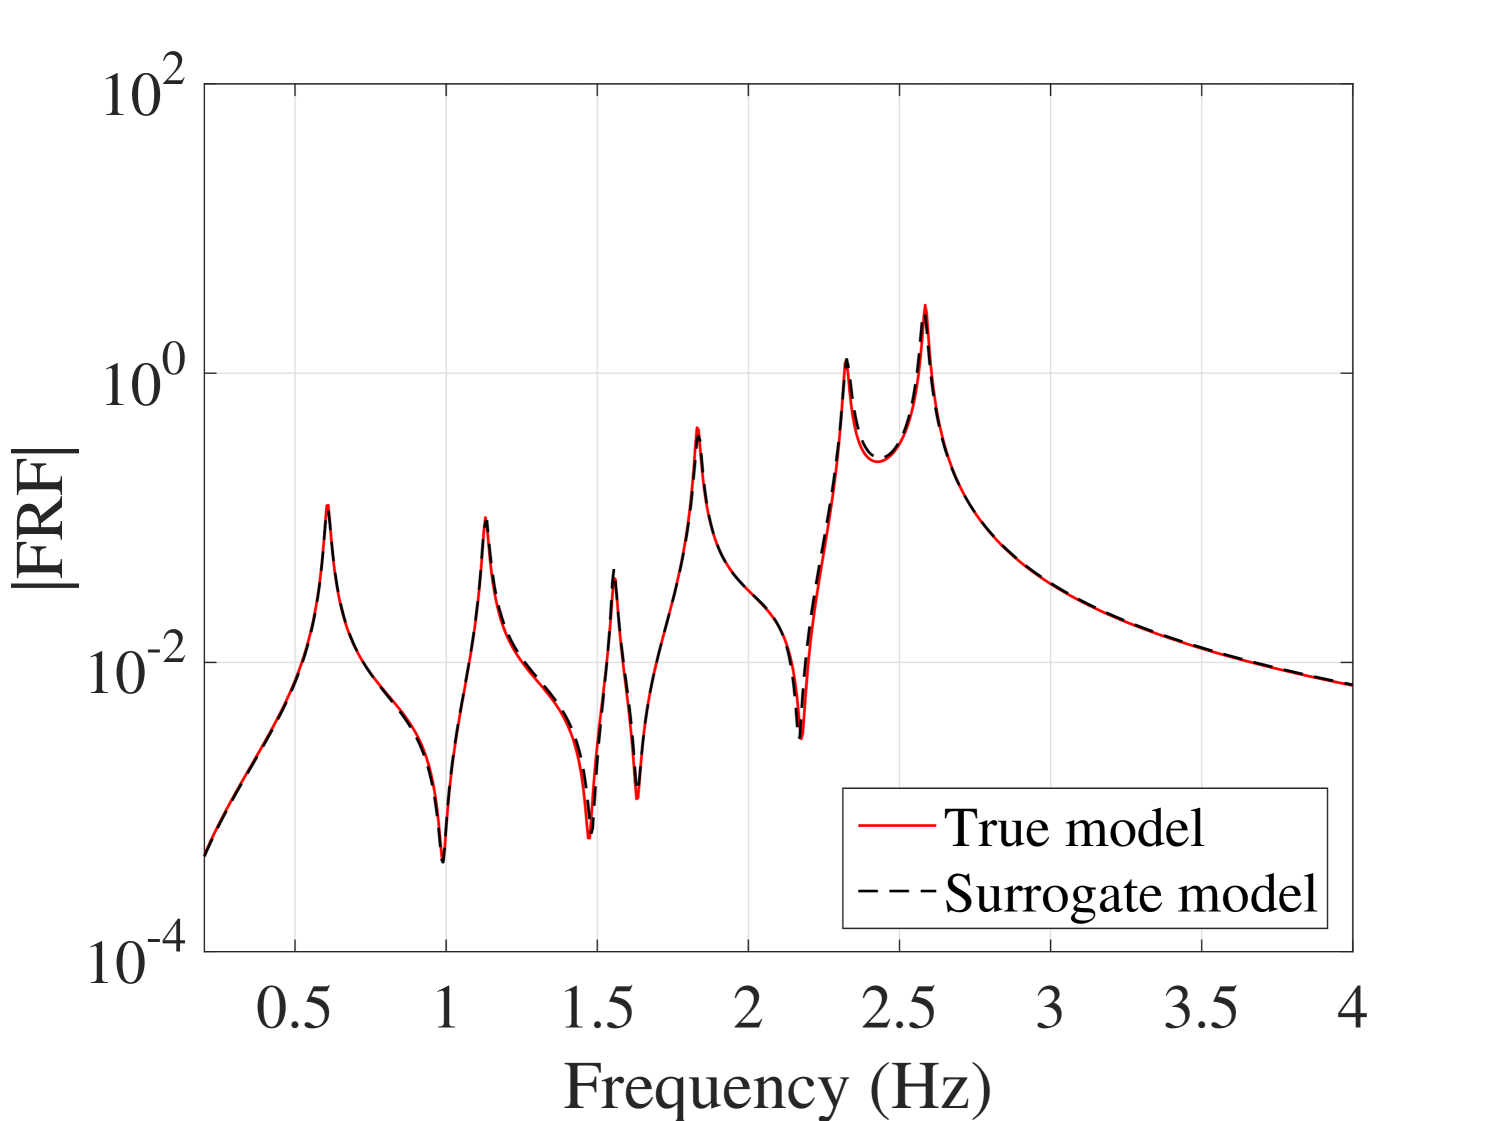
In order to study the effect of the damping level on the accuracy of the proposed method, the study was repeated on the 6-DOF system after setting a much lower damping level. As is shown in Figure 22, if the damping is decreased of one order of magnitude , the convergence of the mean response is still improved, whereas the standard deviation shows a more erratic behavior and reaches a plateau of approximately 40% RMS error. To analyze this phenomenon, a surrogate model has been made with a larger experimental design comprised of 1000 points. A typical FRF predicted by this surrogate model is shown in Figure 23(a). Significant mismatch is observed especially around the peaks, which leads to an overall less accurate estimation of the standard deviation, (see Figure 23(b)). Since this error did not change by enriching the ED, it is concluded that the main source for this error must lie somewhere else in the processing chain. An in-depth analysis revealed that with such low damping levels, peak estimation is inaccurate even when using the full model, if the frequency step is not chosen fine enough. This is one of the main sources of error. Similarly, the interpolation step between pre- and post-processing the frequency axis of the PCE also plays an important role. Both of the errors could in fact be reduced by reducing the frequency step. Indeed, when in a further investigation we reduced the frequency step to 0.005, the error plateau was reduced to 20%.
5 Conclusions
A novel method to build a surrogate model directly for the FRFs of stochastic linear dynamic systems based on sparse PCE has been proposed. To this end, there were two major challenges which have been addressed in this paper: the frequency shifts in the selected frequencies of the FRFs, i.e. peaks and valleys, due to the uncertainty in the parameters of the system and the non-smooth behavior of the FRFs. These can lead to very high-order PCEs even for the FRFs obtained from cases with 1 or 2 DOFs. We thus propose a stochastic frequency-transformation as a preprocessing step before building PCEs. This transformation scales the FRFs in the frequency horizon so that their selected frequencies become aligned. Although this preprocessing step results in one extra set of PCEs, they do not require any additional full model evaluations. After the transformation, FRFs are very similar and low-order PCEs can be built for each frequency. This leads to an enormously large number of random outputs. An efficient implementation of principal component analysis has been used to alleviate this issue. Moreover, the problem of curse of dimensionality of PCEs in cases with large parameter space was resolved by employing the LARS algorithm to build sparse PCEs together with adaptive degree.
Successfully applied to two case studies, the proposed method shows its capability of accurately 1) predicting individual FRFs, 2) estimating the mean and standard deviation of the FRFs, and 3) estimating the eigenfrequencies of the system and their statistics. In cases of very low damping, significant errors can be observed around the peaks. Interpolation error, both for the full model and for the surrogate model were identified as the main cause. In fact, when the frequency step in the full model was too coarse, both the estimation of the resonant frequencies and that of their amplitudes were significantly inaccurate. This in turn resulted in an inaccurate experimental design and, consequently, in inaccurate surrogate models. Reducing the frequency step has been shown to be effective in reducing interpolation error for very low-damping applications.
Appendix A 2-DOF system
A.1 Statistics of the FRF at output
Appendix B 6-DOF system
B.1 Convergence analysis
In this appendix, the results of the convergence analysis of the statistics of the FRFs of the 6-DOF system is presented. The reference results are obtained by running the true model at 10,000 points sampled randomly from the parameter space.
B.1.1 Convergence of the mean of the FRFs


B.1.2 Convergence of the standard deviation of the FRFs
B.2 Moments of the FRFs of the 6-DOF system
In this appendix, the statistics of the FRFs obtained by evaluating the surrogate model and the true model are compared.
B.2.1 Mean of the FRFs
B.2.2 Standard deviation of the FRFs
B.3 Individual FRFs comparison of the 6-DOF system
In this appendix, individual FRFs are compared for two particular cases. One FRF that has average error comparing to the true model and one FRF with the maximum error among 10,000 realizations.
B.3.1 Typical FRFs
B.4 The worst FRFs
Acknowledgment
The first author would like to express his gratitude to the ETH Zurich for its kind host during this work.
References
- Adhikari (2011) Adhikari, S. (2011). Doubly spectral stochastic finite-element method for linear structural dynamics. J. Aerospace Eng. 24, 264–276.
- Adhikari and Pascual (2016) Adhikari, S. and B. Pascual (2016). The ‘damping effect’in the dynamic response of stochastic oscillators. Probabilistic Engineering Mechanics 44, 2–17.
- Amsallem and Farhat (2011) Amsallem, D. and C. Farhat (2011). An online method for interpolating linear parametric reduced-order models. SIAM J. Sci. Comput. 33, 2169–2198.
- Avitabile and O’Callahan (2009) Avitabile, P. and J. O’Callahan (2009). Efficient techniques for forced response involving linear modal components interconnected by discrete nonlinear connection elements. Mech. Syst. Signal Pr. 23, 45–67.
- Berveiller et al. (2006) Berveiller, M., B. Sudret, and M. Lemaire (2006). Stochastic finite element: a non intrusive approach by regression. Eur. J. Comput. Mech. 15, 81–92.
- Blatman and Sudret (2008) Blatman, G. and B. Sudret (2008). Sparse polynomial chaos expansions and adaptive stochastic finite elements using a regression approach. Comptes Rendus Mécanique 336, 518–523.
- Blatman and Sudret (2010) Blatman, G. and B. Sudret (2010). An adaptive algorithm to build up sparse polynomial chaos expansions for stochastic finite element analysis. Probabilist. Eng. Mech. 25, 183–197.
- Blatman and Sudret (2011a) Blatman, G. and B. Sudret (2011a). Adaptive sparse polynomial chaos expansion based on Least Angle Regression. J. Comput. Phys. 230, 2345–2367.
- Blatman and Sudret (2011b) Blatman, G. and B. Sudret (2011b). Adaptive sparse polynomial chaos expansion based on least angle regression. J. Comput. Phys. 230, 2345–2367.
- Blatman and Sudret (2013) Blatman, G. and B. Sudret (2013). Sparse polynomial chaos expansions of vector-valued response quantities. In G. Deodatis (Ed.), Proc. 11th Int. Conf. Struct. Safety and Reliability (ICOSSAR’2013), New York, USA.
- Chatterjee et al. (2016) Chatterjee, T., S. Chakraborty, and R. Chowdhury (2016). A bi-level approximation tool for the computation of FRFs in stochastic dynamic systems. Mech. Syst. Signal Pr. 70, 484 – 505.
- Craig and Kurdila (2006) Craig, R. R. and A. J. Kurdila (2006). Fundamentals of structural dynamics. John Wiley & Sons.
- Efron et al. (2004) Efron, B., T. Hastie, I. Johnstone, R. Tibshirani, et al. (2004). Least angle regression. Ann. Stat. 32, 407–499.
- (14) Frangos, M., Y. Marzouk, K. Willcox, and B. van Bloemen Waanders. Surrogate and reduced-order modeling: A comparison of approaches for large-scale statistical inverse problems.
- Fricker et al. (2011) Fricker, T. E., J. E. Oakley, N. D. Sims, and K. Worden (2011). Probabilistic uncertainty analysis of an FRF of a structure using a Gaussian process emulator. Mech. Syst. Signal Pr. 25, 2962–2975.
- Ghanem and Ghiocel (1998) Ghanem, R. and D. Ghiocel (1998). Stochastic seismic soil-structure interaction using the homogeneous chaos expansion. In Proc. 12th ASCE Engineering Mechanics Division Conference, La Jolla, California, USA.
- Ghanem and Spanos (2003) Ghanem, R. G. and P. D. Spanos (2003). Stochastic finite elements: a spectral approach. Courier Corporation.
- Ghiocel and Ghanem (2002) Ghiocel, D. and R. Ghanem (2002). Stochastic finite element analysis of seismic soil-structure interaction. J. Eng. Mech. 128, 66–77.
- Gilli et al. (2013) Gilli, L., D. Lathouwers, J. Kloosterman, T. van der Hagen, A. Koning, and D. Rochman (2013). Uncertainty quantification for criticality problems using non-intrusive and adaptive polynomial chaos techniques. Ann. Nucl. Energy 56, 71–80.
- Goller et al. (2011) Goller, B., H. Pradlwarter, and G. Schuëller (2011). An interpolation scheme for the approximation of dynamical systems. Comput. Methods Appl. Mech. Engrg. 200, 414–423.
- Hastie et al. (2007) Hastie, T., J. Taylor, R. Tibshirani, G. Walther, et al. (2007). Forward stagewise regression and the monotone lasso. Electron. J. Stat. 1, 1–29.
- Jacquelin et al. (2015a) Jacquelin, E., S. Adhikari, J.-J. Sinou, and M. Friswell (2015a). Polynomial chaos expansion in structural dynamics: Accelerating the convergence of the first two statistical moment sequences. J. Sound. Vib. 356, 144 – 154.
- Jacquelin et al. (2015b) Jacquelin, E., S. Adhikari, J. J. Sinou, and M. I. Friswell (2015b). Polynomial chaos expansion and Steady-State response of a class of random dynamical systems. J. Eng. Mech. 141, 04014145.
- Jones et al. (1998) Jones, D. R., M. Schonlau, and W. J. Welch (1998). Efficient global optimization of expensive black-box functions. J. Global Optim. 13, 455–492.
- Kersaudy et al. (2015) Kersaudy, P., B. Sudret, N. Varsier, O. Picon, and J. Wiart (2015). A new surrogate modeling technique combining Kriging and polynomial chaos expansions–application to uncertainty analysis in computational dosimetry. J. Comput. Phys. 286, 103–117.
- Khorsand Vakilzadeh et al. (2012) Khorsand Vakilzadeh, M., S. Rahrovani, and T. Abrahamsson (2012). An improved modal approach for model reduction based on input-output relation. In Int. Conf. on Noise and Vibration Engineering (ISMA)/Int. Conf. on Uncertainty in Struct. Dynamics (USD). Leuven, Belgium, 2012, pp. 3451–3459. Katholieke Univ Leuven, Dept Werktuigkunde.
- Knio et al. (2001) Knio, O. M., H. N. Najm, R. G. Ghanem, et al. (2001). A stochastic projection method for fluid flow: I. basic formulation. J. Comput. Phys. 173, 481–511.
- Kundu and Adhikari (2015) Kundu, A. and S. Adhikari (2015). Dynamic analysis of stochastic structural systems using frequency adaptive spectral functions. Probabilit. Eng. Mech. 39, 23–38.
- Kundu et al. (2014) Kundu, A., F. DiazDelaO, S. Adhikari, and M. Friswell (2014). A hybrid spectral and metamodeling approach for the stochastic finite element analysis of structural dynamic systems. Comput. Methods Appl. Mech. Engrg. 270, 201–219.
- Laub (2004) Laub, A. J. (2004). Matrix Analysis For Scientists And Engineers. Philadelphia, PA, USA: Society for Industrial and Applied Mathematics.
- Liu et al. (2012) Liu, T., C. Zhao, Q. Li, and L. Zhang (2012). An efficient backward Euler time-integration method for nonlinear dynamic analysis of structures. Comput. Struct. 106, 20–28.
- Mai and Sudret (2015) Mai, C. V. and B. Sudret (2015). Polynomial chaos expansions for damped oscillators. In Proc. 12th Int. Conf. on Applications of Stat. and Prob. in Civil Engineering (ICASP12), Vancouver, Canada.
- Manan and Cooper (2010) Manan, A. and J. Cooper (2010). Prediction of uncertain frequency response function bounds using polynomial chaos expansion. J. Sound Vib. 329, 3348–3358.
- Pagnacco et al. (2013) Pagnacco, E., E. Sarrouy, R. Sampaio, and E. S. De Cursis (2013). Polynomial chaos for modeling multimodal dynamical systems-investigations on a single degree of freedom system. In Mecánica Computacional, Mendoza, Argentina.
- Pichler et al. (2012) Pichler, L., A. Gallina, T. Uhl, and L. A. Bergman (2012). A meta-modeling technique for the natural frequencies based on the approximation of the characteristic polynomial. Comput. Struct. 102-103, 108116.
- Pichler et al. (2009) Pichler, L., H. Pradlwarter, and G. Schuëller (2009). A mode-based meta-model for the frequency response functions of uncertain structural systems. Comput. Struct. 87, 332–341.
- Rahrovani et al. (2014) Rahrovani, S., M. K. Vakilzadeh, and T. Abrahamsson (2014). Modal dominancy analysis based on modal contribution to frequency response function ℋ2-norm. Mech. Syst. Signal Pr. 48, 218–231.
- Schöbi et al. (2015) Schöbi, R., B. Sudret, and J. Wiart (2015). Polynomial-chaos-based Kriging. Int. J. Uncertainty Quantification 5, 171–193.
- Schuëller and Pradlwarter (2009) Schuëller, G. and H. Pradlwarter (2009). Uncertain linear systems in dynamics: Retrospective and recent developments by stochastic approaches. Eng. Struct. 31, 2507–2517.
- Soize and Ghanem (2004) Soize, C. and R. Ghanem (2004). Physical systems with random uncertainties: chaos representations with arbitrary probability measure. SIAM J. Sci. Comput. 26, 395–410.
- Sudret (2007) Sudret, B. (2007). Uncertainty propagation and sensitivity analysis in mechanical models – contributions to structural reliability and stochastic spectral methods. Technical report. Habilitation à diriger des recherches, Université Blaise Pascal, Clermont-Ferrand, France (229 pages).
- Tak and Park (2013) Tak, M. and T. Park (2013). High scalable non-overlapping domain decomposition method using a direct method for finite element analysis. Comput. Methods Appl. Mech. Engrg. 264, 108–128.
- Wiener (1938) Wiener, N. (1938). The homogeneous chaos. Amer. J. Math., 897–936.
- Xiu and Karniadakis (2002) Xiu, D. and G. E. Karniadakis (2002). The Wiener–Askey polynomial chaos for stochastic differential equations. SIAM J. Sci. Comput. 24, 619–644.
- Yaghoubi et al. (2016) Yaghoubi, V., T. Abrahamsson, and E. A. Johnson (2016). An efficient exponential predictor-corrector time integration method for structures with local nonlinearity. Eng. Struct. 128, 344 – 361.
- Yaghoubi et al. (2015) Yaghoubi, V., M. K. Vakilzadeh, and T. Abrahamsson (2015). A parallel solution method for structural dynamic response analysis. In Dynamics of Coupled Structures, Volume 4, pp. 149–161. Springer.
- Yu et al. (2011) Yu, H., F. Gillot, and M. Ichchou (2011). Hermite polynomial chaos expansion method for stochastic frequency response estimation considering modal intermixing. In ECCOMAS Thematic Conf. on Computational Methods in Structural Dynamics and Earthquake Engineering, Corfu, Greece, 2011.