The Daya Bay Collaboration
Spectral measurement of electron antineutrino oscillation amplitude and frequency at Daya Bay
Abstract
A measurement of the energy dependence of antineutrino disappearance at the Daya Bay Reactor Neutrino Experiment is reported. Electron antineutrinos () from six GWth reactors were detected with six detectors deployed in two near (effective baselines 512 m and 561 m) and one far (1579 m) underground experimental halls. Using 217 days of data, 41589 (203809 and 92912) antineutrino candidates were detected in the far hall (near halls). An improved measurement of the oscillation amplitude and the first direct measurement of the mass-squared difference is obtained using the observed rates and energy spectra in a three-neutrino framework. This value of is consistent with measured by muon neutrino disappearance, supporting the three-flavor oscillation model.
pacs:
14.60.Pq, 29.40.Mc, 28.50.Hw, 13.15.+gExperimental measurements of neutrino oscillations have clearly established that neutrinos have mass and that the mass eigenstates mix Beringer et al. (2012). The Daya Bay experiment recently reported the discovery of the disappearance of reactor antineutrinos over kilometer-long baselines, providing the most precise measurement of the mixing angle An et al. (2012a, 2013). Other experiments have made consistent measurements Ahn et al. (2012); Abe (2012); Adamson et al. (2013a); Abe et al. (2013). Precise knowledge of neutrino mixing and mass differences enables experimental searches for CP violation, tests of the neutrino mass hierarchy and precision tests of oscillation theory. In particular, the relatively large value of facilitates a rich program of future neutrino oscillation research Bishai et al. ; Y. F. Li, J. Cao, Y. F. Wang, and L. Zhan (2013); Balantekin et al. . It also allows the Daya Bay experiment to report in this Letter an independent measurement of the neutrino mass-splitting via the distortion of the reactor antineutrino energy spectrum.
In the framework of three-flavor neutrino mixing in vacuum, the probability that an produced with energy is detected as an at a distance is given by
where , and is the difference between the mass-squares of the mass eigenstates and . Since Beringer et al. (2012), the short-distance (km) reactor oscillation is due primarily to the terms and naturally leads to the definition of the effective mass-squared difference 111Our definition is consistent with H. Minakata, H. Nunokawa, S. J. Parke and R. Zukanovich Funchal, Phys. Rev. D 74, 053008 (2006). .
The Daya Bay experiment previously determined using only the relative rates of detected in three antineutrino detectors (ADs) located near to and three ADs located far from six nuclear reactor cores An et al. (2012a, 2013). The effective mass splitting measured in disappearance Adamson et al. (2011) provided a good approximation of in the rate-only measurement. This Letter presents a combined analysis of the rates and energy spectra measured for the six detector data-taking period from 24 December 2011 to 28 July 2012. This represents a 48% increase in statistics over the most recent result An et al. (2013). The uncertainty is reduced by inclusion of the spectral information and the statistics of the complete six-AD data period. The spectral distortion due to the term provides a strong confirmation that the observed deficit is consistent with neutrino oscillations and allows the first direct measurement of .
A detailed description of the Daya Bay experiment can be found in An et al. (2012b, ). Each of the three experimental halls (EHs) contains functionally identical, three-zone ADs surrounded by a pool of ultra-pure water segmented into two regions, the inner water shield (IWS) and outer water shield (OWS), which are instrumented with photomultiplier tubes (PMTs). In each AD, light created as a result of particle interactions in the innermost zone, defined by an inner acrylic vessel (IAV) containing gadolinium-doped liquid scintillator (LS), and the surrounding undoped LS zone, is collected by 192 radially-positioned 20-cm PMTs in the outermost mineral-oil region. The AD trigger threshold of 45 hit PMTs or a summed charge of photoelectrons in all PMTs corresponds to about 0.4 MeV in the Gd-doped volume. The trigger inefficiency for events above 0.7 MeV is negligible. Charge and timing information for each PMT are available for energy calibration and reconstruction, as described in Ref. An et al. (2012b). The detectors have a light yield of photoelectrons/MeV and a reconstructed energy resolution of at 1 MeV.
Reactor antineutrinos are detected via the inverse -decay (IBD) reaction, . The delayed gamma rays (totalling MeV) generated from the neutron capture on Gd with a mean capture time of enable powerful background suppression. The prompt light from the gives an estimate of the incident energy, MeV, where is the prompt event energy including the positron kinetic energy and the annihilation energy, and is the average neutron recoil energy ( keV).
Interpretation of the observed prompt energy spectra requires characterization of the detector response to , and , which maps the true energy () to the reconstructed energy (). is determined by scaling the measured total charge with a position-dependent correction An et al. (2012b, 2013). For a or , is the kinetic energy; for a positron is the sum of the kinetic energy and the energy from annihilation. The energy response is not linear due to scintillator and electronics effects and is taken into account by two functions, and , respectively. The scintillator nonlinearity is particle- and energy-dependent, and is related to intrinsic scintillator quenching and Cherenkov light emission. The quenching effects are constrained by standalone measurements with a fast neutron beam as well as by neutron source data and radioactive -decays in the AD. The Cherenkov contribution is also affected by absorption and reemission in the liquid scintillator. The scintillator nonlinearity for electrons is described by an empirical model , where is the total visible light generated by the particle and are the model parameters. A GEANT4-based Agostinelli et al. (2003); Allison et al. (2006) Monte-Carlo simulation (MC) is used to relate the scintillator nonlinearity to the response for and . The electronics nonlinearity, , is introduced due to the interaction of the scintillation light time profile and the charge collection of the front-end electronics. Given the similar timing profiles for and s, it is modeled as an exponential function of as determined by studying the time profile of charge in the data and MC.
The energy model, , is determined by a fit to monoenergetic lines from radioactive sources and the continuous spectrum extracted from 12B data. Sources were deployed at the center of all ADs regularly (68Ge, 60Co, 241Am-13C) An et al. (2012b) and during a special calibration period in summer 2012 (137Cs, 54Mn, 40K, 241Am-9Be, Pu-13C) with AD1 and AD2 in near-hall EH1. In addition, gamma peaks in all ADs which could be identified with singles and correlated spectra in data (40K, 208Tl, capture on H, C, and Fe) were included. For source data with multiple gamma-line emissions, is computed for each gamma then summed up, whereas is computed based on the total . The 12B isotopes are produced cosmogenically at the rate of about 900 (60) events/day/AD at the near (far) site. The measured relative nonlinearity of among 6 ADs An et al. (2013) is negligible in the context of the energy model.
Figure 1 compares the best-fit energy model with the single-gamma, multi-gamma and continuous 12B data used to determine the model parameters. As additional validation, the energy model prediction for the continuous spectra from 212Bi, 214Bi and 208Tl decays was compared with the data and found to be consistent.
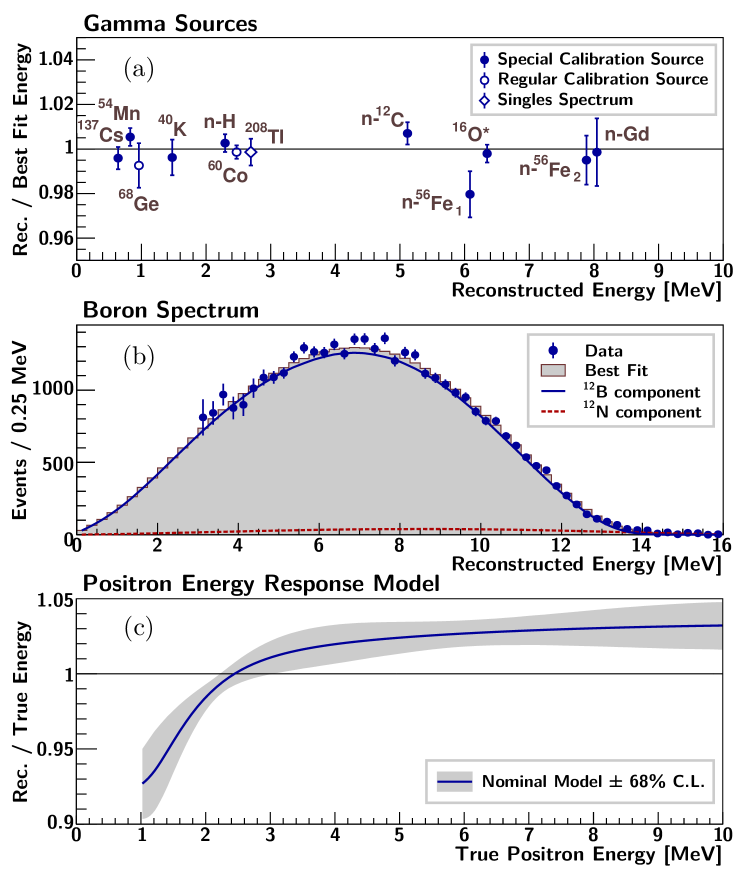
Alternative energy response models, based on different methodologies, were constructed. The second method builds the scintillator nonlinearity based on Birks’ formula Birks (1951) and Cherenkov radiation theory. The model is characterized by Birks’ constant and the Cherenkov light contribution . is determined from the residual nonlinearity of the same and -decay calibration data set. The third method does not use data but only uses -decay from 12B, as well as the internal radioactive -decays of 212Bi, 214Bi and 208Tl, to construct the energy model.
All positron energy response models were consistent with each other to . The uncertainty in the energy response, shown in Fig. 1, is conservatively estimated by combining the calibration and model uncertainties. The energy response has a marginal effect on the measured oscillation parameters because it is essentially identical for all ADs.
The observed prompt energy spectrum is modified because positrons from IBD interactions near the IAV can deposit energy in the acrylic without generating scintillation light. This significantly affects of all IBD positrons causing an enhancement near MeV that is taken into account using MC.
The analysis used for previous Daya Bay results An et al. (2012a, 2013) has been repeated with the full six-AD data sample. The rate uncertainty of the background is slightly reduced compared to the previous analysis due to the increased statistics. The rate-only analysis yields with . The analysis has also been updated to include spectral information by applying the energy nonlinearity correction to the positron spectrum and measuring the spectral distribution of the five background sources. The spectral uncertainties of the five backgrounds are included as uncorrelated among energy bins in the fit of the oscillation parameters, to allow all possible spectral models consistent with the data. The combined rate and spectral analysis yields and with which are consistent with the results to be described in this Letter.
This Letter presents the results of an analysis that is largely independent of the analysis described in An et al. (2012a, 2013). The two analyses differ in terms of event reconstruction, energy calibration, IBD selection, background estimation and construction of the used for determination of the oscillation parameters. The selected IBD candidates differ by 3.7% (11%) at the far (near) sites. A “blind analysis” strategy was implemented by concealing the reactor history and thermal power information for all cores for the new data period.
IBD candidates are selected with the criteria that follows. First, events caused by PMT light emission are efficiently removed using the techniques of An et al. (2013). Candidates are then selected by requiring a prompt-like signal ( MeV) in coincidence with a delayed-like signal ( MeV) separated by . Candidate pairs are vetoed if their delayed-like events occur (i) within a (, ) time-window with respect to an IWS or OWS trigger with a PMT multiplicity 12, (ii) within a (, ) time-window with respect to triggers in the same AD with a total light yield larger than photoelectrons, or (iii) within a (, ) time-window with respect to triggers in the same AD with a total light yield higher than photoelectrons. This targeted muon veto allows for efficient removal of spurious triggers that follow a muon as well as most muon-induced spallation products. Finally, a multiplicity cut is applied to remove any ambiguities in the IBD pair selection. This cut requires no additional prompt-like signals before the delayed event, and no delayed-like signals after the delayed event. The muon veto efficiency () and multiplicity cut efficiency () are calculated directly from data with negligible uncertainties for each AD. The average values of are summarized in Tab. 1.
A detailed treatment of the absolute and relative efficiencies, as well as their corresponding uncertainties, has been reported in An et al. (2012b, 2013). The uncertainties of the absolute efficiencies are correlated among ADs and thus play a negligible role in the extraction of the oscillation parameters. All differences among ADs are treated as uncorrelated uncertainties. In the rate-only analysis, the uncorrelated uncertainties are dominated by the delayed-energy cut (0.12%) and Gd capture fraction (0.1%). In the spectral analysis, additional uncorrelated uncertainty comes from the relative energy scale difference between ADs. Based upon the relative response in all ADs to identified gamma and alpha peaks from numerous sources that span the IBD positron energy range, a 0.35% uncertainty is assigned.
Five sources of background are identified. The accidental background, defined as any pair of otherwise uncorrelated signals that happen to satisfy the IBD selection criteria, is the largest background in the antineutrino sample. The rate and energy spectra of this background can be accurately determined by measuring the singles rates of prompt- and delayed-like signals and then calculating the probability that the two randomly satisfy the selection criteria. Alternative estimation methods yield consistent results. The relative uncertainty of this background is 0.3% and is dominated by the statistics in the rate of delayed-like signals.
The correlated decays from cosmogenic 9Li and 8He can mimic IBD interactions. The rate of correlated background from this source is estimated by fitting the distribution of the time elapsed since the last muon with the known 9Li and 8He decay lifetimes L. J. Wen, J. Cao, K. B. Luk, Y. Q. Ma, Y. F. Wang, and C. G. Yang (2006). The 20% systematic uncertainty takes into account the uncertainty in 9Li and 8He production by muons with energy below the showering muon threshold. The rate is assumed to be the same for ADs at the same site. The fraction of 9Li events in this background is estimated to be based on data and MC. The spectra are calculated with a model that simulates the decay chain of each isotope into their daughters based on external data Nyman et al. (1990); Bjornstad et al. (1981). The spectral uncertainty of this background is estimated by assigning large variations to the energy response model, particularly for the neutron and alpha daughter particles.
Neutrons from the Hz Am-C calibration sources inside the automated calibration units on top of the ADs can occasionally mimic IBD events by inelastically scattering with nuclei in the shielding material and then capturing on Fe/Cr/Mn/Ni. This produces two rays that both enter the scintillating region. The MC is used to estimate the rate of this background. The normalization is constrained by the measured rate of single delayed-like candidates from this source. A special Am-C source, approximately 80 times more potent than the calibration sources, was temporarily deployed during summer 2012. Results from this source are used to benchmark the MC and provide the estimate of the 45% uncertainty in the rate normalization. The energy spectrum of this background is modeled as an exponential, the parameters of which are constrained by these data.
Through elastic scattering with protons and the subsequent thermalization and capture on gadolinium, energetic neutrons produced by cosmic rays can mimic IBD interactions. The energy of the proton-recoil signal ranges from sub-MeV up to several hundred MeV. If the prompt energy criterion is loosened to (0.7 - 50) MeV, a flat spectrum is observed up to MeV, which is extrapolated into the IBD energy region. The flat spectrum assumption is corroborated through the study of fast neutrons associated with muons identified by the muon veto system and by MC. A systematic uncertainty in the rate is assigned. The rate is assumed to be the same for ADs in the same experimental hall.
The 13C(,n)16O background is determined from a simulation adjusted with the measured alpha-decay rates from , , and decay chains. This background represents only about and of the total IBD sample in the near and far sites, respectively.
The estimated IBD and background rates are summarized in Tab. 1 and displayed in Fig. 2. Backgrounds amount to about (2%) of the IBD candidate sample in the far (near) sites.
| EH1 | EH2 | EH3 | ||||
| AD1 | AD2 | AD3 | AD4 | AD5 | AD6 | |
| IBD candidates | 101290 | 102519 | 92912 | 13964 | 13894 | 13731 |
| DAQ live time (days) | 191.001 | 189.645 | 189.779 | |||
| 0.7957 | 0.7927 | 0.8282 | 0.9577 | 0.9568 | 0.9566 | |
| Accidentals (per day) | 9.540.03 | 9.360.03 | 7.440.02 | 2.96 0.01 | 2.92 0.01 | 2.87 0.01 |
| Fast-neutron (per AD per day) | 0.920.46 | 0.620.31 | 0.040.02 | |||
| 9Li/8He (per AD per day) | 2.400.86 | 1.200.63 | 0.220.06 | |||
| Am-C correlated (per AD per day) | 0.260.12 | |||||
| 13C(, n)16O background (per day) | 0.080.04 | 0.070.04 | 0.050.03 | 0.040.02 | 0.040.02 | 0.040.02 |
| IBD rate (per day) | 653.302.31 | 664.152.33 | 581.972.07 | 73.31 0.66 | 73.03 0.66 | 72.20 0.66 |
The spectrum from a reactor with thermal power at energy and on a given day is
with the fission fractions from each isotope , the thermal energy released per fission for each isotope , the yield per fission for each isotope , the correction to the yield due to reactor non-equilibrium effects and the spent nuclear fuel . The nuclear reactor operators provide daily effective livetime-corrected thermal power as well as periodic burn-up and simulation-based fission fraction data that are used to calculate daily fission fractions. The flux at each detector is calculated by summing the contributions of all reactors. The treatment of , , , and terms are described in An et al. (2012a, 2013). The integrated, livetime-corrected, exposure for the EH3 ADs is with mean fission fractions . Due to the relative measurement of near and far detectors, the measurement of oscillation parameters is insensitive to the choice of K. Schreckenbach, G. Colvin, W. Gelletly, and F. von Feilitzsch (1985); Hahn et al. (1989); von Feilitzsch et al. (1982); Vogel et al. (1981); Huber (2011); Mueller et al. (2011).
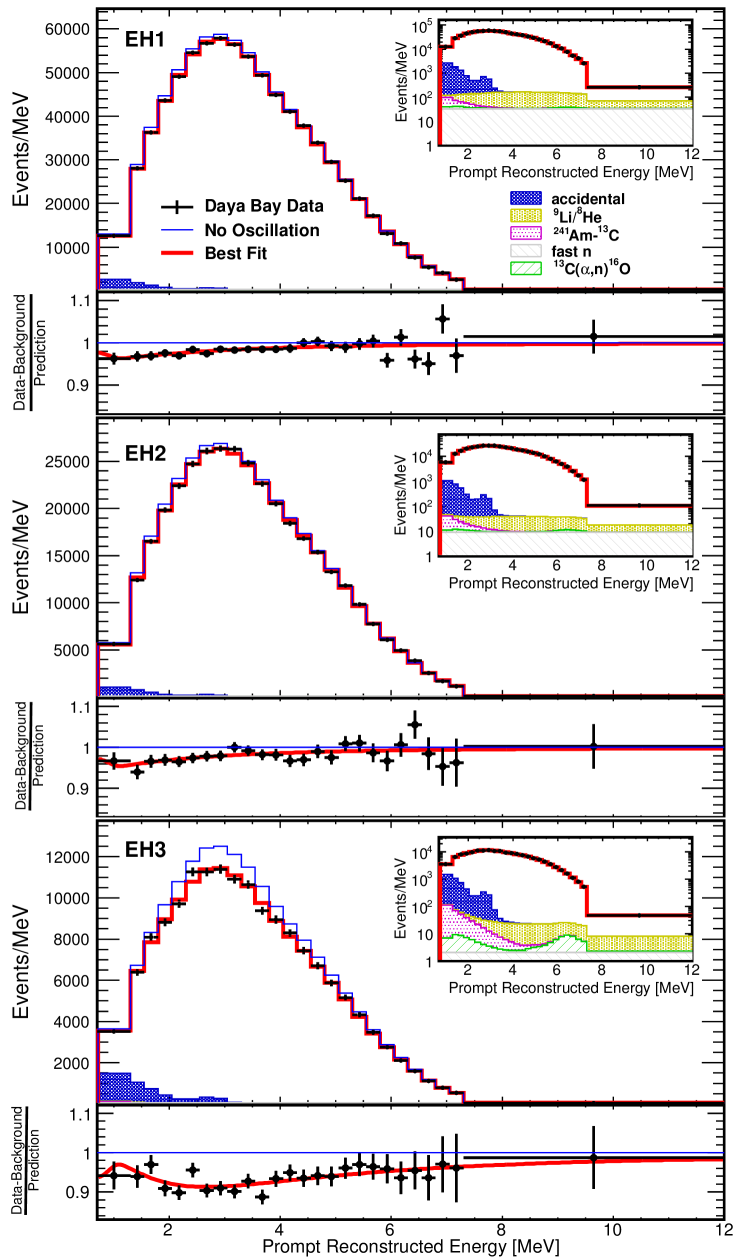
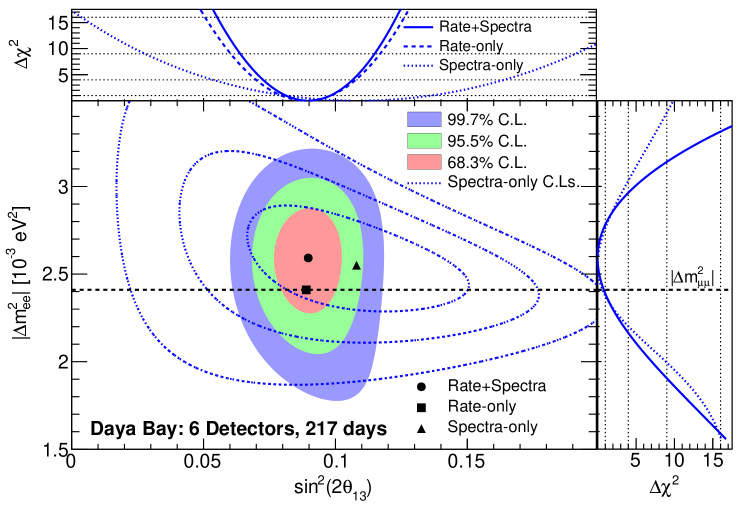
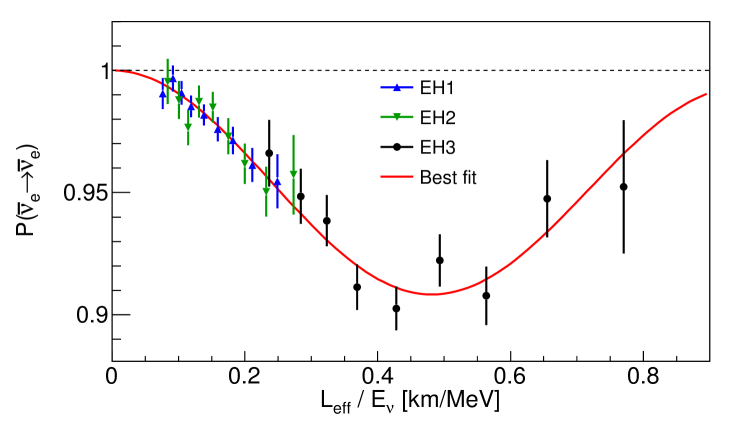
The oscillation parameters are extracted from a fit that takes into account the antineutrino rate, spectral information and the survival probability (Eqn. Spectral measurement of electron antineutrino oscillation amplitude and frequency at Daya Bay). In order to properly account for the systematic effects and correlations among energy bins, a is constructed using nuisance parameters for detector response and background and a covariance matrix for reactor-related uncertainties. The absolute normalization of the flux is a free parameter in the fit. The fit uses and Beringer et al. (2012). The best-fit values are and with (68.3% confidence level (C.L.) intervals) 222See Supplemental Material at [URL will be inserted by publisher] for a table of as a function of , .. The prompt energy spectra observed in each of the experimental halls are compared to the spectra expected for no oscillation and with the best-fit oscillation parameters in Fig. 2. The , , and C.L. allowed regions in the vs. sin plane are shown in Fig. 3. Under the assumption of the normal (inverted) neutrino mass hierarchy Beringer et al. (2012), this result is equivalent to (). The result is consistent with as measured via and disappearance Adamson et al. (2013b) noting the small effects due to other neutrino oscillation parameters. Figure 4 compares the IBD data from all experimental halls with the survival probability (Eqn. Spectral measurement of electron antineutrino oscillation amplitude and frequency at Daya Bay) using the best-fit values. Almost one full oscillation cycle is visible, demonstrating both the amplitude and frequency of short-baseline reactor oscillation.
The total uncertainty on both oscillation parameters is dominated by statistics. The most significant contributions to the systematic uncertainty are the reactor, relative-detector-efficiency and energy-scale components 333Define the contribution of the component to the total uncertainty () as . The contributions to the () uncertainty are then 0.73 (0.65), 0.18 (0.02), 0.13 (0.21), 0.11 (0.01), and 0.04 (0.06) for the statistical, reactor, relative-energy and efficiency, absolute-energy, and background components, respectively. Note that due to correlations.. The systematic uncertainty is dominated by the relative energy scale and efficiency. Consistent results are obtained with an independent approach that uses minimal reactor model assumptions and directly predicts the far spectra from the near spectra. Similarly, analysis with a purely nuisance-parameter-based or purely covariance-matrix-based yields consistent results. The rate-only result is with with constrained by the measurement of Adamson et al. (2013b). The spectra-only result, obtained by fixing the predicted event rate in each AD to the measured rate, is and with , and rules out at standard deviations.
In summary, the relative deficit and spectral distortion observed between three far and three near antineutrino detectors at Daya Bay provides the first independent measurement of and the most precise estimate of to date. Following a special calibration campaign in summer 2012, data collection using all eight antineutrino detectors began in October 2012, and an eventual reduction to a few percent uncertainty in both oscillation parameters is anticipated. On-going analysis of the special calibration data is expected to yield improvements in the energy response model and the knowledge of the absolute detection efficiency. These improvements will enable a future high-statistics measurement of the absolute reactor flux and energy spectra that will provide a valuable reference for studies of reactor neutrinos.
The Daya Bay Experiment is supported in part by the Ministry of Science and Technology of China, the United States Department of Energy, the Chinese Academy of Sciences, the National Natural Science Foundation of China, the Guangdong provincial government, the Shenzhen municipal government, the China Guangdong Nuclear Power Group, Shanghai Laboratory for Particle Physics and Cosmology, the Research Grants Council of the Hong Kong Special Administrative Region of China, University Development Fund of The University of Hong Kong, the MOE program for Research of Excellence at National Taiwan University, National Chiao-Tung University, and NSC fund support from Taiwan, the U.S. National Science Foundation, the Alfred P. Sloan Foundation, the Ministry of Education, Youth and Sports of the Czech Republic, Charles University in Prague, Yale University, the Joint Institute of Nuclear Research in Dubna, Russia, and the NSFC-RFBR joint research program. We acknowledge Yellow River Engineering Consulting Co., Ltd. and China Railway 15th Bureau Group Co., Ltd. for building the underground laboratory. We are grateful for the ongoing cooperation from the China Guangdong Nuclear Power Group and China Light & Power Company.
References
- Beringer et al. (2012) J. Beringer et al. (Particle Data Group), Phys. Rev. D 86, 010001 (2012), Section 13.
- An et al. (2012a) F. P. An et al. (Daya Bay Collaboration), Phys. Rev. Lett. 108, 171803 (2012a).
- An et al. (2013) F. P. An et al. (Daya Bay Collaboration), Chin. Phys. C 37, 011001 (2013).
- Ahn et al. (2012) J. Ahn et al. (RENO Collaboration), Phys. Rev. Lett. 108, 191802 (2012).
- Abe (2012) Y. Abe (Double Chooz Collaboration), Phys. Rev. Lett. 108, 131801 (2012).
- Adamson et al. (2013a) P. Adamson et al. (MINOS Collaboration), Phys. Rev. Lett. 110, 171801 (2013a).
- Abe et al. (2013) K. Abe et al. (T2K Collaboration), Phys. Rev. D 88, 032002 (2013).
- (8) M. Bishai et al., arXiv:1203.4090 (2012) .
- Y. F. Li, J. Cao, Y. F. Wang, and L. Zhan (2013) Y. F. Li, J. Cao, Y. F. Wang, and L. Zhan, Phys. Rev. D 88, 013008 (2013).
- (10) A. Balantekin et al., arXiv:1307.7419 (2013) .
- Note (1) Our definition is consistent with H. Minakata, H. Nunokawa, S. J. Parke and R. Zukanovich Funchal, Phys. Rev. D 74, 053008 (2006).
- Adamson et al. (2011) P. Adamson et al. (MINOS Collaboration), Phys. Rev. Lett. 106, 181801 (2011).
- An et al. (2012b) F. P. An et al. (Daya Bay Collaboration), Nucl. Inst. Meth. A 685, 78 (2012b).
- (14) F. P. An et al. (Daya Bay Collaboration), arXiv:hep-ex/0701029 (2007) .
- Agostinelli et al. (2003) S. Agostinelli et al., Nucl. Inst. Meth. A 506, 250 (2003).
- Allison et al. (2006) J. Allison et al., IEEE Trans. Nucl. Sci. 53, 270 (2006).
- Birks (1951) J. B. Birks, Phys. Rev. 84, 364 (1951).
- L. J. Wen, J. Cao, K. B. Luk, Y. Q. Ma, Y. F. Wang, and C. G. Yang (2006) L. J. Wen, J. Cao, K. B. Luk, Y. Q. Ma, Y. F. Wang, and C. G. Yang, Nucl. Inst. Meth. A 564, 471 (2006).
- Nyman et al. (1990) G. Nyman et al., Nucl. Phys. A 510, 189 (1990).
- Bjornstad et al. (1981) T. Bjornstad et al. (ISOLDE Collaboration), Nucl.Phys. A366, 461 (1981).
- K. Schreckenbach, G. Colvin, W. Gelletly, and F. von Feilitzsch (1985) K. Schreckenbach, G. Colvin, W. Gelletly, and F. von Feilitzsch, Phys. Lett. B 160, 325 (1985).
- Hahn et al. (1989) A. Hahn et al., Phys. Lett. B 218, 365 (1989).
- von Feilitzsch et al. (1982) F. von Feilitzsch, A. Hahn, and K. Schreckenbach, Phys. Lett. B 118, 162 (1982).
- Vogel et al. (1981) P. Vogel, G. K. Schenter, F. M. Mann, and R. E. Schenter, Phys. Rev. C 24, 1543 (1981).
- Huber (2011) P. Huber, Phys. Rev. C 84, 024617 (2011).
- Mueller et al. (2011) T. Mueller et al., Phys. Rev. C 83, 054615 (2011).
- Note (2) See Supplemental Material at [URL will be inserted by publisher] for a table of as a function of , .
- Adamson et al. (2013b) P. Adamson et al. (MINOS Collaboration), Phys. Rev. Lett. 110, 251801 (2013b).
- Note (3) Define the contribution of the component to the total uncertainty () as . The contributions to the () uncertainty are then 0.73 (0.65), 0.18 (0.02), 0.13 (0.21), 0.11 (0.01), and 0.04 (0.06) for the statistical, reactor, relative-energy and efficiency, absolute-energy, and background components, respectively. Note that due to correlations.