Spectroscopy of photoionization from the singlet state in nitrogen–vacancy centers in diamond
Abstract
The — singlet manifold of the negatively charged nitrogen vacancy (N) center in diamond plays a central role in its quantum information and quantum sensing applications. However, the energy gap between the singlet state and diamond band edges or the — triplet manifold has not been measured directly. Using field-quenching effects on photoluminescence (PL) spectra, we measure these energy gaps as a function of temperature, applied magnetic field, excitation wavelength, and excitation power in a heavily nitrogen-doped sample. Increased PL and decreased zero-phonon line width from the N were observed in the presence of an applied magnetic field, indicating ionization from the long-lived singlet state. A temperature-dependent ionization threshold between 532 nm and 550 nm was found, locating the singlet states within the diamond band gap.
I Introduction
The nitrogen vacancy (N) center in diamond has emerged as an important platform for quantum technology.[1, 2, 3, 4, 5, 6, 7, 8, 9, 10, 11, 12] The negative charged state (N) garners the most interest due to its triplet ground state. These ground state sublevels have long spin coherence times and can be polarized and read out optically at room temperature.[13, 14].
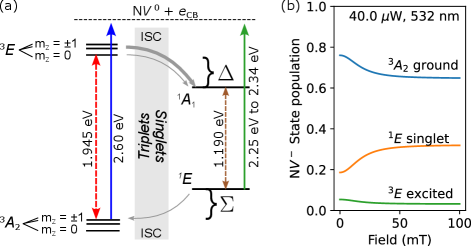
Initialization and readout of the N spin state involves transitions between four electronic states within the diamond band gap: the S = 1 spin triplet ground () and excited () electronic states, and the S = 0 spin singlet metastable () and excited () electronic states (Fig. 1(a)), which we refer to as triplet and singlet states respectively. For illumination wavelengths between 470 nm and 637 nm, N centers will absorb photons and transition from ground to the excited states while preserving . Relaxation back to the ground state can occur directly by emitting a photon, or indirectly via the inter-system crossings (ISCs) and a transition between singlet states, typically without emitting a photon (Fig. 1(a)). Importantly, the ISC path is more probable for than for .[6] The spin-dependence of the upper ISC makes it possible to prepare the spin state with good fidelity and to read it out via photoluminescence (PL). The lower ISC is a slow process that gives the metastable state a lifetime that is an order of magnitude longer than any other excited state.[6]
The — and — transition energies in the N are determined by the photon energies of the zero phonon lines (ZPL) present in the absorption and PL spectra near 1.95 eV and 1.190 eV respectively.[15, 6, 16, 17, 18] The single-photon ionization and recombination thresholds place the N ground state 2.60 eV below the conduction band and 2.94 eV above the valence band.[19]
Using ionization thresholds to place the and singlet states within the bandgap has proven more difficult. Previous studies have focused on measuring the — and — energy gaps, labeled and respectively in Fig. 1 (a). Estimates of at cryogenic temperatures and temperatures above 300 K have been calculated by relating ISC rates to these energy gaps, and values of have been inferred using these calculations for and the ZPL energy of the — transition without investigating directly. At cryogenic temperatures, is estimated to lie between 0.321 eV and 0.414 eV,[20, 21, 22] and earlier work done at high temperature is at variance with these results, yielding an estimate of eV.[23] These differing results suggest a temperature dependent phenomena inherent to the — singlet manifold. This is the subject of investigation in this work.
Often these values of are used in conjunction with the ZPL energy of the — transition and the ionization energy of the to locate the with respect to the diamond conduction band edge, however a recent publication indicates that this common technique is inappropriate for accurately determining the ionization energy as it erroneously treats the inherently multi-particle energy levels of the Nas single-particle energy levels.[7] In light of this new information, the ionization energy must be directly measured, not inferred from existing data. To accomplish this, the state can be selectively populated using a magnetic field to mix the and triplet sublevels while under laser excitation, and then photoionized with wavelength tuned laser excitation, which would allow the ionization energy of the to be measured. This technique can be applied in a temperature controlled cryostat in order to determine the ionization energy as a function of temperature.
Ionization of N results in an increase of N concentration and a corresponding increase in N PL. The N system can be polarized into the by exploiting a magnetic field[24] or microwave resonance to increase the population of the states, which can then relax to of . The can then be selectively ionized by applying laser excitation to the system and reading out the change in N PL.[25, 24, 26, 27]
In the present work, we use field modulation to investigate ionization dynamics as a function of temperature, wavelength, and optical power. The diamond has a high concentration of N centers suitable for ensemble measurements of interest to this work. As shown in Fig. 1(b), population transfers from the triplet ground to the singlet state when laser excitation is applied in the presence of a magnetic field. We exploit the fact that the PL spectra of N and N behave differently under the influence of a magnetic field to track their relative defect populations and identify ionization thresholds. We find that in the absence of a magnetic field, the fraction of N centers in the N charge state is approximately constant for photon energies lower than a threshold between 2.54 eV and 2.60 eV, which we identify as the ionization energy of the ground state.[19] At energies below that threshold, the concentration of N increases by a few percent when a spin-mixing magnetic field is applied, due to increased ionization from the newly populated state. A threshold for the N contrast between 532 nm and 550 nm brackets the singlet state ionization energy between 2.25 eV and 2.33 eV for temperatures between 1.6 K and 300 K.
II Methods
Materials and Methods: Experimental
The sample is a commercial CVD-grown diamond (3 mm 3 mm 0.5 mm) with a typical substitutional nitrogen (Ns) fraction (13 ppm) and N fraction (4.5 ppm). Our quantitative electron spin resonance (ESR) measurements[28] determined the ratio of ESR—active N:N centers was approximately 3.1:1. ESR results also revealed the presence of NH- centers in concentrations similar to N (N:NH- = 1.1:1), in agreement with extensive characterization of a similar sample.[29] Relatively small responses from additional defect centers were too heavily obscured by the central N and NH- resonances for a complete analysis. Absence of N responses agrees with previous measurements[30] and may be explained by strain broadening.[31] Fitting to ESR simulations of the defects, when necessary, was done with EasySpin software[32] using spin-system parameters taken from several sources.[33, 34, 35] The quantitative ESR measurements contain at most a 15 % error.
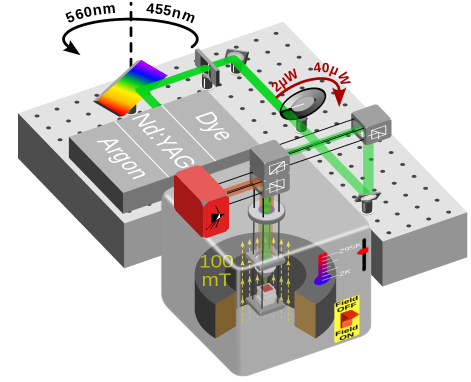
The apparatus for photoluminescence measurement is illustrated in Fig. 2. The sample is mounted inside a closed-loop, cryogen-free cryostat with an optical window and superconducting magnet. The cryostat is capable of set point temperatures between 1.6 K and 295 K, and perpendicularly applied magnetic field magnitudes from 0 T to 9 T. The sample is oriented with the applied field parallel to the [100] crystal axis of the diamond, away from the N- axes along the [111] direction. Three different continuous wave (CW) lasers are used as a source of excitation for the PL: an argon ion laser which generates wavelengths at 458 nm, 476 nm, 488 nm, 497 nm, 502 nm, and 515 nm; a solid state Nd:YAG laser at 532 nm; and a dye laser at 550 nm and 560 nm. Each laser is directed into the cryostat and onto the sample using free space optics. The beam is at normal incidence to the [100] sample surface and focused through a 50 cryogenic objective. The emitted light is collected and sent to two single grating spectrometers, one with a large bandwidth and one with a higher spectral resolution. The laser spot size on the sample is approximately 1 m. A continuous variable neutral density filter was used to adjust the power entering the optical window of the cryostat. The optical power was measured by a power meter after the neutral density filter but prior to insertion into the cryostat chamber.
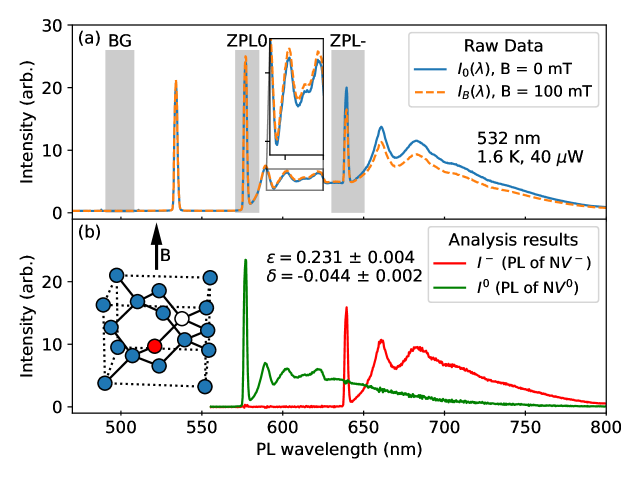
Photoluminescence spectra were collected under CW illumination with () and without () a 100 mT magnetic field. These spectrum pairs were collected for all combinations of nine temperatures from 1.6 K to 295 K, nine laser wavelengths from 458 nm to 560 nm, and five optical powers at 2.5 W, 5 W, 10 W, 20 W, and 40 W for a total of 405 spectrum pairs. An example spectrum pair is plotted in Fig. 3(a). Fig. 3(a) shows PL spectra from an ensemble of N centers with the separated contributions of N and N in Fig. 3(b). Each spectrum consists of a narrow, zero-phonon line (ZPL) and several broad features in the phonon sideband (Fig. 3(b)).
Materials and Methods: Data Analysis
Spectra collected from samples with large numbers of N centers have high enough signal-to-noise (SNR) to manipulate and and extract the N and N contributions with least-squares fitting[24, 36]. Our implementation of these methods was not reliable enough for automated analysis.
To tackle the analysis of these spectrum pairs efficiently, we required a reliable technique that can be automated with a minimum of human intervention. We addressed this requirement by developing a Bayesian analysis that separates the contributions of the N and N through their differing responses to changes field.[24, 36] The field-off spectra are modeled with zero-field photoluminescence amplitude contributions and from N and N respectively.
| (1) |
where we have added a constant background, and a measurement noise, For the field-on spectra, we introduce quenching parameters and to describe the fractional decrease in PL amplitude from the N and N respectively due to the spin-mixing effects of the applied field.
| (2) |
including background and an uncorrelated noise . Negative values of or indicate PL amplitude that increases with applied field.
Briefly, the Bayesian analysis only uses data from parts of the spectra where additional assumptions can be incorporated, indicated by shaded regions in Fig. 3(a). We assume that region BG contains background only, that region ZPL0 contains only , with . In region ZPL-, we assume that is a linear function of to distinguish it from the sharply peaked structure of . The analysis also incorporates measurement noise in the likelihood calculations. With these assumptions and inputs, the analysis yields probability distributions for and , allowing Eqns. (1-2) to be inverted, yielding separate contributions and . Fig. 3(b) shows the separated example spectra with the inferred values of and . The procedure was repeated for 405 field on/off pairs of PL spectra, using plots of the separate contributions as visual checks of the analysis quality. Details of the procedure are provided in the supplemental material.
We also looked for changes in the full-width half-maximum (FWHM) of the N ZPL using our high-resolution spectrometer, but we were limited to analyzing data for excitation wavelengths less than 515 nm due to scattered laser light breaking through the high-resolution spectrometer’s edge-pass filter. In a first attempt, least-square fits of the N ZPL to Lorentzian line shapes yielded line widths of approximately 0.25 nm up to 100 K, then increasing to 1.5 nm at 300 K. Systematic misfit between the Lorentzian model and the peak data led to inflated uncertainty estimates. To avoid this problem, the field-induced line width contrast was estimated using a model-free approach that amounts to finding the transformation that best mapped the mT data onto a cubic spline interpolation of the mT data. The transformation included ”horizontal” expansion of the axis around the approximate peak center by a factor of , translation of the axis to correct the center value, and “vertical” scaling of the axis, where is the fraction of measured broadening in the N ZPL FWHM. For each data point, the difference between the scaled mT data and the interpolation of the mT data is essentially an error that determines the likelihood of the scaling parameters given the data values.
Materials and Methods: Modeling
The populations of the N states are calculated using a five-state model for N and a two-state model for N.[37, 38, 39, 15, 27] The five-state model of N includes transitions between the and combined spin states of electronic state, the the and combined spin states of the level and the long lived singlet state. The state is ignored because of its very short lifetime. The N is modeled using its ground and excited states. We assume that ionization and recombination rates are slow compared to the internal dynamics of each center, so that the steady state populations of the centers’ states are independent of the centers’ concentrations. See supplemental material for details.
III Results & Discussion
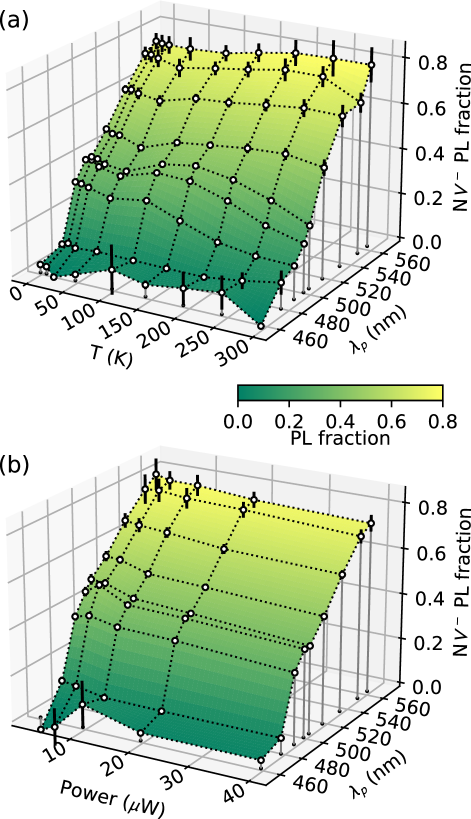
The relative PL amplitude of the N and N yields information about the charge state of N centers. The fraction of the integrated PL amplitude contributed by N in zero applied field is plotted in Fig. 4. Figs. 4(a) and (b) both show a dropoff in NPL amplitude between 476 nm and 488 nm (2.605 eV and 2.55 eV respectively). This threshold is consistent with ionization of N from its ground state to N with an optically measured threshold near 2.6 eV (477 nm)[19], and a photoconductivity threshold between 2.6 eV and 2.7 eV[40]. Calculated thresholds include 2.67 eV,[41], 2.7 eV.[40], and 2.76 eV[42]. The threshold for ionization of the appears to shift to lower photon energies and/or broaden at the higher temperatures. A slight decreasing trend with power at all excitation wavelengths in Fig. 44(b) shows that the N PL fraction is only weakly power dependent. We therefore consider only the error-weighted average over all powers when determining ionization thresholds from PL amplitudes as a function of temperature and wavelength.
We next compare the measured PL fraction with several models of charge dynamics, all of which assume that the integrated PL amplitude for N and N are proportional to the species concentrations , and the excited state populations , and respectively.
| (3) | |||||
| (4) |
A simple rate-balance photodynamic model of the steady state assumes that the rates of ionization and recombination must be equal,
| (5) |
where and are the ionization rate of N and recombination rate of N, respectively. For excitation wavelengths greater than 490 nm and powers on the order of 10 W, the transition rates are quadratic in laser power and on the order of 103 s-1.[19]. The transition rates are modeled as
| (6) | |||||
| (7) |
for photon flux and cross sections, . Superscripts indicate the charge state of the N center and subscripts , and refer to excited, singlet and ground states. Because the populations of states other than the ground state are linear in power, the net ionization and recombination rates are quadratic. Ionization from the ground state is linear in power for excitation wavelengths shorter than 485 nm.
We also consider a fixed-concentration model, where the concentrations are only slightly perturbed by quadratic ionization and recombination processes, which agrees empirically with our observations.
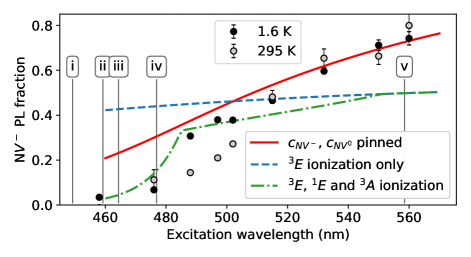
Fig. 5 shows the behavior of the N PL fraction using rate-balance and fixed-concentration models as a function of excitation wavelength. Measured results are provided for 1.6 K (black) and 295 K (grey fill) data.
The blue dashed line in Fig. 5 is the balanced rate model with ionization allowed only from the excited state. Under this assumption the N PL fraction is nearly constant. The green dot-dash curve also includes ionization from the singlet state for wavelengths below 550 nm, and from the ground state below 485 nm. The solid red curve corresponds to the fixed-concentration model with and , and the resulting N PL fraction increases smoothly across the pump wavelength range. In view of the poorly determined parameter values, firm conclusions should not be drawn from these models. However, the results are in good agreement with previous measurements of two-step ionization/recombination rates on individual centers.[19]
Qualitative agreement between the fixed-concentration model results and measurement data suggests the N and N concentrations are approximately unchanged for excitation wavelengths longer than 490 nm in the absence of an external magnetic field. Figs. 4, 5 both suggest an ionization threshold from the ground state between 2.54 eV and 2.60 eV (488 nm and 476 nm resp.).
The effects of the applied magnetic field provide additional information about changes in charge state. The off axis field is known to decrease the population of the excited states, quenching the PL from N. The field also increases the population in the singlet state.[6, 38, 36] By changing the populations, the applied field also affects net ionization rates of these states. The decrease in population and increase in population induced by the field could increase or decrease the total ionization rate, depending on their respective cross sections.
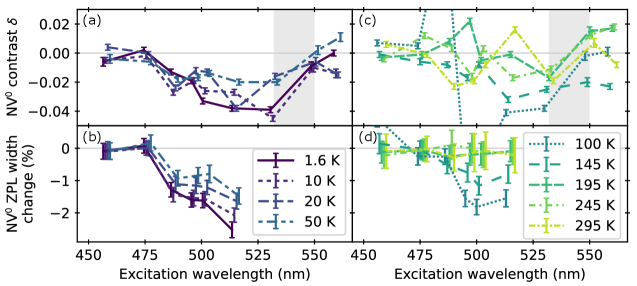
Fig. 6 shows the contrast parameter which describes a reduction in N PL with applied field as defined in (Eqns. 1, 2). The contrast shows a broad plateau between 100 K and 300 K bounded at shorter wavelengths by the ground state ionization threshold near 480 nm, and by a valley of suppressed contrast between 100 K and 1.6 K. Focusing first on the plateau, is expected to be independent of excitation wavelength in the low-power, linear-response regime as long as concentrations are not wavelength-dependent. The decrease below 480 nm coincides with depressed N PL due to photoionization of the triplet state (shown in Fig. 4).
The suppressed contrast shown in Fig. 7 around 50 K and across all wavelengths also appears in earlier results by Rogers et al.[43] and others by Ernst et al. and Happacher et al. contemporaneous with this work.[44, 45, 46] We propose an explanation for this effect related to thermal averaging of the excited state orbitals. At room temperature, the excited state behaves like a single spin triplet. However, at low temperature the excited state of N is an orbital doublet which is split by transverse strain into and electronic states separated by tens of GHz.[47, 48] At temperatures above 100 K, these spin triplets are thermally averaged, and the excited state appears as one triplet state.[43, 49, 46]. To explain the suppressed contrast, we propose that the thermal averaging process produces an effective field noise that causes fast relaxation of the spin states at intermediate temperatures. The spin relaxation rate will have a maximum when the characteristic switching time is at the GHz frequencies corresponding to transitions between the spin triplet sublevels. This spin-disordering mechanism will reduce polarization into the state in zero field, so further mixing due to an applied field will produce a suppressed PL quenching effect. Further mixing and PL quenching due to an applied field will have a suppressed effect. In support of this mechanism, we note that shallow minima in the zero-field N PL fraction are visible in the same 50 K region as the suppressed contrast . See Fig. 4(a). A thorough study of the contrast temperature dependence has recently been made public.[44].
The N has no known spin-dependent relaxation mechanisms, so its optical properties are considered immune to modest magnetic field. The contrast parameter is therefore an indicator of changes in N concentration. The field-immunity of N also implies field-independent recombination mechanisms, so we attribute to changes in N concentration induced by a field-dependent change in ionization rate of the N. The plots of in Figs. 7(a) and (c) show a region of negative contrast between approximately 480 nm and 540 nm, strongest below 100 K. Negative contrast here corresponds to an increase in N PL induced by the applied magnetic field.
As shown in Fig. 1(b), the population of the excited state decreases with applied field and the population of the singlet state sees a corresponding increase, strongly implying that the negative values of are due to ionization from the singlet state. This result adds to a growing body of experimental evidence [26, 27, 24] indicating a wavelength dependent increase in N population is a direct result of resonant CW and pulsed microwave excitation[24, 26, 27] or DC field quenching (this work) inducing an increase in spin state population.
Regions of negative in Figs. 7(a) and (c) constitute the main results of this paper. The low wavelength boundary of the negative= region near 480 nm coincides with the abrupt dropoff in N PL, which we interpret as the threshold for ionization from the ground state. We interpret the high wavelength boundary of the negative- region near 540 nm to be a threshold for ionization from the long-lived singlet state. The threshold appears between excitation wavelengths of 532 nm and 550 nm, bracketing the singlet ionization threshold between 2.25 eV and 2.33 eV. At 200 K and above, the negative contrast weakens significantly or changes sign, indicating a change in ionization rate as a function of temperature that is likely a result of multiple competing processes, including decreased lifetime of the singlet state,[18, 37, 16], thermal occupation of vibronic states of the and ,[50] temperature dependent shifts in valence and conduction band energies,[7] and small shifts in the singlet state energies within the band gap.[7]
The increase in N concentration indicated by negative values of suggests reactions that reduce the number of charged centers in the diamond. Ionization, , neutralizes an N center, and if the freed electron then goes on to neutralize a N ion, the total number of charged centers in the sample is reduced by 2. The accompanying reduction in random electric fields would be observable as a narrowing of ZPL peaks as Stark shift broadening is reduced.[51]
Figs. 7(b) and (d) show the fractional change in the width of the N ZPL with applied field; negative values correspond to narrowing. The results shown in Figs. 7(b) and (d)) include a wavelength region above 488 nm for temperatures below 150 K where the width of the N ZPL line decreases by 2 % with applied field, in agreement with the contrast for that region. This line width change and the contrast both point to significant ionization from the singlet state.
We do not attempt to explain the anomalous behavior at 100 K in Figs. 7(c) and (d), which includes one sharp peak at certain wavelengths below 490 nm and adjacent pit above 490 nm. These anomalies appear consistently over different laser powers and the different wavelengths were measured on different days.
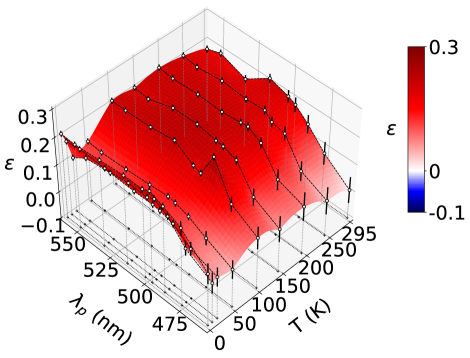
Surface plots of the results presented in Fig. 7 are included in the supplemental material for a synoptic overview of these results.
IV Conclusion
The N center in diamond has become a canonical quantum system, featured in work on fundamental quantum effects, quantum sensing and physics education. An energy level diagram similar to Fig. 1(a) appears in countless publications. So, it may be surprising that there are parts of the N energy level diagrams that are not well-known. In particular, the energies of the singlet states relative to the triplet states have proven difficult to measure. In this work, we probed the ionization dynamics of N centers using applied magnetic field modulation. We have identified ionization thresholds for both the ground state and the long-lived singlet state, and discovered a temperature and wavelength dependence of the ionization rate from the singlet, which has not been measured previously. Knowledge of ionization pathways will be important as new research in electrical readout and spin-charge conversion strives to circumvent the poor optical readout characteristics of N centers.
For temperatures between 2 K and 200 K, the ionization threshold of was found between 2.33 eV and 2.25 eV (excitation wavelengths 532 nm and 550 nm resp.), which is in reasonable agreement with 2.22 eV predicted by ab initio calculations.[42] For temperatures above 200 K the ionization rate appears to change as a function of temperature. Ionization from the singlet state is identified by increases in N PL with applied field, supported by narrowing of the ZPL linewidth due to the Stark effect. Combined with our observation of a ground state ionization threshold between 2.54 eV and 2.60 eV, we bracket the energy difference 0.21 eV 0.35 eV, which is in reasonable agreement with prior results inferring this value from values of . [20, 21, 22, 16].
Acknowledgements.
We wish to acknowledge Ilya Fedotov and Masfer Alkahtani for many helpful discussions and invaluable advice, Veronika Szalai for initial EPR measurements, and Adam Gali for insightful comments on the manuscript.References
- Aharonovich and Neu [2014] I. Aharonovich and E. Neu, Diamond Nanophotonics, Advanced Optical Materials 2, 911 (2014).
- Awschalom et al. [2018] D. D. Awschalom, R. Hanson, J. Wrachtrup, and B. B. Zhou, Quantum technologies with optically interfaced solid-state spins, Nature Photon 12, 516 (2018).
- Barry et al. [2020] J. F. Barry, J. M. Schloss, E. Bauch, M. J. Turner, C. A. Hart, L. M. Pham, and R. L. Walsworth, Sensitivity optimization for NV-diamond magnetometry, Rev. Mod. Phys. 92, 015004 (2020).
- Bernardi et al. [2017] E. Bernardi, R. Nelz, S. Sonusen, and E. Neu, Nanoscale Sensing Using Point Defects in Single-Crystal Diamond: Recent Progress on Nitrogen Vacancy Center-Based Sensors, Crystals 7, 124 (2017).
- Bourgeois et al. [2020] E. Bourgeois, M. Gulka, and M. Nesladek, Photoelectric Detection and Quantum Readout of Nitrogen‐Vacancy Center Spin States in Diamond, Adv. Optical Mater. 8, 1902132 (2020).
- Doherty et al. [2013] M. W. Doherty, N. B. Manson, P. Delaney, F. Jelezko, J. Wrachtrup, and L. C. Hollenberg, The nitrogen-vacancy colour centre in diamond, Physics Reports 528, 1 (2013).
- Gali [2023] Á. Gali, Recent advances in the ab initio theory of solid-state defect qubits, accepted for Nanophotonics 10.1515/nanoph-2022-0723 (2023).
- Jelezko and Wrachtrup [2006] F. Jelezko and J. Wrachtrup, Single defect centres in diamond: A review, physica status solidi (a) 203, 3207 (2006).
- Rondin et al. [2014] L. Rondin, J.-P. Tetienne, T. Hingant, J.-F. Roch, P. Maletinsky, and V. Jacques, Magnetometry with nitrogen-vacancy defects in diamond, Reports on Progress in Physics 77, 056503 (2014).
- Schirhagl et al. [2014] R. Schirhagl, K. Chang, M. Loretz, and C. L. Degen, Nitrogen-Vacancy Centers in Diamond: Nanoscale Sensors for Physics and Biology, Annual Review of Physical Chemistry 65, 83 (2014).
- Schröder et al. [2016] T. Schröder, S. L. Mouradian, J. Zheng, M. E. Trusheim, M. Walsh, E. H. Chen, L. Li, I. Bayn, and D. Englund, Quantum nanophotonics in diamond [Invited], J. Opt. Soc. Am. B 33, B65 (2016).
- Wrachtrup and Finkler [2016] J. Wrachtrup and A. Finkler, Single Spin Magnetic Resonance, Journal of Magnetic Resonance 269, 225 (2016), arXiv:1606.08830 [cond-mat].
- Balasubramanian et al. [2009] G. Balasubramanian, P. Neumann, D. Twitchen, M. Markham, R. Kolesov, N. Mizuochi, J. Isoya, J. Achard, J. Beck, J. Tissler, V. Jacques, P. R. Hemmer, F. Jelezko, and J. Wrachtrup, Ultralong spin coherence time in isotopically engineered diamond, Nature Mater 8, 383 (2009).
- Yamamoto et al. [2013] T. Yamamoto, T. Umeda, K. Watanabe, S. Onoda, M. L. Markham, D. J. Twitchen, B. Naydenov, L. P. McGuinness, T. Teraji, S. Koizumi, F. Dolde, H. Fedder, J. Honert, J. Wrachtrup, T. Ohshima, F. Jelezko, and J. Isoya, Extending spin coherence times of diamond qubits by high-temperature annealing, Phys. Rev. B 88, 075206 (2013).
- Beha et al. [2012] K. Beha, A. Batalov, N. B. Manson, R. Bratschitsch, and A. Leitenstorfer, Optimum Photoluminescence Excitation and Recharging Cycle of Single Nitrogen-Vacancy Centers in Ultrapure Diamond, Phys. Rev. Lett. 109, 097404 (2012).
- Thiering and Gali [2018] G. Thiering and A. Gali, Theory of the optical spin-polarization loop of the nitrogen-vacancy center in diamond, Phys. Rev. B 98, 085207 (2018).
- Rogers et al. [2008] L. J. Rogers, S. Armstrong, M. J. Sellars, and N. B. Manson, Infrared emission of the NV centre in diamond: Zeeman and uniaxial stress studies, New J. Phys. 10, 103024 (2008).
- Acosta et al. [2010] V. M. Acosta, A. Jarmola, E. Bauch, and D. Budker, Optical properties of the nitrogen-vacancy singlet levels in diamond, Phys. Rev. B 82, 201202 (2010).
- Aslam et al. [2013] N. Aslam, G. Waldherr, P. Neumann, F. Jelezko, and J. Wrachtrup, Photo-induced ionization dynamics of the nitrogen vacancy defect in diamond investigated by single-shot charge state detection, New J. Phys. 15, 013064 (2013).
- Goldman et al. [2015a] M. Goldman, A. Sipahigil, M. Doherty, N. Yao, S. Bennett, M. Markham, D. Twitchen, N. Manson, A. Kubanek, and M. Lukin, Phonon-Induced Population Dynamics and Intersystem Crossing in Nitrogen-Vacancy Centers, Phys. Rev. Lett. 114, 145502 (2015a).
- Goldman et al. [2015b] M. L. Goldman, M. W. Doherty, A. Sipahigil, N. Y. Yao, S. D. Bennett, N. B. Manson, A. Kubanek, and M. D. Lukin, State-selective intersystem crossing in nitrogen-vacancy centers, Phys. Rev. B 91, 165201 (2015b).
- Goldman et al. [2017] M. L. Goldman, M. W. Doherty, A. Sipahigil, N. Y. Yao, S. D. Bennett, N. B. Manson, A. Kubanek, and M. D. Lukin, Erratum: State-selective intersystem crossing in nitrogen-vacancy centers [Phys. Rev. B 91 , 165201 (2015)], Phys. Rev. B 96, 039905 (2017).
- Toyli et al. [2012] D. M. Toyli, D. J. Christle, A. Alkauskas, B. B. Buckley, C. G. Van de Walle, and D. D. Awschalom, Measurement and Control of Single Nitrogen-Vacancy Center Spins above 600 K, Phys. Rev. X 2, 031001 (2012).
- Aude Craik et al. [2020] D. Aude Craik, P. Kehayias, A. Greenspon, X. Zhang, M. Turner, J. Schloss, E. Bauch, C. Hart, E. Hu, and R. Walsworth, Microwave-Assisted Spectroscopy Technique for Studying Charge State in Nitrogen-Vacancy Ensembles in Diamond, Phys. Rev. Applied 14, 014009 (2020).
- Wolf et al. [2022] S. A. Wolf, I. Meirzada, G. Haim, and N. Bar-Gill, Nitrogen-vacancy singlet manifold ionization energy (2022), arXiv:2210.04171 [quant-ph].
- Hopper et al. [2016] D. A. Hopper, R. R. Grote, A. L. Exarhos, and L. C. Bassett, Near-infrared-assisted charge control and spin readout of the nitrogen-vacancy center in diamond, Phys. Rev. B 94, 241201 (2016).
- Hacquebard and Childress [2018] L. Hacquebard and L. Childress, Charge-state dynamics during excitation and depletion of the nitrogen-vacancy center in diamond, Phys. Rev. A 97, 063408 (2018).
- Eaton et al. [2010] G. R. Eaton, S. S. Eaton, D. P. Barr, and R. T. Weber, Quantitative EPR (Springer Vienna, Vienna, 2010).
- Edmonds et al. [2021] A. M. Edmonds, C. A. Hart, M. J. Turner, P.-O. Colard, J. M. Schloss, K. S. Olsson, R. Trubko, M. L. Markham, A. Rathmill, B. Horne-Smith, W. Lew, A. Manickam, S. Bruce, P. G. Kaup, J. C. Russo, M. J. DiMario, J. T. South, J. T. Hansen, D. J. Twitchen, and R. L. Walsworth, Characterisation of CVD diamond with high concentrations of nitrogen for magnetic-field sensing applications, Mater. Quantum. Technol. 1, 025001 (2021).
- Felton et al. [2008] S. Felton, A. M. Edmonds, M. E. Newton, P. M. Martineau, D. Fisher, and D. J. Twitchen, Electron paramagnetic resonance studies of the neutral nitrogen vacancy in diamond, Phys. Rev. B 77, 081201 (2008).
- Barson et al. [2019] M. S. Barson, E. Krausz, N. B. Manson, and M. W. Doherty, The fine structure of the neutral nitrogen-vacancy center in diamond, Nanophotonics 8, 1985 (2019).
- Stoll and Schweiger [2006] S. Stoll and A. Schweiger, EasySpin, a comprehensive software package for spectral simulation and analysis in EPR, Journal of Magnetic Resonance 178, 42 (2006).
- Loubser and Wyk [1978] J. H. N. Loubser and J. A. v. Wyk, Electron spin resonance in the study of diamond, Rep. Prog. Phys. 41, 1201 (1978).
- Smith et al. [1959] W. V. Smith, P. P. Sorokin, I. L. Gelles, and G. J. Lasher, Electron-Spin Resonance of Nitrogen Donors in Diamond, Phys. Rev. 115, 1546 (1959).
- Glover et al. [2003] C. Glover, M. E. Newton, P. Martineau, D. J. Twitchen, and J. M. Baker, Hydrogen Incorporation in Diamond: The Nitrogen-Vacancy-Hydrogen Complex, Phys. Rev. Lett. 90, 185507 (2003).
- Chakraborty et al. [2022] T. Chakraborty, R. Bhattacharya, V. Anjusha, M. Nesladek, D. Suter, and T. Mahesh, Magnetic-Field-Assisted Spectral Decomposition and Imaging of Charge States of N - V Centers in Diamond, Phys. Rev. Applied 17, 024046 (2022).
- Robledo et al. [2011] L. Robledo, H. Bernien, T. v. d. Sar, and R. Hanson, Spin dynamics in the optical cycle of single nitrogen-vacancy centres in diamond, New Journal of Physics 13, 025013 (2011).
- Tetienne et al. [2012] J.-P. Tetienne, L. Rondin, P. Spinicelli, M. Chipaux, T. Debuisschert, J.-F. Roch, and V. Jacques, Magnetic-field-dependent photodynamics of single NV defects in diamond: an application to qualitative all-optical magnetic imaging, New J. Phys. 14, 103033 (2012).
- Liaugaudas et al. [2012] G. Liaugaudas, G. Davies, K. Suhling, R. U. A. Khan, and D. J. F. Evans, Luminescence lifetimes of neutral nitrogen-vacancy centres in synthetic diamond containing nitrogen, J. Phys.: Condens. Matter 24, 435503 (2012).
- Bourgeois et al. [2017] E. Bourgeois, E. Londero, K. Buczak, J. Hruby, M. Gulka, Y. Balasubramaniam, G. Wachter, J. Stursa, K. Dobes, F. Aumayr, M. Trupke, A. Gali, and M. Nesladek, Enhanced photoelectric detection of NV magnetic resonances in diamond under dual-beam excitation, Phys. Rev. B 95, 041402 (2017).
- Razinkovas et al. [2021] L. Razinkovas, M. Maciaszek, F. Reinhard, M. W. Doherty, and A. Alkauskas, Photoionization of negatively charged NV centers in diamond: Theory and ab initio calculations, Phys. Rev. B 104, 235301 (2021).
- Bockstedte et al. [2018] M. Bockstedte, F. Schütz, T. Garratt, V. Ivády, and A. Gali, Supplementary Information for Ab initio description of highly correlated states in defects for realizing quantum bits, npj Quant Mater 3, 31 (2018), suppl.
- Rogers et al. [2009] L. J. Rogers, R. L. McMurtrie, M. J. Sellars, and N. B. Manson, Time-averaging within the excited state of the nitrogen-vacancy centre in diamond, New J. Phys. 11, 063007 (2009).
- Ernst et al. [2023a] S. Ernst, P. J. Scheidegger, S. Diesch, L. Lorenzelli, and C. L. Degen, Temperature dependence of photoluminescence intensity and spin contrast in nitrogen-vacancy centers (2023a), arXiv:2301.05091 [cond-mat, physics:quant-ph].
- Ernst et al. [2023b] S. Ernst, P. J. Scheidegger, S. Diesch, and C. L. Degen, Modeling temperature-dependent population dynamics in the excited state of the nitrogen-vacancy center in diamond (2023b), arXiv:2304.02521 [cond-mat.mes-hall] .
- Happacher et al. [2022] J. Happacher, D. A. Broadway, J. Bocquel, P. Reiser, A. Jimenéz, M. A. Tschudin, L. Thiel, D. Rohner, M. l. G. Puigibert, B. Shields, J. R. Maze, V. Jacques, and P. Maletinsky, Low-Temperature Photophysics of Single Nitrogen-Vacancy Centers in Diamond, Phys. Rev. Lett. 128, 177401 (2022).
- Tamarat et al. [2008] P. Tamarat, N. B. Manson, J. P. Harrison, R. L. McMurtrie, A. Nizovtsev, C. Santori, R. G. Beausoleil, P. Neumann, T. Gaebel, F. Jelezko, P. Hemmer, and J. Wrachtrup, Spin-flip and spin-conserving optical transitions of the nitrogen-vacancy centre in diamond, New J. Phys. 10, 045004 (2008).
- Batalov et al. [2009] A. Batalov, V. Jacques, F. Kaiser, P. Siyushev, P. Neumann, L. J. Rogers, R. L. McMurtrie, N. B. Manson, F. Jelezko, and J. Wrachtrup, Low Temperature Studies of the Excited-State Structure of Negatively Charged Nitrogen-Vacancy Color Centers in Diamond, Phys. Rev. Lett. 102, 195506 (2009).
- Fu et al. [2009] K.-M. C. Fu, C. Santori, P. E. Barclay, L. J. Rogers, N. B. Manson, and R. G. Beausoleil, Observation of the Dynamic Jahn-Teller Effect in the Excited States of Nitrogen-Vacancy Centers in Diamond, Phys. Rev. Lett. 103, 256404 (2009).
- Dhungel et al. [2023] O. Dhungel, T. Lenz, M. Omar, J. S. Rebeirro, V. Ivady, A. Gali, A. Wickenbrock, and D. Budker, Zero-field microwave-free magnetometry with ensembles of nitrogen-vacancy centers in diamond (2023), arXiv:2301.09666 [cond-mat, physics:physics].
- Orphal-Kobin et al. [2023] L. Orphal-Kobin, K. Unterguggenberger, T. Pregnolato, N. Kemf, M. Matalla, R.-S. Unger, I. Ostermay, G. Pieplow, and T. Schröder, Optically coherent nitrogen-vacancy defect centers in diamond nanostructures, Phys. Rev. X 13, 011042 (2023).