Statistical tests of galactic dynamo theory
Abstract
Mean-field galactic dynamo theory is the leading theory to explain the prevalence of regular magnetic fields in spiral galaxies, but its systematic comparison with observations is still incomplete and fragmentary. Here we compare predictions of mean-field dynamo models to observational data on magnetic pitch angle and the strength of the mean magnetic field. We demonstrate that a standard dynamo model produces pitch angles of the regular magnetic fields of nearby galaxies that are reasonably consistent with available data. The dynamo estimates of the magnetic field strength are generally within a factor of a few of the observational values. Reasonable agreement between theoretical and observed pitch angles generally requires the turbulent correlation time to be in the range –, in agreement with standard estimates. Moreover, good agreement also requires that the ratio of the ionized gas scale height to root-mean-square turbulent velocity increases with radius. Our results thus widen the possibilities to constrain interstellar medium (ISM) parameters using observations of magnetic fields. This work is a step toward systematic statistical tests of galactic dynamo theory. Such studies are becoming more and more feasible as larger datasets are acquired using current and up-and-coming instruments.
Subject headings:
dynamo – galaxies: magnetic fields – galaxies: spiral – magnetic fields – galaxies: ISM – MHD1. Introduction
Spiral galaxies contain magnetic fields that are coherent on scales larger than the outer scale of turbulence, the so-called large-scale, or mean magnetic fields (Beck & Wielebinski, 2013; Beck, 2015). Mean-field turbulent dynamo theory is the leading theory to explain the prevalence and properties of large-scale magnetic fields in galaxies (Ruzmaikin et al., 1988; Beck et al., 1996; Brandenburg & Subramanian, 2005; Klein & Fletcher, 2015). The galactic dynamo theory has proved to be successful in explaining the overall large-scale magnetic properties of a generic spiral galaxy as well as those of a selection of nearby galaxies. Dynamo models contain a number of parameters that are poorly constrained by theory and observations as they require detailed knowledge on the size and shape of the galactic ionized layers, the magnitude and spatial distribution of the turbulent speeds and scales, as well as their variations with galactic azimuth and radius (e.g., Brandenburg et al., 1993; Shukurov & Sokoloff, 1998; Moss, 1998; Rohde et al., 1999; Moss et al., 2007). Statistical studies of the large-scale magnetic fields in samples of galaxies are limited by the fact that they require observations of synchrotron emission and Faraday rotation at sensitivity and resolution currently achievable only for a modest number of nearby galaxies (Fletcher 2010, Van Eck et al. 2015, (hereafter VBSF), Tabatabaei et al. 2016).
The radio telescopes of a new generation would significantly expand the observational database (e.g., Gaensler et al., 2004) to make such comparisons feasible. However, approaches to such comparisons of theory with observations need to be developed now, but VBSF demonstrated that correlations between individual parameters of spiral galaxies (such as the rotational shear rate) and their magnetic fields are not easy to detect because even the simpler properties of the global magnetic structures are sensitive to a relatively large number of diverse galactic parameters. As a result, the scatter between the remaining parameters hides the expected correlation. In addition, the observational data need to be reduced in a coherent and systematic manner to admit comparison with theory. Therefore, a statistical comparison of dynamo theory with observations requires, apart from a suitable reduction of the observational data (as suggested by VBSF, ), a careful approach.
Another obstacle in observational verifications of galactic dynamo theory is that interstellar random magnetic fields usually exceed the mean field in strength (Ruzmaikin et al., 1988; Beck et al., 1996), so that dedicated techniques are required to deduce the parameters of the global magnetic structures observed. Moreover, galactic magnetic fields, despite being dominated by an axisymmetric structure (in agreement with predictions of the dynamo theory) are further modified by the spiral arms and various asymmetries of the host galaxies. Therefore, careful identification of the underlying axially symmetric magnetic field in the observations is required before the theory can be meaningfully compared with observations. Among approaches suggested to quantify the large-scale structures in the observed distributions of synchrotron emission and Faraday rotation are the expansion of the azimuthal patterns in Faraday rotation into Fourier series in azimuthal angle (Sokoloff et al., 1992a; Berkhuijsen et al., 1997; Fletcher et al., 2004, 2011) and wavelet analysis (Frick et al., 2000; Patrikeev et al., 2006).
In this paper we compare predictions of galactic dynamo theory with the pitch angles of the large-scale magnetic fields in those galaxies where observational data have been interpreted appropriately. The pitch angle of the mean magnetic field is defined as , with , where are cylindrical polar coordinates with the -axis parallel to the galactic angular velocity , and is the regular magnetic field. This is the acute angle between the mean magnetic field and the tangent to the circumference in the galactic plane, and its negative values signify a trailing spiral. There are several advantages in using the magnetic pitch angle to test the galactic dynamo theory (Baryshnikova et al., 1987; Krasheninnikova et al., 1989). Firstly, is readily predicted by the standard non-linear mean-field dynamo theory, with the need to fix the values of only a small number of parameters (Sur et al. 2007,Chamandy et al. 2014 (hereafter CSSS), Chamandy & Taylor 2015 (hereafter CT)). Secondly, the closely related position angle of the polarized synchrotron emission is directly observable, though it must be corrected for Faraday rotation. In contrast, the strength of the mean magnetic field depends on additional parameters involving less certain physics. Its observational determination relies on the questionable assumption of an energy or pressure equipartition between cosmic rays and magnetic fields (Beck & Krause, 2005; Stepanov et al., 2014) when deduced from the synchrotron intensity, or the implicit assumption of the statistical independence of the magnetic, thermal-electron and cosmic-ray density fluctuations when obtained from Faraday rotation (Beck et al., 2003). As a result, the regular magnetic field magnitude determined from observational data is arguably less reliable than its inferred pitch angle. Moreover, is sensitive to details of the dynamo non-linearity and the extent to which the dynamo is supercritical, to which is less sensitive.
Fletcher (2010) (see also Klein & Fletcher 2015), briefly assessed the ability of dynamo theory to explain some features of galactic magnetic fields, but they restricted the comparison to the kinematic, or linear regime of dynamo action where magnetic field still grows exponentially. Nearby galaxies definitely have the dynamo action saturated since the energy density of the large-scale magnetic field is comparable to the turbulent energy density, so nonlinear, steady-state solutions of the dynamo equations are more relevant in such comparisons. As pointed out by Elstner (2005) and studied in detail by CT, magnetic pitch angles are predicted to be smaller in magnitude in the saturated state than in the kinematic regime. VBSF expanded the database compiled by Fletcher (2010) and performed a statistical analysis of the data, including an assessment of the level of agreement between the data and solutions of a simple analytical non-linear dynamo model. The magnetic pitch angles predicted by the dynamo model used by VBSF had magnitudes much too small to explain observations, confirming concerns voiced previously (Elstner, 2005). CT explored the parameter space of the dynamo models more extensively to find magnetic pitch angles comparable to those observed can be obtained in standard dynamo models but not with the canonical, solar-neighborhood parameter values used by VBSF. Our goal here is to develop further such a comparison using essentially the same dynamo model as CT (with a few refinements). Given the deliberate simplicity of the galactic dynamo models used, the incompleteness of the galactic dynamo theory in general, and imperfections in the observational data, it is unrealistic to expect an agreement between the theory and observations at the level of rigorous statistical tests, and such comparisons would necessarily remain qualitative at least until more extensive, homogeneous and reliable observational data become available.
The paper is organized as follows. In Section 2, we briefly discuss the data set. We then present dynamo solutions in Section 3 illustrating both numerical and analytical results in various regions of the parameter space. Sections 2 and 3 present only a brief discussion, and the reader is referred to VBSF and CT for more detail. A discussion of the galactic model used as input to the model can be found in Section 4. Section 5 presents the main results, comparing the magnetic pitch angles obtained in the dynamo theory and observations, while Section 6 explores effects of varying model parameters. We discuss the implications of our results and the significance of the remaining discrepancies between the theory and the data in Section 7. We formulate our conclusions in Section 8.
| (1) | (2) | (3) | (4) | (5) | (6) | (7) | (8) | (9) | (10) | (11) |
|---|---|---|---|---|---|---|---|---|---|---|
| Galaxy | Radial range | |||||||||
| (obs.) | (obs.) | (fid.) | (fid.) | (fid.) | ( var.) | ( const.) | () | () | ||
| M31 | – | |||||||||
| – | ||||||||||
| – | ||||||||||
| – | ||||||||||
| M33 | – | |||||||||
| – | ||||||||||
| M51 | – | |||||||||
| – | ||||||||||
| – | ||||||||||
| – | ||||||||||
| M81 | – | – | ||||||||
| – | – | |||||||||
| NGC 253 | – | |||||||||
| NGC 1097 | – | |||||||||
| – | ||||||||||
| – | ||||||||||
| NGC 1365 | – | |||||||||
| – | ||||||||||
| – | ||||||||||
| – | ||||||||||
| – | ||||||||||
| – | ||||||||||
| – | ||||||||||
| NGC 1566 | – | – | ||||||||
| NGC 6946 | – | – | ||||||||
| – | – | |||||||||
| – | – | |||||||||
| IC 342 | – | – | ||||||||
| – | – |
| (1) | (2) | (3) | (4) | (5) | (6) | (7) | (8) |
| Galaxy | Radial range | ||||||
| LEDA | NED | ||||||
| M31 | – | ||||||
| – | |||||||
| – | |||||||
| – | |||||||
| M33 | – | ||||||
| – | |||||||
| M51 | – | ||||||
| – | |||||||
| – | |||||||
| – | |||||||
| M81 | – | – | |||||
| – | – | ||||||
| NGC 253 | – | ||||||
| NGC 1097 | – | – | |||||
| – | – | ||||||
| – | – | ||||||
| NGC 1365 | – | – | |||||
| – | – | ||||||
| – | – | ||||||
| – | – | ||||||
| – | – | ||||||
| – | – | ||||||
| – | – | ||||||
| NGC 1566 | – | – | |||||
| NGC 6946 | – | ||||||
| – | |||||||
| – | |||||||
| IC 342 | – | – | |||||
| – | – |
2. Data
Our sample contains ten nearby galaxies selected because observations of their synchrotron emission and, especially, Faraday rotation, have been interpreted with sufficient detail and reliability in terms of the pitch angle of the large-scale magnetic field as to admit comparison with theory. In particular, the azimuthal variation of the synchrotron polarization angle in most of them has been interpreted in terms of the magnitudes of the Fourier components of the product , where is the thermal electron density and is the scale height of the ionized layer. This allows a reliable estimate of the pitch angle of the axisymmetric part of the large-scale magnetic field (the azimuthal wave number ) whose parameters can be predicted by the dynamo theory. The mode corresponds to a bisymmetric structure, most often associated with an overall asymmetry of the pattern rather than dynamo action, whereas the mode is usually attributed to a perturbation induced by a two-armed spiral pattern. In all cases where magnetic field structure is known for both the disk and halo, we use the disk data.
Table 1 presents parameters of the magnetic fields in the sample galaxies, both as observed and as obtained from various versions of the dynamo models discussed in Section 3. Table 2 contains the galactic parameters used as an input to the dynamo models. We mostly use the data compiled by VBSF but with a few notable exceptions. A typographical error in the magnetic pitch angle of IC 342 has been corrected: in the outermost annulus, (c.f. Gräve & Beck, 1988). We exclude the galaxies M94 and NGC 4414 from the sample since the radial range over which the data is averaged is not stated in the original work (VBSF). NGC 253 is included, however, with the radial range – (Heesen et al., 2009). For M33, we have selected the observational model from Tabatabaei et al. (2008) that contains and azimuthal modes but no vertical field component , as this type of magnetic field is more likely to be maintained in a thin gas layer (this choice is different from that of VBSF). To determine the H I and star formation rate surface densities in the outer annulus of NGC 6946, exponentials were fitted to the data from the two innermost annuli.
We divide the sample into three groups based on the galaxy morphology and magnetic field fitting technique. Group I consists of M31, M33, and M51, galaxies without a prominent bar, for which azimuthal Fourier components (, , and ) have been fitted to the multi-frequency data on the synchrotron polarization angle in the galactic disk. Following VBSF, we compare our dynamo model with the axisymmetric () component. Group II consists of M81, NGC 253, NGC 1566, NGC 6946, and IC 342. M81 has no bar whereas the others are SAB galaxies but with a small bar. In each case, the bar does not extend to the midpoint of the inner radial range considered. The bar radii are about for NGC 253 (Sorai et al., 2000), for NGC 1566 (Combes et al., 2014), for NGC 6946 (Fathi et al., 2007, and references therein), and for IC 342 (Crosthwaite et al., 2000). For M51 and NGC 253, disk and halo magnetic field components were fitted separately (Fletcher et al., 2011; Heesen et al., 2009), while for M31, such a separation was considered but found to be unnecessary (Fletcher et al., 2004). Finally, Group III consists of two barred galaxies, NGC 1097 and NGC 1365, with bars as large as about and , respectively, thus extending into most (NGC 1365) or the whole (NGC 1097) of the range of galactocentric distances where the pitch angle of the mean magnetic field is known (Beck et al., 2005). The structure of the mean magnetic field in and near the bar is affected by the associated strongly nonaxisymmetric gas flow (Moss et al., 2001, 2007), so we do not expect our dynamo model, designed for axially symmetric galaxies, to be very successful at explaining such fields.
3. Dynamo model
The dynamo model is essentially that of CT and CSSS, with a few refinements, and we refer the reader to those papers for more information, but here we introduce it only briefly. We solve three coupled dynamo equations in the slab approximation, where radial derivatives are neglected. This approximation has been shown to produce accurate results when compared to higher dimensional solutions (Chamandy, 2016). The radial and azimuthal components of the mean-field induction equation and the dynamical quenching equation, which stems from magnetic helicity balance (Shukurov et al., 2006), are then given by
| (1) | ||||
| (2) | ||||
| (3) |
with the turbulent correlation length, equal to the sum of kinetic and magnetic contributions,
and the field strength corresponding to energy equipartition with turbulent kinetic energy given by
with the density of ionized gas and is the rms turbulent velocity. The turbulent diffusivities and are assumed to be independent of . We adopt the standard estimate
with both and the correlation time of interstellar turbulence assumed constant. The mean vertical velocity and kinetic effect are given by
and
respectively, with and both parameters with dimensions of velocity. Note that we have neglected in equation (2), and assumed in equation (3), which are appropriate for a thin disk. We have also assumed . Vacuum boundary conditions, at , are used, along with at . The boundary condition on leaves unconstrained the helicity flux through the disk surface.
3.1. Dimensionless parameters
The following dimensionless parameters (all are or can be functions of the galactocentric distance) can be used to specify the dynamo model (CT):
| (4) |
where is the galactic angular velocity, is the galactocentric distance, is the scale height of the magnetized gas layer, and is the characteristic speed of the galactic outflow (wind or fountain). The velocity shear due to the galactic differential rotation is quantified by , is the disk half-thickness in the unit comparable to the turbulent correlation length, is the Coriolis number, a measure of the influence of rotation on the interstellar turbulence, and is the outflow speed at the disk surface in the units of the turbulent speed .
The most significant refinement to the dynamo model of CT is that we adopt the amplitude of the (kinetic part of the) coefficient as (Ruzmaikin et al., 1988, p. 163)
| if | (5a) | ||||
| if | (5b) |
where is a constant of order unity. In terms of the dimensionless parameters,
In both cases, , with a certain constant of order unity, because cannot exceed some fraction of the turbulent speed. We vary parameters and , that allow for uncertainties of the theory, to assess the sensitivity of the results to this variation. These estimates of are illustrated in Figure 1, where the parameter plane is divided into three regions, labeled (a), (b) and (c), where various forms of apply, with (a) and (b) corresponding to Equations (5a) and (5b), respectively, and (c) corresponding to .
Alternatively, but equivalently, one could use the turbulent Reynolds numbers , and , in place of , , and , as is more conventional in dynamo theory. They are related as
with the maximum value to prevent from exceeding . In addition, we have
The dynamo action saturates, and the system settles to a steady state, when the energy density of the mean magnetic field has grown to become comparable (but not equal) to the turbulent energy density, i.e., when the magnetic field strength becomes comparable to . In numerical solutions of the dynamo equations, which resolve the -dependence of the galactic disk and magnetic field, we adopt an exponential profile for as a function of , with scale height . The pitch angle determined from numerical solutions is calculated by taking a weighted vertical average with respect to , as the intensity of polarized synchrotron emission is proportional to the cosmic ray electron density, which is expected to scale with (where is an approximation of the total field strength comprising both the mean and random parts) at the kiloparsec scales (Stepanov et al., 2014). As is largest at the midplane, where is also typically largest, this shifts the weighted average to slightly larger values of . Likewise, averages of mean field strength across the disk are weighted by to allow for the fact that they are often obtained from the synchrotron intensity.
Below we use both analytical and numerical solutions for the mean magnetic field, both obtained in the local (slab) approximation. Given the accuracy of the analytical solutions that we demonstrate, they enable deeper insight into the theory and results and facilitate further analysis.

3.2. Analytical dynamo solutions
Simple and yet accurate analytical solutions of the galactic mean-field dynamo equations can be obtained by approximating the -derivatives of magnetic field as divisions by with appropriate numerical coefficients (the no- approximation). Here we present the results obtained from this model referring the reader to (CSSS) for details. To obtain the steady-state solution for the saturated state, one assumes that \al@Chamandy+14b,Chamandy+Taylor15; \al@Chamandy+14b,Chamandy+Taylor15,
| (6) |
and then the pitch angle is given by
| (7) |
Furthermore, the admissible region in the parameters space is constrained by the requirement that the dynamo action can maintain a large-scale magnetic field, i.e., , where is given in Eq. (5b). Straightforward algebra then leads to the admissible values of the Coriolis number,
| if | (8a) | ||||
| if | (8b) | ||||
| if | (8c) |
where
| (9) |
These cases correspond to the regions of parameter space shown in Figure 1. Yet another requirement is that the dynamo amplifies the mean magnetic field fast enough, i.e., the kinematic growth rate of the mean magnetic field, , is sufficiently large. In each of the cases (8a)–(8c), we have, respectively,
| (10a) | |||||
| (10b) | |||||
| (10c) |
This is a local growth rate as it represents the growth rate at a given position in the disk unimpeded by the radial and azimuthal magnetic diffusion, so is a function of the galactocentric distance in an axially symmetric disk. The diffusive and non-local coupling within the disk leads to the establishment of a global eigenmode whose growth rate is independent of position and is only slightly (a few percent in a thin disk) smaller than the largest value of in an axisymmetric disk (Section VII.6 in Ruzmaikin et al., 1988; Moss et al., 1998). We require solutions to have as only those solutions produce non-zero mean magnetic field.
Finally, the strength of the mean magnetic field in the saturated dynamo regime is given by
| (11) |
where is the Strouhal number, with the turbulent diffusivity of , and (with as ). Here is the pitch angle in the kinematic regime, given by
| (12a) | |||||
| (12b) | |||||
| (12c) |
in the cases (8a)–(8c), respectively. Note that, unlike , outflows do not affect the value of in the analytical solution. A property of the solution is that . It is also worth noting that ( \al@Chamandy+14b,Chamandy+Taylor15; \al@Chamandy+14b,Chamandy+Taylor15, e.g.),
where and are the values of the dynamo number in the kinematic and saturated regimes, respectively.
3.3. Numerical dynamo solutions
Numerical solutions are obtained for equations (1)–(3) in and . We used a uniform mesh in with a 6th order finite-difference and 3rd order time-stepping routines employed in the Pencil Code (Brandenburg, 2003). Solutions are averaged across the disk to obtain a prediction that may be tested against observations as described in Section 3.1. We obtained both non-linear and kinematic numerical solutions to derive both the saturated magnetic field and the local kinematic growth rate, respectively. Spatial resolutions of 21 or 41 grid points are generally sufficient to cover the parameter space specified in Section 3.4, but in subsequent sections we used a resolution of 101 grid points to increase the precision.
 |
 |
 |
 |
 |
 |
 |
 |
3.4. Magnetic pitch angle in the dynamo solutions
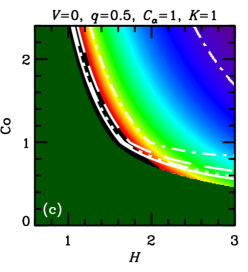
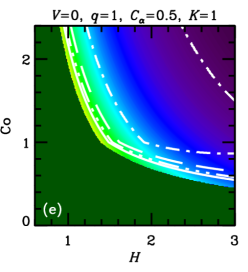
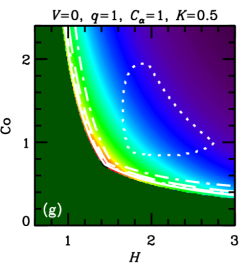
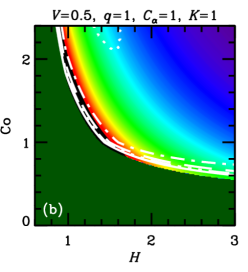
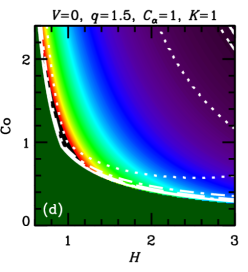
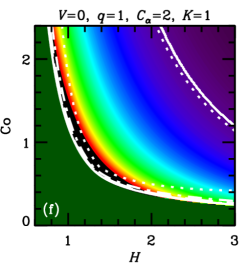
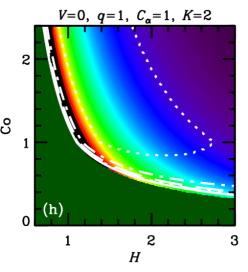
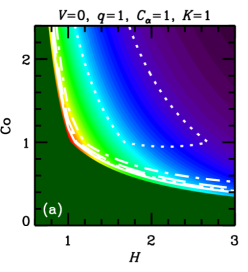
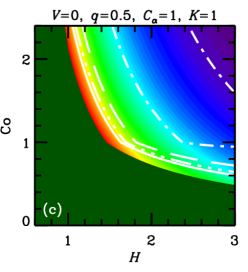
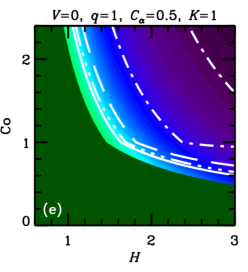
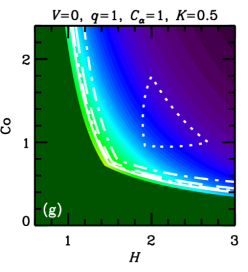
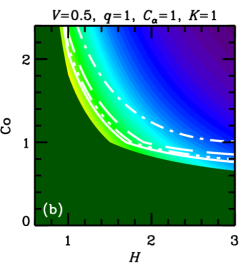
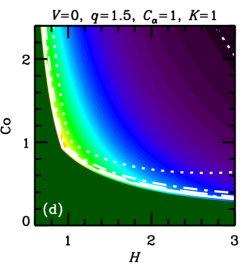
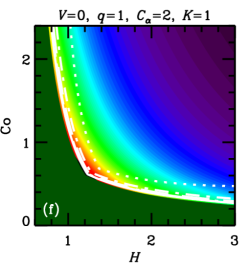
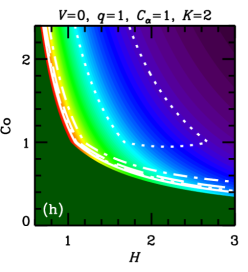
In what follows, we discuss the magnetic pitch angle in the steady state (saturated, nonlinear dynamo solutions) unless otherwise specified, and denote it without a subscript. The pitch angle of the mean magnetic field obtained from the steady-state solutions of the dynamo equations (1)–(3) is shown in Figure 2 for the numerical solution. For comparison, Figure 9 presents for the analytic solution, equation (7). It is evident from these figures that the two solutions are rather similar (see also \al@Chamandy+14b,Chamandy+Taylor15; \al@Chamandy+14b,Chamandy+Taylor15, ). The pitch angle is shown in the -plane for various combinations of the remaining model parameters , , and . To obtain the numerical solutions, we fix and (in this section only). The turbulent outer scale enters only through the equation for , and we set : that is, we adopt . As equations (1)–(3) can be written in terms of the dimensionless parameters (4) (CT), the solutions are insensitive to the value of , for a fixed value of . Moreover, in the analytical solution for , which closely approximates numerical solutions, one simply approximates the dynamo as critical (), without the need to invoke equation (3) explicitly. Thus, we expect solutions for to be almost independent of and ; this is indeed borne out by our numerical solutions. Also plotted are the contours for the local -folding growth time,
| (13) |
In units of the local galactic rotation period , the dotted contour corresponds to and other contours show , , and . Since these growth times refer to the kinematic regime, when the field is growing exponentially and the non-linearity is unimportant, is independent of and . Regions shown dark green in Figure 2 and Figure 9 correspond to decaying solutions.
In each column, a single parameter is varied from the fiducial case (, ) of Panel (a). The leftmost columns of Figures 9 and 2 show that, for a given and , a stronger outflow (larger ) leads to a larger , but weakens dynamo action (leading to a larger or a decaying solution) by making larger. Combining equations (6) and (7), we find , where the right-hand-side is the ratio of the strengths of and effects (c.f. Shukurov, 2007). We see then that a larger value of implies a larger value of .
Turning to the next column, we see that a weaker velocity shear (smaller ) also causes to increase. But, again, this suppresses the dynamo action: the dynamo growth rate decreases with .
In the rightmost two columns, we show the result of varying the parameters and . The numerical solutions of Figure 2 confirm that is almost independent of and , but that increasing either of these parameters strengthens dynamo action, leading to smaller growth times and less stringent constraints on the parameter space. A solid contour in the top right corner of panel 2(f) (also visible in panel (d)) identifies the region where linear eigenmodes are oscillatory, with the usual even parity about the midplane, but relax to the ‘expected’ stationary solution at saturation (local growth times are not calculated for those solutions).111For certain other combinations of parameter values, e.g. , , , and , we find kinematic eigenmodes to be oscillatory with even parity for a certain range of , in this case –. In most cases, these solutions regularize to the ‘expected’ stationary solutions upon saturation, but for a small region of parameter space near the boundary where the dynamo becomes critical, oscillations can persist into the non-linear regime. Such cases are probably not realistic, as in radial and azimuthal magnetic diffusion would damp such oscillations, resulting in stationary global modes. Nevertheless, saturated solutions are rather robust to variations of order unity in and .
Comparing Figures 9 and 2, we see that analytical solutions slightly underestimate and . In this respect, the analytical solution is slightly conservative. The difference is noticeable where the effect is significant, namely near the boundary of the allowed region of the -plane and for large or small , but analytical solutions are, even in the most extreme cases, within a factor of two of numerical solutions for the examples presented above (see also \al@Chamandy+14b,Chamandy+Taylor15; \al@Chamandy+14b,Chamandy+Taylor15, ).


4. Galaxy models
In this section we derive the dynamo parameters (4) for the sample galaxies using the observational data of Table 2. The galactic rotation curves and, hence, the rotation and shear rates are reasonably well constrained; these parameters are the same as those in VBSF.
A suitable estimate of the magnitude of the mean vertical velocity at the disk surface, , can be found in Appendix B1 of VBSF. With a typographic error in that paper corrected, we have
| (14) |
where is the scale height of the ionized gas layer normalized by , is the HI surface density in units of , is the surface density of star formation rate in units of , and is the number density of the hot phase normalized by .
This form of leads to proportional to . Then, since , virtually all features of the dynamo solutions depend only on the ratio , rather than and separately. The only variable that depends on and differently is . The value of enters the steady-state magnetic field strength but not the pitch angle (7) and (12c) and the kinematic growth rate (10c) of the mean magnetic field.
In our fiducial model we assume that the ionized disk is flared, with an exponential increase in the disk scale height with galactocentric radius. For the Milky Way, we adopt the exponential scale length of , as in the H I disk model of Kalberla & Dedes (2008). We also set for the Milky Way, consistent with observed values of the warm neutral medium in the solar neighborhood (Lockman, 1984) (see also Sect. VI.2 of Ruzmaikin et al., 1988). This exponential relation is then rescaled using the radius. Adopting for the Milky Way (Bigiel & Blitz, 2012), we have
| (15) |
with and .
We adopt a turbulent speed that does not vary within or between galaxies, , corresponding to transonic turbulence in the warm interstellar gas of a temperature about . There is some evidence of variations of the turbulent speed with galactocentric radius, discussed in Section 6.3, but it is perhaps not conclusive enough.
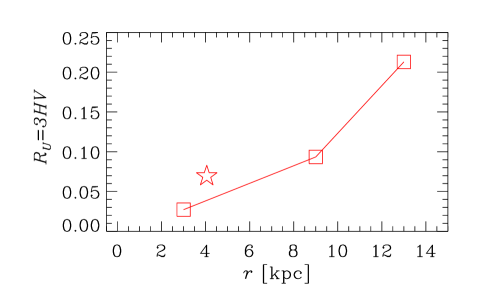
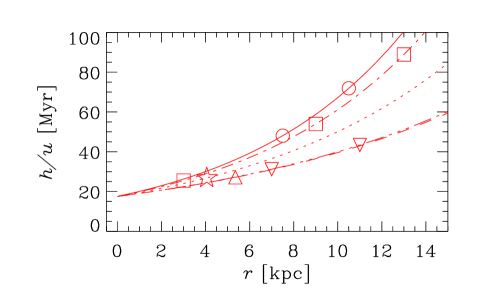
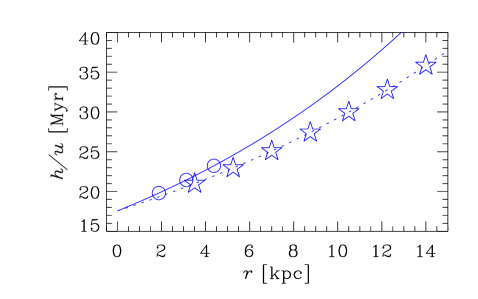
Figure 3 shows the key parameters of the galaxy models obtained from the data of Table 2. Columns correspond, from left to right, to galaxy Groups I–III, as defined in Section 2. The top row presents the radial variation of , a dimensionless quantity that determines the importance of the galactic outflow via equations (7), (9) and (11)). Note that in all cases for which the required data is available, so outflows hardly affect the dynamo action in the model adopted. For those galaxies where is not listed in Table 2, we adopt . Given the uncertainties involved in our estimate of the outflow speed, equation (14), we return to address the role of outflows in Section 7. The bottom row of Figure 3 shows the radial profile of used in our fiducial model.
For the turbulent correlation time we adopt , which is slightly larger than the value of with and often adopted in galactic dynamo models, but in the middle of the physically plausible range of 3–. This choice leads to a good overall agreement with the observational data on the magnetic pitch angle while producing positive local kinematic growth rates for all data points. Restricting to be the same for all galaxies is probably too stringent, as is likely to depend on other factors such as the star formation rate and the local sound speed. However, to keep the model, analysis, and presentation simple, we prefer to adopt a constant in our fiducial model, but discuss the implications of relaxing this constraint in Section 6.2.
Only dynamo solutions with a positive local growth rate of equation (10c) are physically significant as only then the model produces a non-zero mean magnetic field. In order to satisfy this constraint for all the data points, we are forced to adopt , rather than the standard value of unity. With , eight of the data points have decaying magnetic fields in the kinematic regime, . According to equation (7), the magnetic pitch angle in the saturated regime is insensitive to the value of , and numerical solutions confirm this. A change from to in the numerical solution does not produce more than a few per cent difference in . Thus, in Regions (a) and (b) of parameter space, shown in Figure 1, is enhanced by a factor of , but in Region (c) the upper limit is achieved, corresponding to . In each case where , the amplitude of reaches the upper limit . Therefore, for fiducial model parameters, the relevant regions of parameter space are (a) and (c) only. The amplitude of reaches the upper limit of for only five of the data points, all at galactocentric distances –: in the innermost annulus of M51, at all radii in NGC 1097, and in the innermost annulus of NGC 1365.


5. Results
5.1. Growth time of the mean magnetic field
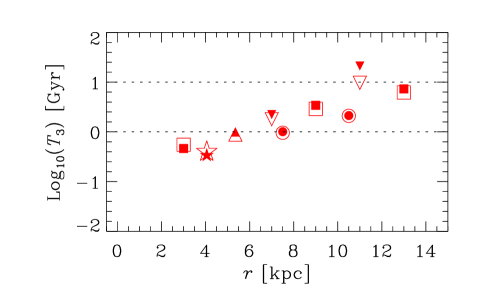
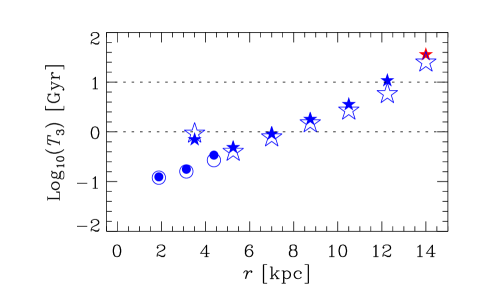
It is often claimed that the mean-field galactic dynamos generate magnetic fields at a time scale exceeding , too large to explain magnetic fields suggested to be present in galaxies at (age of order ) (Bernet et al., 2008, 2013). We present in Figure 4 the -folding growth times , for numerical (open symbols) and analytical (filled symbols) dynamo solutions, as a function of galaxy radius for each of the galaxy groups I–III. The amplification factor of is chosen because the fluctuation dynamo action is expected to produce an effective seed magnetic field for the galactic mean-field dynamos of order (Section VII.14 in Ruzmaikin et al., 1988; Shukurov, 2007). In almost all cases, and at . Furthermore, our model implicitly assumes that galaxy properties such as and have not evolved during the course of dynamo action; this assumption is probably not important for the saturated state, but could be important for estimates of the growth rate.
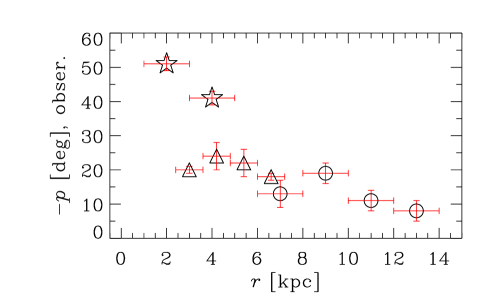
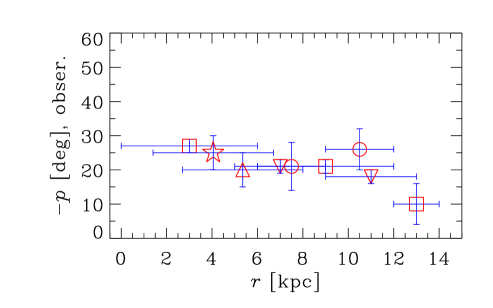
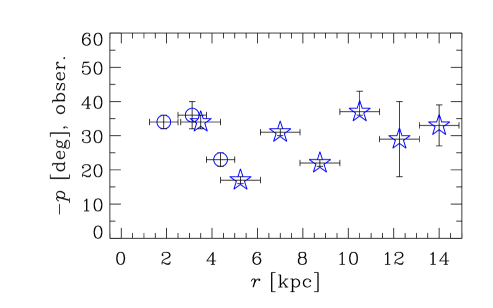
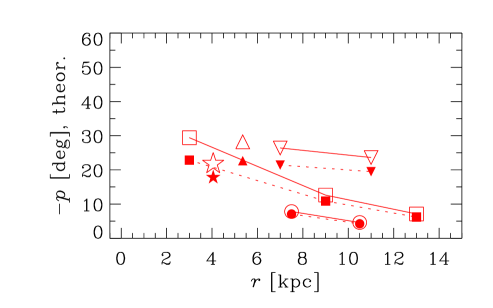
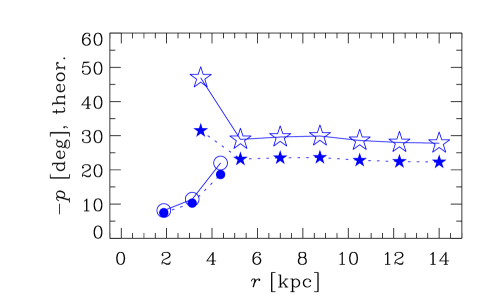
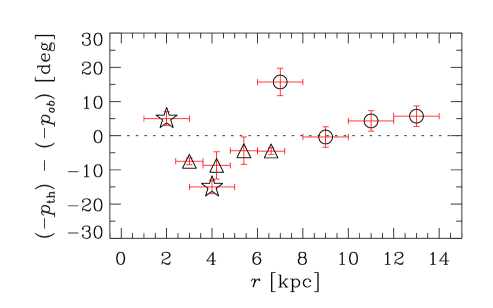
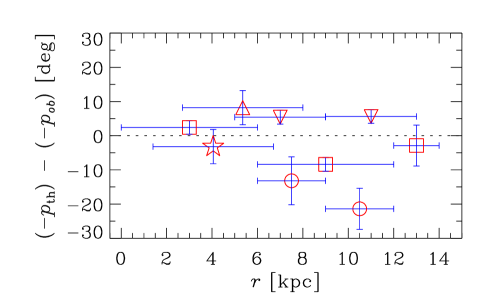
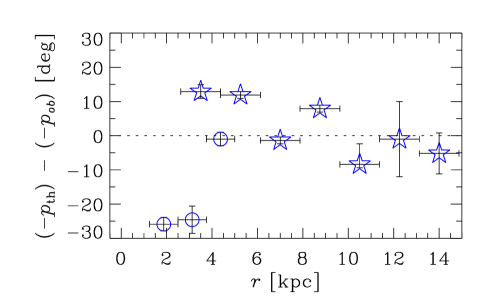
5.2. Magnetic pitch angle
Both the observational estimates of and predictions of the dynamo model for the magnetic pitch angle in the sample galaxies are shown in Figure 5. As before, open symbols represent numerical solutions while filled symbols are for the analytical solutions, both in the saturated dynamo. Numerical solutions are obtained for , the value obtained from MHD simulations by Mitra et al. (2010); is hardly sensitive to .
The top row of Figure 5 shows observational data for as a function of galactocentric radius , with uncertainties in taken from the original works cited by VBSF. The data points are referred to the middle of the radial ranges for which they are obtained, and those radial ranges are shown with horizontal bars. In the middle row, the pitch angles from the dynamo solutions are shown, with open (filled) symbols denoting numerical (analytical) solutions. The bottom row shows the difference between the theoretical and observed pitch angles.
The pitch angles from the fiducial model are given in Column 5 of Table 1, and the observational values are in Column 3. We cannot expect to achieve agreement between the model and observations at the level of parametric statistical tests because of the heterogeneous nature of the data and the deliberately simplified form of the dynamo field model (see Section 7.6). Nevertheless, to provide a feeling for the relative quality of the fits, we quantify the agreement between various versions of the model and observations in terms of their residual difference, . We obtain a reduced of , , and for numerical solutions of group I, II, and III galaxies, respectively, where is equal to the difference between the number of data points and number of free parameters.
Kendall’s rank correlation test can be used to assess whether the model reproduces the trends in the data at a statistically significant level. Having accepted that the model may systematically underestimate or overestimate the magnetic pitch angles, this test allows us to find out if the difference between the model and observations is systematic and consistent (which would speak in favor of the model) or just random. Let be the number of galaxies within a group, and the number of data points in galaxy . The number of galaxy pairs within a group is , and is the number of intra-galaxy pitch angle pairs within a group. Then is the number of galaxy pairs that are correctly ordered by the model according to mean value of ; that is the number of concordant pairs, as opposed to discordant pairs. In this notation, Kendall’s . Likewise, is the number of intra-galaxy pairs of the values that are correctly ordered.
We thus find that , , and , and , , and for groups I, II, and III, respectively. For our model, we obtain , , and , and , , and . The probability of obtaining (where the values of that now concern us are , , or ), given a purely random ordering (the null hypothesis), can be computed using inversion theory and the result depends on the Mahonian sequence of numbers.222See Kendall (1938) and http://oeis.org/A008302. For example, for , we find pairs. The probabilities for obtaining , , , or correct orderings by chance are , , , and , respectively. These are computed by dividing the appropriate part of the Mahonian sequence by . The probability for obtaining or greater correct orderings by chance is then . To obtain , the extra step of summing the probabilities of all relevant permutations is needed. We obtain , , and , which tells us that our model is no better than the null hypothesis at predicting the relative ordering of of the pitch angles. We can also define in the analogous way, using and . We obtain , , and . This provides mild to moderate evidence that the model is better than a uniform distribution over permutations at correctly ordering the intra-galaxy pairs of pitch angles for groups I and II, but not for group III (two barred galaxies).
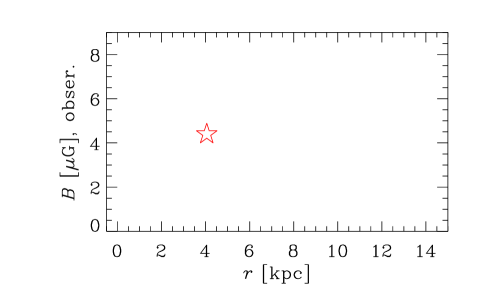
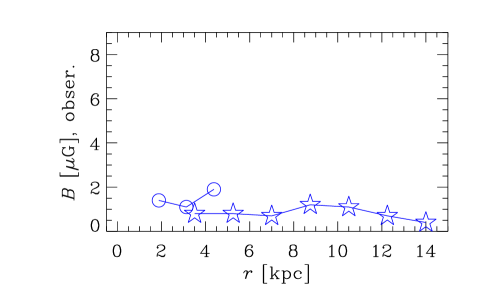
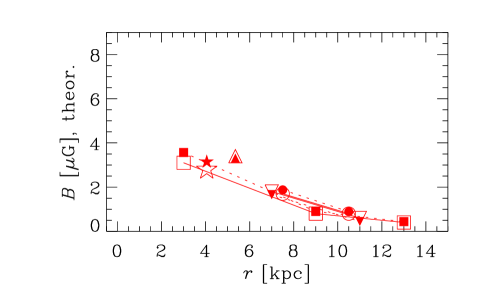
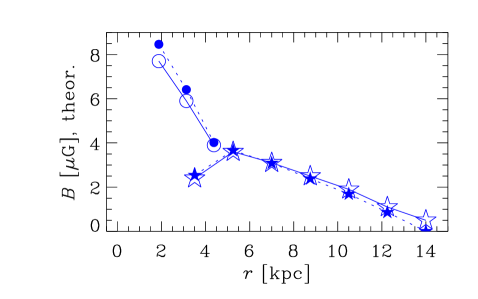
5.3. Strength of the large-scale magnetic field
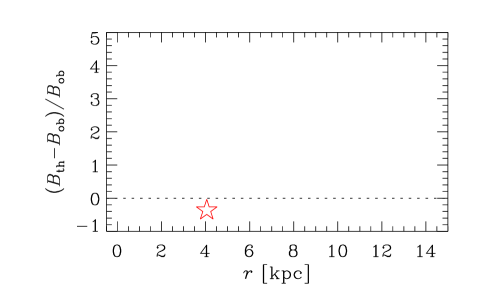
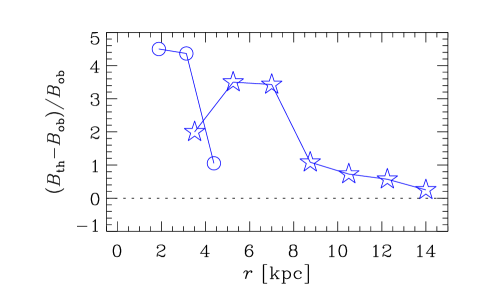
Figure 6 shows the strength of the mean magnetic field obtained from observations and the dynamo model, as well as the relative difference between the two in the bottom row. The observational estimates in Groups I and III are obtained from the amplitude of the mode in each radial bin. In Group II, however, radially binned field strengths are available for only one galaxy, NGC 253. Uncertainties on the observed values of were not readily available. The dynamo model typically overestimates the field strength, but only by a factor of about on average, with the notable exceptions of M31 where the field strength is underestimated by a factor of about five, and NGC 253 where the theoretical estimate is in reasonable agreement with the observed value. The radial variation in field strength is in general poorly reproduced by the model, but for the galaxy M31 the variation is negligible, in agreement with observations. Unlike , the field strength obtained from the dynamo model is sensitive to a larger number of parameters, such as , , and . We choose (Mitra et al., 2010) rather than specifically to improve the agreement with observations. Moreover, depends on the values of and individually (through ) rather than just their ratio, as well as on our rather crude assumption that the surface density of ionized gas is equal to that of HI gas. Equally important is the fact that the estimates of from Faraday rotation are subject to various systematic uncertainties, such as the effects of correlations between thermal electron density and magnetic fields (Beck et al., 2003). With allowance for all these uncertainties, we conclude that the agreement between theory and observations for the large-scale magnetic fields strength is reasonable, even if further improvements are clearly desirable on both theoretical and observational sides.
6. Model variations and refinements
The experience gained in this paper helps to understand how galactic dynamo models should be developed to achieve better agreement with observations; these aspects of dynamo models are discussed in this section. We have tentatively explored some such directions, but their thorough analysis extends beyond the framework of this paper.
6.1. The role of disk flaring
To clarify the importance of the disk flaring, we consider a dynamo model with a flat disk, , but other parameters unchanged. Results for are shown in Column 9 of Table 1, and yield , , and , , , and , and , , and for the Groups I, II, and III, respectively. This is worse agreement than with a flared disk, and varying does not help.
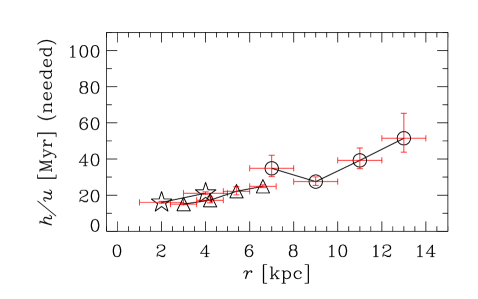
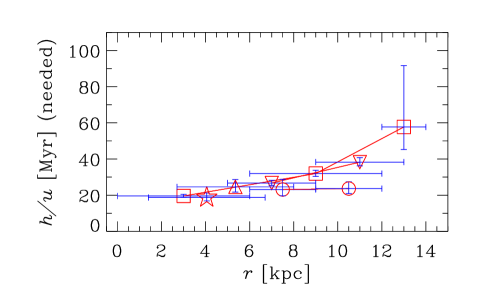
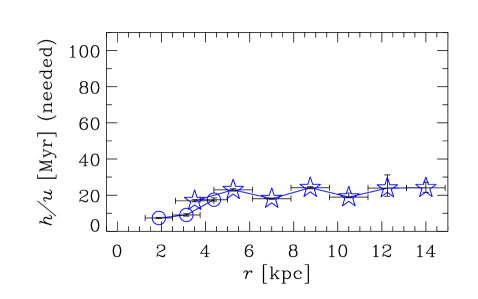
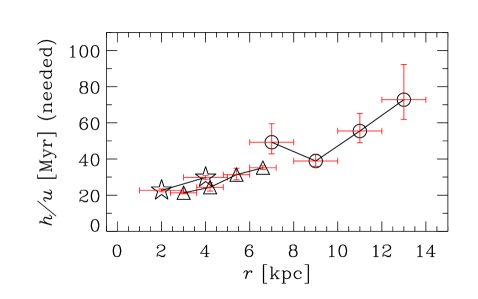
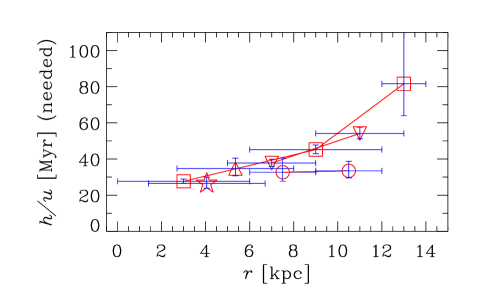
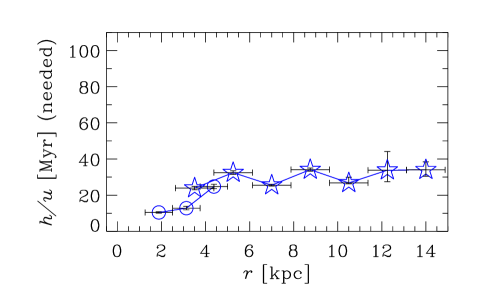
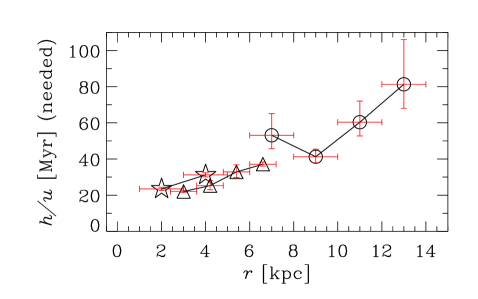
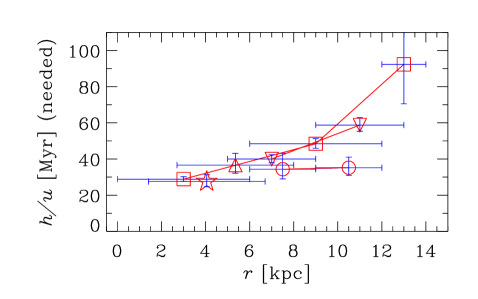
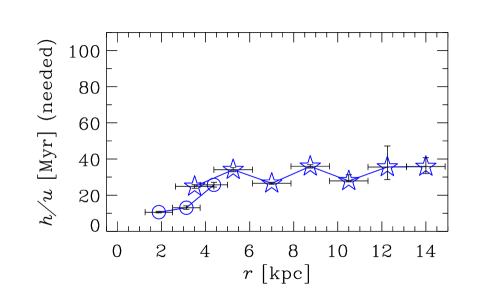
The radial variation of that would fit the observed magnetic pitch angles can be obtained from equation (7), as shown in Figure 7 as derived from the analytical solution for and (top row), and (middle row), and and (bottom row). An increase in the required with is evident, both within and between galaxies, for Groups I and II. For the barred galaxies of Group III, the required is much flatter with respect to . The dependence of on shown in Fig. 7 is comparable with that used in the fiducial dynamo model and shown in Fig. 3. Since the radial variations in both the scale height of the ionized layer and the turbulent velocities are not known confidently from either observations or theory, we tend to consider the results presented in Fig. 7 as a prediction.
6.2. Turbulence correlation time
The turbulence correlation time is likely to vary from galaxy to galaxy and within a given galaxy, for instance because it can depend on the star formation rate and detailed dynamics of interstellar turbulence (Shukurov, 2007). Thus, we consider dynamo models with a value of , for the sake of simplicity chosen to be constant for each galaxy, that minimizes (and considered as an additional parameter in the calculation of ) for a given galaxy: for M31, for M33, for M51, for NGC 253, for NGC 1097, for NGC 1365, for NGC 1566, for NGC 6946, and for IC 342. The optimal values of are within a factor of two of each other and comparable with the existing estimates (e.g., Shukurov, 2007). Only for one galaxy, M81, the required value exceeds , so we set to for it. The resulting magnetic pitch angles in the saturated state of the dynamo are shown in Column 8 of Table 1. We obtain , , and , and , , and , with associated null probabilities , , and for the galaxies in Groups I, II, and III, respectively ( is unchanged from the constant- model). Thus, the dynamo model agrees with the data somewhat better when varies between galaxies in Group I, but only marginally in Groups II and III. It is equally likely that varies within galaxies as well. We do not pursue this possibility further before more definite estimates of the turbulence correlation time are available. However, our results provide strong indication that this variation is at least within a factor of several within and between spiral galaxies.
6.3. Turbulent velocity
Magnetic pitch angle depends strongly on the turbulent velocity, from (7) or (B1), neglecting the outflow, . Observations of nonthermal H I broadening suggest, for the one-dimensional velocity dispersion in the radial ranges considered here, , , , in M31 (Chemin et al., 2009, C. Carignan, private communication), , in M33 (C. Carignan, private communication), and , , , in M51 (Tamburro et al., 2009). The corresponding values of the three-dimensional turbulent speed are times larger if the turbulence is isotropic. However, we used a constant turbulent speed of in the dynamo model. Larger values of could be accommodated in the model by increasing proportionately, while differences in between galaxies could potentially improve agreement with observations. However, as data for is not immediately available for all the galaxies of our sample, and as inferring from may involve additional subtleties, we leave such an approach for future work.
7. Discussion
We are left, then, with a simple dynamo model, which provides reasonable agreement with observational estimates of the pitch angle and strength of the large-scale magnetic field, and is sufficiently flexible to incorporate various refinements. It is notable that the fiducial model, based on the ‘standard’ estimates of the galactic parameters, needs to be refined, for example by using variable turbulence correlation time, in order to achieve a better agreement. Together with this observation, our results strongly suggest that the ionized galactic disks are flared and provides an estimate of the flaring rate implied by magnetic field observations in nearby spiral galaxies. In this section we discuss the implications of our results for galactic dynamos.
7.1. The role of galactic outflows
Despite growing evidence of the importance of galactic outflows (winds and fountains) for many aspects of physics of galaxies (Veilleux et al., 2005; Putman et al., 2012), estimates of the outflow speed, and its dependence on the galactic parameters, remain uncertain. The dynamo model used here relies on the order-of-magnitude estimate of the outflow speed (14). We could estimate an outflow speed for only five of the ten galaxies in our sample (M31, M33, M51, NGC 253, and NGC 6946), but the gas surface density and/or star formation rate surface density were not readily available for the remaining galaxies. Equation (14) predicts that the outflows are rather weak, to affect the magnetic pitch angle to any significant degree. As shown in Column 10 of Table 1 adopting affects the magnetic pitch angles insignificantly.
To allow for the uncertainty of Eq. (14), we also considered models with the outflow speed ten times larger than in (14) but with the same dependence on galactic parameters. The resulting values of the magnetic pitch angle shown in Column 11 of Table 1, are by about 10 per cent larger than in the fiducial model, up to a maximum of about per cent for the outermost data point in NGC 6946. For the reader’s convenience, the analytical solution of the dynamo equations with outflows neglected, , are presented in Appendix B. Galactic outflows play an important role in the large-scale dynamo action as they help to remove magnetic helicity from the dynamo-active region among other effects (Shukurov et al., 2006; Sur et al., 2007; Chamandy et al., 2014, 2015). Their effects on observable parameters of galactic magnetic fields clearly require further analysis.
7.2. The role of spiral arms
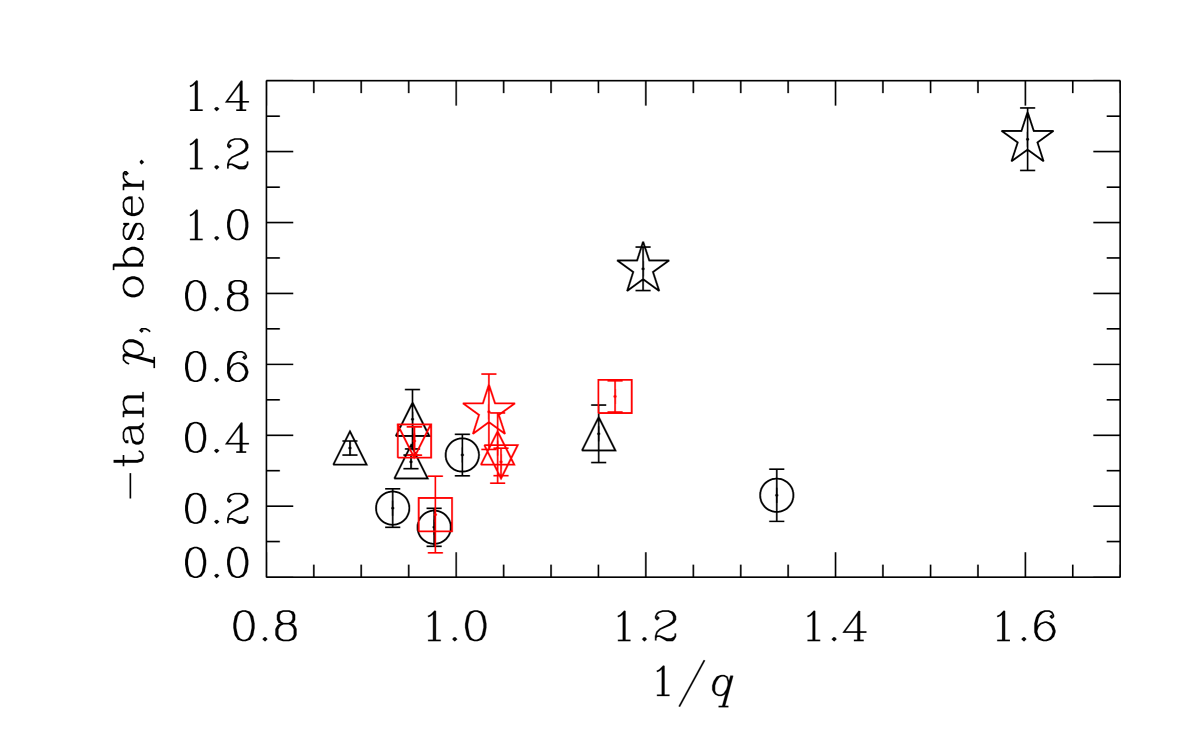
VBSF found that the pitch angle of the regular magnetic field is correlated with that of the spiral arms and suggested that compression of gas and magnetic field in the arms can explain the correlation. In addition, equation (7) shows that is anticorrelated with , the velocity shear rate due to the galactic differential rotation. Figure 8 shows the dependence of on from the data in Tables 1 and 2 for the galaxies in Groups I and II, excluding M81 for reasons discussed in Section 7.3.2. Pearson’s correlation coefficient is (with the adjusted value , where is the number of data points). This leads to a student-t value of . The probability of attaining if the variables are uncorrelated is less than . The dependence of the magnetic pitch angle of an axially symmetric magnetic field on the velocity shear arises naturally in the dynamo theory because differential rotation is an integral part of the - dynamo.333However, the magnitude of the shear is expected to be different within spiral arms and between them. This effect needs to be included into discussions of the effects of the spiral pattern on galactic magnetic field.
We also note that a strong negative correlation between the pitch angle of spiral arms and the shear rate is found from both observations and simulations (Seigar et al., 2005, 2006; Grand et al., 2013). Thus, at least a part of the apparent correlation between the pitch angles of the large-scale magnetic field and spiral arms can be due to their dependence on rather than any causal connection. However, the two pitch angles not only depend similarly on the rotational velocity shear but are also close to each other in magnitude (VBSF). Since the two quantities depend on rather different galactic parameters apart from , this suggests a causal connection between them. Clearly, there is a need to further clarify the relationship between the two types of pitch angle, but this is beyond the scope of the present work.
7.3. Individual galaxies
7.3.1 M33
The large pitch angles of M33 have been a challenge to explain using standard dynamo theory (Tabatabaei et al., 2008). We have shown that such large can indeed be attained in a dynamo model. However, though the model correctly produces a that decreases with radius, it does not do an adequate job of fitting both data points simultaneously, even allowing for adjustments to . The innermost data point is for the radial bin –, where our model, which assumes a thin disk, , is less reliable. Another possibility is that accretion of gas with a velocity of a few , as observed for some galaxies (Schmidt et al., 2016), could affect at small radius in the saturated regime (see Fig. 4 of Moss et al., 2000).
7.3.2 M81
The observed of M81 are much larger than those found from the model (though because of large formal uncertainties in the M81 pitch angle data, does not improve significantly if M81 is excluded). M81 is the only galaxy where the large-scale magnetic field may be predominantly non-axisymmetric (Krause et al., 1989; Sokoloff et al., 1992b; Fletcher, 2010), in which case our model would not be expected to produce good agreement for this galaxy. However, the observations are rather old, and their interpretation relied on incomplete procedures, so that the question of the global magnetic field structure in this galaxy remains open.
7.3.3 NGC 1097 and NGC 1365
The dynamo model used here is axially symmetric, so we do not expect it to be accurate in the case of the barred galaxies NGC 1097 and NGC 1365 in the sample. It is reassuring that the dynamo model performs better in the case of Group I and II galaxies. Since deviations from axial symmetry are stronger in the bar region, it is understandable that the disagreement between the axisymmetric dynamo model and observations is greater at small galactocentric distances in the two barred galaxies. In NGC 1097, the pitch angle for the outermost radial range is reproduced by the model to within the observational uncertainty. Likewise, the solution for the mean magnetic field strength in this annulus is within a factor of two of the observed value. In NGC 1365, the model magnetic pitch angles are consistent with the data in four outer rings. Numerical dynamo models designed specifically for barred galaxies have been developed by Moss et al. (2001); Beck et al. (2005); Moss et al. (2007); Kulesza-Żydzik et al. (2010); Kulpa-Dybeł et al. (2011).
7.4. The accuracy of magnetic pitch angle estimates
Magnetic pitch angles obtained from fitting azimuthal Fourier modes to the polarization angles, used to obtain magnetic pitch angles given in Column 3 of Table 1 have very small formal uncertainties, but their systematic uncertainties can be significantly larger, e.g., those associated with the variation in the parameters of the magneto-ionic medium along the line of sight, relatively crude allowance for depolarization effects, etc. Having this in mind, the agreement of the simple dynamo model used here with observations is encouraging. For the galaxies M31, M51, NGC 253, NGC 1566, NGC 6946, and IC 342, our model does a fairly reasonable job of reproducing magnetic pitch angles. Allowing the turbulence correlation time to vary between galaxies within a reasonable range –, but still restricted to remain constant within each galaxy, improves the agreement further.
7.5. Uncertainty in model parameters
Although the values of , , and used in our models are in line with typical estimates, there is still considerable uncertainty in these parameters. For example, estimates of from numerical simulations of supernova-driven turbulence in a stratified medium with rotation and shear yield – (Gressel et al., 2008b; Brandenburg et al., 2013). Such simulations also suggest – (Gressel, 2010; Gent et al., 2013). If such modifications to and are made in the model, they tend to offset each other as far as the pitch angle is concerned (equations (7) and (B1)). However, the local growth rate is also affected, and becomes negative for large values of (equations (10c) and (B2c)). Likewise, the parameters , , , and have important effects on the field strength (equations (11) and (B4)). Clearly, more work on constraining these parameters using observations, simulations, and modeling is needed.
7.6. Promising refinements of galactic dynamo models
There are several factors that have not been included in the dynamo model used here. We consider dynamo action in a thin gas layer in vacuum. Disk–halo connections undoubtedly affect magnetic fields in the disk but their role still remains to be fully understood. More generally, considering the full tensorial structure of the turbulent transport coefficients and allowing for vertical gradients of the galaxy parameters leads to additional terms that may be important in equations (1) and (2). For example,
where or , dots represent the other terms, and the diamagnetic pumping velocity can be estimated analytically (e.g. Brandenburg & Subramanian, 2005). Diamagnetic pumping toward the midplane () is expected to occur when , and this effect has been measured in simulations (Gressel et al., 2008a; Gressel, 2010). Conveniently, this term has the same form as the term involving , and the combination could be crudely approximated by replacing in equations (1) and (2) by an effective velocity . The damaging effect of a strong outflow on the dynamo would thus be suppressed (while the full would presumably still contribute to the advective flux in equation (3)). The advection-type term involving could likewise be important. It has previously been found, using mean-field models, that such terms can play significant roles in the galactic context (Brandenburg et al., 1995; Gabov et al., 1996; Shukurov, 1996). Including these effects would thus be an important step toward more realistic modeling.
In fact, it has been suggested that a possible non-linear quenching of could, if present, play an equally important role to that of in the saturation of the dynamo (Gressel, 2010; Gressel et al., 2013; Bendre et al., 2015). Consider for illustration a scenario where quenching of is the dominant saturation mechanism. Then the value of the effective velocity at saturation would be approximately equal to that which produces a critical dynamo for . Since large (effective) outflows imply large pitch angles (Sect. 3.4), this mechanism could potentially produce pitch angles in the saturated state larger than those in the kinematic regime (Elstner et al., 2009). Such a scenario requires further theoretical justification, but could potentially serve as an alternative model to be tested against observations.
Any deviations from axial symmetry in either the host galaxy or the dynamo action are also neglected in our treatment. As a result, the dynamo model employed provides just the lowest-order approximation to reality. Radial flows are completely neglected in our model, though if strong (Schmidt et al., 2016), they can have a significant effect on the magnetic pitch angle (Moss et al., 2000). Finally, certain aspects of dynamo theory remain controversial and poorly understood. For example, the nature of the magnetic helicity flux is still unclear, and there can be such effects in addition to the advective and diffusive fluxes included in our dynamo model (Subramanian & Brandenburg, 2006; Vishniac, 2012; Ebrahimi & Bhattacharjee, 2014). The need in our fiducial model to slightly enhance the dynamo action to attain positive local growth rates hints that the dynamo mechanism is stronger than implied by the standard estimates. Another poorly understood effect is the possible modification of the turbulent magnetic diffusivity by magnetic field (Brandenburg et al., 2008; Karak et al., 2014; Bendre et al., 2015; Simard et al., 2016).
8. Conclusions
We have used a simple, mean-field dynamo model to calculate the strength and direction of the axisymmetric large-scale (or regular) magnetic field in nearby disk galaxies for which sufficient data are available. We obtain a fairly reasonable level of overall agreement between model solutions and observations for the magnetic pitch angle for the galaxies M31, M51, M81, NGC 253, NGC 1566, NGC 6946, and IC 342. For M33, large pitch angle magnitudes comparable with observed values are obtained, but detailed agreement is lacking. For the two barred galaxies in the sample, NGC 1097 and NGC 1365, our model does worse, which is expected as their gas flows and magnetic fields deviate strongly from axial symmetry. However, agreement for these galaxies is better at larger galactocentric distance, where effects of the bar are less important.
For the regular magnetic field strength, our model agrees with the data to within a factor of a few. The field strength is less precisely determined than the magnetic pitch angle, both observationally and theoretically.
We confirm that it is possible to explain large pitch angle magnitudes in galaxies by appealing to parameter values different from standard (solar neighborhood) estimates. Specifically, large pitch angles require a relatively small ratio of disk semi-thickness to turbulent speed and/or a relatively large correlation time , compared to standard estimates of – and , respectively.
To obtain locally growing solutions for the mean magnetic field in the kinematic dynamo regime for all radii in all galaxies in the sample, we require that the standard estimate for the kinetic effect be enhanced by a factor of about . This suggests that standard estimates for the effect may be too small.
We obtain strong evidence that the ratio tends to increase with galactocentric radius within galaxies. Assuming, as we have done, that is approximately constant with radius, this result implies that the ionized disk within which dynamo action occurs is flared.
Our model produces good agreement with observation when we choose the turbulent correlation time to lie somewhere within the range –, which is consistent with standard estimates. The specific value of is, however, likely to vary from galaxy to galaxy.
Extending the present work will require better and more homogeneous magnetic field and kinematics data for nearby galaxies, as well as refinements to the dynamo model to incorporate additional physical effects. Further, a detailed investigation of the possible connections between spiral arms and magnetic pitch angles is still needed. While our main objective was to make progress toward better tests of dynamo theory, the present work also demonstrates the promise of inverting the problem to probe ISM physics using magnetic fields.
Acknowledgements
We are grateful to A. Fletcher, M. Krause, C. Carignan, and M. Mogotsi for help with interpreting various data, to N. Chamandy for providing a code for cross-checking probabilities and for discussions about statistics, and to L. F. S. Rodrigues, J. Zwart, and R.-J. Dettmar for useful discussions. LC and AS would like to thank K. Subramanian and IUCAA for hosting them, during which time a part of this work was carried out. We also appreciate helpful feedback from the referee. AS acknowledges financial support of the Leverhulme Trust Grant RPG-2014-427 and STFC Grant ST/N000900/1 (Project 2).
References
- Baryshnikova et al. (1987) Baryshnikova, I., Shukurov, A., Ruzmaikin, A., & Sokoloff, D. D. 1987, A&A, 177, 27
- Beck (2015) Beck, R. 2015, in Astrophysics and Space Science Library, Vol. 407, Astrophysics and Space Science Library, ed. A. Lazarian, E. M. de Gouveia Dal Pino, & C. Melioli, 507
- Beck et al. (1996) Beck, R., Brandenburg, A., Moss, D., Shukurov, A., & Sokoloff, D. 1996, ARA&A, 34, 155
- Beck et al. (2005) Beck, R., Fletcher, A., Shukurov, A., et al. 2005, A&A, 444, 739
- Beck & Krause (2005) Beck, R., & Krause, M. 2005, Astronomische Nachrichten, 326, 414
- Beck et al. (2003) Beck, R., Shukurov, A., Sokoloff, D., & Wielebinski, R. 2003, A&A, 411, 99
- Beck & Wielebinski (2013) Beck, R., & Wielebinski, R. 2013, Magnetic Fields in Galaxies, ed. T. D. Oswalt & G. Gilmore, 641
- Bendre et al. (2015) Bendre, A., Gressel, O., & Elstner, D. 2015, Astronomische Nachrichten, 336, 991
- Berkhuijsen et al. (1997) Berkhuijsen, E. M., Horellou, C., Krause, M., et al. 1997, A&A, 318, 700
- Bernet et al. (2013) Bernet, M. L., Miniati, F., & Lilly, S. J. 2013, ApJ, 772, L28
- Bernet et al. (2008) Bernet, M. L., Miniati, F., Lilly, S. J., Kronberg, P. P., & Dessauges-Zavadsky, M. 2008, Nature, 454, 302
- Bigiel & Blitz (2012) Bigiel, F., & Blitz, L. 2012, ApJ, 756, 183
- Brandenburg (2003) Brandenburg, A. 2003, Computational aspects of astrophysical MHD and turbulence (Taylor & Francis, London and New York), 269
- Brandenburg et al. (1993) Brandenburg, A., Donner, K. J., Moss, D., et al. 1993, A&A, 271, 36
- Brandenburg et al. (2013) Brandenburg, A., Gressel, O., Käpylä, P. J., et al. 2013, ApJ, 762, 127
- Brandenburg et al. (1995) Brandenburg, A., Moss, D., & Shukurov, A. 1995, MNRAS, 276, 651
- Brandenburg et al. (2008) Brandenburg, A., Rädler, K.-H., Rheinhardt, M., & Subramanian, K. 2008, ApJ, 687, L49
- Brandenburg & Subramanian (2005) Brandenburg, A., & Subramanian, K. 2005, PhR, 417, 1
- Chamandy (2016) Chamandy, L. 2016, MNRAS, 462, 4402
- Chamandy et al. (2015) Chamandy, L., Shukurov, A., & Subramanian, K. 2015, MNRAS, 446, L6
- Chamandy et al. (2014) Chamandy, L., Shukurov, A., Subramanian, K., & Stoker, K. 2014, MNRAS, 443, 1867
- Chamandy & Taylor (2015) Chamandy, L., & Taylor, A. R. 2015, ApJ, 808, 28
- Chemin et al. (2009) Chemin, L., Carignan, C., & Foster, T. 2009, ApJ, 705, 1395
- Combes et al. (2014) Combes, F., García-Burillo, S., Casasola, V., et al. 2014, A&A, 565, A97
- Crosthwaite et al. (2000) Crosthwaite, L. P., Turner, J. L., & Ho, P. T. P. 2000, AJ, 119, 1720
- Ebrahimi & Bhattacharjee (2014) Ebrahimi, F., & Bhattacharjee, A. 2014, Physical Review Letters, 112, 125003
- Elstner (2005) Elstner, D. 2005, in The Magnetized Plasma in Galaxy Evolution, ed. K. T. Chyzy, K. Otmianowska-Mazur, M. Soida, & R.-J. Dettmar (Jagiellonian University, Krakow), 117–124
- Elstner et al. (2009) Elstner, D., Gressel, O., & Rüdiger, G. 2009, in IAU Symposium, Vol. 259, Cosmic Magnetic Fields: From Planets, to Stars and Galaxies, ed. K. G. Strassmeier, A. G. Kosovichev, & J. E. Beckman, 467–478
- Fathi et al. (2007) Fathi, K., Toonen, S., Falcón-Barroso, J., et al. 2007, ApJ, 667, L137
- Fletcher (2010) Fletcher, A. 2010, in Astronomical Society of the Pacific Conference Series, Vol. 438, Astronomical Society of the Pacific Conference Series, ed. R. Kothes, T. L. Landecker, & A. G. Willis, 197
- Fletcher et al. (2011) Fletcher, A., Beck, R., Shukurov, A., Berkhuijsen, E. M., & Horellou, C. 2011, MNRAS, 412, 2396
- Fletcher et al. (2004) Fletcher, A., Berkhuijsen, E. M., Beck, R., & Shukurov, A. 2004, A&A, 414, 53
- Frick et al. (2000) Frick, P., Beck, R., Shukurov, A., et al. 2000, MNRAS, 318, 925
- Gabov et al. (1996) Gabov, A. S., Sokolov, D. D., & Shukurov, A. M. 1996, Astronomy Reports, 40, 463
- Gaensler et al. (2004) Gaensler, B. M., Beck, R., & Feretti, L. 2004, New A Rev., 48, 1003
- Gent et al. (2013) Gent, F. A., Shukurov, A., Fletcher, A., Sarson, G. R., & Mantere, M. J. 2013, MNRAS, 432, 1396
- Grand et al. (2013) Grand, R. J. J., Kawata, D., & Cropper, M. 2013, A&A, 553, A77
- Gräve & Beck (1988) Gräve, R., & Beck, R. 1988, A&A, 192, 66
- Gressel (2010) Gressel, O. 2010, PhD thesis, PhD Thesis, 2010
- Gressel et al. (2013) Gressel, O., Bendre, A., & Elstner, D. 2013, MNRAS, 429, 967
- Gressel et al. (2008a) Gressel, O., Elstner, D., Ziegler, U., & Rüdiger, G. 2008a, A&A, 486, L35
- Gressel et al. (2008b) Gressel, O., Ziegler, U., Elstner, D., & Rüdiger, G. 2008b, Astronomische Nachrichten, 329, 619
- Heesen et al. (2009) Heesen, V., Krause, M., Beck, R., & Dettmar, R.-J. 2009, A&A, 506, 1123
- Kalberla & Dedes (2008) Kalberla, P. M. W., & Dedes, L. 2008, A&A, 487, 951
- Karak et al. (2014) Karak, B. B., Rheinhardt, M., Brandenburg, A., Käpylä, P. J., & Käpylä, M. J. 2014, ApJ, 795, 16
- Kendall (1938) Kendall, M. G. 1938, Biometrika, 30, 81
- Klein & Fletcher (2015) Klein, U., & Fletcher, A. 2015, Galactic and Intergalactic Magnetic Fields
- Krasheninnikova et al. (1989) Krasheninnikova, I., Shukurov, A., Ruzmaikin, A., & Sokoloff, D. 1989, A&A, 213, 19
- Krause et al. (1989) Krause, M., Hummel, E., & Beck, R. 1989, A&A, 217, 4
- Kulesza-Żydzik et al. (2010) Kulesza-Żydzik, B., Kulpa-Dybeł, K., Otmianowska-Mazur, K., Soida, M., & Urbanik, M. 2010, A&A, 522, A61
- Kulpa-Dybeł et al. (2011) Kulpa-Dybeł, K., Otmianowska-Mazur, K., Kulesza-Żydzik, B., et al. 2011, ApJ, 733, L18
- Lockman (1984) Lockman, F. J. 1984, ApJ, 283, 90
- Mitra et al. (2010) Mitra, D., Candelaresi, S., Chatterjee, P., Tavakol, R., & Brandenburg, A. 2010, Astronomische Nachrichten, 331, 130
- Moss (1998) Moss, D. 1998, MNRAS, 297, 860
- Moss et al. (1998) Moss, D., Shukurov, A., & Sokoloff, D. 1998, Geophysical and Astrophysical Fluid Dynamics, 89, 285
- Moss et al. (2000) —. 2000, A&A, 358, 1142
- Moss et al. (2001) Moss, D., Shukurov, A., Sokoloff, D., Beck, R., & Fletcher, A. 2001, A&A, 380, 55
- Moss et al. (2007) Moss, D., Snodin, A. P., Englmaier, P., et al. 2007, A&A, 465, 157
- Patrikeev et al. (2006) Patrikeev, I., Fletcher, A., Stepanov, R., et al. 2006, A&A, 458, 441
- Putman et al. (2012) Putman, M. E., Peek, J. E. G., & Joung, M. R. 2012, ARA&A, 50, 491
- Rohde et al. (1999) Rohde, R., Beck, R., & Elstner, D. 1999, A&A, 350, 423
- Ruzmaikin et al. (1988) Ruzmaikin, A. A., Shukurov, A. M., & Sokoloff, D. D. 1988, Magnetic Fields of Galaxies (Kluwer, Dordrecht)
- Schmidt et al. (2016) Schmidt, T. M., Bigiel, F., Klessen, R. S., & de Blok, W. J. G. 2016, ArXiv e-prints, arXiv:1601.01689
- Seigar et al. (2005) Seigar, M. S., Block, D. L., Puerari, I., Chorney, N. E., & James, P. A. 2005, MNRAS, 359, 1065
- Seigar et al. (2006) Seigar, M. S., Bullock, J. S., Barth, A. J., & Ho, L. C. 2006, ApJ, 645, 1012
- Shukurov (1996) Shukurov, A. 1996, Astronomical and Astrophysical Transactions, 11, 259
- Shukurov (2007) Shukurov, A. 2007, in Mathematical Aspects of Natural Dynamos, ed. E. Dormy & A. M. Soward (Chapman & Hall/CRC), 313–359
- Shukurov & Sokoloff (1998) Shukurov, A., & Sokoloff, D. 1998, Stud. Geophys. Geod., 42, 391
- Shukurov et al. (2006) Shukurov, A., Sokoloff, D., Subramanian, K., & Brandenburg, A. 2006, A&A, 448, L33
- Simard et al. (2016) Simard, C., Charbonneau, P., & Dube, C. 2016, ArXiv e-prints, arXiv:1604.01533
- Sokoloff et al. (1992a) Sokoloff, D., Shukurov, A., & Krause, M. 1992a, A&A, 264, 396
- Sokoloff et al. (1992b) —. 1992b, A&A, 264, 396
- Sorai et al. (2000) Sorai, K., Nakai, N., Kuno, N., Nishiyama, K., & Hasegawa, T. 2000, PASJ, 52, 785
- Stepanov et al. (2014) Stepanov, R., Shukurov, A., Fletcher, A., et al. 2014, MNRAS, 437, 2201
- Subramanian & Brandenburg (2006) Subramanian, K., & Brandenburg, A. 2006, ApJ, 648, L71
- Sur et al. (2007) Sur, S., Shukurov, A., & Subramanian, K. 2007, MNRAS, 377, 874
- Tabatabaei et al. (2008) Tabatabaei, F. S., Krause, M., Fletcher, A., & Beck, R. 2008, A&A, 490, 1005
- Tabatabaei et al. (2016) Tabatabaei, F. S., Martinsson, T. P. K., Knapen, J. H., et al. 2016, ApJ, 818, L10
- Tamburro et al. (2009) Tamburro, D., Rix, H.-W., Leroy, A. K., et al. 2009, AJ, 137, 4424
- Van Eck et al. (2015) Van Eck, C. L., Brown, J. C., Shukurov, A., & Fletcher, A. 2015, ApJ, 799, 35
- Veilleux et al. (2005) Veilleux, S., Cecil, G., & Bland-Hawthorn, J. 2005, ARA&A, 43, 769
- Vishniac (2012) Vishniac, E. T. 2012, in SpS4-New Era for Interstellar and Intergalactic Magnetic Fields, IAU XXVIII General Assembly, Beijing
Appendix A Magnetic pitch angle in the no- approximation
 |
 |
 |
 |
 |
 |
 |
 |