Stochastic model of virus and defective interfering particle spread across mammalian cells with immune response
Abstract
Much of the work on modeling the spread of viral infections utilized partial differential equations. Traveling-wave solutions to these PDEs are typically concentrated on velocities and their dependence on the various parameters. Most of the investigations into the dynamical interaction of virus and defective interfering particles (DIP), which are incomplete forms of the virus that replicate through co-infection, have followed the same lines. In this work we present an agent based model of viral infection with consideration of DIP and the negative feedback loop introduced by interferon production as part of the host innate immune response. The model is based on high resolution microscopic images of plaques of dead cells we took from mammalian cells infected with Sendai virus with low and high DIP content. In order to investigate the effects discrete stochastic microscopic mechanisms have on the macroscopic growth of viral plaques, we generate an agent-based model of viral infection. The two main aims of this work are to: (i) investigate the effects of discrete microscopic randomness on the macroscopic growth of viral plaques; and (ii) examine the dynamic interactions between the full length virus, DIP and interferon, and interpret what may be the evolutionary role of DIP. We find that we can explain the qualitative differences between our stochastic model and deterministic models in terms of the fractal geometry of the resulting plaques, and that DIP have a delaying effect while the interaction between interferon and DIP has a slowing effect on the growth of viral plaques, potentially contributing to viral latency.
I Introduction
The modeling of the dynamics of viral infection across host cells is a classical problem in the field of population dynamics and dispersal. Partial differential equations (PDEs) models of such systems have a long history; notably Skellam Skellam (1951) was the first to apply PDEs to the random dispersal of biological populations. Such models apply the continuum assumption whereby populations of individuals are represented as scalar concentration fields which obey PDEs. Many of these models are not analytically solvable, and generally, simple solutions such as traveling wave, are commonly used to describe the dispersal of virus across host cells. Here we study the spatial and stochastic effects of the dispersal of virus amongst an immobile space of host cells with the use of an agent-based model. In this context we examine the dynamic interactions of the virus with defective interfering particles (DIP), which are incomplete forms of the virus, described in detail below, and the interferon production by host cells’ immune response.
The system analyze here is made of a continuous monolayer of host cells and a distribution of full-length and defective viral particles as well as interferon molecules. The virus spreads by infecting cells, replicating, then releasing it’s yield upon killing the host cell; this yield of virus particles are then free to diffuse and infect neighboring cells, generating a growing plaque of dead cells. The host cells’ immune response can detect defective viral particles and this results in the release interferon molecules that locally reduce the probability of further viral infection. The addition of the negative feedback loop through the interferon response by host cells due to DIP detection was not previously modeled by others.
A typical approach to model the dispersal of a virus across host cells is to use the continuum assumption whereby the distribution of particles and cells are represented as scalar concentration fields which are solutions to differential equations. A system of differential equations which embodies the hypothesized significant mechanisms is derived and studied for insight into the population dynamics. This approach has been popular in the field of immunology modeling to enhance understanding of HIV-1 infection and other pathogens Perelson (2002), and to explore the idea that DIP could be used for HIV therapy Nelson and Perelson (1995), while in Stauffer and Yin (2010) the authors investigated the population dynamics of virus and DIP in serial passage cultures with recurrence relations.
An extension of this approach is to study the spatio-temporal dynamics of a population spread. The continuum assumption being made even on the scale of whole organisms Skellam (1951) being among the first to do this. Typically partial differential equations such as,
| (1) |
where is the dispersal rate and is the intrinsic growth rate, form the basis of these models. One of the first applications of this class of models to study virus-DIP infection was by Frank Frank (2000), however this model did not give a full treatment of the spatio-temporal development and did not include the immune response. A PDE model was developed by Yin and McCaskill Yin and McCaskill (1992), wherein the spread of the virus was represented as a reaction diffusion system,
| (2) |
where , and represent the concentration of virus, infected host cells and uninfected host cells, and , , and represent the rates of viral infection, desorption and cell death. The authors devised the corresponding PDE model, looked for traveling wave solutions, and considered the dependence of the velocity upon the parameters of the model. A similar approach was taken in YOU and YIN (1999). Haseltine Haseltine et al. (2008) took this approach one step further by fitting their model to images of growing viral plaques, while also concentrating on the velocity. More recently Amore Amor and Fort (2010) expanded upon reaction-diffusion models by including the delay time between infection of a cell and the release of viral progeny. The preoccupation with velocity permeates most of the literature on this subject, however here we are mainly concerned with the qualitative details of the spatio-temporal dynamics of viral infections, it’s implications for the dynamical significance of the stochastic nature of the physical and biological mechanisms, focusing on the possible role for DIP in the context of their detection by the host and the resultant interferon immune response.
Here, rather than velocity, we investigate the qualitative dynamic effects of the mechanisms of virus dispersal, adding the important variables of interferon and DIP. DIP were discovered in the 1950’s as incomplete forms of the influenza virus that interfere with viral replication VON MAGNUS (1954); Paucker and Henle (1958). They were subsequently observed for almost all RNA viruses such as rabies Clark et al. (1981), sendai (SeV) Kolakofsky (1976), polio Cole et al. (1971), sindbis Shenk and Stollar (1973), vesicular stomatitis virus (VSV) Schubert et al. (1978), and measles Hall et al. (1974); Rima et al. (1977). It was discovered that DIP interfere with viral replication by over loading the viral replication machinery because shorter DIP replicate faster compared with the production of full-length virus Yount et al. (2006). It was also discovered that DIP can be detected by the host, promoting interferon production leading to a robust immune response Marcus and Sekellick (1977); Lopez et al. (2006); Yount et al. (2006). Many DIP can only replicate through co-infection with the full virus leading to a parasitic or predator-pray type relationship.
DIP are a conserved biological phenomenon with no known function. Given that many species of virus are often found to co-exist with their corresponding DIP, it is reasonable to suppose that they could be performing a biological function that confer an evolutionary advantage, or otherwise exist in some kind of evolutionary equilibrium with the virus. However, this is not currently known or proposed, and the above properties, being ostensibly detrimental to the virus, do not signal an obvious function or mutual evolutionary advantage. Here we shall consider, through a generic model, the dynamical interaction between virus, DIP, host cells and their innate immune response. We demonstrate that DIP can have a delaying effect on the spread of virus, and interferon can have a slowing effect. We provide some insight into these specific relationships. Our model leads us to a more general consideration of the continuum assumption behind PDE approaches to the modeling of virus spread in an immobile space of host cells. The most significant result of this part of our investigation is that, in this system, a discrete stochastic model may have qualitatively different solutions than the deterministic, traveling-wave solutions of reaction-diffusion PDE models. In which case it is important to determine which type of model is most appropriate for this biological system, and this determination may extend understanding of the most important mechanisms in the spread of viral infection in a host.
Our model is primarily based on high-resolution microscopy images we took of stationary primate kidney cell line in culture infected with Sendai virus (SeV) with or without DIP. We construct a stochastic agent based model which does not rely on the continuum assumption, and retains the discrete and random nature of viral infection and decay. We explore the qualitative properties of the solutions for various values of the parameters. By comparing the output of our agent based model to PDE models, we observe that the stochastic model of plaques are growing with an accelerating speed. The mechanism by which this occurs is explored quantitatively in terms of the fractal geometry of the model plaques. The dynamic effect of DIP and the interferon response is gauged qualitatively, and it is found that DIP can delay the growth of viral plaques while interferon can slow their growth. Hence, the known biological properties of DIP could potentially explain their moderating effect on viral plaque growth.
I.1 Biological and experimental background
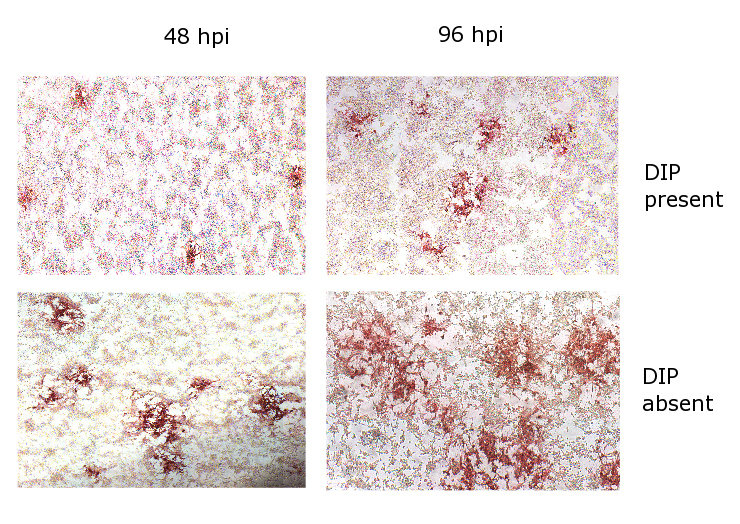
We aim to model the spread of an RNA virus, its DIP and the interferon response of the immune system, through a monolayer of living mammalian cells in a dish. As the virus spreads, a region of dead cells is formed called a plaque. Most of our results will concern the properties of these plaques. The construction of the model is based on an abstraction of the mechanisms of virus spread which we based on microscopic images we collected experimentally from stained plaques. In this experiment LLCMK2 cells were grown in Dulbecco’s modified Eagle’s medium (Gibco-BRL) supplemented with 10% fetal calf serum (FCS; Gibco-BRL), Sodium pyruvate, L glutamine and gentamicin. The cells were plated in 24 well plates. Confluent monolayers were infected with 200 infectious particles of SeV (low DIP) alone or SeV together with 2000 DIP, or mock infected. After 1h incubation at 37C the cells were overlaid with 500ul of agar melted in infection media containing 0.025 mg of trypsin (Worthington). The infected LLCMK2 cells were then fixed with 4% paraformaldehyde at 48 or 96 hrs post infection and blocked overnight at 4C with PBS/BSA 1%. Cells were then stained with a monoclonal anti-SeV NP antibody (clone 3F11) for 45 min at room temperature, washed twice with PBS/BSA 1%, and incubated with a peroxidase-conjugated secondary antibody (Jackson ImmunoResearch) for 45 min at room temperature. After washing, the staining was developed using the AEC Substrate kit according to manufacturer’s recommendations (BD Pharmingen). Picture scanning of the wells (10x) was taken using a Zeiss Axioplan2IE microscope and montage stitching done with the Metamorph software (MDS Analytical Technologies) at the MSSM-Microscope Share Resource Facility (Fig.1). This figure shows the roughly circular outlines of the monolayer of cells, where those stained red have been killed by the virus. We can immediately see from these images that DIP appear to have arrested the growth of viral plaques.
The abstraction of the mechanisms of spread of infection that we envisage is that initial infection is nucleated, being seeded by the infection of an individual cell with an individual virus particle. The virus replicates internally for some time before the cell is killed and the virus yield is released. The released viral particles then diffuse freely until they either decay or they infect a healthy neighboring cell and thereby spread the infection. This abstraction is consistent with the observation of distinct plaques of dead cells which grow by an expansion of their boundaries, which are quite sharp and irregular. A low virus yield ( particles) and significant decay rate ( ), and the discrete random nature of infection, replication and decay, suggests that stochastic effects may be significant at the intercellular scale. In this case we would not make the continuum assumption. However, the local growth of even macroscopic viral plaques is expected to be generated by the same microscopic mechanisms as the intercellular spread. We investigate the stochastic effects at the intercellular scale on the macroscopic growth of viral plaques by developing a model which incorporates them explicitly. Furthermore we examine the qualitative effects of DIP and the interferon immune response on the dynamics of viral infection in our model.
I.2 Model construction
The model is agent-based, such that the hypothesized significant biological entities are represented as agents, and the significant biological and physical mechanisms are represented as the rules of behavior of the agents. The model results in stochastic simulations of individual viral plaques in which each individual viral particle, interferon molecule and cells is retained explicitly. We begin by describing the agents, their states and their corresponding biological entities before describing the rules and the parameters.
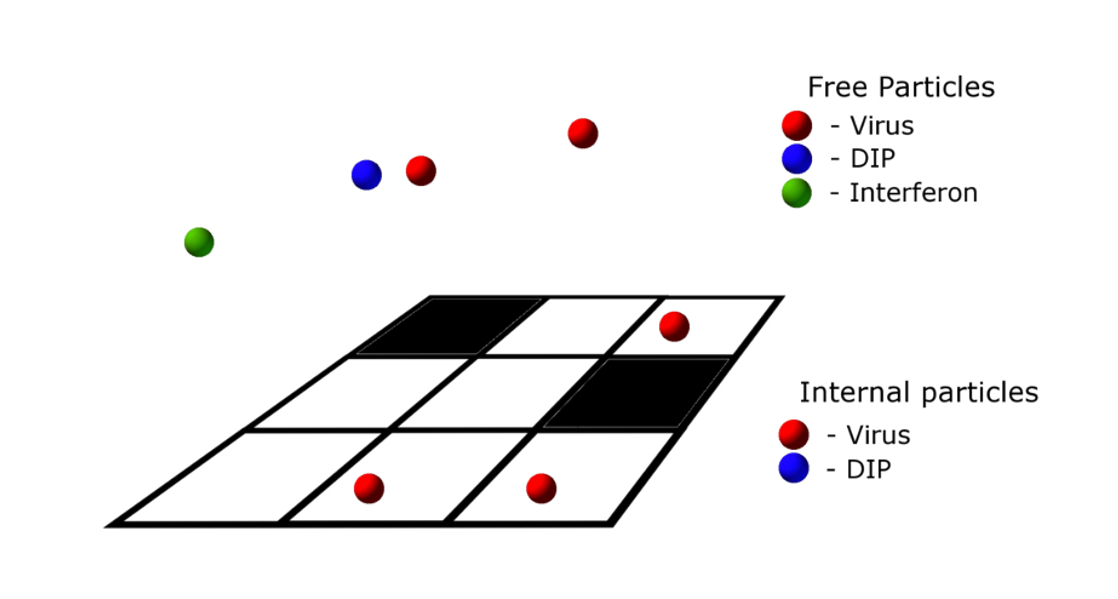
The monolayer of cells is represented by a square lattice. Each element of the lattice can be in two states corresponding to a living or dead cell. This lattice also serves as the discretization of space in which the viral particles, DIP and interferon molecules are located. The total number of each type of particle at each lattice point at each time is stored. The viral particles can be in two states, internal and external. In the external state the particles are free to diffuse on the lattice, however, internal particles correspond to those which are residing inside living cells. Agents representing interferon molecules are secreted by living cells and are never internal in the model. Figure 2 shows a schematic description of these agents.
The rules of behavior of the agents encode the following biological and physical mechanisms: diffusion, infection, decay, replication, interferon secretion and cell killing. First, diffusion is incorporated by making free agents perform a discrete random walk on the lattice, the timestep is chosen to be consistent with the prescribed diffusion coefficient. At each discrete timestep viral particles undergo an independent Bernouli trial which determines weather they decay or, if the cell at it’s current lattice position is alive, the viral particle may infect the cell and thereby become internal. The probabilities of the Bernouli trials are set to be consistent with the prescribed viral infection and decay rates. Internal viral particles replicate via a Poisson process with rates consistent with the prescribed yield and lifetime of an infected cell. The replication obeys the known logic of the interaction of virus and DIP such that (i) virus alone - replicates at rate r (ii) DIP alone - no replication (ii) virus and DIP confection - virus replicates at rate r/, DIP replicate at rate r, where . This parameter has experimental backing in from Yount et al. Yount et al. (2006). The effect of this parameter is not investigated here since it has experimental backing and exploring its effect on the model is beyond the scope of this study. Cells infected with DIP can detect these particles, and this leads to secretion of interferon molecules at a prescribed rate, treated as a free parameter. The effect of the interferon concentration is to locally reduce the probability of viral infection. We model this with a hill-function:
| (3) |
Where and are constant parameters and is the concentration of interferon. Finally, when the virus/DIP has replicated up to it’s yield, the cell dies and the internal particles become external.
The model parameters dictate the spatial dimensions of the lattice, the diffusion coefficients, and the rates of the various processes. We set the grid spacing to be equal to the approximate cell spacing in our experimental monolayer, , and the grid size to 400 cells2, so that we can investigate macroscopic plaques. A base set of parameters, shown in table 1, is chosen consistent with You and Yin YOU and YIN (1999), then perturbations around this set are made in runs of the model. The initial condition is for a single infected cell in the center of the lattice which seeds the growth of an individual plaque. The lattice has periodic boundary conditions however the model is not run for enough time for the effects of the boundary to have an effect on the results.
II Results
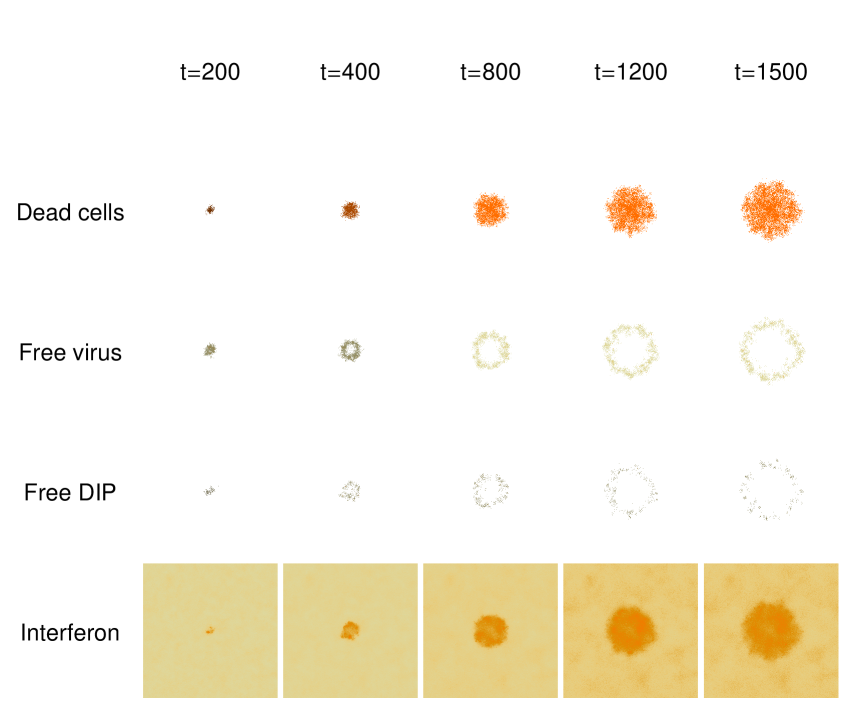
Figure 11 shows the development of an individual model plaque: the spatial distribution of the dead cells, the free virus, DIP and interferon at several times. The model plaques have a compact morphology with irregular boundaries. The free virus and DIP reside predominantly on the periphery of the plaque, and so the plaque grows by an expansion of it’s boundaries. Most previous approaches to this type of problem have been concerned with the velocity of traveling wave solutions. However, here we are concerned with the qualitative solutions to our model and their difference from traveling waves. Later we consider the qualitative effects of DIP and interferon.
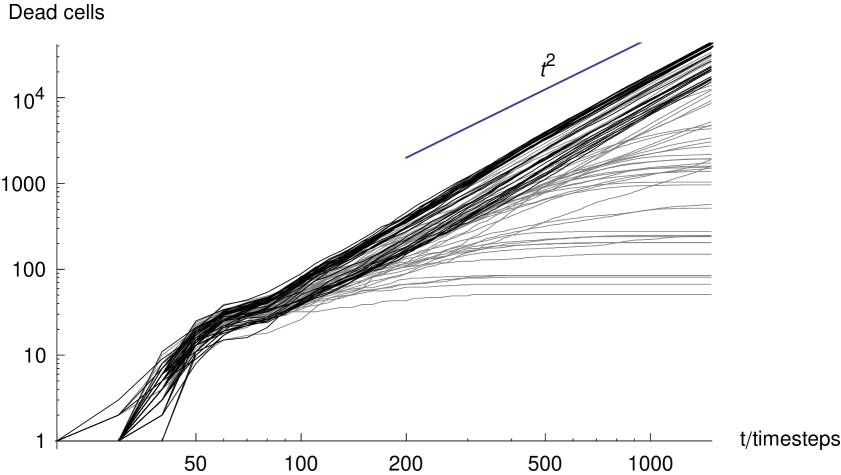
First, we examine the growth of the number of dead cells in a plaque for various parameter sets. Figure 4 shows the number of dead cells in model plaques against time, where the gray and black curves correspond to runs in which interferon was present and left out of the model respectively. We observe an initial phase of fast growth, where the plaque is cells in number. This fast growth is dominated by nucleation events. There are few killed cells in the vicinity, and hence the growth is not significantly limited by the presence of dead cells.
At later times, when the plaque is cells in number, the growth curves change to a power-law, when no-interferon is introduced in the model. Growth with a monotonically reducing exponent in the presence of interferon is observed. The line in the figure indicates the slope of a power law quadratic in time; we can see that the model plaques are growing faster than this rate. In the following section we concentrate on the power-law growth. A power-law growth is perhaps not surprising for a diffusion-limited growth such as the model we present here. However, the exponent of the power-law is of interest to us because it involves a qualitative difference to the traveling wave solutions. Subsequently we shall address the effect of the DIP and interferon on the overall behavior of the model.
II.1 Accelerating plaque growth
In the absence of interferon, the growth curves of model plaques shown in figure 4 obey a power-law with an exponent greater than which means that their mean radius accelerates their expansion. A plaque with a simple geometry growing by linear expansion, as is the case for a traveling wave, would grow as , where is time. We aim to interpret this difference in terms of the geometry of our model plaques with the aim of illuminating the importance of the microscopic stochasticity for the qualitative nature of the growth of macroscopic viral plaques. We aim to do this with a phenomenological argument.
Part of the abstraction for the mechanism of plaque growth is that the virus resides on the periphery of the plaque and the plaques grow when the infected cells on the periphery die and release viral particles to infect nearby cells. One explanation for the observed qualitative difference in the observed exponent of the plaque power-law growth is that the irregular geometry of the plaques gives them a larger perimeter for a given area and therefor more infected cells for a given number of dead cells, resulting in a greater exponent in the power-law growth.
This would rely on a fractal plaque geometry, where the fluctuations in the plaque boundary are scale-free, and increase in their range of scales as the plaque develops; in which case the plaque would have the following fractal area-perimeter (A-p) relationship:
| (4) |
where is the fractal dimension of the plaque boundary.
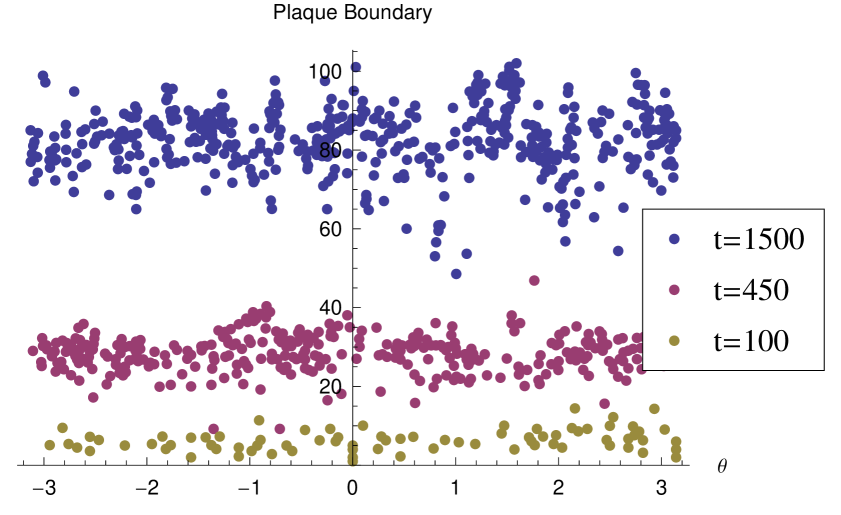
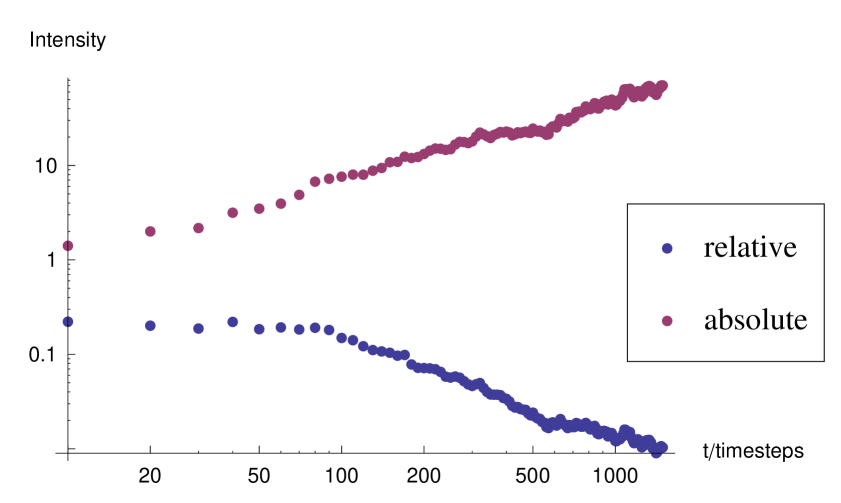
We begin by demonstrating the fractal nature of the model plaques. Figure 5 shows the area-perimeter relationship for model plaques in the absence of interferon. We see that in each case the exponent is greater than , indicating a fractal dimension of the plaque boundaries which is greater than unity. In order to further demonstrate the scaling nature of the plaque boundary fluctuations, we calculate the radial coordinates, origin at the center of the lattice, of infected cells on the boundary, and plot the radial against the angular component in a Cartesian plot 6 at three different times in the development of an individual plaque. In each case there are fluctuations at the spatial scale of the lattice spacing. However, we can see that the range of scales increases with time as the fluctuation curve extends over an ever larger range of scales. It may appear from the images of the plaques that they become more circular with time, this is because the range of fluctuations scaled with the mean radius of the plaque decays. However, the absolute scale of the fluctuations increases. This is illustrated in figure 7 which shows the root-mean-squared fluctuation intensity as a function of time for an individual representative model plaque.
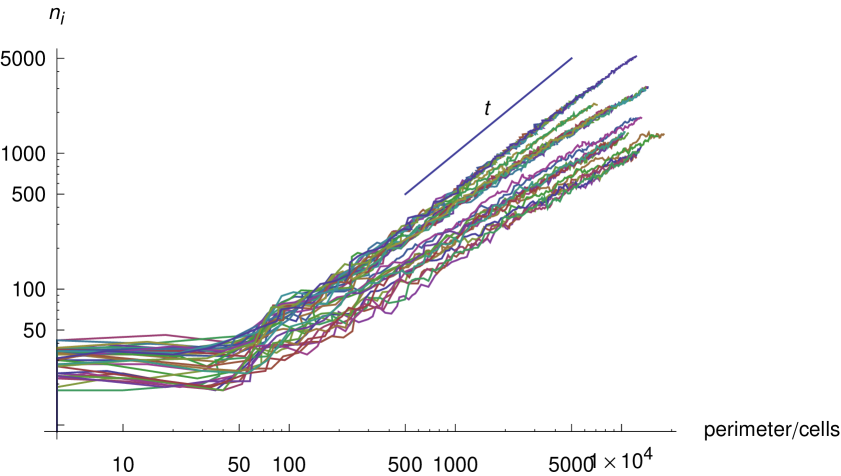
Next we consider the relationship between the number of infected cells, and the plaque perimeter . Direct proportionality is unlikely because there is a band of infected cells of finite width which follows the perimeter, so we would expect fluctuations in the perimeter of the order of this width to be smoothed out, such that
| (5) |
But because we observe this band to be thin, we may expect an exponent, , close to but smaller than unity. In figure 8 we plot the number of infected cells against the plaque perimeter for all model plaques which developed in the absence of interferon. We observe an exponent which is marginally less than unity in each case.
To test the hypothesis that the fractal geometry of our plaques contributes to their accelerating growth, we analyze the expected exponent of the growth given the fractal dimension of the plaque and the relationship between the number of infected cells and the perimeter.
If we suppose that the rate of change of the number of dead cells in a plaque, , is in proportion to the number of infected cells, , ignoring the time delay between infection and cell death,
| (6) |
and we take the relationships that follow from the fractal geometry of the plaques,
| (7) |
along with equation 4, then if we take to simply be proportional to the plaque area we can write,
| (8) |
which we can integrate to obtain,
| (9) |
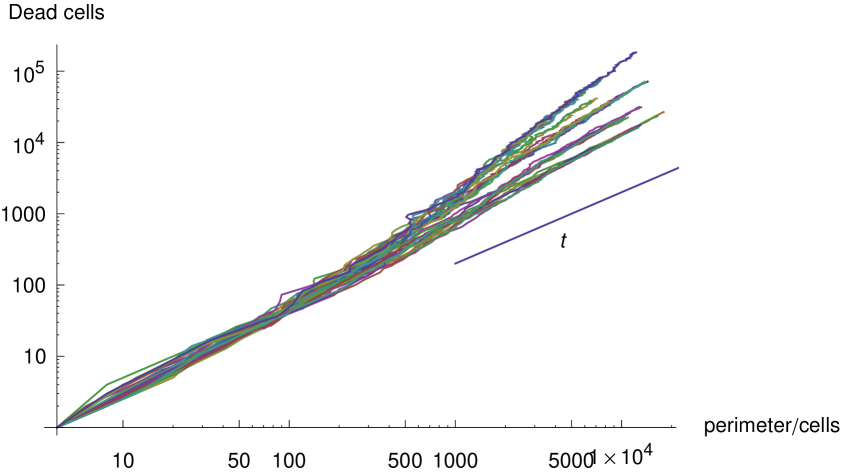
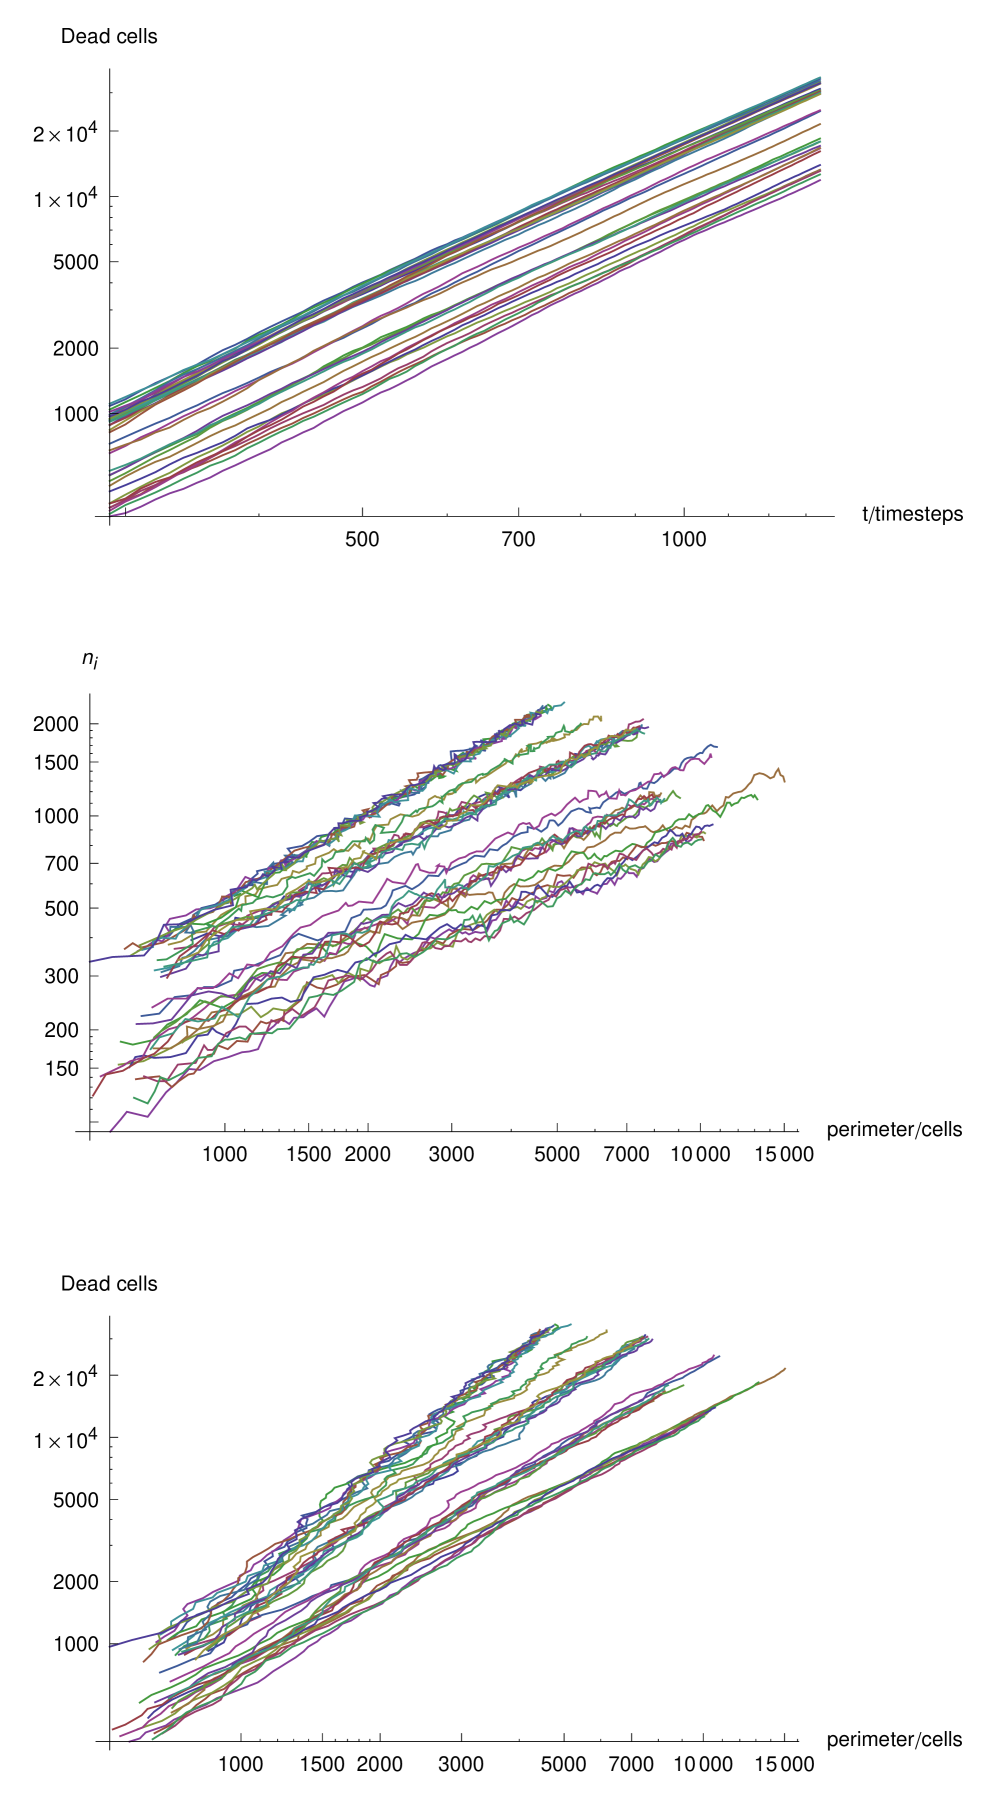
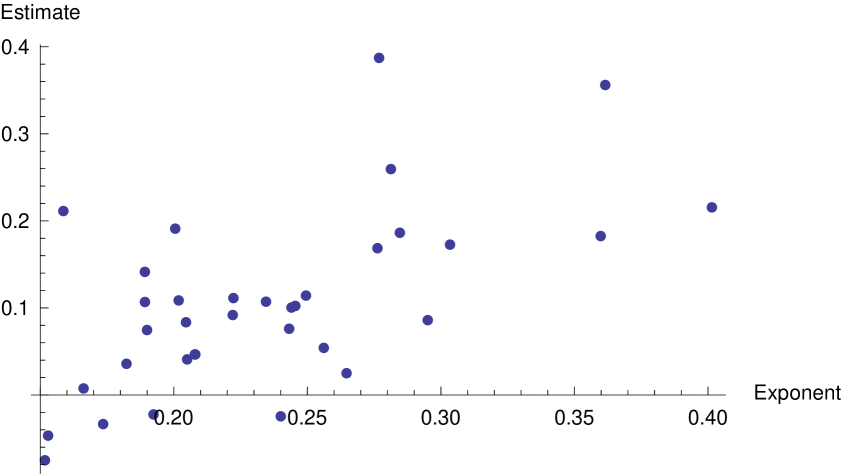
For each model plaque, in the absence of interferon, we plot the number of infected cells against the perimeter, the number of dead cells against the perimeter, and the number of dead cells against time (see supplementary figure 9) and least-squares fit to estimate the exponents and , and compare the predicted growth exponent from equation 9. This comparison is shown in figure 10, where we can see that the degree of correlation is partially limited by the errors in the estimation of the exponents and . However, it is enough to suggest that the fractal nature of the plaque geometry can at least partially account for the exponent of the plaque growth curve.
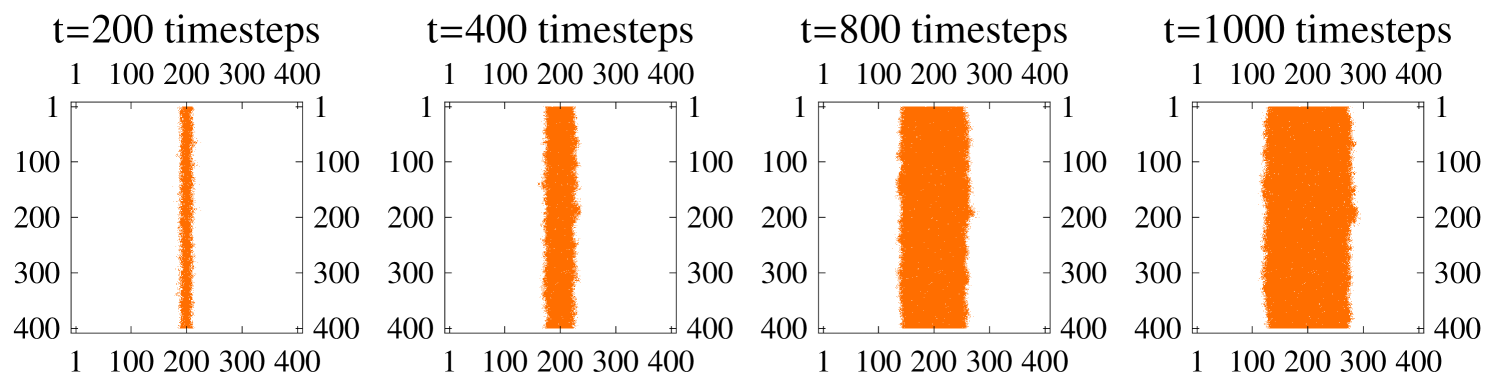
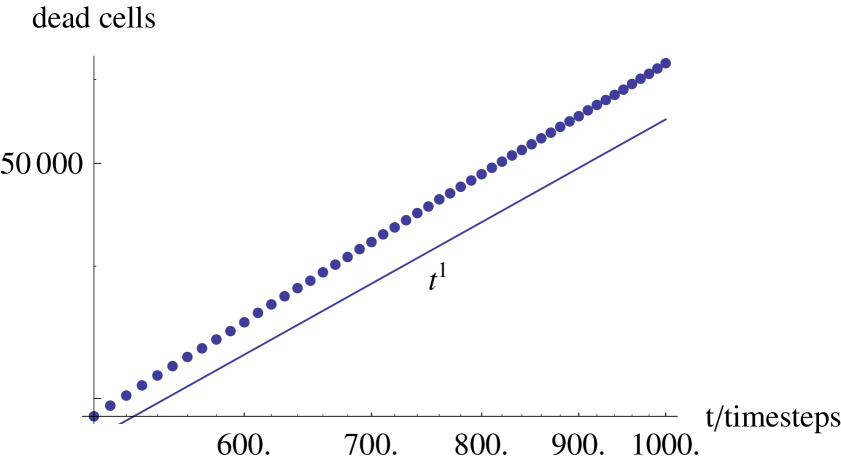
Another potential explanation for the accelerating velocity of plaque growth is mean curvature effects. As the plaque grows the curvature of the mean boundary falls - it the plaque growth velocity depended on this curvature then this could potentially account for the acceleration. To test this we ran the model with a different initial condition: a line of cells from the top of the lattice to the bottom were set to be infected intimal; the resulting plaque was a plane front which spread to the outer edges of the lattice (see figure 11). The mean plane front has constant curvature, i.e., zero. Hence, any acceleration cannot be due to curvature of the mean front. Figure 12 shows the accelerating growth of this plaque, which appears to be due to the development of fluctuations in its boundary geometry rather than the mean curvature.
III The effect of DIP and interferon
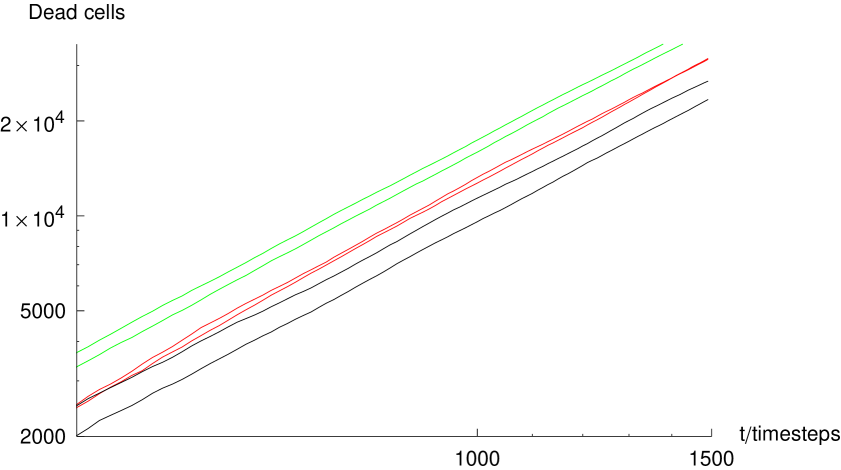
In our wet-lab experiment DIP outnumbered virus particles by about an order of magnitude in order to generate a significant effect of the infection. In the light of this, and the fact that DIP cannot replicate alone, in order to simulate the effects of DIP on an individual plaque we set the initial conditions such that the plaque develops in a randomly uniform distribution of internal DIP. In order to isolate the effect of the DIP, we examined the growth of plaques with various concentrations of DIP in the absence of interferon. Figure 13 shows the rate of growth of plaques where the same parameters are used (see supplementary figures) except , , and DIP. We observe that the strongest effect of DIP appears to be a delaying effect on the growth of the plaques such that the growth curve remains about a factor of two smaller than the .
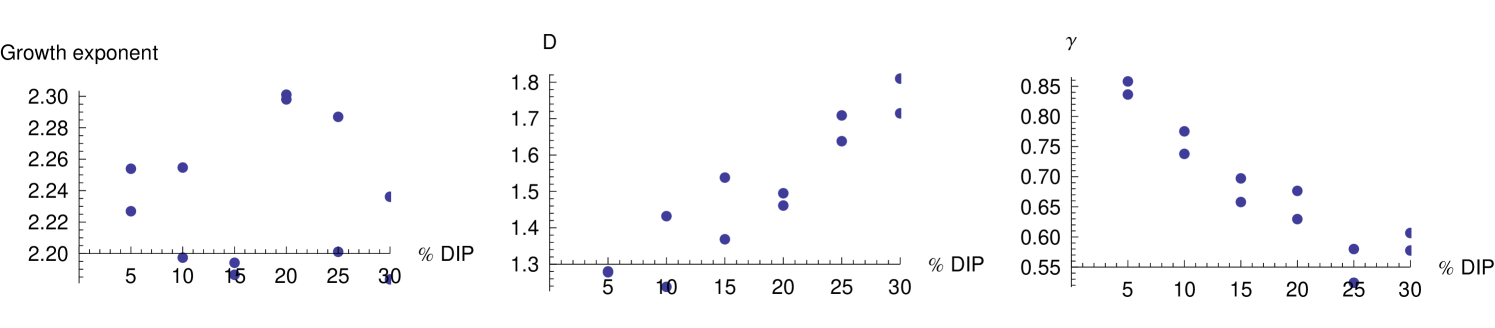
In order to further investigate the effect of DIP, we plot the effect of the concentration of DIP upon the exponent of the plaque growth curve, the fractal dimension and the exponent of the power-law relation between the number of infected cells and the perimeter (see figure 14). We see that the fractal dimension increases with DIP, and that the value of falls. These two effects approximately cancel out such that the exponent of the growth curve is not significantly affected. It appears that the presence of DIP is felt in the early development of the plaque when it is made of cells in number, at that time the delay is induced.
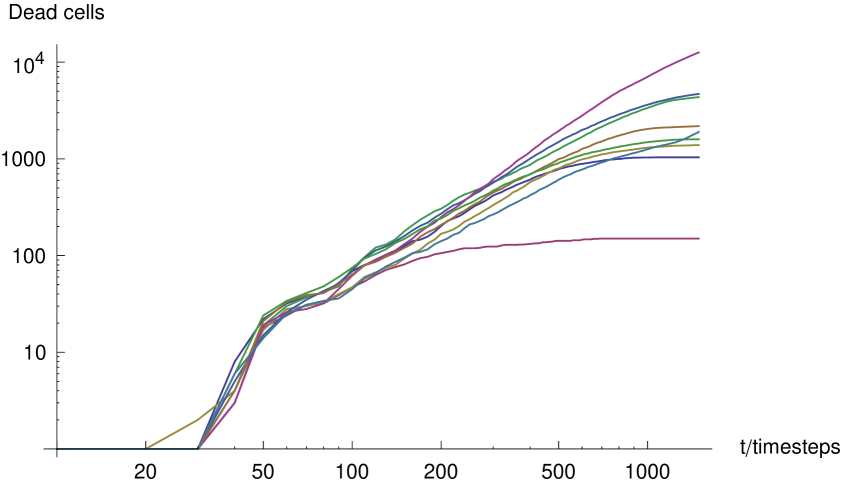
Figure 15 shows model plaques with parameters set with various interferon secretion rates, decay rates, and strengths of effect on live cell (see equation 3), while keeping all other parameters the same. The aim in varying the interferon relevant parameters was to observe the various qualitative changes to the model plaque growth curves due to the dynamic effects of interferon. Broadly speaking the interferon slows the growth of plaques from a power-law to a curve with a monotonically decreasing exponent - possibly a modified logarithmic growth. However, depending on the balance of the parameters governing the strength of the effect of interferon on neighboring cells, and the interferon decay rate, the plaques can display a bi-phasic growth curve in which the curve is initially concave but as the concentration of interferon reaches saturation, the curve can return to a power-law form.
IV Conclusions
In the construction and execution of our model we have addressed two main aims: (i) to investigate the qualitative differences in the simulated plaque growth resulting from deterministic PDE models and our discrete stochastic agent-based model; (ii) explore the qualitative dynamic effects of DIP and interferon on the growth of viral plaques.
We revealed that the agent-based model produces plaques which grow faster than quadratically in time, this in contrast to most previous work on such systems which look for traveling-wave solutions and then focus on velocities. We found that the fractal geometry of the plaques in the agent-based model can at least partly explain the difference between the exponents.
The model indicated that DIP have a delaying effect on the growth of model plaques, and that large amount of DIP relative to virus particles are required to have an appreciable effect. DIP appear hamper the growth of viral infections, as we observed that DIP arrest the growth of our experimental SeV plaques. The model results show that the impeded growth of viral plaques due to DIP can at least partly be a dynamical effect which only depends on the known biological properties of DIP. It is tempting to tentatively propose the hypothesis that DIP dynamically impede the growth of viral infection, and that this could be performing a useful function for the virus in moderating its spread so it does not kill the host before it is provided with the opportunity to jump host.
The final aim was to investigate the effects of the interferon immune response. We found a range of qualitatively different growth curves, the form of which depended critically on the parameters governing the secretion of interferon and the protective effect of interferon on uninfected cells. Broadly speaking, considering the interferon response in the model slowed down the power-law growth to one with a monotonically decreasing exponent, similar to a logarithmic growth. As such, interferon has a much more dramatic slowing effect on the growth rate of viral plaques.
Acknowledgements.
We thank Drs. Charles Peskin from NYU, Jacob Yount from the Rockefeller University, and James G. Wetmur from MSSM for useful discussions. This work was supported by NIH grants 5P50GM071558-03, 1R01DK088541-01A1, and KL2RR029885-0109.References
- Skellam (1951) J. Skellam, Biometrika 38, 196 (1951).
- Perelson (2002) A. Perelson, Nature Reviews Immunology 2, 28 (2002).
- Nelson and Perelson (1995) G. Nelson and A. Perelson, Math Biosci. 125, 127 (1995).
- Stauffer and Yin (2010) T. Stauffer and J. Yin, Virology journal 7, 257 (2010).
- Frank (2000) S. Frank, Journal of Theoretical Biology 206, 279 (2000).
- Yin and McCaskill (1992) J. Yin and J. McCaskill, Biophysical journal 61, 1540 (1992).
- YOU and YIN (1999) L. YOU and J. YIN, Journal of theoretical biology 200, 365 (1999).
- Haseltine et al. (2008) E. Haseltine, V. Lam, J. Yin, and J. Rawlings, Bulletin of Mathematical Biology 70, 1730 (2008).
- Amor and Fort (2010) D. Amor and J. Fort, Physical Review E 82, 061905 (2010).
- VON MAGNUS (1954) P. VON MAGNUS, Adv Virus Res. 2, 59 (1954).
- Paucker and Henle (1958) K. Paucker and W. Henle, Virology 6, 198 (1958).
- Clark et al. (1981) H. Clark, N. Parks, and W. Wunner, J Gen Virol 52, 245 (1981).
- Kolakofsky (1976) D. Kolakofsky, Cell 8, 547 (1976).
- Cole et al. (1971) C. Cole, D. Smoler, E. Wimmer, and D. Baltimore, J. Virol 7, 478 (1971).
- Shenk and Stollar (1973) T. Shenk and V. Stollar, Virology 53, 162 (1973).
- Schubert et al. (1978) M. Schubert, J. Keene, R. Lazzarini, and S. Emerson, Cell 15, 103 (1978).
- Hall et al. (1974) W. Hall, S. Martin, and E. Gould, Med Microbiol Immunol. 160, 155 (1974).
- Rima et al. (1977) B. Rima, W. Davidson, and S. Martin, J Gen Virol 35, 89 (1977).
- Yount et al. (2006) J. Yount, T. Kraus, C. Horvath, T. Moran, and C. Lopez, J Immunol 177, 4503 (2006).
- Marcus and Sekellick (1977) P. Marcus and M. Sekellick, Nature 266, 815 (1977).
- Lopez et al. (2006) C. Lopez, J. Yount, T. Hermesh, and T. Moran, J. Virol. 80, 4538 (2006).
| Parameter | Symbol | Value |
|---|---|---|
| Virus infection rate | ||
| DIP infection rate | ||
| Infected cell death rate | ||
| Virus decay rate | ||
| DIP decay rate | ||
| Interferon decay rate | ||
| Diffusion coefficient | ||
| lattice spacing | ||
| timestep | ||
| Lifetime of infected cell | ||
| Yield | 50 virus copies | |
| rate of virus replication | ||
| rate of virus replication | ||
| rate of interferon sectretion | S | rate of virus replication |
| Strength of interferon | 0.05 |